
Due to its potential to confound the interpretation of BOLD fMRI studies and its significance for the understanding of the biophysical mechanism of BOLD, the effect of the baseline on the activation-induced BOLD response has attracted renewed interest. For small perturbations from rest, published data have supported an additive BOLD signal model, with constant percent changes in BOLD signal irrespective of the resting CBF1, 2. We investigated the effect of pronounced CO2 induced dilation on both BOLD and CBF responses to functional activation. A 1×1×1 mm3 3D T1-weighted GRE sequence (TR/TE of 22/10 ms) was followed by interleaved 6-slice PASL and T2-weighted GRE sequences (4×4×5 mm3; TR: 1.5 s, TE: 22/50 ms for CBF/BOLD) on a 1.5 T Siemens Sonata. Twelve volunteers (7F, 5 M; 27±1 yrs) performed bilateral finger tapping at low (1.5 Hz) or high (3 Hz) frequency while presented with a radial yellow/blue checkerboard at low (50%) or high (100%) contrast alternating with rest and uniform grey baseline in 0.5/1.5/1 min off/on/off blocks. Three levels of hypercapnia were induced by administering mixtures of CO2 and air, with the inspired CO2 of 5, 7.5 or 10% in 1/3/2 min blocks. Two functional blocks (low/high in randomized order) preceded each hypercapnia block; with another “high” functional block applied during either first or second half of the hypercapnic period. A reference grey matter region (GRONI) not participating in either motor or visual processing was used to correct the activation induced changes during hypercapnia periods for temporal instability in the hypercapnia induced responses. A typical set of BOLD and CBF time courses, in MC ROI, VC ROI, and GRONI, is shown in Fig. 1a and b. When controlling for inter-subject variability, the effect of hypercapnia on the activation-induced response was significant for both BOLD (p<10-6) and CBF (p<10-4). The linear fits to activation-induced responses as a function of hypercapnia-induced changes are shown in Fig. 2. In view of the slope estimates (−0.32±0.01 %/% for BOLD MC, VC; −0.18±0.02 %/% for CBF MC and −0.13±0.01 %/% for CBF VC), only the effect of hypercapnia on BOLD bears practical significance on this range of basal vasodilation. We observed a significant drop of activation-induced BOLD response magnitude with increasing basal flow levels, in accordance with the BOLD response models, whereby a significant drop in the basal deoxyhemoglobin concentration decreases its sensitivity to CBF increases. A very limited effect of the basal vasodilation on the relative CBF response is consistent with the existing literature 3 and testifies to the nature of CBF regulation following functional activation. These findings characterize the behavior of BOLD response for significantly elevated basal flow and describe the non-linear regime of the deoxyhemoglobin dilution model.
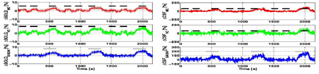
Time course of BOLD (left) and CBF (right) in MC (red), VC (green), and GRONI (blue).
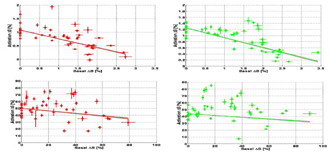
The activation induced responses (MC: red, VC: green) vs. hypercapnis induced signal changes for BOLD (top) and CBF (bottom).