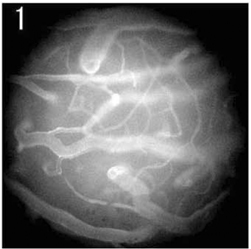
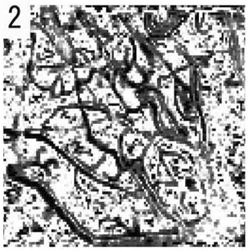
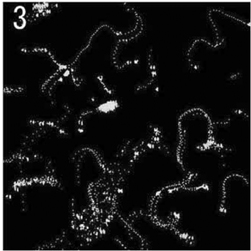
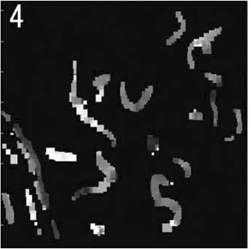
We present a new high-speed (125–500 frames per sec) confocal fluorescence microscopy and image analysis system employing Matlab and our own KEIO-IS1 and KEIO-IS2 software to visualize plasma flow and RBC tracking in single capillaries in the living rat cerebral cortex. Wistar rats with a cranial window were given fluorescein isothiocyanate (FITC)-dextran and FITC-labeled red blood cells (RBC) intravenously as a bolus to visualize single capillaries and RBC in the capillaries (Seylaz et al., JCBFM 19:863, 1999). FITC-Dextran was also used to measure local plasma flow changes along single capillaries by applying the hemodilution principle in individual pixels. Reciprocal mean transit times calculated with KEIO-IS1 were displayed on a 2-D flow map as reported previously (Am J Physiol 279, H1291, 2000). After the microvessels were vitally stained, FITC-RBCs were injected. The bright RBCs were observable flowing through single capillaries over a dark background. A video clip at a speed of 250–500 frames per sec was taken for a 10 sec interval, and analyzed with KEIO-IS2 to document tracking of all RBCs, which were individually numbered, and to calculate automatically individual RBC velocities on a spreadsheet (Excel). The software further created a map of neighboring trains of peaks due to RBC passage in all pixels. Fig. 1 shows a microphotograph taken with a digital camera of intraparenchymal microvessels, including capillaries, which are vitally stained with FITC-dextran. Fig. 2 shows the microvascular network in situ, constructed by connecting pixels showing passage of RBC spike trains along the time axis, using KEIO-IS1 (correlation coefficient, 0.8). Fig. 3 presents total RBCs (small dots) tracked at a depth of 60 μm below the pia by the video at 250 frames per sec for 10 sec. RBCs are automatically numbered (KEIO-IS2) and their velocities are calculated and expressed on a 2-D velocity map (Fig. 4). Heterogeneous optical density implies variation in RBC velocity even in straight capillaries. Single, double, and multiple tracking of RBCs can be seen, suggesting independent periodic passage of RBCs. Some capillaries show a swinging movement due probably to vasomotion occurring within 10 sec. Preliminary data based on 26 rats show spatial and temporal heterogeneity of plasma flow along single capillaries and its change with time, together with capillary vasomotion seen as local winding and translocation. RBC tracking was not parallel to the plasma flow. The plasma flow was present (slow or fast) continuously, while RBC passage was periodic (RBC recruitment). The possible regulation of RBC flow in response to neuronal activity remains to be studied.