
Abstract
Cerebral blood flow (CBF) during dynamic exercise has never been examined quantitatively using positron emission tomography (PET). This study investigated changes in CBF that occur over the course of a moderate, steady-state cycling exercise. Global and regional CBF (gCBF and rCBF, respectively) were measured using oxygen-15-labeled water (H215O) and PET in 10 healthy human subjects at rest (Rest), at the onset of exercise (Ex1) and at a later phase in the exercise (Ex2). At Ex1, gCBF was significantly (
INTRODUCTION
Up to now, the mechanisms regulating cerebral blood flow (CBF) during exercise have been examined only in the context of the physiologic factors affecting cardiovascular control.1, 2, 3 It has been shown, for example, that CBF increases by ∼25% during moderate cycling exercise to volitional exhaustion, as compared with rest, unless there is a fall in the arterial CO2 (PaCO2) tension.4, 5, 6 Moreover, in these investigations, CBF was analyzed using transcranial Doppler ultrasound, mainly to detect the mean blood velocity in the middle cerebral artery. Consequently, neither the gCBF nor specific rCBFs were identified.
There have been several studies in which imaging using positron emission tomography (PET) or single-photon emission computed tomography (SPECT) was used to visualize changes in rCBF during moderate cycling exercise.7, 8, 9 For this purpose, not only does PET enable quantitative analysis of gCBF, its spatial resolution also enables analysis of rCBF in discrete regions. Furthermore, it is widely believed that certain specific brain regions are involved in regulating the cardiovascular response to dynamic exercise; this has been termed ‘the central command theory’. 10 For example, previous studies using PET or SPECT demonstrated that changes in rCBF in the insular cortex and anterior cingulate gyrus are associated with central command and are mainly related to autonomic adjustments during exercise.8, 9, 11, 12 With that in mind, we hypothesized that these regions might serve as the higher brain areas involved in autonomic adaptation during exercise. This regulatory system appears to be required specifically during the transient phase between rest and exercise, before the cardiovascular response reaches a state of equilibrium.
When moderate exercise continues at a constant workload, the cardiovascular response reaches a steady state in which the kinetics of pulmonary oxygen consumption (
MATERIALS AND METHODS
Subjects
Ten young male volunteers (22.7±1.9 years; mean height, 1.75±0.05 m; mean body mass, 65.9±9.8 kg) participated in the study. Each subject provided a detailed medical history to ensure that he was in good health and not taking any medication, and all of the subjects were found to be anatomically normal on magnetic resonance imaging (MRI), as described below. The subjects were instructed to live and eat as normally as possible, but to avoid rigorous exercise, alcohol, and drugs during the 24 hours preceding the experiments. All of the participants provided informed consent before entering in the study. The study protocol was governed by the guidelines of national government based on the Helsinki Declaration revised in 1983, and it was approved by the Ethics Committee of Tokyo Metropolitan Institute of Gerontology and was conducted at the Tokyo Metropolitan Institute of Gerontology.
Study Design and Monitoring
The study protocol is illustrated in Figure 1. Before the scan, subjects were trained in the experimental procedures, especially cycling on a supine ergometer (Load, Groningen, the Netherlands). A week before the main study, the exercise intensity needed to drive the heart rate (HR) to 50% to 60% of the estimated maximum during the plateau phase of the exercise was determined for each subject. Maximum HR was estimated by subtracting the subject's age from 220. At this exercise intensity, the subjects were able to pedal without apparent movement of the head during the main experiment.
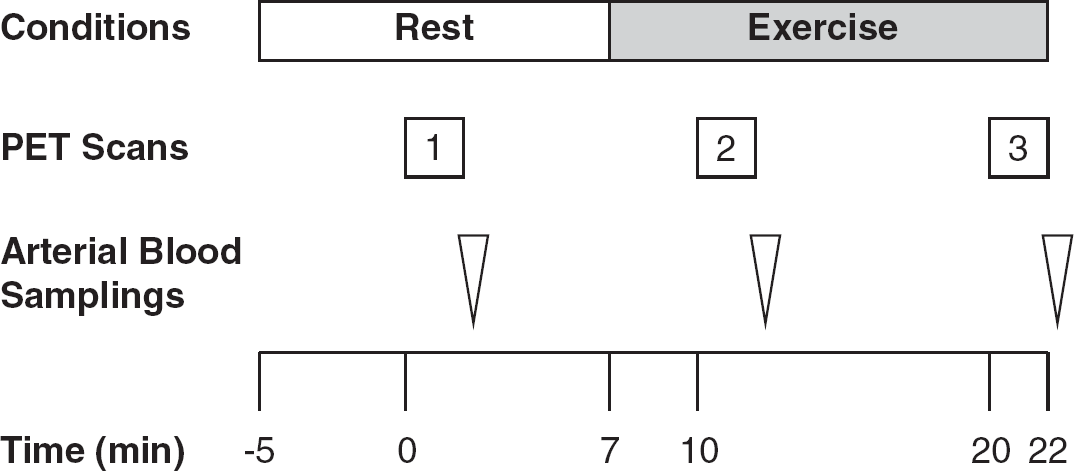
Diagram of the experimental protocol used for acquisition of oxygen-15-labeled water (H215O) positron emission tomography (PET) and arterial blood samples. Injection time of H215O for the first PET scan was defined as Time 0.
Subjects were placed on the scanner bed in the supine position with their heads immobilized in a customized head holder. Ambient noise was kept to a minimum, and the subjects kept their eyes open during all scans. Before the scans, a catheter was placed in the left radial artery to measure arterial time–activity curves as well as PaCO2. For injection of H215O, a cannula was placed in the right cubital vein. The first PET scan (baseline measurements) was performed while the subjects were breathing room air at Rest. A cycling exercise at a constant workload was initiated 7 minutes later, and the second and third scans were performed 3 minutes (Ex1) and 13 minutes (Ex2) after the onset of the exercise. The interscan intervals were thus 10 minutes. The exercise was performed on the scanner bed using a supine positioned cycle ergometer. Each subject was instructed to pedal at a constant rate of 60 r.p.m. at the predetermined workload. Exercise was continued at a constant workload for 15 minutes.
An online gas analyzer (Cosmed, Rome, Italy) was used to measure
Image Sequence
The scans were performed using a SET2400W PET scanner (Shimadzu, Kyoto, Japan) operating in three-dimensional mode and producing 63 image slices with an interslice interval of 3.125 mm. The intrinsic spatial resolution was 4.4 mm in-plane and 6.4 mm full width at half-maximum axially. The data were reconstructed using a Butterworth filter (cut-off frequency, 1.25 cycles/cm; order, 2) with standard correction for attenuation and scatter. Before H215O administration, a 6-minute transmission scan was acquired using 68Ga/68Ge rotating rod sources for estimation of attenuation correction. Thereafter, 300 MBq H215O was intravenously injected into each subject as a bolus (over<5 seconds), and an accumulated image was acquired for a total of 2 minutes after injection. At the same time as the PET emission data were being acquired, arterial blood was being continuously drawn, and the radioactivity level was monitored using a beta detector equipped with a plastic scintillator (Shimadzu, Kyoto, Japan). These data were then used in an input function to compute the CBF after correction for delay and dispersion. With the accumulated image and the measured arterial input function, the rCBF was calculated on a pixel-by-pixel basis using the autoradiographic method.14, 15 The 10-minute intervals between H215O injections were sufficient for decay of the radioactivity.
For anatomic reference, individual brain MRI scans were acquired on a separate occasion using a 1.5 Tesla Signa Excite HD scanner (General Electric, Milwaukee, WI, USA). Sagittal images were obtained with T1-weighted contrast (3DSPGR; TR=9.2 milliseconds, TE=2.0 milliseconds, matrix size=256 × 256 × 124, voxel size=0.94 × 0.94 × 1.3 mm) and T2-weighted contrast (first spin echo; TR=3000 milliseconds, TE=100 milliseconds, matrix size=256 × 256 × 20, voxel size=0.7 × 0.7 × 6.5 mm).
Image Processing and Analysis
The image data were analyzed using Statistical Parametric Mapping (SPM 8, Welcome Department, London, UK) software and Matlab 7.0 (MathWorks, Natick, MA, USA). Sequential PET images acquired during the activation in each subject were realigned, and the mean realigned image was co-registered to individual MRIs and then projected into a standard three-dimensional stereotactic space using the SPM 8 and the MNI (Montreal Neurological Institute) templates, sampled at a voxel size of 2 × 2 × 2 mm. And for the quantitative analysis of rCBF described below, individual MRIs were spatially normalized so that they would have the same anatomic space as the PET images. The spatially normalized images of all subjects were smoothed using an isotropic Gaussian filter (full-width half-maximum 12 mm).
Voxel-based SPM analyses were performed without global normalization—i.e., using absolute rCBF values. Data were analyzed using two statistical models. A design matrix of subject-by-task interactions was constructed to test exercise-induced changes in rCBF between conditions: Rest versus Ex1 and Rest versus Ex2 (paired
The quantitative analysis of rCBF was performed using Dr View software (Infocom, Tokyo, Japan) based on the results from the SPM analysis. We then distributed circular regions of interest (ROIs; 10 mm in diameter) in areas where rCBF was significantly higher at Ex1 than at Rest. In addition, ROIs were selected within the right and left insular cortex, because earlier studies identified a lateralized functionality related to autonomic control within the insular cortices.8, 16, 17The ROIs were drawn on an averaged MRI from the each subject's PET–MRI co-registered and normalized image, which was then resliced into 5-mm thicknesses (Figure 2). To determine rCBF, the normalized PET images were co-registered to the 5-mm-thick averaged MRI, and the average rCBF values within the individual ROIs were calculated from the corresponding 5-mm-thick PET images using Dr View software. Furthermore, gCBF was defined using the segmentation strategy included in Dr View software using a threshold derived from the bitmap.
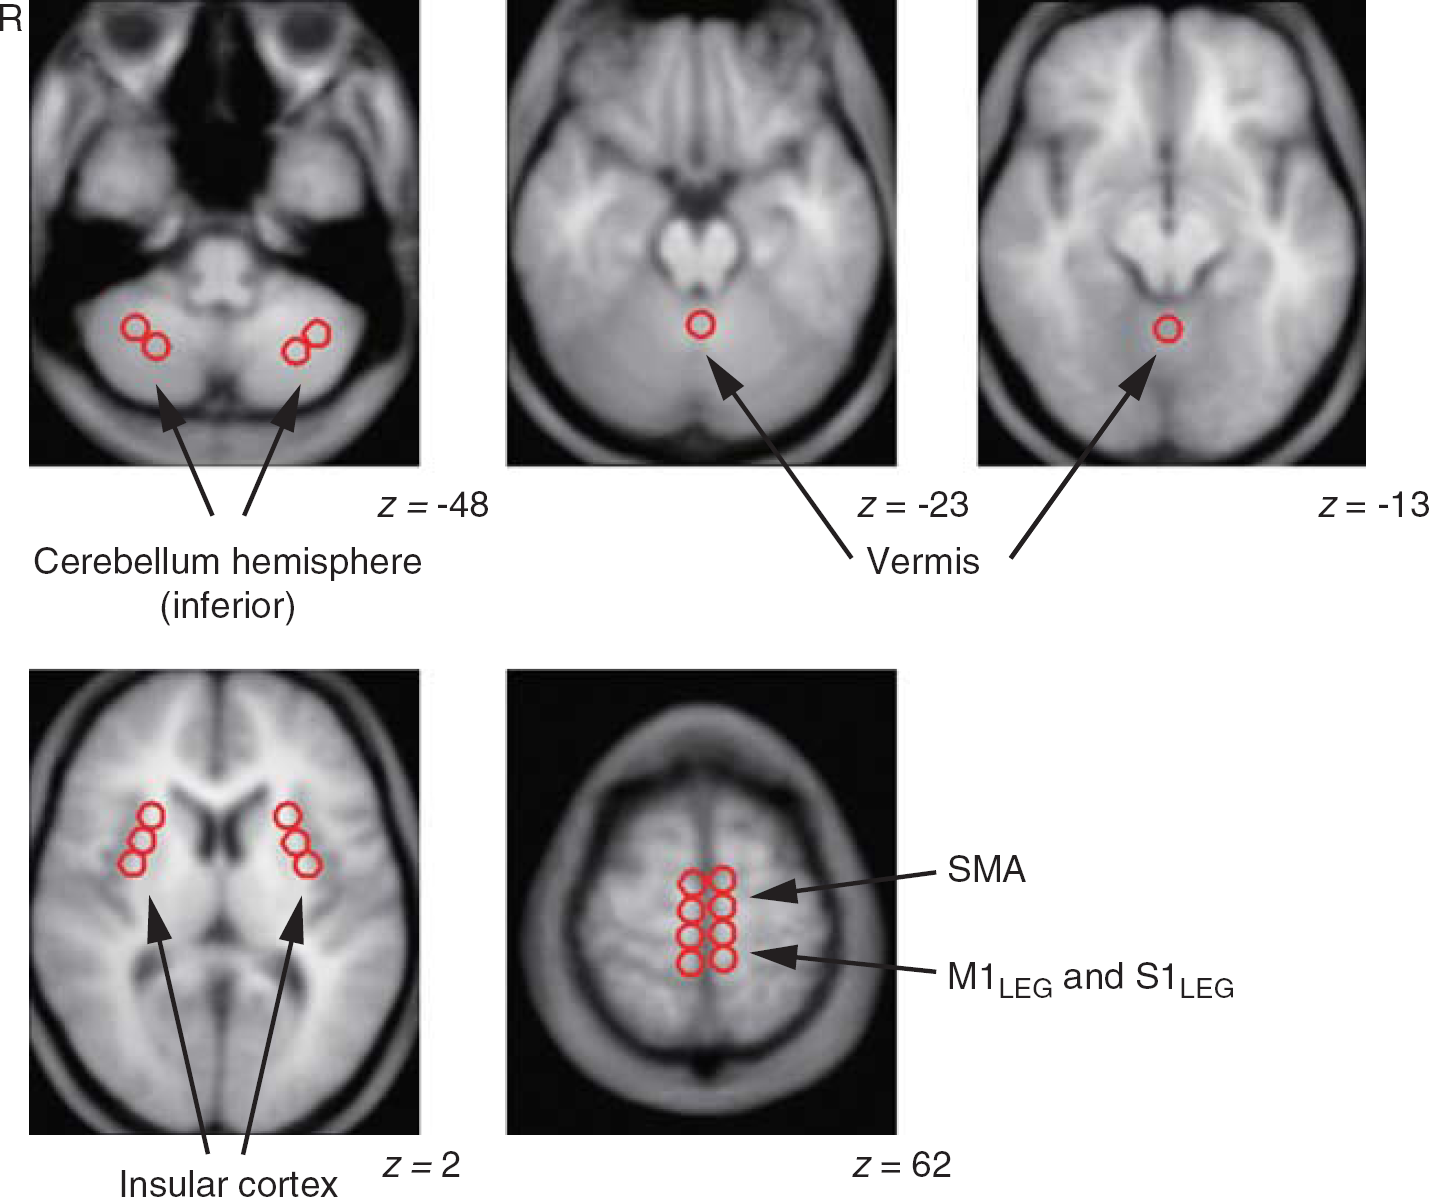
Representative images showing distributed regions of interest. Multiple circular areas, 10 mm in diameter, were placed on the magnetic resonance imaging (MRI) averaged from 10 images from each subject's co-registered positron emission tomography–MRI image, which was resliced at a thickness of 5 mm. The Montreal Neurological Institute coordinate in the
Values are expressed as means±s.d. (
RESULTS
Physiologic Data Analysis
During the cycle ergometer exercise, the average workload was 71±11 watts. The time course of the changes in physiologic parameters is shown in Figure 3A. None of the parameters changed significantly during the 2-minute periods required for each PET scan (repeated measures one-way analysis of variance). With the exception of MBP, which was consistently measured at 86 to 87 mm Hg, all of the parameter values measured at Ex1 and Ex2 differed significantly from those at Rest (Table 1). Because we used a steady-state exercise model, there were no differences between HR and
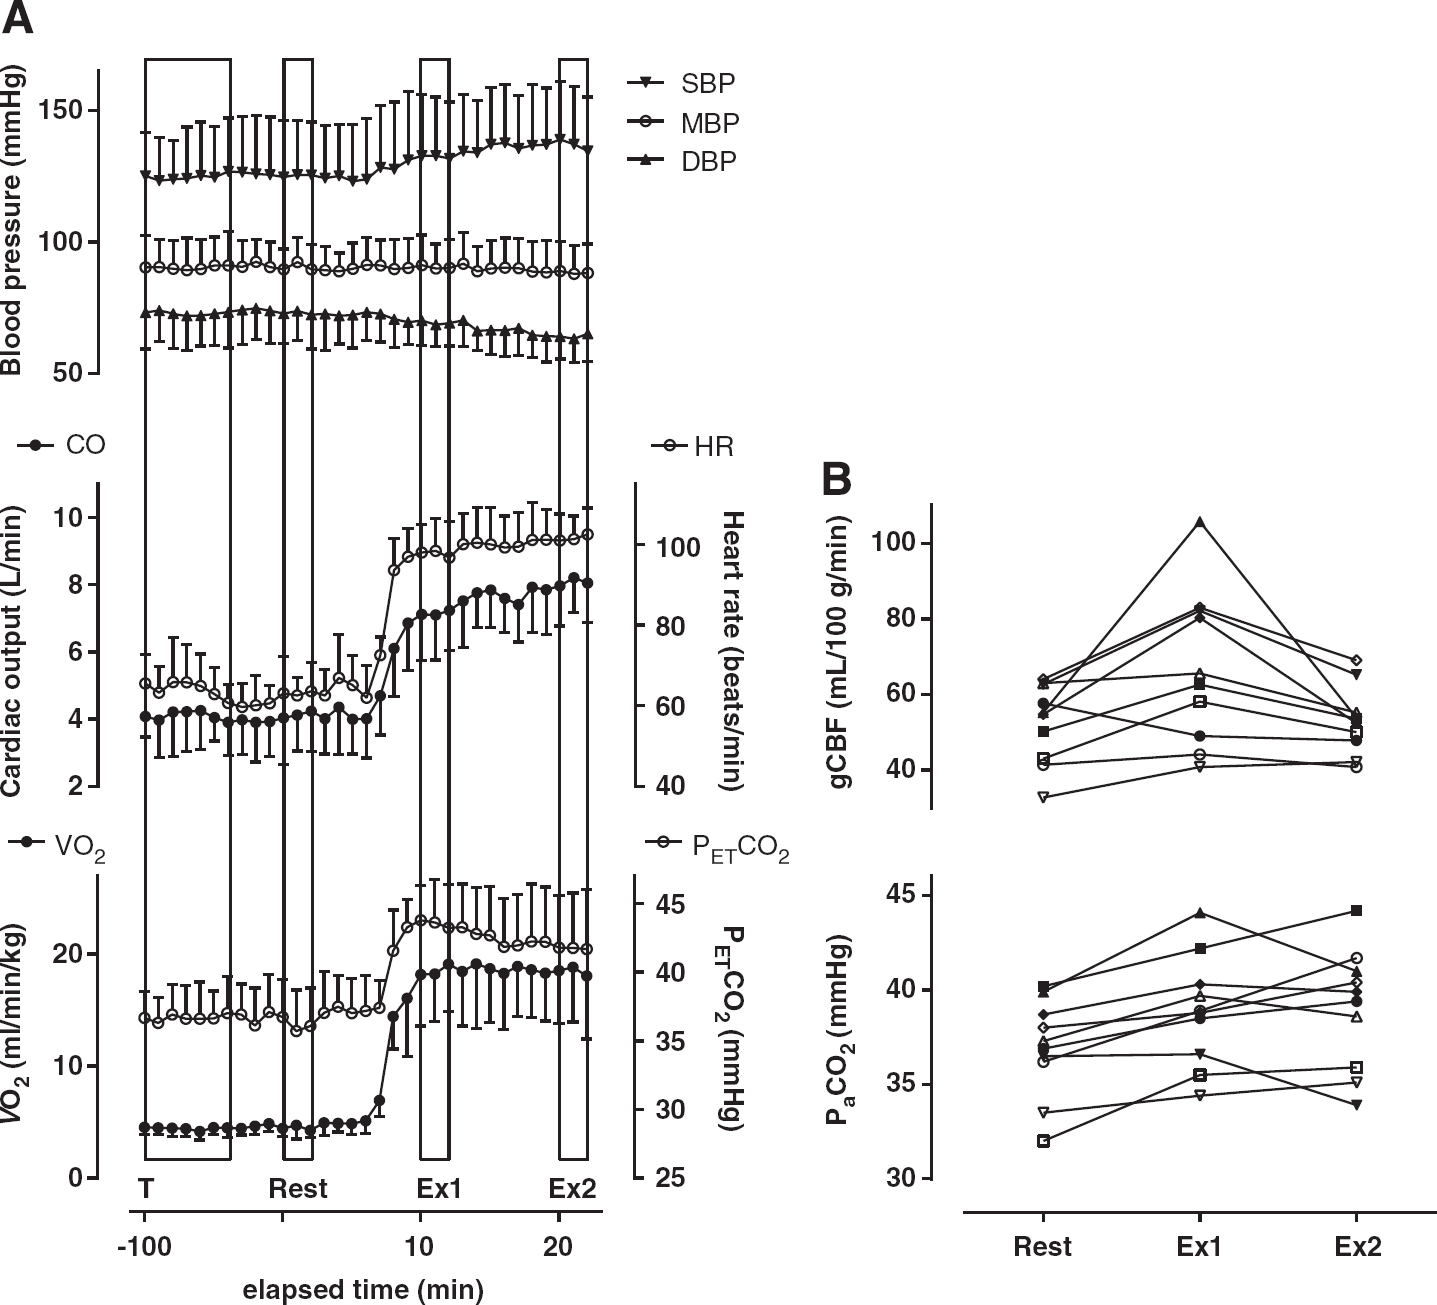
Changes in the indicated physiologic parameters and quantitative gCBF during moderate, steady-state cycling exercise. (
Physiologic parameters measured at Rest and during exercise
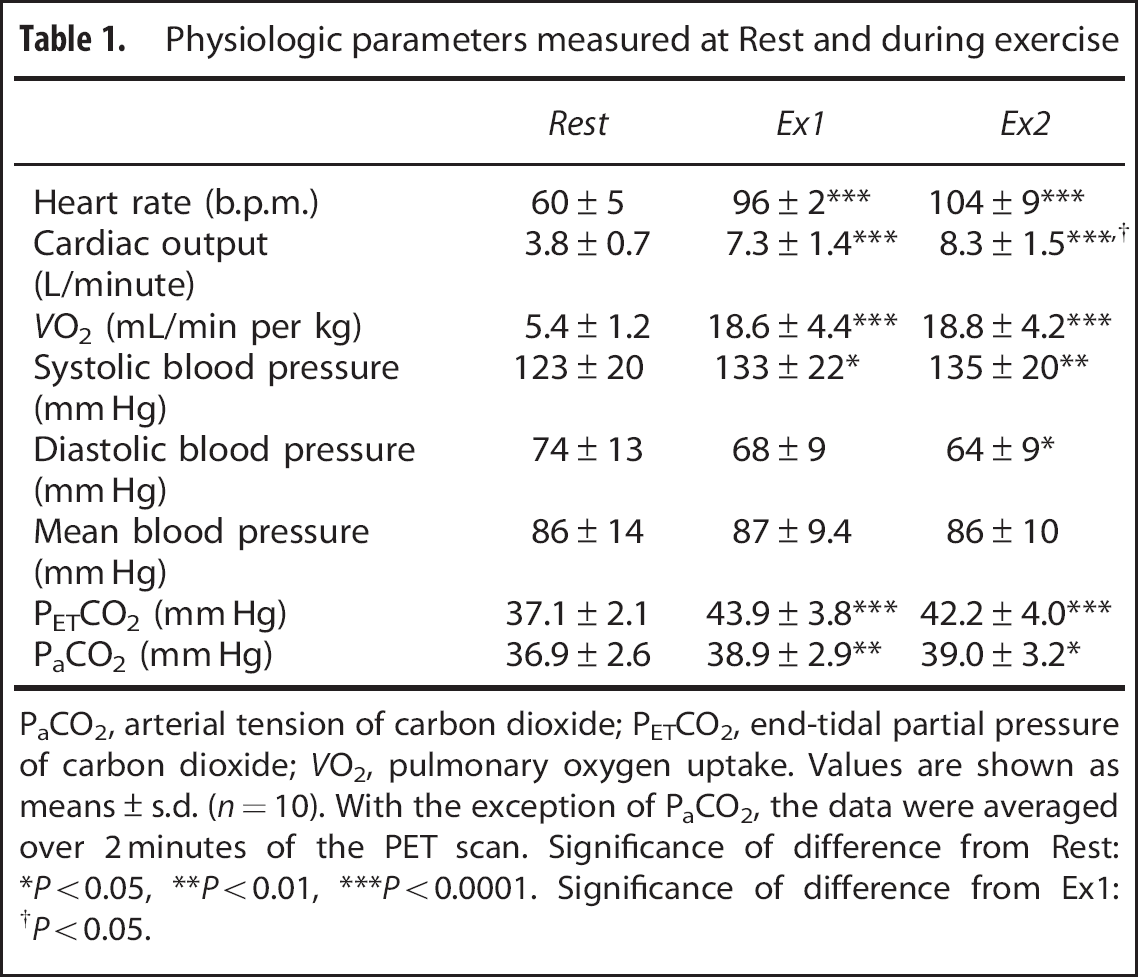
PaCO2, arterial tension of carbon dioxide; PETCO2, end-tidal partial pressure of carbon dioxide;
Values are shown as means±s.d. (
With the exception of PaCO2, the data were averaged over 2 minutes of the PET scan. Significance of difference from Rest: ∗
Statistical Parametric Mapping Analysis
As shown in Table 2 and Figure 4, rCBF was higher in the cerebellar vermis and sensorimotor cortex for the bilateral legs (M1Leg and S1Leg) at Ex1 (
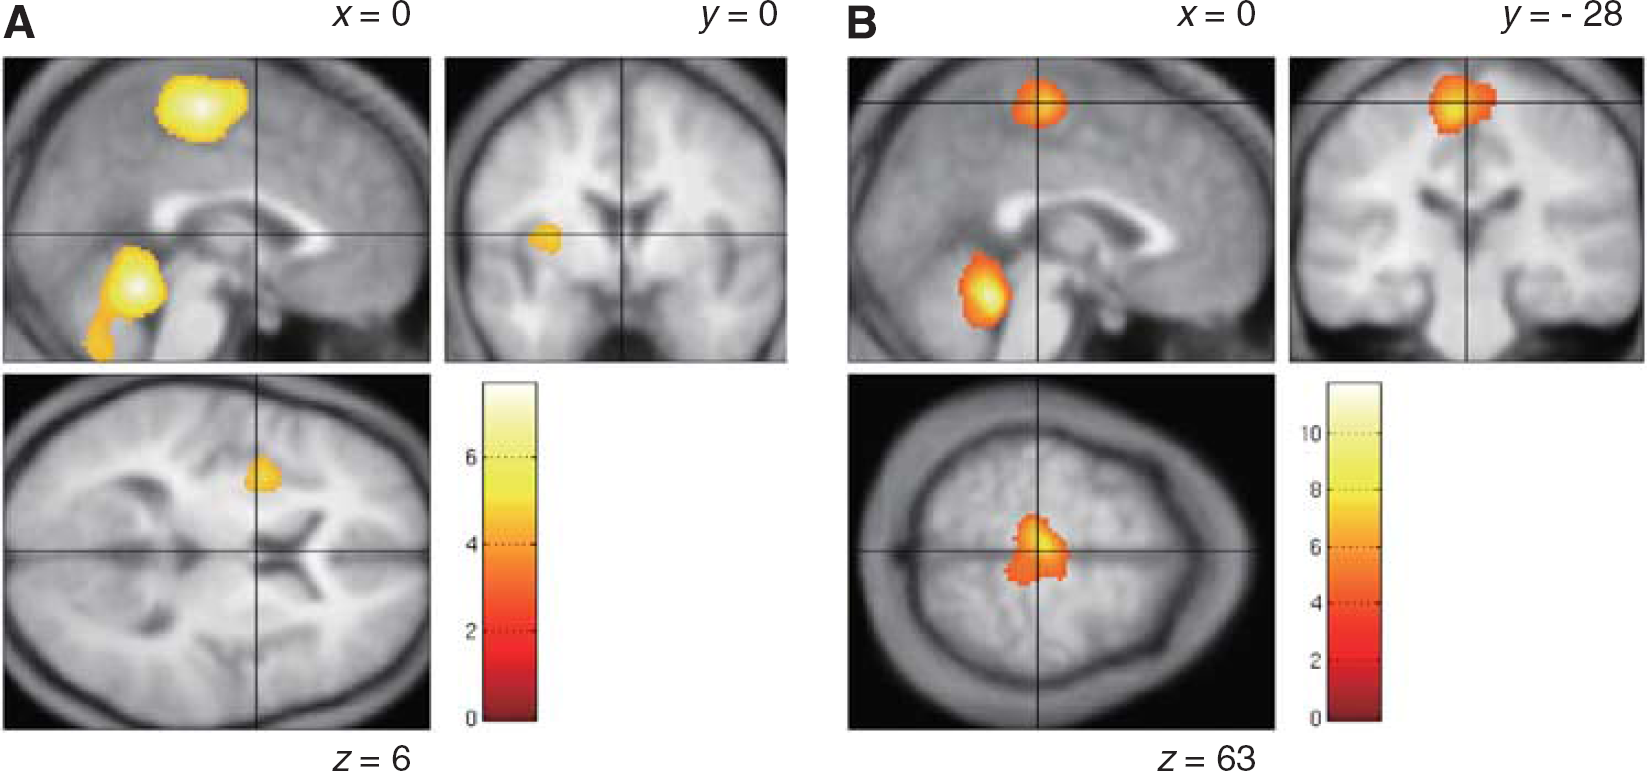
Brain regions showing higher regional cerebral blood flow at Ex1 (
Brain regions showing significantly higher rCBF at Ex1 and Ex2 than at Rest
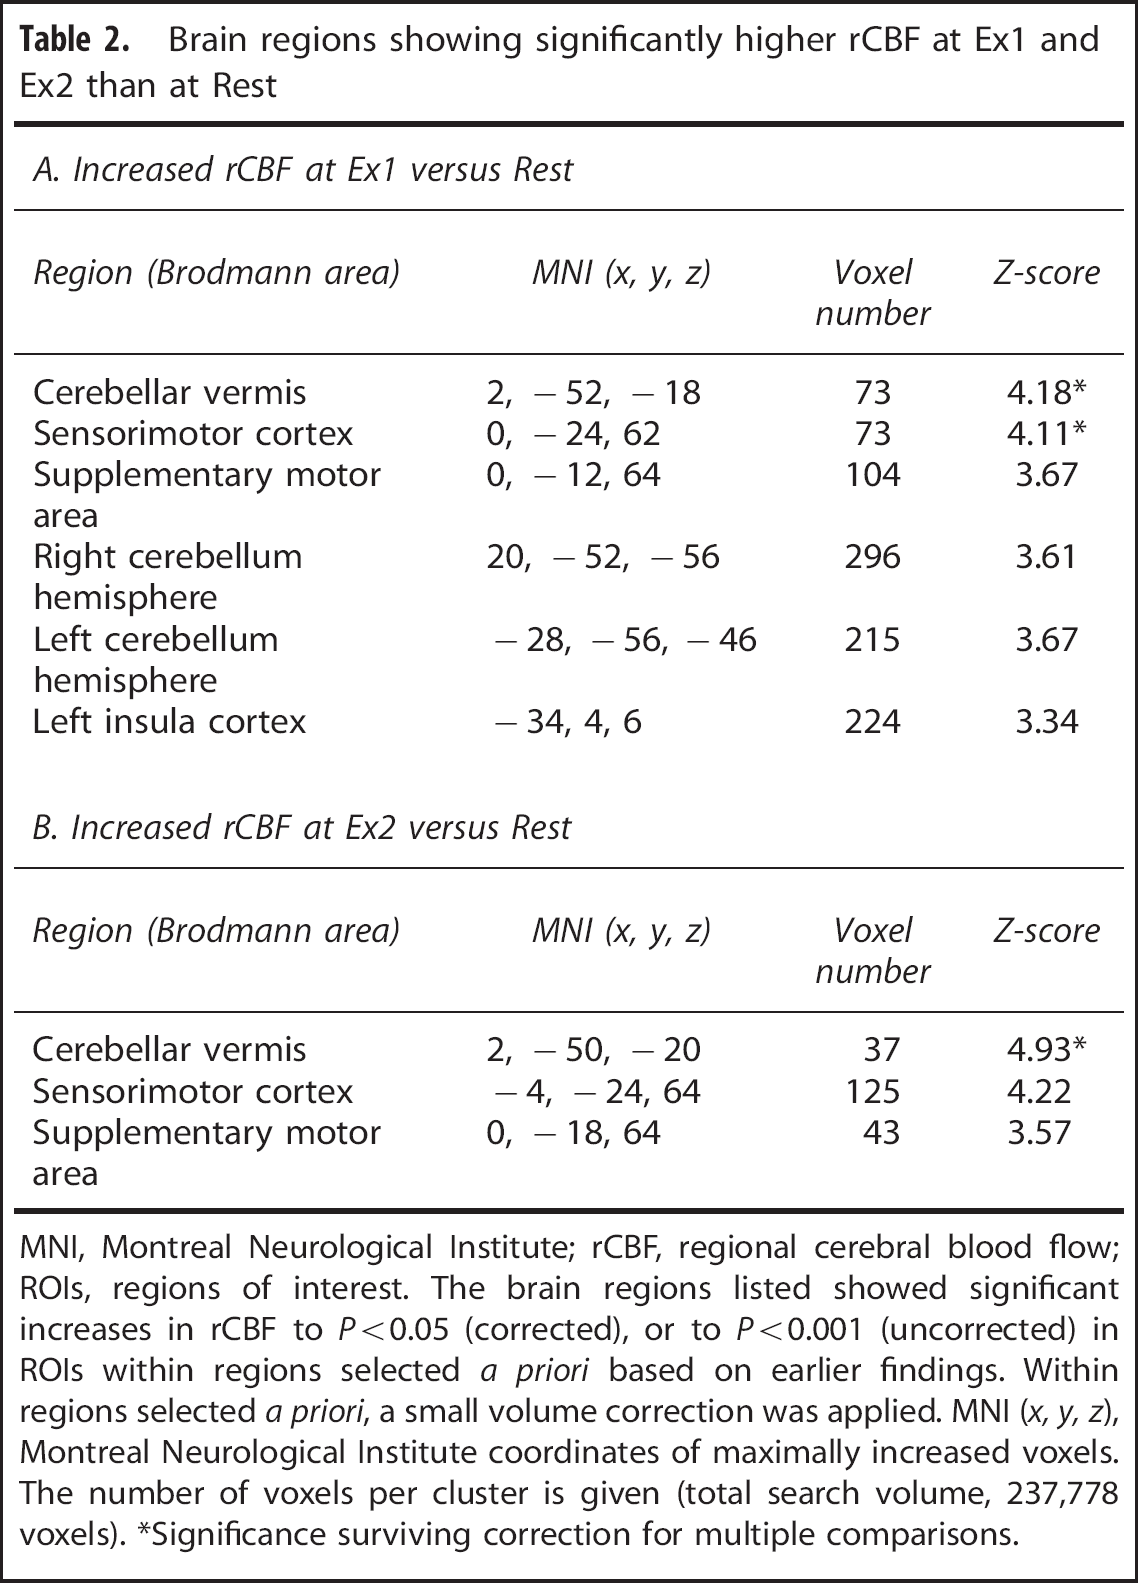
MNI, Montreal Neurological Institute; rCBF, regional cerebral blood flow; ROIs, regions of interest.
The brain regions listed showed significant increases in rCBF to
Significance surviving correction for multiple comparisons.
Quantitative Analysis
Quantitative results for gCBF are shown in Table 3 and Figure 3B. Global CBF was 27.9% higher at Ex1 (67.2±20.6 mL/100 g per minute) than at Rest (52.5±10.5 mL/100 g per minute), but gCBF at Rest was similar to the level at Ex2 (53.0±8.9 mL/100 g per minute). Among individual subjects (Figure 3B), gCBF ranged from 32.7 to 64.0, from 40.8 to 105.8, and from 40.8 to 69.1 mL/100 g per minute at Rest, Ex1, and Ex2, respectively. In one subject, gCBF was lower at both Ex1 and Ex2 than at Rest, and in another subject, gCBF did not change between Rest and Ex1 but was lower at Ex2. In the other eight subjects, gCBF was higher at Ex1 than at Rest and was lower at Ex2 than at Ex1.
Changes in global and regional cerebral blood flow from rest to exercise
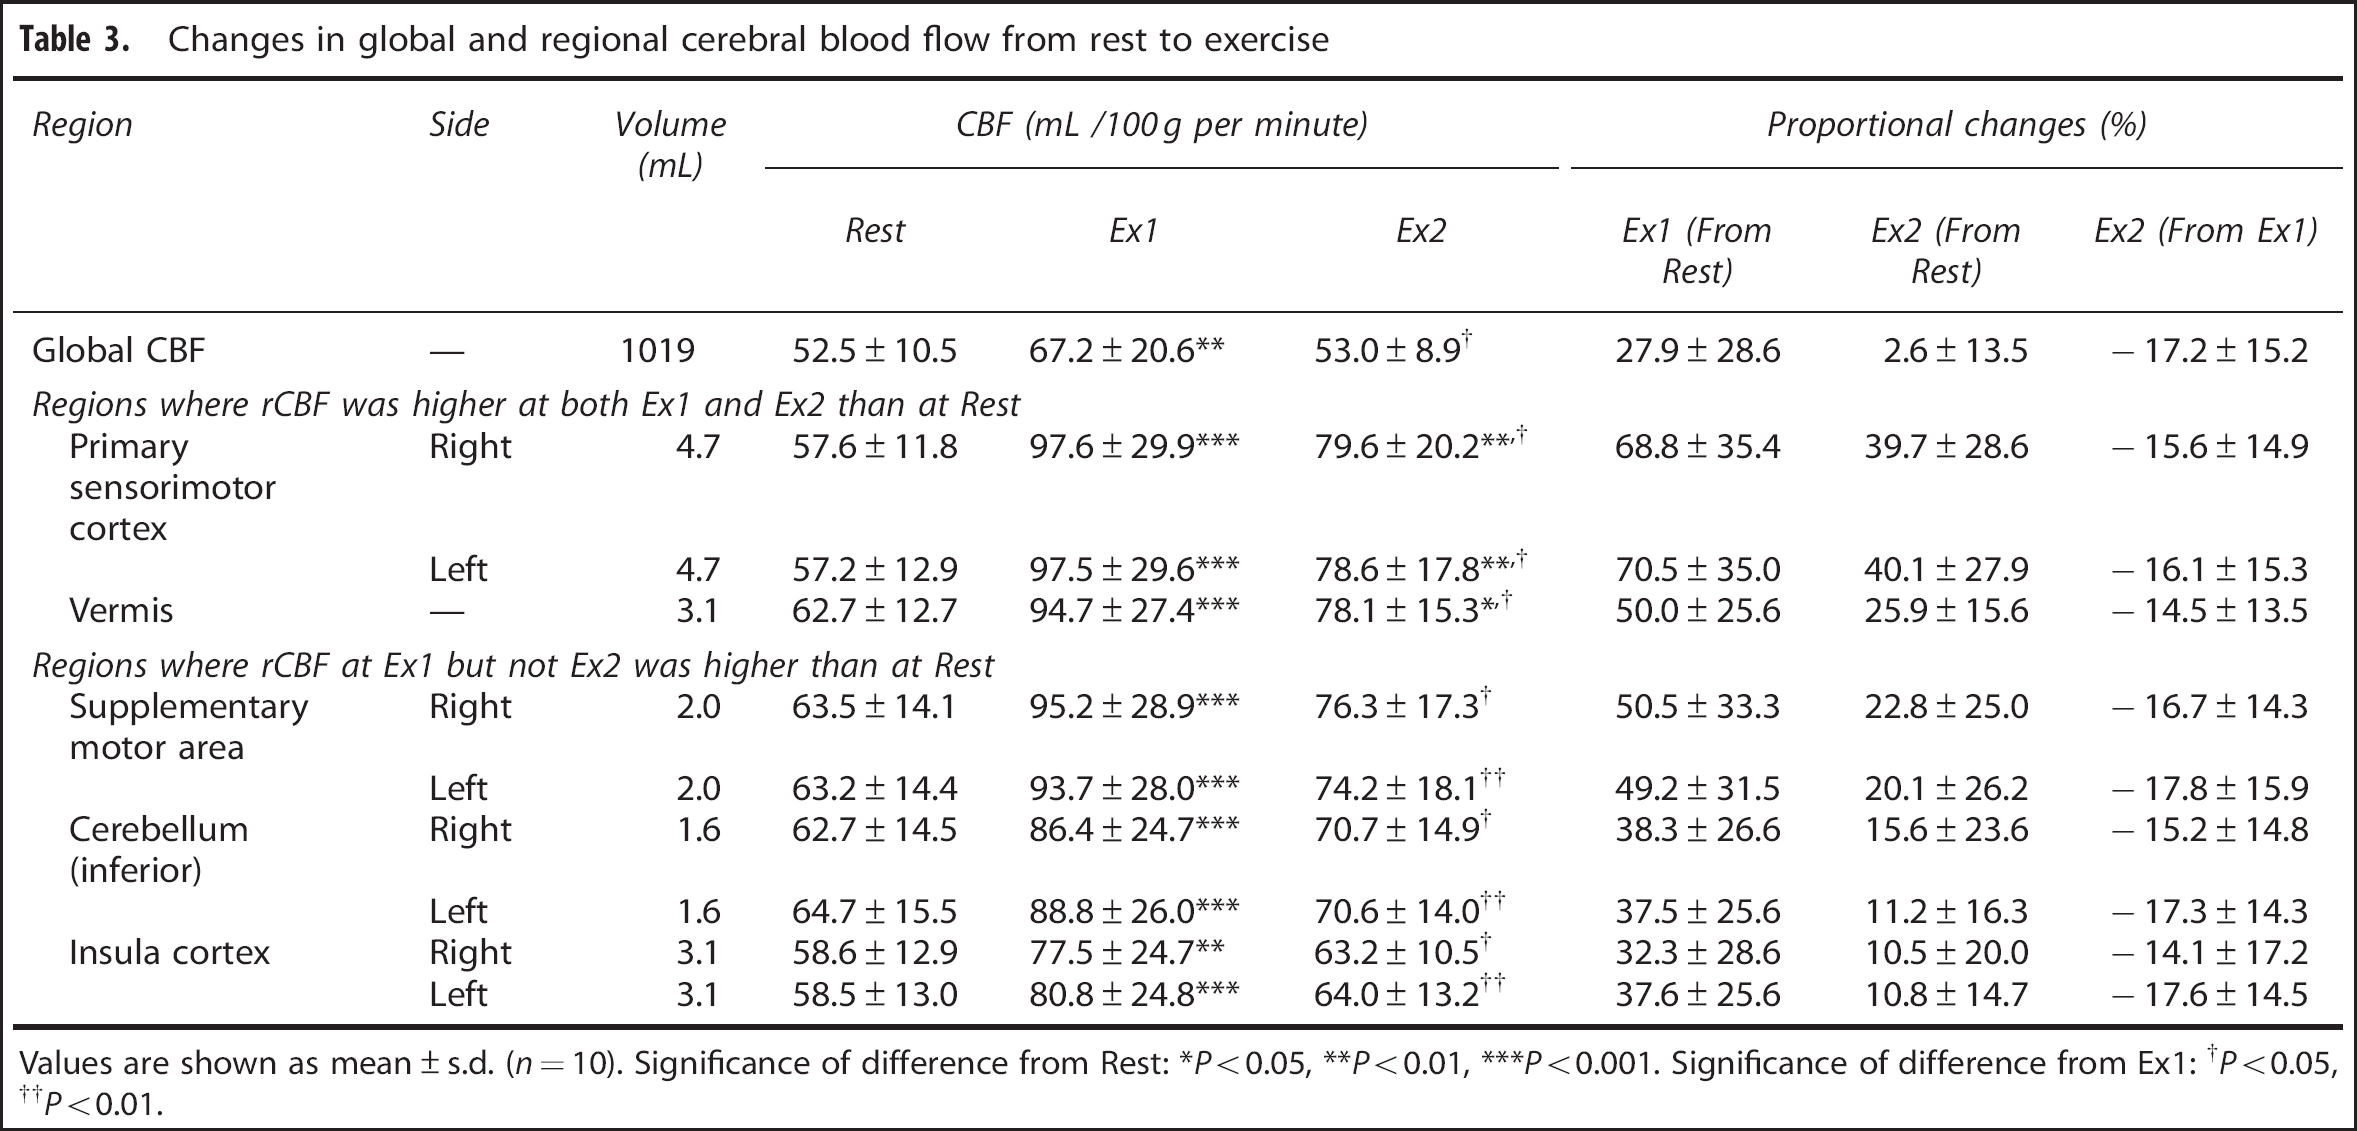
Values are shown as mean±s.d. (
Significance of difference from Rest: ∗
Significance of difference from Ex1: †
Using the SPM results, we next selected ROIs for analysis of the 5-mm-thick normalized MRIs, which were averaged across all the subjects (Figure 2). The rCBF values in the individual ROIs were calculated from the corresponding normalized PET images, which were co-registered to the 5-mm-thick MRIs. Quantitative data for the ROIs are shown in Table 3. In this analysis, rCBF was increased at both Ex1 and Ex2 in the M1Leg, S1Leg, and cerebellar vermis. In those areas, rCBF was 50.0% to 70.5% higher at Ex1 than at Rest, and was 25.9% to 40.1% higher at Ex2 than at Rest. In the SMA, cerebellar hemisphere (inferior) and insular cortex, rCBF was increased only at Ex1. In those areas, rCBF was 32.3% to 50.5% higher at Ex1 than at Rest.
DISCUSSION
Increased Regional Cerebral Blood Flow in Motor-Related Regions during Dynamic Exercise
The primary finding of this investigation was that rCBF is prominently increased in the M1Leg, S1Leg, SMA, cerebellar vermis, cerebellar hemispheres, and left insula cortex during the initial phase of exercise, but that increase was attenuated at later times during the exercise. Similarly, Christensen
In the M1Leg, S1Leg, and SMA, three areas where rCBF was higher at Ex1 than at Rest, the size of areas showing changes in rCBF appeared to be similar to those reported previously.
7
In the SMA, moreover, the area showing increased rCBF at Ex1 was larger than at Ex2, indicating that the area of the increased rCBF had declined by Ex2 (Table 2, Figure 4). Similarly, the relative increase in rCBF in the M1Leg and S1Leg differed considerably between the Ex1 and Ex2 (70% versus 39%), despite the constant
Earlier imaging studies of cycling exercise reported increases in rCBF in the cerebellar vermis.7, 8, 11 In the present study, we observed exercise-related increases in rCBF in the cerebellar vermis and hemispheres. This is likely attributable to the role of the cerebellum in motor control, as well as the anatomic connectivity between the cerebellar vermis and the working muscles via the spinocerebellar tract, and between the cerebellar hemispheres and the sensorimotor cortex via the pontocerebellar and corticopontine tracts. In addition to its role in motor control, the cerebellum is also involved in autonomic nervous function, and several studies have demonstrated that some modules within the cerebellum are dedicated to cardiovascular function and exert influence on the brainstem cardiovascular centers.21, 22 For example, anatomic evidence supports the involvement of fastigial nucleus neurons and the medial portion of the cerebellar vermis in cardiovascular function.23, 24 In the present study, areas of the cerebellar vermis showing increased rCBF corresponded to the medial portion of the vermis, including the fastigial nucleus. It is noteworthy, that the vermis is the only cerebellar region in which distinct increases in rCBF were identified at both Ex1 and Ex2. By contrast, the increases in rCBF seen in the cerebellar hemispheres at Ex1 were abolished by Ex2 (Table 2, Figure 4). Taking into consideration the hemodynamic changes that occur during exercise, it is tempting to speculate that the relationship between the sensorimotor cortex and insular cortex might corresponds to that between the vermis and the cerebellar hemispheres.
Physiologic Factors and Changes in Cerebral Blood Flow
At Rest, gCBF ranged from 32.7 to 64.0 mL/100 g per minute (Figure 3B). Considering that the lower PaCO2 values would affect gCBF, the observed gCBF values are consistent with the normal database in the Tokyo Metropolitan Institute of Gerontology. Although the individual intensities of cycling exercise were determined such that
From Rest to Ex1, rCBF increased in parallel with the physiologic parameters, including CO and
In addition to cerebral autoregulation, PaCO2 is a major contributor to changes in rCBF via vasodilatation or constriction. 30 However, the small increase of 2 mm Hg in PaCO2 seen in the present study would not be sufficient to account for the increases in rCBF seen at both Ex1 and Ex2 (∼70.5% and ∼40.1%, respectively), even taking the heterogeneous nature of the brain regions involved in the cerebrovascular response to CO2 into consideration. 31 Consequently, neural control in large regions of the brain may be required to initiate dynamic exercise and could account for the large increase in rCBF and gCBF, which are beyond the range of the cerebrovascular response to CO2. The finding that gCBF at Ex2 was not higher than at Rest, despite a 2-mm Hg increase in PaCO2, also implies that a mechanism other than the cerebrovascular response to CO2 has a role in regulating gCBF later during dynamic exercise. Given that our SPM analysis demonstrated that there was a tendency for rCBF to decline in some regions (e.g., left posterior cingulate gyrus and left middle frontal gyrus), these reductions could account for the lower gCBF at Ex2. We speculate that the reductions in gCBF later during dynamic exercise offset the effect of the cerebrovascular response to CO2. Furthermore, because the dynamic exercise continued for 13 minutes and PaCO2 was sustained at a higher level than at Rest throughout, no information is provided regarding the duration for which the increase in CBF can be sustained after the cerebrovascular response to CO2 is applied. Cerebrovascular response to CO2 is defined using several steps of the relationships between PaCO2 and CBF, but the duration of the steady-state hypercapnia in those studies was 5 minutes, at most. 32 Thus, the finding that gCBF did not differ between Ex2 and Rest, despite the increase in PaCO2, cannot be solely based on the conventional cerebrovascular response to CO2.
During moderate steady-state dynamic exercise, gCBF increases at the initial phase in parallel with
When considering the mechanism by which CBF is regulated during dynamic exercise from the perspective of cerebral autoregulation and the cerebrovascular response to CO2, it should be recognized that these classic mechanisms were applied in a static situation in which other factors related to exercise (e.g., CO) were held constant. Our findings suggest the possibility that during dynamic exercise, which involves changes in several physiologic parameters, factors other than blood pressure and CO2, may be affecting the regulation of CBF. 32
Central Command and Interoceptive Stimuli
During the cardiovascular response to exercise, signals from higher cortical centers (central command) and afferent input arising from the working muscles are integrated in the medulla.
34
Williamson
We found that the increase of rCBF in the left anterior insular cortex was more significant than in the right anterior insular cortex. This is in contrast to Christensen
A recent review of the functional anatomy of interoceptive (visceral) stimuli described a pathway from the peripheral tissues to the anterior insular cortex and anterior cingulated cortex and argued that these interoceptive stimuli include awareness of body movement during exercise.37, 38 The role of the left insular cortex in the context of this pathway was apparent in the present study. From Rest to Ex1,
CONCLUSION
In summary, the present study demonstrated quantitative changes in rCBF at both the Ex1 and at a later phase during a steady-state cycling exercise. Our findings indicate that during the onset phase, gCBF increases although MBP does not, and the increases in rCBF in the M1Leg, S1Leg, SMA, cerebellum, and left insular cortex could be associated with the central command network as well as afferent inputs from the working muscles. Despite the lack of change in the cardiovascular response during the prolonged exercise, the initial increase in rCBF over large areas was transient, and gCBF returned to the resting level. Thus, rCBF appears to change during exercise, even when the cardiovascular response does not. Our results imply that the mechanism regulating rCBF at the Ex1 may differ from the mechanism regulating rCBF later during exercise. Further investigation will be needed to define the regulatory mechanism specific to the Ex1 and the relationship between the cardiovascular response and rCBF.
Footnotes
The authors declare no conflict of interest.
ACKNOWLEDGMENTS
The authors thank Mr Kunpei Hayashi and Ms. Hatsumi Endo for their technical assistance.