
Abstract
Glycine is a co-agonist of glutamate at the NMDA receptor. Glycine transporter 1 (GlyT1) inhibitors are reported to be potential therapeutic agents for schizophrenia. 18F-MK6577 is a new positron emission tomography (PET) radiotracer useful for imaging brain GlyT1 and its occupancy in humans. We devised a novel multi-infusion paradigm of radiolabeled and unlabeled compound and an iterative linear/nonlinear alternating fitting method to allow for the determination of in vivo affinity (Kd) and target concentration (Bmax) images, constraining Kd to be uniform across the brain. This paradigm was tested with 18F-MK6577 in baboons. Voxel-based analysis produced high quality Bmax images and reliable Kd estimates, and also suggested that the nondisplaceable distribution volume (VND) is not uniform throughout the brain. In vivo GlyT1 Kd was estimated to be 1.87 nmol/L for 18F-MK6577, and the rank order of GlyT1 distribution measured in the baboon brain was: high in the brainstem (133 nmol/L), medium in the cerebellum (83 nmol/L), and low in the cortex (30 nmol/L). These in vivo Kd and Bmax values agreed well with those determined in vitro, thus validating our novel multi-infusion approach.
Keywords
INTRODUCTION
The N-methyl-D-aspartate (NMDA) receptor regulates many critical functions including synaptic plasticity and memory.1,2 Deficits in glutamate transmission at the NMDA receptor have been reported to be important in the pathophysiology of schizophrenia.3–5 Glycine acts as a required co-agonist along with glutamate at the NMDA receptor,6,7 and its extracellular concentration is controlled by the glycine transporters, mainly by glycine transporter type 1 (GlyT1).8–10 Thus, imaging of GlyT1 may be a useful tool in evaluating the importance of this site in the etiology of neuropsychiatric syndromes as well as the efficacy of drugs targeting GlyT1.
Several radiotracers have been developed to image GlyT1 with positron emission tomography (PET), including 11C-GSK931145, 11 11C-RO5013853, 12 and 18F-MK6577.13,14 18F-MK6577 is a relatively new and promising tracer that has been shown to be superior to 11C-GSK931145 with faster kinetics and higher specific binding signal, as well as better counting statistics afforded by its 18F radiolabel. 14 Positron emission tomography imaging studies with 18F-MK6577 have been reported in nonhuman primates 13 and humans recently. 15 Human studies indicated the absence of a reference region for this GlyT1 radiotracer. 15
Positron emission tomography studies are performed at tracer doses, i.e., with minimal occupancy of the target by the radiopharmaceutical. The strength of signal provided by a radiotracer, as measured by the binding potential (BP), is determined by the target concentration (Bmax) and the radiotracer's affinity to the target (1/Kd), i.e., BP=Bmax/Kd. However, these two parameters, Bmax and Kd, cannot be separated in vivo under normal ‘tracer’ imaging conditions. Thus, a number of methods have been developed to estimate Bmax and Kd separately with imaging experiments. At first, multiple bolus injections of a radiotracer with a range of specific activities were made and pseudo-equilibrium measurements were used to determine Bmax and Kd. 16 Later, multiple bolus plus infusion (B/I) administrations of radiotracer with varying specific activities were introduced to establish ‘true’ equilibrium measurements. 17 Alternatively, several groups have conducted multiple bolus injections (tracer with high and low specific activity or unlabeled compound alone) in one experiment, and made use of the full time course of data to estimate all kinetic parameters including Kd.18,19
We designed a novel, multi-infusion paradigm to measure the in vivo Kd of a radioligand and to image the target density (Bmax). The defining experimental features that differentiate this method from previous approaches are (1) multiple separate bolus plus infusion administrations were carried out within one continuous PET scan and (2) no reference region was needed; instead, the nondisplaceable distribution volume (VND) was treated as a parameter to be estimated. To produce Bmax images, a computationally practical iterative linear/nonlinear alternating fitting algorithm was developed. Here, we report the results from the application of this new paradigm to 18F-MK6577 in baboons.
MATERIALS AND METHODS
Radiochemistry
18F-MK6577 was synthesized by reaction of its chloro precursor with K18F in DMSO at 200° for 10 minutes, as previously reported. 14 The final tracer product was produced in high radiochemical yield (20.8±3.8%, decay-uncorrected, at the end of synthesis), high specific activity (396 ± 196 MBq/nmol), and high chemical and radiochemical purity (> 95% for both, n = 7).
Multiinfusion Injection Experiment Design
The aim of this study was to estimate GlyT1 Bmax and the in vivo Kd of MK6577 using equilibrium conditions. The equilibrium equation for bound ligand, in the absence of endogenous neurotransmitter is

where B is the bound ligand concentration (nmol/L) and MFP is the free mass concentration of the ligand in plasma (nmol/L) that serves as a surrogate for free concentration in tissue at equilibrium. To estimate Bmax and Kd, multiple observations of B and MFP are required. Thus, our experiment design tried to achieve as many tracer-receptor equilibrium periods as possible in one scan. Accordingly, the bolus plus infusion (B/I) approach 20 was employed using multiple infusions during the scan. One infusion was used for the labeled (hot) tracer, and two later infusions were used for unlabeled (cold) compound to occupy two different levels of the target. This design took advantage of 18F (half-life: 109.8 minutes) labeling and the fast kinetics of 18F-MK6577. Based on initial test studies, the final multi-infusion experimental design consisted of one 300-minute 18F-MK6577 B/I with two separate 90-minute B/I with increasing mass doses of unlabeled MK6577 beginning at 120 and 210minutes, respectively, as shown in Figure 1.
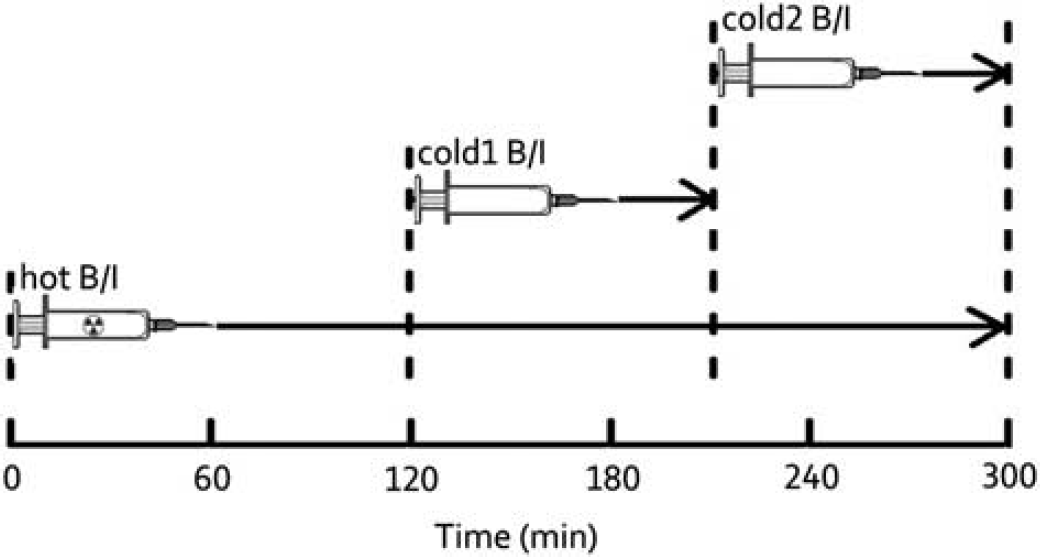
Graphic depiction of multi-infusion design. Each experiment consisted of one 300-minute 18F-MK6577 bolus/infusion (hot B/I) accompanied by two 90-minute unlabeled MK6577 infusions (cold B/I) with increasing doses beginning at 120 and 210 minutes. For the bolus components, Kbol = 90 minutes for all three injections. Three equilibrium periods were 60 to 120, 150 to 210, and 240 to 300 minutes.
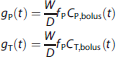
To implement this design, a number of factors must be determined, specifically the bolus injection constant (Kbol, minutes) 20 and the infusion rates of cold compound for the second and third stages (Icold1 and Icold2, nmol/kg per minute). Therefore, bolus injection experiments were performed in advance to understand the basic kinetic features of 18F-MK6577 in baboon. Let Cbolus(t) (Bq/mL) be the time-activity curve (TAC) for any tissue (T) region of interest (ROI) or the plasma (P) after bolus administration, and let g(t) (g/mL) be the corresponding normalized free tracer concentration, by correcting Cbolus(t) for free fraction fP, animal weight (W, kg), and the injected bolus dose (D, kBq), then
The normalized ROI TAC, hT(t) (g/mL), after a B/I injection can be predicted from gT(t), 20 where Tinf is the infusion length (minutes):
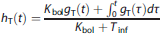
We evaluated hT(t) for the brainstem, cerebellum, and cingulate cortex while varying Kbol from 60 to 120 minutes and visually determined a Kbol value that produced equilibrium most rapidly. Data from four bolus injections were used, and Kbol was chosen to be 90 minutes.
Assuming body kinetics are unaffected by mass dose, the gP(t) curves can be used to predict radioactivity or mass concentration in plasma at equilibrium after B/I administration based on an infusion rate I. We define
clearance rate (CL, L/kg per minute) as the reciprocal of the integral of the bolus response function.

To estimate the integral to infinity, the tails of the bolus curves were fitted to an exponential function. Based on four bolus studies, CL was determined to be 0.22 ± 0.07 L/kg per minute.
Given a hot constant infusion with rate Ihot (kBq/kg per minute), using the plasma bolus response function gP(t) in equation (2) and the definition of clearance in equation (4), the predicted equilibrium free plasma radioactivity value CFP,eq (Bq/mL) would be:

We assumed that the cold compound had the same response as the hot tracer, i.e., that the system was linear and the cold compound did not saturate any biologic processes such as clearance or metabolism. Then, upon delivering a constant infusion rate of Icold (nmol/kg per minute), the predicted equilibrium free plasma mass concentration MFP,eq (nmol/L) would be:

The injected cold mass doses were estimated to reach predefined occupancy levels. The receptor occupancy (r), the ratio of bound to total receptor concentration, can be calculated from the equilibrium equation (1) as follows:
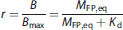
Rearranging (7) into
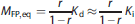
yields the dependence of MFP,eq on the targeted value of r. Since we had no knowledge of the in vivo Kd, the in vitro inhibition constant (Ki, 1.15 nmol/L13) was used in equation (8). Combining (6) and (8), the desired infusion rate for the unlabeled compound is:

Magnetic Resonance Imaging
Magnetic resonance (MR) images were acquired on a Siemens Magnetom 3.0T Trio scanner, using an extremity coil. T1-weighted images were acquired in the coronal plane with a spin echo sequence. The MR images were stripped of the skull and muscle 21 so that only the brain remained in the image. The image dimension was 176 × 176 × 176 voxels with a voxel size of 0.55 × 0.55 × 0.54 mm3.
Positron Emission Tomography Imaging Procedures Positron emission tomography experiments were performed according to a protocol approved by the Yale University Institutional Animal Care and Use Committee. Two female baboons (18.4±6.3kg, 8.5±0.5 years) underwent two scanning sessions each on the HR+ PET scanner (Siemens Medical Solutions, Knoxville, TN, USA).
The baboons were sedated with a 10 mg/kg intramuscular dose of ketamine approximately 2 hours before the radiotracer injection. Once stable, animals were transported to the scan area and anesthesia was maintained on 1.5% to 2.5% isoflurane. A catheter was placed in the femoral or radial artery for blood pressure monitoring and arterial blood sampling. Two syringe pumps (PHD 2000 Programmable Pump; Harvard Apparatus, Holliston, MA, USA) were used for the injections, one for the hot tracer and the other for the two cold doses. At each injection stage, a 3-minute high rate injection was used to deliver the bolus portion, then a lower rate was used to maintain the infusion. Throughout the 300-minute scan, heart rate (HR), respiratory rate, body temperature, end tidal pCO2, oxygen saturation, and blood pressure were monitored a minimum of four times per hour, more frequently immediately after injection of the tracer and cold compound doses. After administration of the cold compound, very slight changes were noticed, i.e., a decrease in HR, and increases in respiratory rate, blood pressure, and body temperature.
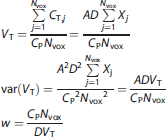
A summary of the hot and cold infusion parameters is provided in Table 1. The designed occupancies were intentionally chosen to be high to provide reliable estimates of VND as well as Bmax and Kd. For each experiment, a 6-minute transmission scan was obtained immediately before tracer injection, followed by a 300-minute emission scan in 3D mode initiated at the start of tracer administration. List-mode data were reformatted into 69 frames and reconstructed with Fourier rebinning and 2D-OSEM. 22 Image reconstruction included corrections for attenuation, dead time, random counts, and scatter. The image size was 128 × 128 × 63 voxels, with an in-plane voxel size of 2.06 mm and an axial voxel size of 2.43 mm.
Summary of injections
B, baboon; D, day; I, infusion rate; SA, specific activity of tracer. Kbol=90 minutes for all injections. Occupancy values were chosen in advance and used to calculate infusion rates.
Free Fraction Measurement, Metabolite Analysis, and Generation of Plasma Input Function
The free fraction in plasma (fp) was measured using an ultrafiltration-based method with a reference blood sample taken immediately before tracer injection to which was added a small amount (~3.7 MBq) of the radiotracer. After 10 minutes incubation at room temperature, the sample was centrifuged at 2,930 g for 5 minutes and plasma aliquots (0.3 mL) were loaded into the reservoir of the Millipore Centrifree micropartition device in triplicate and centrifuged at 1,228g for 20 minutes. Free fraction was determined from the ratio of the radioactivity concentration in the ultrafiltrate to that in plasma.
Arterial blood samples were collected during each scan. Radioactivity concentration of whole blood and plasma samples was measured with a cross-calibrated gamma well counter (1480 WIZARD; PerkinElmer, Waltham, MA, USA). The tail portion of the total plasma concentration curve was fitted to a 3-exponential function. In addition, selected samples taken at 3, 8, 15, 30, 60, 90, 120, 180, 210, 270, and 300 minutes were analyzed to assess the unchanged parent fraction using the automatic column-switching HPLC method. 23 After separation from red blood cells by centrifugation (2,930 g for 5 minutes), plasma samples were mixed with 8mol/L urea and then filtered through a 1.0-μm Whatman 13 mm GD/X syringe filter (GE, Florham Park, NJ, USA). Up to 5 mL of plasma filtrate was then injected onto the HPLC system equipped with a Gemini-NX C18 analytical column (250×4.6 mm, 5 μm, Phenomenex, Torrance, CA, USA), eluting with 35% acetonitrile in 0.1 mol/L ammonium formate at a flow rate of 1.65 mL/min. The parent compound retention time was 11 minutes. Fractions of the HPLC eluate were collected and counted for radioactivity in the gamma counter. The sample recovery rate, extraction efficiency, and HPLC fraction recovery were monitored. The parent fraction was calculated as the ratio of the sum of radioactivity in fractions containing the parent tracer to the total amount of radioactivity collected. The parent fraction curve was fitted to an integrated γ-function. The data were also corrected for the time-varying extraction efficiency of radioactivity in the filter and normalized to the extraction efficiency determined from the reference plasma sample. The final plasma input function was calculated as the product of the fitted total plasma curve, fitted parent fraction curve, and fitted extraction efficiency curve.
Positron Emission Tomography Image Analysis
The PET-MR registration consisted of two steps: (1) PET images were aligned to each baboon's MR via a 6-parameter rigid registration with the Multi-Transform Method 24 to generate the optimal transformation to map the PET dynamic data into the baboon's MR image space; (2) An affine linear+nonlinear registration 25 was performed using each MR image and a high-resolution baboon MR template. Regions of interest were delineated on the MR template and then mapped back to PET space via these two transforms to compute the TACs for ROI analysis. Defined ROIs included brainstem, caudate, cerebellum, cingulate, frontal cortex, globus pallidus, insula, nucleus accumbens, occipital cortex, pons, putamen, and thalamus.
The entire PET scan was divided into three infusion stages: 0 to 120 minutes (hot only), 120 to 210 minutes (hot+cold 1), and 210 to 300 minutes (hot+cold 2) as shown in Figure 1. The equilibrium period of each stage was chosen by inspecting the constancy of ROI TACs and the input function data, i.e., by performing linear fitting and examining the slope. Positron emission tomography images were averaged during each equilibrium period and resliced into MR template space to align different scans for voxelwise analysis.
Distribution volume (VT) for each image voxel or ROI was determined at each equilibrium period as

where CT and CP denote the average concentration in voxel/ROI and plasma, respectively, during the equilibrium period.
Estimation of Bmax and Kd
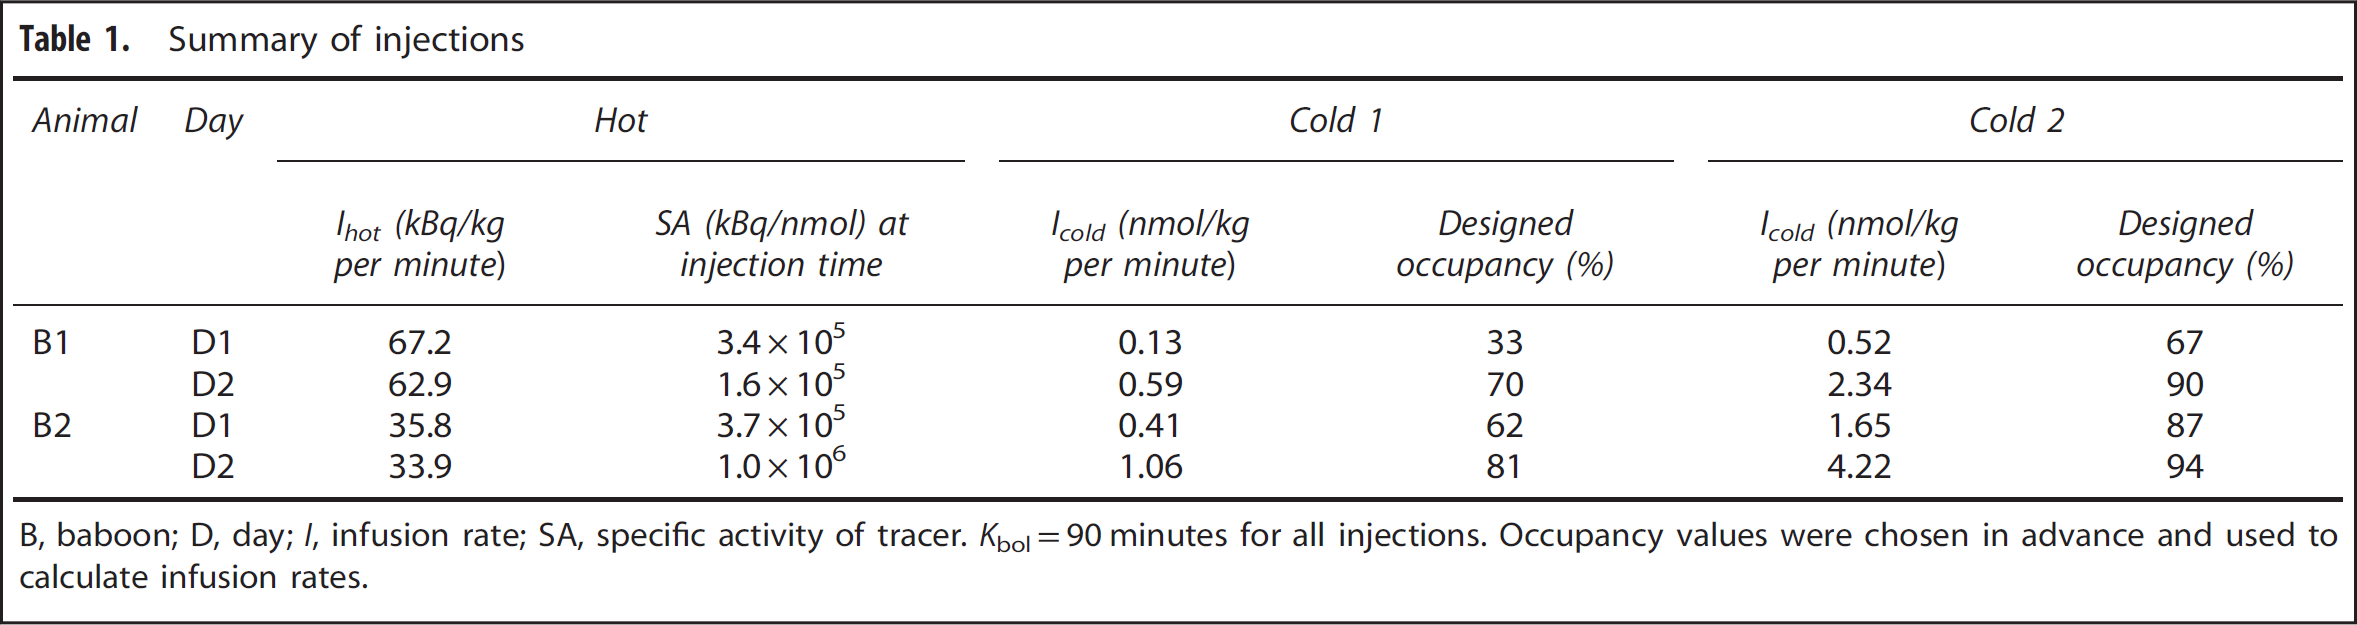
Since there is not an apparent region devoid of specific binding for 18F-MK6577, VT values were fitted on a regional and voxel level to equation (11) to estimate Kd, Bmax, and VND values:
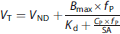
Here, SA was the net specific activity in unit of kBq/nmol. This value was calculated from the ratio of the infusion rates of hot and cold molecules, accounting for the total cold mass from the hot and cold infusions. Equation (11) assumes that the free tracer concentration in tissue and plasma is identical at equilibrium. Weights were used in nonlinear fitting as follows:
Here VT is calculated as the ratio of the average of the tissue concentration values in a region with Nvox voxels to the plasma concentration (for voxel analysis, Nvox=1). The reconstructed voxel values are approximated as the product of the Poisson counts from voxel j (Xj) multiplied by a decay correction term (D) and a scale factor (A) to account for attenuation, efficiency, etc. The variance of VT can then be calculated by assuming Poisson statistics. Algebraic rearrangement leads to the formula for weights w, which are inversely proportional to the variance.
The analysis was performed using seven data groupings: four with data from a single day experiment with three equilibrium periods (B1_D1 = baboon 1 on day 1, B1_D2, B2_D1, B2_D2), two with each individual baboon's data from both experimental days together (B1, B2, 6 equilibrium periods each), and one with all data (POOLED, 12 equilibrium periods).
Individual regional Bmax values or Bmax images were determined, and Kd was assumed to be identical throughout the brain. Two analyses were performed with each data set using different assumptions for VND: (1) UND, which constrained VND to be a constant across ROIs or voxels, i.e., Uniform Non-Displaceable volume of distribution and (2) NUND, where VND could be Non-Uniform, i.e., different among regions and voxels and thus an additional independent parameter. Fits were performed at both ROI and voxel levels.
For regional analysis, with 12 regions, the total number of parameters to be estimated was 14 (1 Kd, 1 VND, 12 Bmax) for UND and 25 (1Kd, 12 VND, 12 Bmax) for NUND. The F-test was applied afterwards to check if the fitting quality was significantly improved by introducing 11 more parameters, i.e., regional VND values.
Voxelwise analysis was performed with the VT images extracted from each equilibrium period. For this analysis, there were ~ 1 M voxels (baboon brain volume of ~ 0.15 L and MR voxel size of 0.16 mm3). Thus, in the case of the POOLED analysis, there were ~ 12 M measurements and ~ 1 M+2 parameters under UND and ~2M+1 parameters under NUND. Thus, the use of classical nonlinear estimation was computationally impractical. Therefore, an iterative 2-step linear/nonlinear alternating fitting method was developed.
For UND, the first step was a linear component that used fixed global values of Kd and VND and fitted for a Bmax image (indexed with j)with ~ 1 M independent fits of one parameter with up to N = 12 points each (indexed with i). In this process, there was no crosstalk between voxels, and since Kd and VND were fixed, the fitting was linear. For each voxel j, the equations for the linear regression of independent variable xi versus dependent variable yi,j to estimate the slope Bmaxj are

The second step was a nonlinear component, which fixed the Bmax image, and fitted for Kd and VND from up to 12 M measurements using a Marquardt-Levenberg algorithm.
Similarly for NUND, the linear step fixed Kd and fitted for Bmax and VND images with ~ 1 M independent linear fits, i.e., for each voxel j. Each fit contains two parameters with up to 12 data points.
The nonlinear step fixed the Bmax and VND images, and fitted for Kd from up to ~ 12 M measurements.
Average values from ROI fits across experiments were used for the initial guesses. The linear and nonlinear steps were repeated until either of the following conditions was satisfied: (1) the residual sum of squares started to increase or (2) the percentage change in Kd over one iteration was less than 0.01%. For analyses using POOLED or single-baboon data, 5 to 8 iterations were required for convergence. On a standard workstation, the full ROI analysis required < 10seconds and one iteration of the voxel analysis (M = ~0.8M) required ~ 1.5 minutes.
RESULTS
Free Fraction and Metabolite Analysis
Plasma-free fraction varied slightly across day and baboon, with values of 0.10 ±0.01 (n = 4). Parent tracer fractions were 36 ±5% and 24±3% at 90 and 300 minutes, respectively (n = 4).
Representative Images and Time-Activity Curves
Figure 2 displays transverse, coronal, and sagittal views of the uptake of 18F-MK6577 at baseline (average of 60 to 120 minutes) and under high cold mass dose conditions (average of 240 to 300 minutes, designed receptor occupancy of 87%). Brain images showed good uptake with the expected distribution of highest concentrations in the brainstem and pons, medium in the thalamus and cerebellum, and low uptake in the striatum and cortical regions.
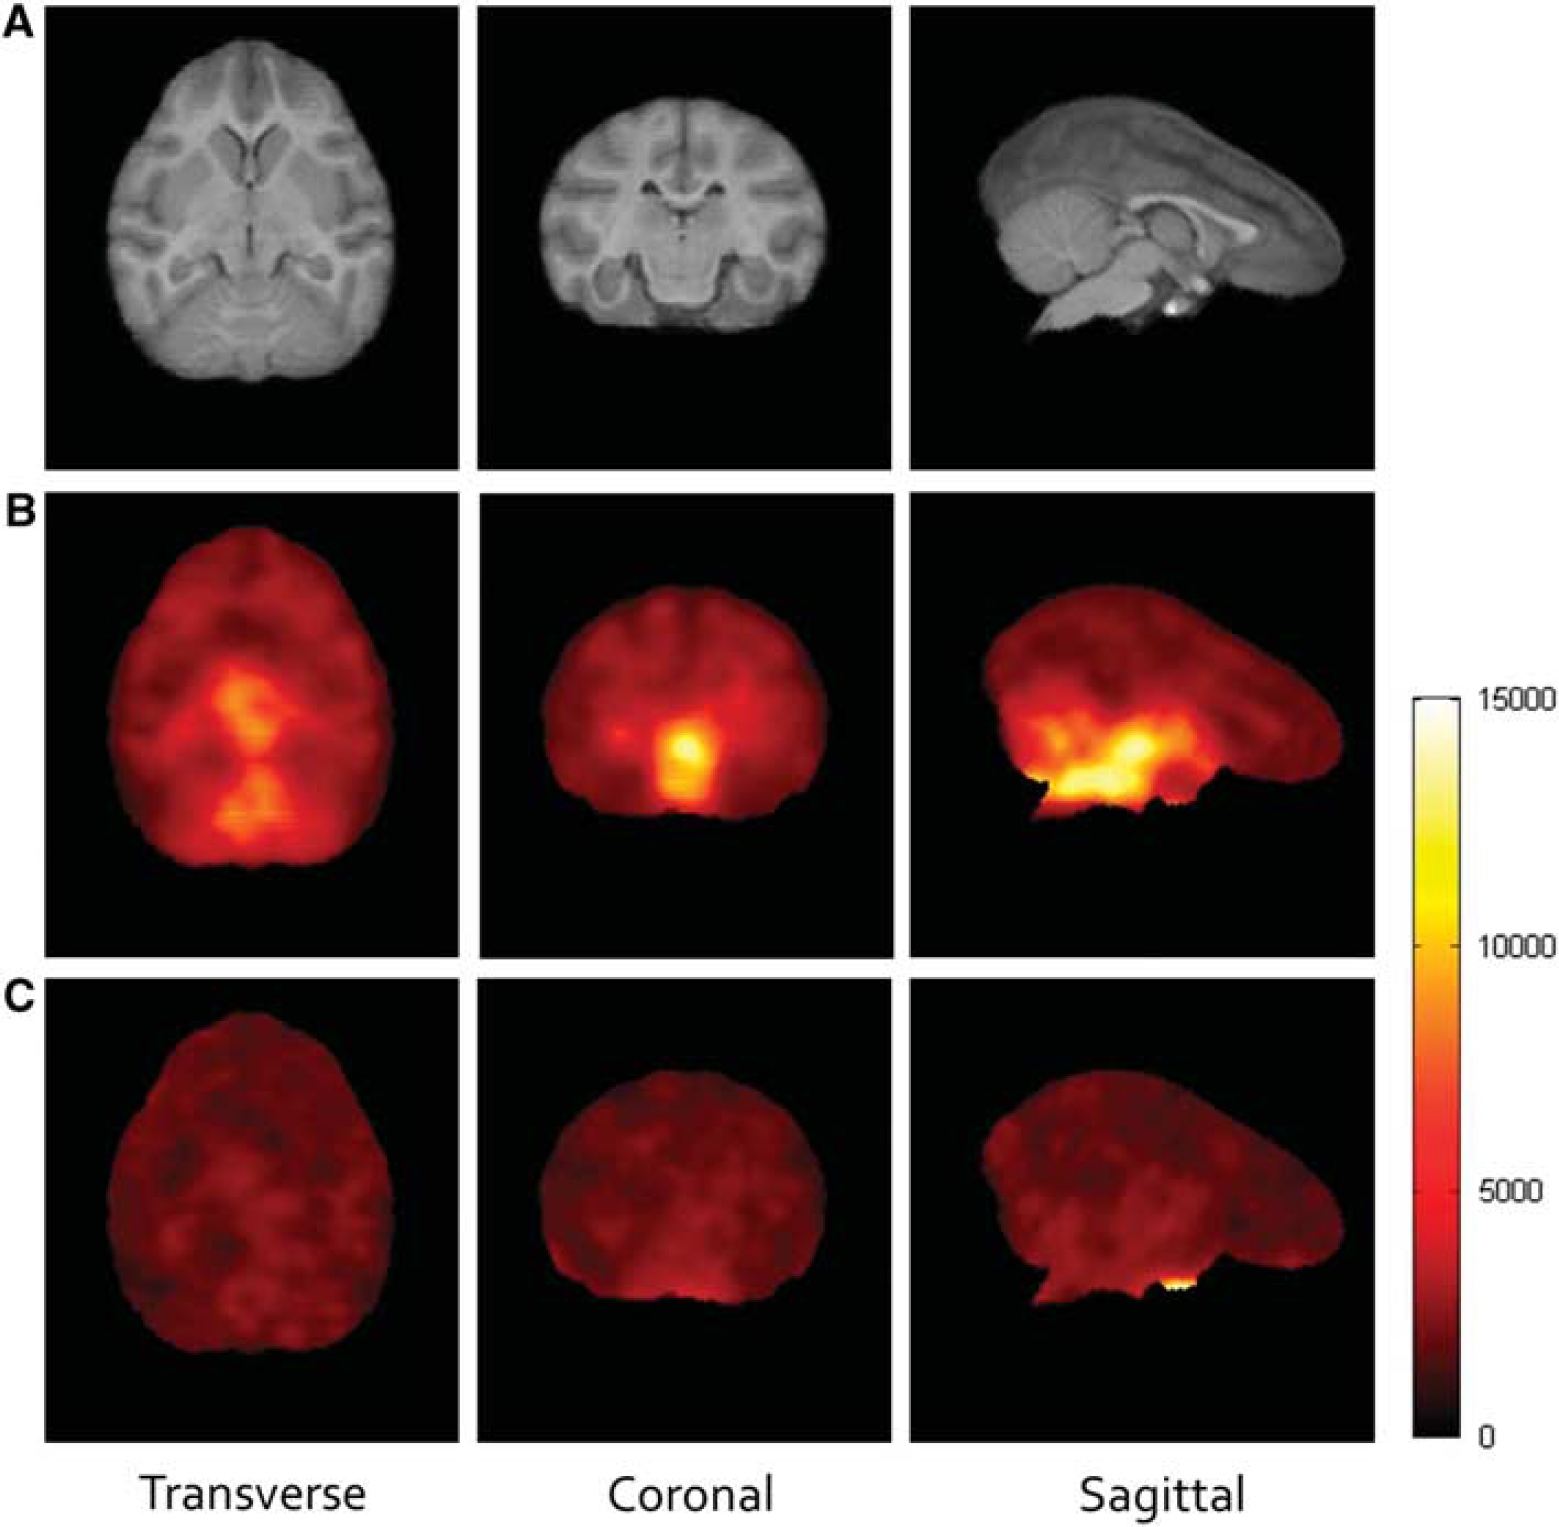
Representative uptake concentration of 18F-MK6577 with an anatomic MR atlas as a reference. Left: transverse. Middle: coronal. Right: sagittal. (
Figure 3 shows sample TACs of three representative ROIs (brainstem, cerebellum, and cingulate gyrus) and the fitted input function in experiment B2_D1. In each stage, equilibrium was reached rapidly. Equilibrium periods were chosen to be 60 to 120, 150 to 210, and 240 to 300 minutes, as denoted in gray in Figure 3. The percent change per hour of the input function during the three periods was − 3.3 ±2.2, − 7.5 ±3.0, and +2.8±6.1, respectively. For the ROI TACs, average values for three representative regions were − 3.5 ±4.5%, − 4.9 ±7.7%, and +1.4 ± 9.6%/hour. These slopes were averaged across scan days.
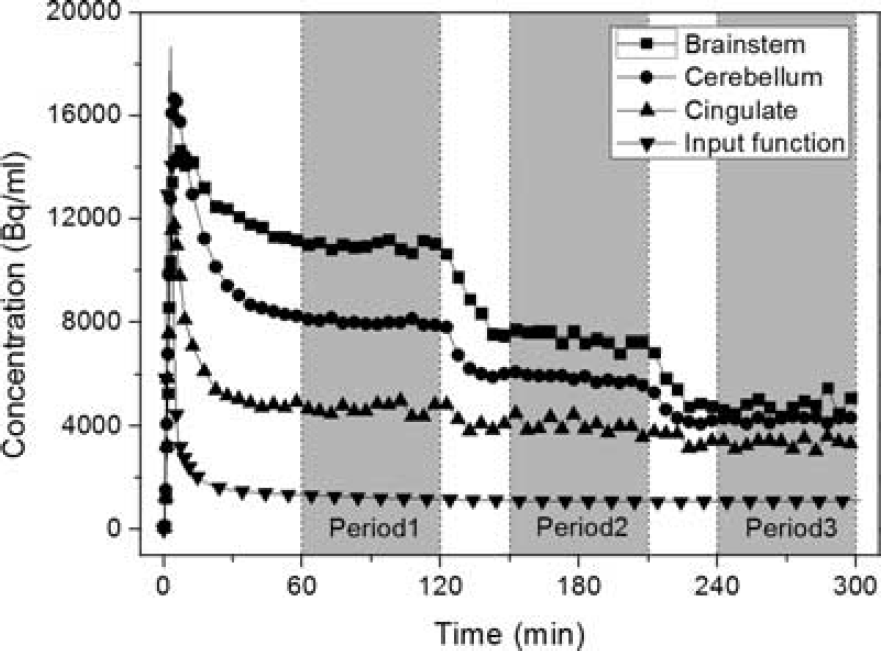
Three representative regional time-activity curves (TACs) and the input function (fitted curve). Data from study B2_D1 are shown. The three periods of equilibrium are marked in gray.
Occupancies
To assess the accuracy of the planned infusion parameters (Table 1), we used the occupancy plot 26 to estimate occupancy in each condition. Compared with the designed occupancy, the fitted values were lower by 17±9%. This suggests that the actual in vivo Kd is somewhat higher than the in vitro value of 1.15 nmol/L.
Region of Interest Analysis Results
Parameter estimates from ROI analysis based on UND and NUND assumptions are listed in Tables 2 and 3, respectively. The value of Kd was in the range of 1 to 2 nmol/L, which was in good agreement with the in vitro Ki value of 1.15 nmol/L used in the initial experimental design. This good agreement is not surprising, since the TACs in Figure 3 were well matched with theoretical predictions. If VND was allowed to vary across regions (NUND), then Kd increased somewhat compared with the UND values. Similarly, the VND values estimated with the NUND assumption were near the value obtained under UND. The percentage differences between the UND and NUND values are shown in Table 3, with a maximum difference of 26%.
Parameter estimates from ROI analysis with uniform VND assumption (UND)
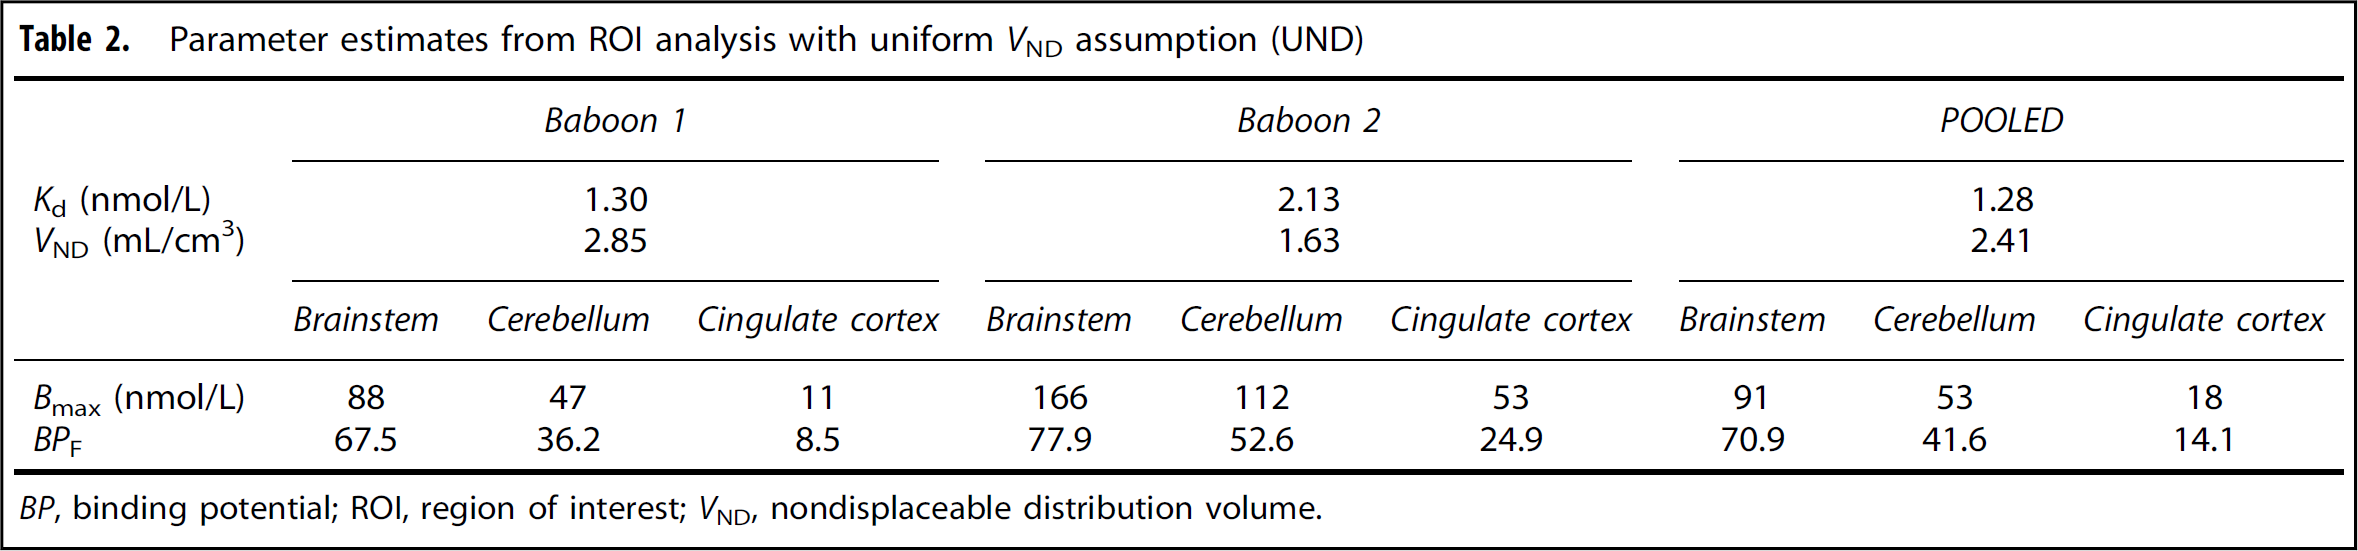
BP, binding potential; ROI, region of interest; VND, nondisplaceable distribution volume.
Parameter estimates from ROI analysis with non-uniform VND assumption (NUND)
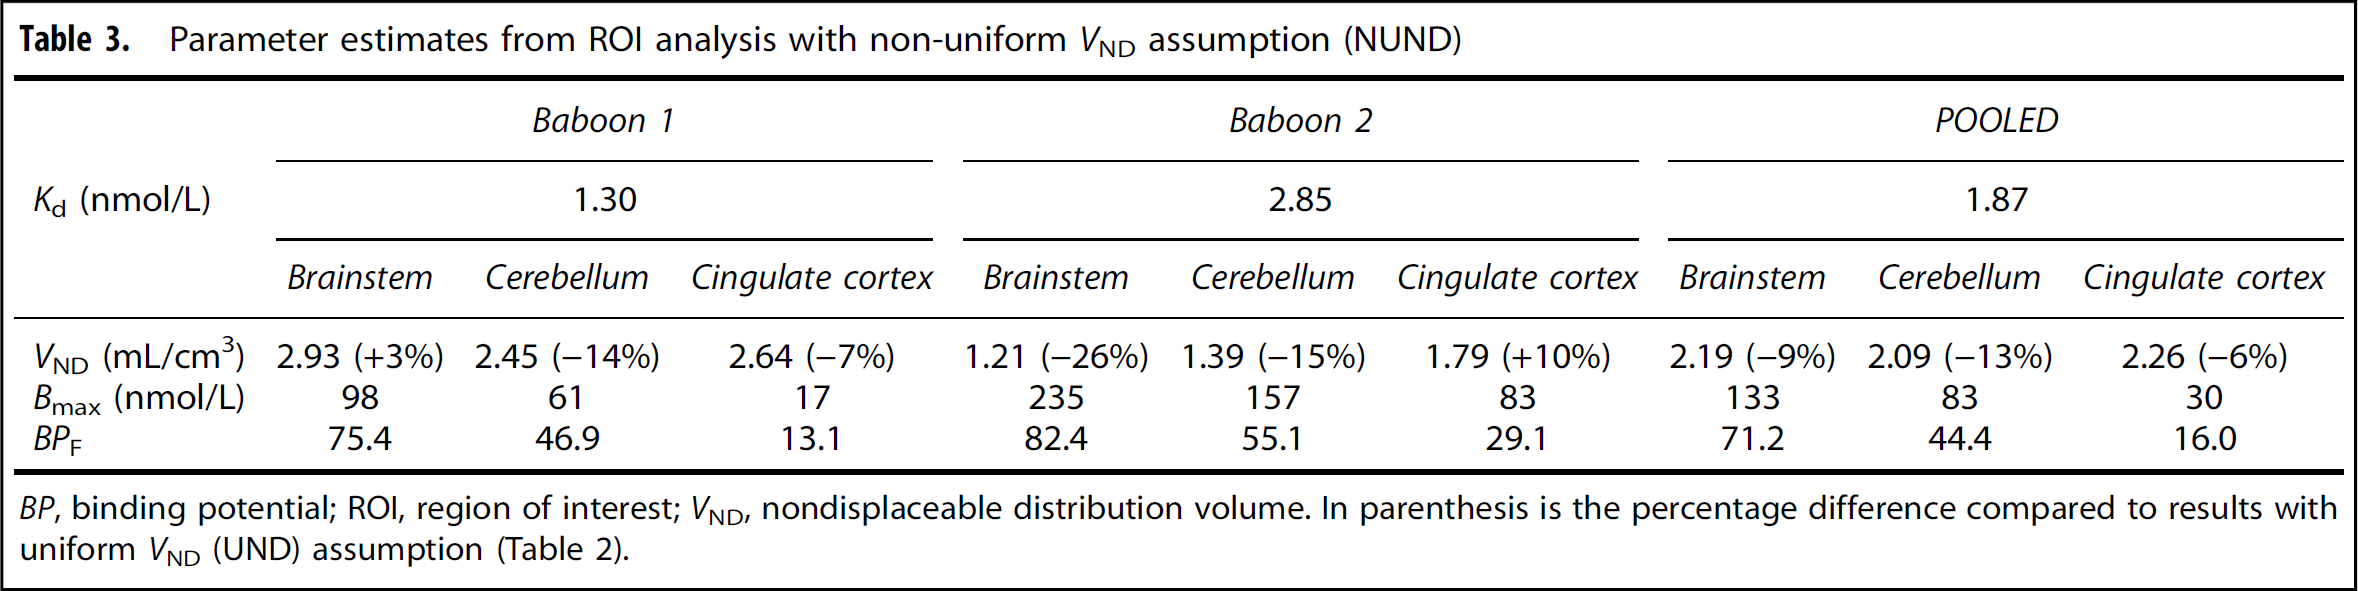
BP, binding potential; ROI, region of interest; VND, nondisplaceable distribution volume. In parenthesis is the percentage difference compared to results with uniform VND (UND) assumption (Table 2).
Across analysis methods, Bmax was highly correlated to Kd, i.e., data groupings that produced larger Kd values also gave larger Bmax values. This is not unexpected, as small errors in the high-occupancy data (stages 2 and 3) will produce errors in both Bmax and Kd, while the ratio BPF = Bmax/Kd is unaffected, since this value is defined mostly from the high specific activity data (stage 1). BPF values were more consistent, either derived individually or jointly, compared with Bmax or Kd values. GlyT1 Bmax values of 18 (UND) and 30 (NUND) nmol/L in the cingulate cortex, as estimated from the POOLED data set, agreed reasonably well with the in vitro Bmax value of 570 fmol/mg protein, or approximately equivalent to 28 to 57 nmol/L in human medial frontal cortex. 27
Comparing results from NUND and UND analyses for the POOLED data, the correlation of 12 regional Bmax values was excellent (R 2 = 0.99), but the slope was 1.48 [Bmax (NUND) = 1.48 Bmax(UND)], consistent with the ratio of Kd values, i.e., 1.87/1.2=81.46. The BPF estimates showed excellent agreement between UND and NUND assumptions, with R 2 = 0.99 and slope = 1.02. The F-test showed that NUND was a better assumption (F11119 = 3.01, p = 0.0046), suggesting that nondisplaceable binding is not uniform throughout the brain.
Voxel Analysis Results
Figure 4 shows the results of voxel-based analyses with all parametric images from the POOLED analysis. In general, the statistical quality of the parametric images was extremely high. Estimates of Kd were 1.49 nmol/L for UND and 1.87 nmol/L for NUND compared with values of 1.28 and 1.87 nmol/L, respectively, from regional analysis. The spatial distribution of GlyT1 was, of course, identical in Bmax and BPF images (note that their visual appearance may differ due to the choice of color map) with low density in all cortices, showing that there was no ideal reference region in baboon, similarly to what had been found in humans. 15 Under the UND assumption, one VND value was produced for the whole brain, but for visual convenience, it was shown as a parametric image with uniform value of 2.35. NUND VND ranged from 1.84 to 2.99 (5th to 95th percentile). Higher VND values appeared to concentrate in the white matter and cerebrospinal fluid (CSF, see Discussion).
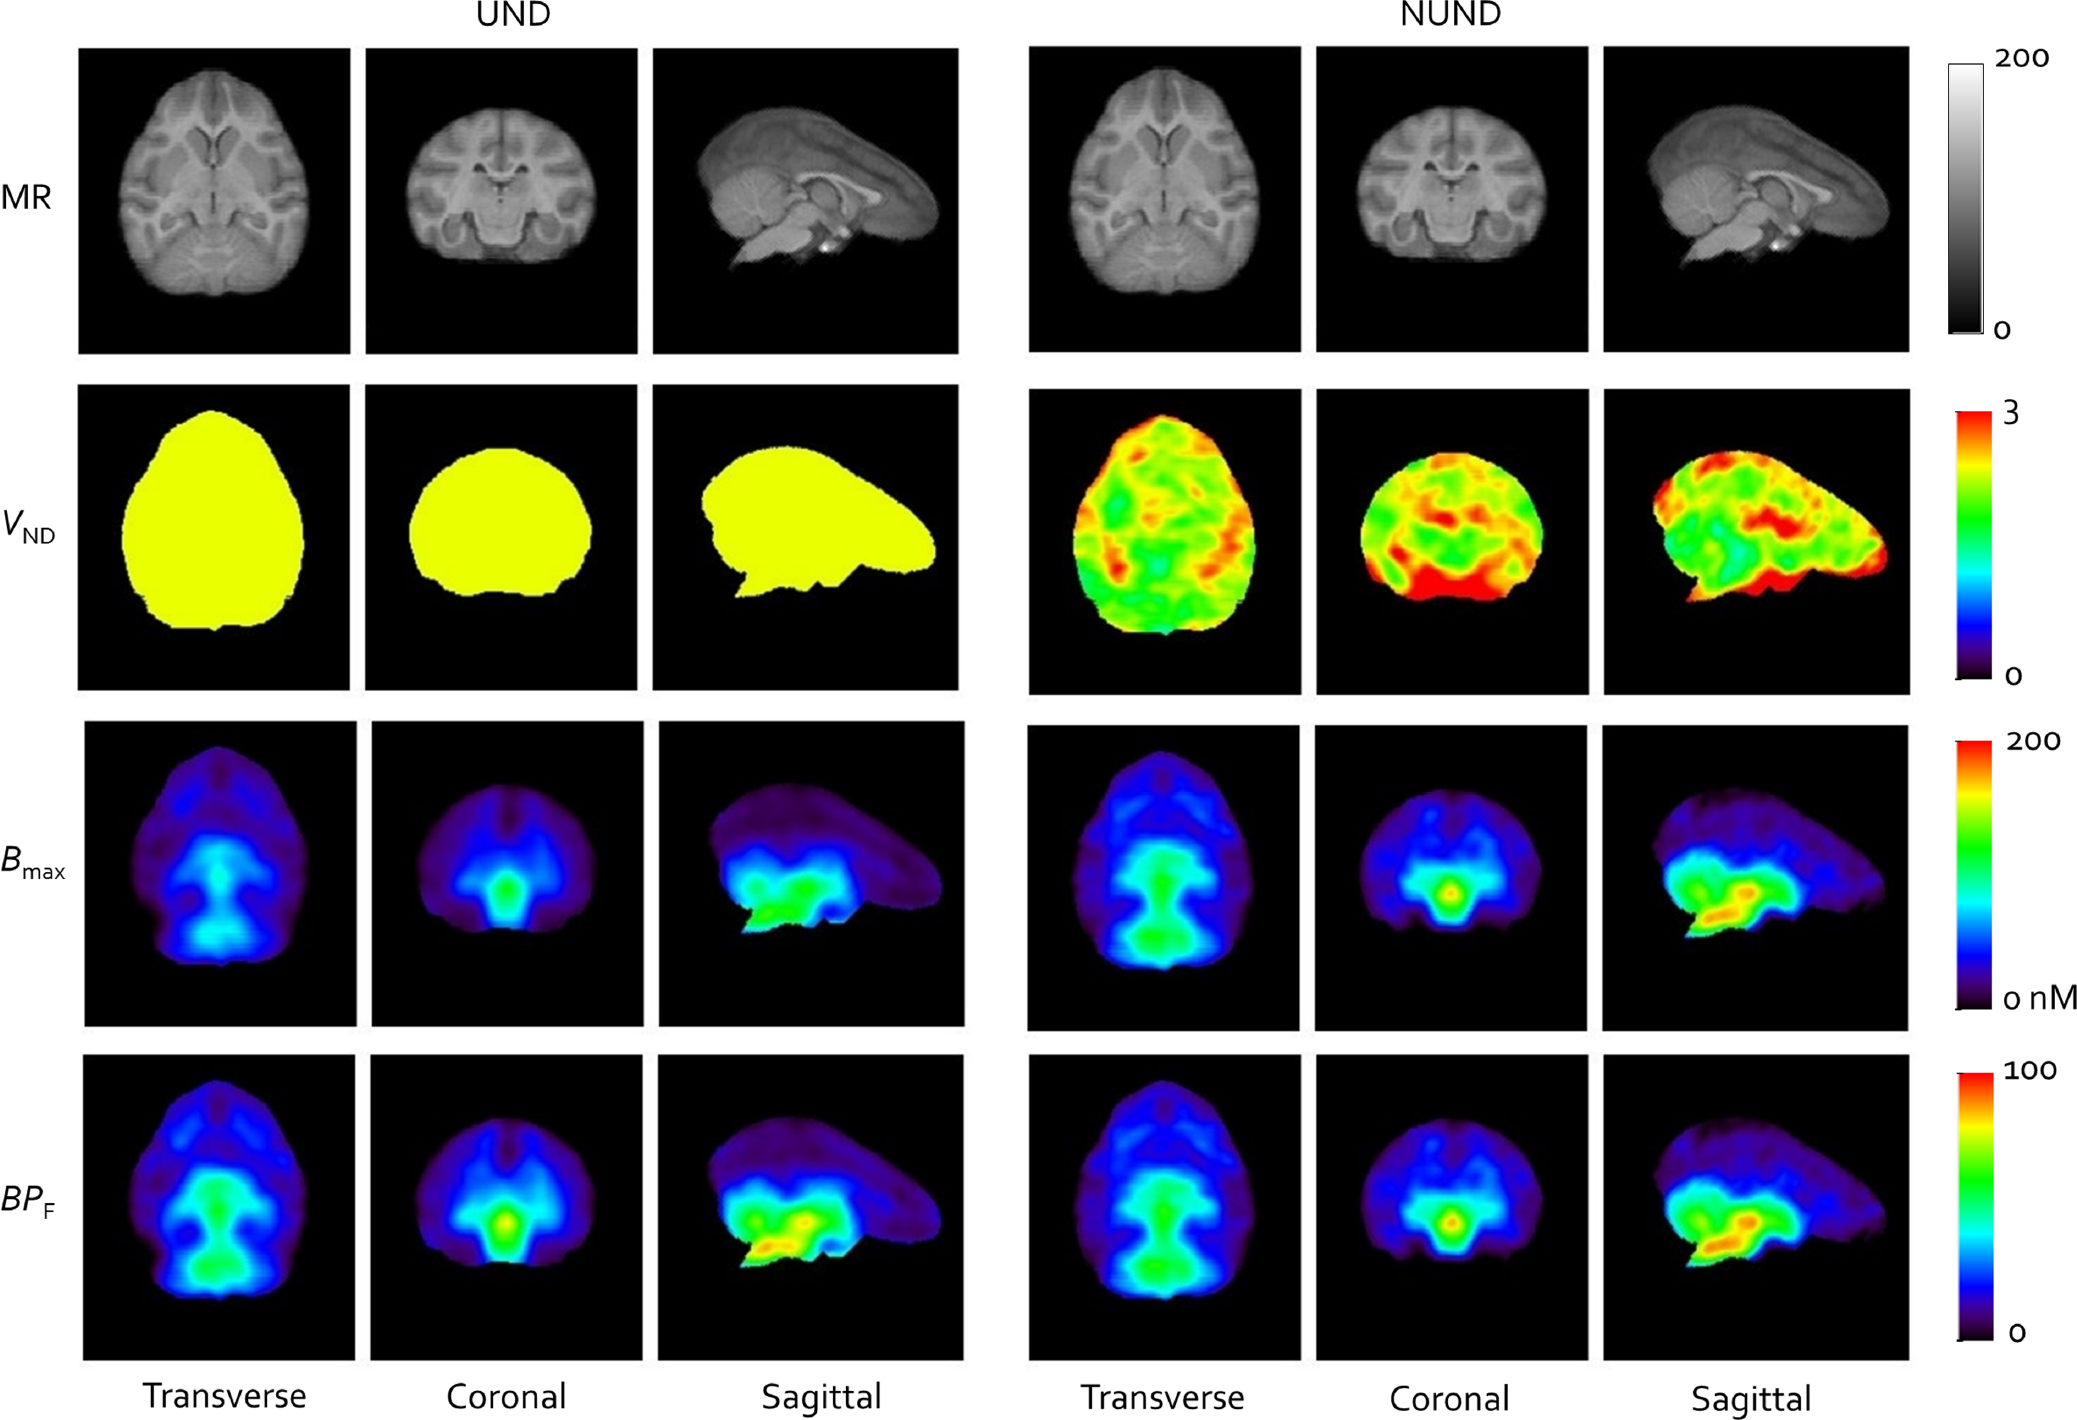
Parametric images of VND, Bmax, and BPF with MRI as an anatomic reference using POOLED analysis. Left: uniform VND assumption (UND): Kd = 1.49 nmol/L and VND = 2.35 mL/cm3. Right: nonuniform VND assumption (NUND): Kd = 1.87 nmol/L. BP, binding potential; MRI, magnetic resonance imaging; VND, nondisplaceable distribution volume.
Regions of interest were applied to the parametric images to extract average values of Bmax and VND to compare with their counterparts from ROI analysis under NUND. Both ROI and voxel-based analysis gave Kd values of 1.87 nmol/L from the POOLED analysis, and among 24 variables (12 regional Bmax and 12 regional VND), the maximum absolute difference between ROI and voxel-based values was 4.8% and the average of absolute differences was 2.1%. The regression between ROI and voxel values gave R 2 = 0.91 with slope =1.01 for VND, and R 2 = 0.99 with slope = 0.97 for Bmax.
Given the statistical improvement of NUND over UND from the F test and the overall consistency of ROI and voxelwise analyses, the final estimate of Kd was 1.87 nmol/L, which was highly consistent with the reported in vitro values of IC50 = 1.99 nmol/L and Ki = 1.15 nmol/L. 13
DISCUSSION
In this study, we have shown a new approach for measurement of Bmax and in vivo Kd of a radiotracer. This approach used one continuous B/I administration of the labeled tracer and two infusions of its unlabeled counterpart. An iterative linear/nonlinear alternating fitting method was used, which involved global constraints on Kd and optionally on VND. This allowed voxel-based analysis to be computationally practical, to produce Bmax images of high quality. This paradigm was successfully applied to the new GlyT1 tracer 18F-MK6577. Two features differentiate our new method from previous neuroreceptor studies used to measure Bmax and Kd in viVo.16–19,28 First, multiple (three in this study) B/I injections were performed during one continuous scan, instead of multiple scans, taking advantage of the fast kinetics of this tracer. Second, this approach was applied to a target where no suitable reference region was present, and VND was treated as an additional parameter to be estimated in the analysis.
In our analysis, several assumptions were made. First, we assumed that Kd is identical throughout the brain. This assumption is generally accepted, unless there is evidence of multiple binding sites in different regions. Note that even if the tracer binds to one site throughout the brain, different levels of endogenous glycine could cause differences in apparent Kd throughout the brain (see below). Second, we allowed for nonuniform VND across regions. This is an unusual assumption in the receptor imaging literature, usually because there are not sufficient data to prove otherwise. With our baboon data, we were able to show higher VND in white-matter regions. Such a difference is not unexpected, due to the different lipophilicity of white matter compared with gray matter, which can greatly affect partitioning of lipophilic tracers. Finally, we made specific simplifying assumptions in the modeling with regard to (1) cold and hot MK6577 concentrations reaching a constant ratio equaling the cold:hot infusion rate ratio and (2) negligible effect of residual cold MK6577 from the first cold dose. The impact and validity of these assumptions were evaluated by simulation (see below).
Here, we have used Bmax to identify the concentration of GlyT1 without taking into account any occupancy of GlyT1 by glycine. For baseline scans, this term should more properly be denoted as Bavail. However, with subsequent blockade by mass doses of MK6577, the fraction of receptors occupied by glycine will decline. Assuming no change in free glycine during these experiments, strictly we would estimate the total transporter (Bmax) but the estimate of Kd would be increased by the presence of glycine to a value of
As mentioned above, we assumed that Kd is uniform throughout the brain, a common assumption used in PET studies. This is based on the specific assumptions that there is one specific binding target for the tracer, it exists in only one affinity state, and occupancy of GlyT1 by glycine is uniform throughout the brain. In principle, our analysis could have been extended to perform a regional (or even voxelwise) estimation of Kd. However, reliable estimates of Kd can only be obtained in regions with high Bmax. Further, given the need to also determine VND, we believe nonuniform Kd analysis would be better suited for a system with accurate reference region data.
In conventional cases where a reference region exists, researchers explicitly or implicitly assume VND to be equal to VT in the reference region, and assume it to be constant throughout the brain. For GlyT1, based on the reported human study 15 and our current findings, there is no appropriate reference region for 18F-MK6577. Thus, in our current analysis, there were three parameters to estimate: Bmax, Kd, and VND. The computational demands of the voxelwise approach were addressed by the proposed iterative linear/nonlinear alternating fitting method. This approach gave consistent results between ROI and voxel fits, and generated high quality Bmax images.
We evaluated the uniformity of VND by allowing it to vary on a regional or voxel level. Based on the result of the F-test from the ROI analysis comparing fits with uniform versus non-uniform VND, nonuniform VND was indicated by the data. One concern in using the F test was that the dependent variables in the fit were VT values for each ROI, and these values had correlated noise due to the use of the same plasma data. The parametric VND images (Figure 4) showed higher values mainly in CSF and white matter. Due to the limited resolution of the HR+ scanner, careful evaluation of VND uniformity should also include partial volume correction.
Voxelwise analysis was performed on all brain voxels, based on a mask generated from the MR template. Therefore, this analysis included regions not included in the ROI analysis, such as white matter and CSF. Thus, data from those regions contributed to Kd (and global VND) estimation. Note, however, that the parametric images showed CSF and white matter Bmax values were low, consistent with little or no GlyT1 in these regions. Regions with low Bmax values will have only a minor effect on Kd estimation, since the VND term will dominate the measurement (see equation (11)).
In comparison with our method that only used equilibrium data, Delforge and his colleagues employed an approach that used all data to estimate in vivo Kd. Briefly, they gave multiple bolus injections with hot and/or cold compound during one experiment, and fitted the entire TAC to the full nonlinear differential equations for hot and cold compounds. This allowed the estimation of the association and disassociation rate constants, kon and koff, and the determination of Kd.18,19 That analysis required the assumption that the entire time course of cold plasma concentration could be calculated by scaling plasma data from a hot injection. In comparison, our paradigm used B/I injections to reach equilibrium, and used only the equilibrium concentrations (equation (11)), i.e., it used less data and estimated less parameters. Further, the new approach depends only on the assumption that hot and cold concentrations reached a constant ratio during the equilibrium periods, i.e., a constant ratio of hot-to-cold is not assumed during the approach to equilibrium. This assumption allowed us to deduce the cold ligand concentration in plasma by scaling the hot concentration by the ratio of infusion rates of cold and hot compounds.
To evaluate the validity of our equilibrium assumption, we performed a simulation using a nonlinear nontracer compartmental model as in the multi-injection method. 19 Since the second and third infusions in our study were cold-only infusions, we had to assume that the entire time course of a cold-only bolus injection could be inferred by scaling the time course of a bolus hot injection. This latter assumption is challenging since the delivery of a high mass dose will affect the whole-body distribution volume, and thus alter uptake and clearance kinetics of the compound. Based on the 2-compartment model fits to the baseline curves (0 to 120 minutes), and using the Bmax value obtained from our analysis, we generated a set of ideal parameters (K1, k2, kon, koff, and Bmax). We then used the four measured input functions, from which the cold input functions were generated by scaling the hot data. Using these hot and cold input functions, we simulated TACs for the bound and free fractions separately for both cold and hot compounds using four differential equations. 19 We found that this set of parameters showed much slower displacement than that actually measured, i.e., the transition between equilibrium periods (Figure 3) was much slower than that found with the real data. We thus scaled kon and koff up by a factor of 10 in period 2 to match the measured curves. Note that this effect has been seen previously, where kinetics in the blocking state are accelerated compared with the tracer-only state. This can be explained by radioligand rebinding in a relatively isolated compartment referred to as the synaptic barrier,29,30 that the koff parameter estimated from the tracer-only part of the data was unreliable, or that an extra nonspecific compartment was needed (i.e., k5≠0, k6≠0 in Delforge's model 31 ). We then compared the ratio of cold/hot concentrations during the equilibrium periods to that predicted by the ratio of the cold/hot infusion rates. Using the simulated curves in the cerebellum based on the four input functions, in equilibrium period 2, the discrepancy between the cold/hot ratio in plasma relative to cold/hot infusion rate was 8± 16%, and the difference of cold/hot ratio in free and bound compartments relative to input compartment was 11 ±7% and 16 ± 13%, respectively. This suggests that equilibrium between cold and hot compounds was not quite attained, even though the % change/hour in the tracer level was small. It is likely that if we had allowed the cold infusions to last longer than 90 minutes, this discrepancy would have been reduced.
In the experimental design and data analysis, we ignored the impact of residual cold compound from cold infusion 1 clearing during cold infusion 2. We used the simulation described above to examine the potential bias by simulating studies with a 4:1 ratio of cold concentrations between the second and first cold infusions. To simulate this, the B/I input curve was used to generate a bolus curve using equation (5B) in Watabe et a/, 32 from which the clearance phase after the end of cold infusion 1 could be calculated. The average VT during the third equilibrium period was overestimated by less than 1% by ignoring the clearance from cold infusion 1. Thus, the combination of rapid tracer clearance, the 4:1 ratio of cold infusion rates, and the high occupancy in third infusion stage caused this effect to be negligible.
In Table 2, it is interesting to note that the Kd estimated from the POOLED analysis did not fall between the Kd values obtained from the individual Kd analysis. Given the nonlinearity of equation (11) and the use of least squares fitting, this is certainly mathematically possible, especially if there are interanimal differences in Kd. The POOLED Kd value was quite close to that obtained from baboon B1, which may be due to the fact that the occupancies used in the B1 study were closer to the 50% occupancy point (Table 1), so that baboon B1 provided more information about Kd than baboon B2.
When analyzing data from the two animals separately, we estimated Kd values of 1.52 and 3.14 nmol/L, based on the parametric fit. Bmax and VND images of the two animals had similar distributions, but with different ranges. Further, the BPF values were more similar between the animals (Table 3). Although measurements of Kd are typically quite variable, we investigated whether specific factors could have contributed to these differences. Both animals were female, but they varied in weight (B1 13.0 and B2 23.9 kg) and slightly in age (B1 8.1 and B2 8.9 years). Another potential difference lay in the fact that the designed occupancy levels were different for the two animals (Table 1). Thus, based on the optimal design study, 33 the precision of parameter estimation depends on the experimental conditions. Measurement errors, such as errors associated with specific activity (SA), may introduce various magnitudes of errors in the Kd and Bmax estimates. 18 For example, examination of equation (11) shows that a 10% positive bias in SA would introduce a 10% negative bias in both Bmax and Kd. Variability in SA between experimental periods would introduce different errors in the parameters, depending on the occupancy levels in each period.
With knowledge of the in vivo Kd, the mass dose to maintain tracer levels can be determined. Specifically, for a tracer dose, the free mass concentration in plasma MFP (nmol/L) should be less than a small fraction (a) of Kd, i.e., to cause negligible occupancy.

To relate MFP to the injected mass dose Dm (μg), we first determine the standard uptake value in plasma (SUVP) at a suitable time (40 to 90 minutes after injection) from a human bolus study:

Here, D is the injected hot dose (kBq) and W is the subject weight (Kg). Equation (16) can be rearranged to determine MFP from Dm, accounting for free fraction and molecular weight (MW):
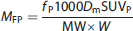
Inserting (17) into (15) yields:
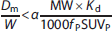
Setting a = 0.01 and MW= 488.4 g/mol, assuming human and baboon Kd values are identical, and taking fP and SUVp values from preliminary human data (fP = 0.06, SUVp = 0.2), the suggested tracer dose limit for a bolus MK6577 injection for human studies is < 1 μg/kg.
CONCLUSION
We developed a multi-infusion paradigm of radiolabeled and unlabeled MK6577 and an iterative linear/nonlinear alternating fitting method for the determination of a global estimate of in vivo Kd, and to produce Bmax images for tracers without a reference region. Voxel-based analysis gave high quality parametric images. The in vivo Kd was estimated to be 1.87 nmol/L for the GlyT1 tracer for 18F-MK6577. The rank order of measured GlyT1 distribution (parametric Bmax) was high in the brainstem (133 nmol/L), medium in the cerebellum (83 nmol/L), and low in the cortex (30 nmol/L), which agreed reasonably well with regional GlyT1 Bmax values determined in vitro. Allowing the nondisplaceable binding (VND) to vary between voxels provided a better description of the data. The proposed paradigm is suitable for 18F-labeled tracers with fast kinetics.
Footnotes
The authors declare no conflict of interest.
ACKNOWLEDGMENTS
The authors would like to thank the staff of the Yale PET Center. This publication was made possible by CTSA Grant Number UL1 TR000142 from the National Center for Advancing Translational Science (NCATS), a component of the National Institutes of Health (NIH). Its contents are solely the responsibility of the authors and do not necessarily represent the official view of NIH.