
Abstract
Imaging heterogeneous cancer lesions is a real challenge. For diagnosis, histology often remains the reference, but it is widely acknowledged that biopsies are not reliable. There is thus a strong interest in establishing a link between clinical
INTRODUCTION
To better understand a complex disease or to fully evaluate the impact of a drug, there is a strong interest in establishing a link between clinical
Another major source of contrast for
To derive histology-resembling images from multiparametric MRI maps, 9 several techniques have been used including classification algorithms (i.e., supervised algorithms, such as linear discriminant analysis (LDA) 10 or support vector machines 11 ) and clustering algorithms (i.e., unsupervised algorithms, such as k-means or hierarchical clustering 12 ). Supervised algorithms require a training data set, but histologic training samples are not always available (e.g., biopsy in the brain after a stroke is not feasible). Unsupervised algorithms thus appear more attractive. In medical imaging, the k-means and other clustering approaches have been evaluated.10,13 However, there is little systematic guidance associated with k-means methods to address issues such as the number of clusters that best explain the data, which clustering method should be used, and how outliers should be handled. In addition, k-means methods can hardly assess the uncertainty on voxel assignments to each detected cluster, precluding the possibility of probabilistic prediction for new data. To overcome these limits, Fraley and Raftery 14 developed an unsupervised clustering algorithm to perform cluster analysis based on probabilistic mixture models. The underlying probabilistic models can then be used to evaluate the uncertainty of voxel assignments and decide which models yield the best predictions. While there is a growing interest for such strategies in several domains, model-based clustering approaches have not been evaluated in the context of multiparametric MRI.
In this study, our aim was to evaluate whether clusters with defined histologic properties can be obtained based on an unsupervised analysis of microvascular MRI data. Microvascular MRI data were obtained from two models of glioma, C6 in Wistar rats (C6/Wistar) and F98 in Fischer rats (F98/Fischer). A combination of a manual selection of the region of interest and of an unsupervised clustering analysis is proposed to focus on tumor characterization. The identified clusters, defined by their MRI features, were found to correspond to histologic features. At a larger scale, the cluster composition of a given ROI, i.e., a signature of the intratumoral structure, could be used to characterize tumor models as histology does.
MATERIALS AND METHODS
The study design was approved by the local committee for animal care and use (C2EA-04: ‘Comité d'éthique en expérimentation animale GIN’). Experiments were performed under permits (n°380820 for CR and A3851610008 for experimental and animal care facilities) from the French Ministry of Agriculture.
Animal Model
The C6 cells (10
5
cells, ATCC: CCL-107) and F98 cells (10
3
cells, ATCC: CRL-2397) were respectively implanted in the right caudate nucleus (coordinates from bregma: AP = 0, ML = 3.5, DV = 5.5mm) of male Wistar (
In Vivo Experiment
Magnetic resonance imaging was performed at 4.7 T (Avance III console; Bruker, Germany; IRMaGe MRI Facility) between 21 and 24 days after tumor implantation. Animals were anesthetized (5% isoflurane for induction), intubated and subsequently mechanically ventilated with 2% isoflurane in 80% air-20% oxygen using a rodent ventilator (SAR-830/P; CWE, Ardmore, PA, USA). The femoral vein and artery were equipped with a catheter to collect blood samples. Partial pressures of O2 and CO2 of blood samples were determined with a blood gas analyzer (ABL 510, Radiometer, Copenhagen, Denmark). Individual values for each animal were calculated as the mean of pre and post MRI values. The tail vein was equipped with a catheter to deliver MRI contrast agents. Before the MRI session, animals received an intravenous injection of pimonidazole (60 mg/kg; Chemicon International; Temecula, CA, USA) diluted in saline (60mg/mL). Pimonidazole is a 2-nitroimidazole reductive chemical probe that undergoes reduction below a partial pressure of O2 of ~ 10mm Hg and can then be immunohistochemically detected to assess tumor hypoxia. 16 During the whole MRI session described below, the rectal temperature was monitored and maintained at 37.0°C. Two hours after pimonidazole, animals were euthanized under anesthesia with an intracardiac injection of KCl 2 mol/L. Brains were quickly removed, frozen in −40°C isopentane, and stored at −80°C until processing.
Magnetic Resonance Imaging Session
After careful shimming, the following imaging sequences were performed. Anatomic imaging was performed with a T2-weighted (T2W) spin-echo sequence (repetition time/echo time (TR/TE) = 4,000/33 ms, voxel size = 117 × 117 × 1,000μm) to determine tumor volume. The apparent diffusion coefficient (ADC) was mapped using a spin-echo echoplanar imaging sequence (TR/TE = 3,000/28.6 ms, three orthogonal diffusion directions, b ≈ 0 and b = 900 seconds/mm2, voxel size = 117 × 117 × 1,000 μm). Cerebral blood flow (CBF) was determined using continuous arterial spin labeling (spin-echo echoplanar imaging, TR/TE = 4,500/17.2 ms, labeling duration =4 seconds, post-labeling delay = 0.2 seconds, 20 label/ control pairs, voxel size = 117 × 117 × 1,000 μm). T, of brain tissue was determined using an inversion recovery sequence (spin-echo echoplanar imaging, TR/TE = 1,000/20 ms, 25 inversion times: TI = 100–3,700 ms, voxel size = 117 × 117 × 1,000 μm). Tissular oxygen saturation (StO2) maps were estimated using a multiparametric qBOLD approach as previously described.17–19 A T2 map was obtained using a multiple spin-echo sequence (28 echoes, TR/TE = 2,300/12–336 ms, voxel size = 234 × 234 × 1,000μm). A high resolution T2* map was obtained from a three-dimensional multiple gradient echo sequence (25 echoes, TR/TE = 100/3–87 ms; voxel size = 117 × 117 × 200μm). A cerebral blood volume (CBV) map was obtained using a steady-state approach. 20 A multiple gradient echo sequence (26 echoes, TR/TE = 6,000/3.5–78.5 ms, voxel size = 234 × 234 × 1,000 μm) was performed before and 20 seconds after an intravenous injection of ultrasmall superparamagnetic iron oxide nanoparticles (P904: 200μmoles of iron/kg body weight; Guerbet SA, France) flushed with 250μL of saline. The vascular wall integrity was assessed using a dynamic contrast-enhanced MRI approach as previously described. 21 Briefly, 60 T,-weighted, spin-echo, images (TR/TE = 800/4.2 ms, voxel size = 117 × 117 × 1,000μm; 15.6 seconds per image) were acquired. After acquisition of 10 baseline images, a bolus of Gd-DOTA (200 μmol/kg; Guerbet SA, France) was administered through the tail vein and flushed with 250 μL of saline. The image acquisition positions were identical for all MRI sequences.
Data Processing
Image processing was performed within the Matlab 7 environment (The MathWorks, Natick, MA, USA) using custom software. The CBF computation was based on the equations described in Alsop
Magnetic Resonance Imaging Data Analysis
For each animal, analyses were carried out on the MRI slice with the largest tumor area. Voxels were included in the analysis according to the following criteria: 0<ADC<2,500μm2/second, AUCGd-DOTA<510 6 a.u., 0<CBF<400mL/100g/minute, 0<CBV<20%, 0<StO2<100%. Beyond these ranges, values cannot be considered physiologically accurate. Meeting a single exclusion criterion led to an exclusion of the voxel from all maps. Three types of analyses were performed:
A whole-brain clustering. The brain was manually contoured on the T2w-image. All included voxels of all animals were pooled together and analyzed with a model-based clustering approach.
14
First, voxel values were standardized per parameter to minimize scale effects between parameters: standardized value = (voxel value — mean across all voxels)/s.d. across all voxels. Gaussian mixture modeling was then performed using the Expectation-Maximization algorithm implemented in the R package mclust.
14
Model choice and the optimal number of clusters were determined from the values for which the Bayesian information criterion reached a plateau
14
(Supplementary Figure S1). A ROI selection followed by an analysis of the mean ROI values. First, three regions of interest (ROIs: tumor, contralateral striatum, and contralateral cortex) were manually delineated on the T2w-image using hematoxylin-erythrosine slices as control. Based on our experience, this approach delineates the tumor core and thereby limits partial volume effect. Average values were computed across all animals for each ROI and each parameter. A ROI selection followed by a model-based clustering analysis. The included voxels of all animals and located in the three previously defined ROIs were pooled together for the clustering analysis described above with the optimal number of clusters (Supplementary Figure S2). A comparison study showed that Gaussian mixture models led to better segmentation of MRI images than hierarchical clustering or k-means methods (Supplementary Figure S3).
Brain Sectioning and Histology
For immunohistochemistry, coronal cryosections (20-μm thick) were cut along the entire striatum on a microtome (Leica, Nanterre, France). The closest sections to the MRI slice were subsequently examined. Histologic analyses were performed on three adjacent slices to allow comparison between labeling types. Hematoxylin-erythrosine staining was performed to characterize tumor cell density. Tumor hypoxia was determined using the Hypoxyprobe-1 kit (Chemicon International). Mouse anti-pimonidazole antibody was diluted
Tissue Type Prediction with Linear Discriminant Analysis
In each of the 78 ROIs (three ROIs per animal: cortex, striatum, tumor; 26 animals), the contribution of each of the five clusters was computed. Thereby, each ROI was characterized by five values, representing the number of pixels belonging to each of five clusters. In addition, six classes were determined for all ROIs: C6 tumor, Wistar cortex, Wistar striatum, F98 tumor, Fischer cortex, Fischer striatum, with each ROI assigned to a single class. To evaluate the ability of ROI classes to be predicted by the clustering outputs, a LDA was conducted using a ‘leave-one-out’ cross-validation algorithm. In this algorithm, an ROI was removed from the list of all 78 ROI and LDA was performed to discriminate among the six classes based on ROI cluster composition. Using the results of LDA, a class was then predicted for each removed ROI (this step was repeated for each ROI). The fraction of correct predictions was eventually computed for each of the six classes. To further evaluate the contribution of each cluster and each MR parameter to the assignment prediction, the leave-one-out analysis was repeated but either one cluster or one MR parameter was removed for the analysis.
Statistical Analysis
Unpaired
RESULTS
Physiologic Controls
The tumor volumes were similar between tumor models (C6/Wistar: 85.1 ± 46.4 mm3 and F98/Fischer: 104.9 ± 28.0 mm3). Arterial blood gases were also similar between tumor models (C6/Wistar: PaO2 = 123.2 ± 20.0 mmHg, PaCO2 = 35.3 ± 9.7 mm Hg, PvCO2 = 38.6 ± 8.2 mm Hg; F98/Fischer: PaO2 = 126.4 ± 22.2 mm Hg, PaCO2 = 30.9 ± 6.4 mmHg, PvCO2 = 34.0 ± 8.8 mm Hg) except for the venous partial pressure of O2, which was lower in the F98/Fischer model (C6/Wistar: PvO2 = 54.4 ± 6.1 mm Hg; F98/Fischer: PvO2 = 40.6 ± 3.8 mm Hg). Arterial blood gases were within the normal physiologic range for isoflurane-anesthetized rats.
Microvascular Features of C6/Wistar and F98/Fischer Differ
Three ROIs (cortex, striatum, and tumor) were manually drawn on the T2-weighted image and transferred to each MRI map (Figure 1A). For each ROI, the cumulated number of voxels across all animals is as follows: tumor,
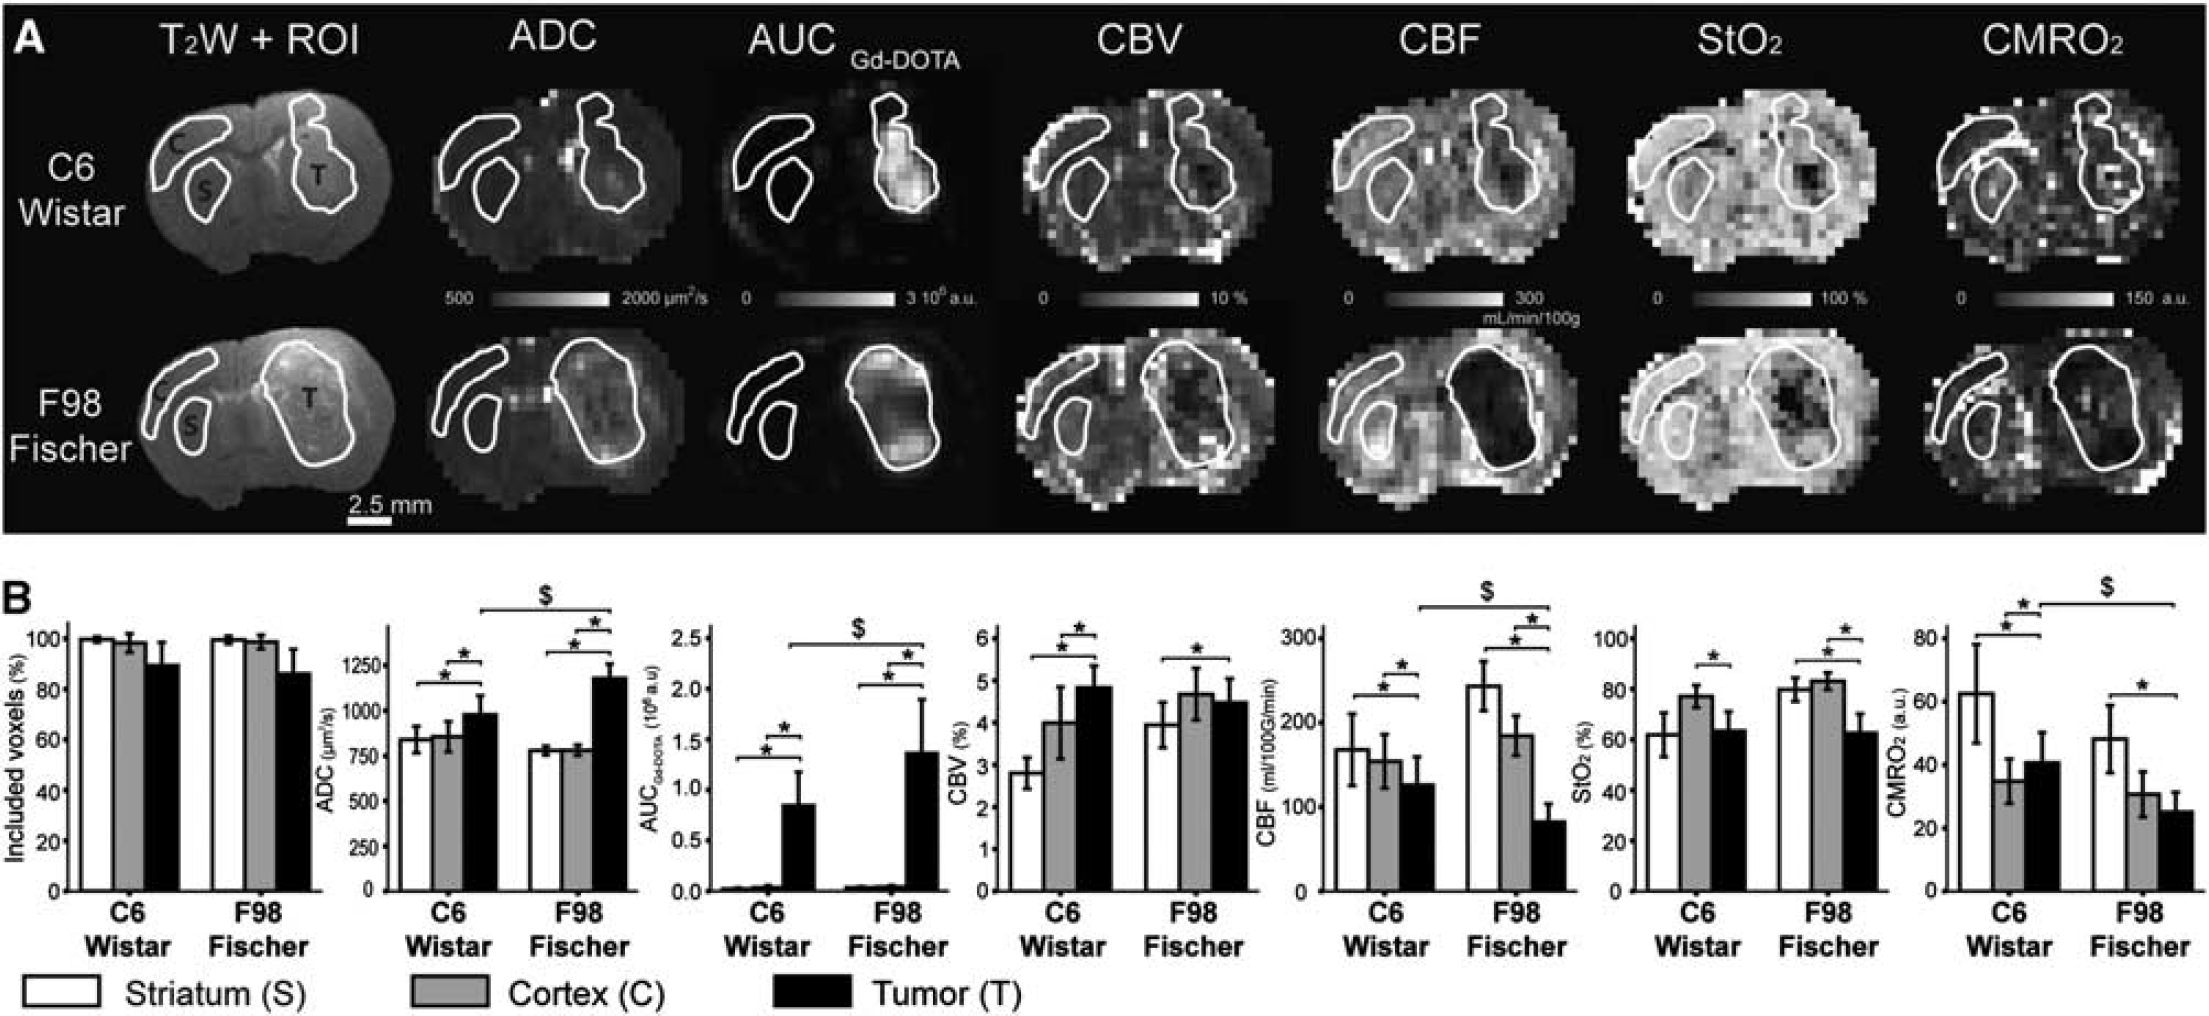
Multiparametric magnetic resonance imaging (MRI) in C6/Wistar and F98/Fischer models of glioma. (
A comparison between mean ROI values allows to clearly discriminate between the tumor and the contralateral tissue. Both tumor models have increased ADC of water, vessel wall permeability (AUCGd-DOTA), CBV fraction, and decreased CBF, StO2, and CMRO2 in comparison with at least one contralateral ROI (Figure 1B). Between the C6 and the F98 gliomas, ADC, AUCGd-DOTA, CBF, and CMRO2 differ whereas CBV and StO2 are similar. Some differences for CBV, CBF, and StO2 are also found in the striatum ROI between Fischer and Wistar rats.
Both tumors exhibit a strong spatial heterogeneity in most parametric maps (Figure 1A). For example, the F98 glioma clearly exhibits a low CBF in its center and a high CBF at its periphery. On average, the mean intra-ROI variability of MRI estimates is 1.8 to 44 times higher in the tumor ROI than in the contralateral striatum ROI (tumor versus striatum expressed as fold increase; C6: ADC = 3.0, AUCGd-DOTA = 43.4, CBV = 4.0, CBF = 1.8, StO2 = 5.3, CMRO2 = 6.9; F98: ADC = 5.9, AUCGd-DOTA = 30.7, CBV = 2.4, CBF = 1.7, StO2 = 8.9, CMRO2 = 10.7). The data analysis based on mean values over ROIs masks this spatial heterogeneity. Note that the error bars in Figure 1B display the inter-animal variability and do not represent the intra-ROI variability.
The Distribution of Clusters is Spatially Structured
To enable tumor characterization, we used an unsupervised, model-based, clustering analysis, which integrates the six quantitative MRI parameters (ADC, AUCGd-DOTA, CBV, CBF, StO2, CMRO2) to identify clusters of voxels sharing the same MRI characteristics. This analysis was first performed on all voxels of the brain slices, and then on voxels of the previously defined ROIs only, the data from both tumor models being pooled. In both analyses, the optimal number of clusters was determined using a Bayesian information criterion (Supplementary Figures S1C and S2A) and was estimated to five clusters. When taking into account all voxels of the brain slices, the resulting cluster distribution shows more diversity in the non-tumoral tissue than in the tumoral tissue (Supplementary Figure S1B).
When taking into account the voxels within the three ROIs, a visual inspection of the cluster distribution (Figure 2) and a quantitative analysis of this distribution (Figure 3) show spatially coherent groups of voxels assigned to a same cluster. Cluster
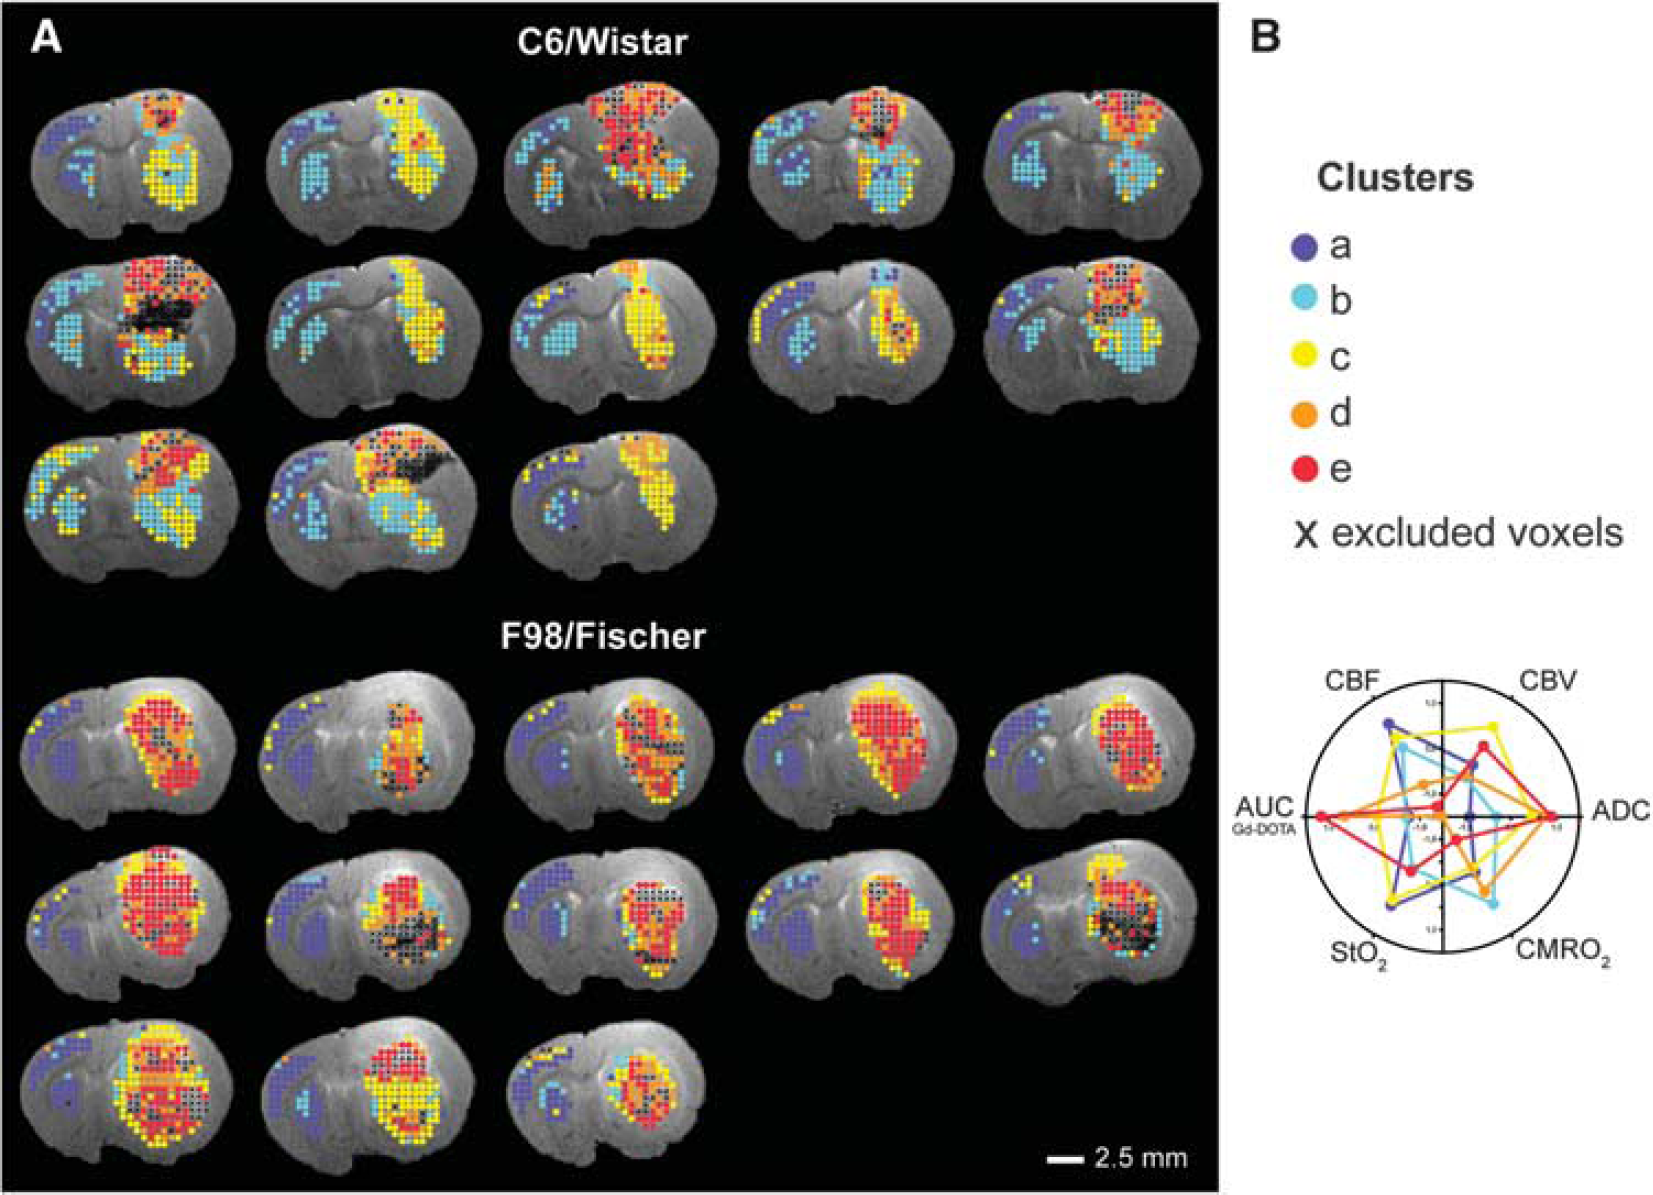
Cluster assignment within the region of interest (ROI) overlaid on the T2-weighted (T2W) anatomic image (
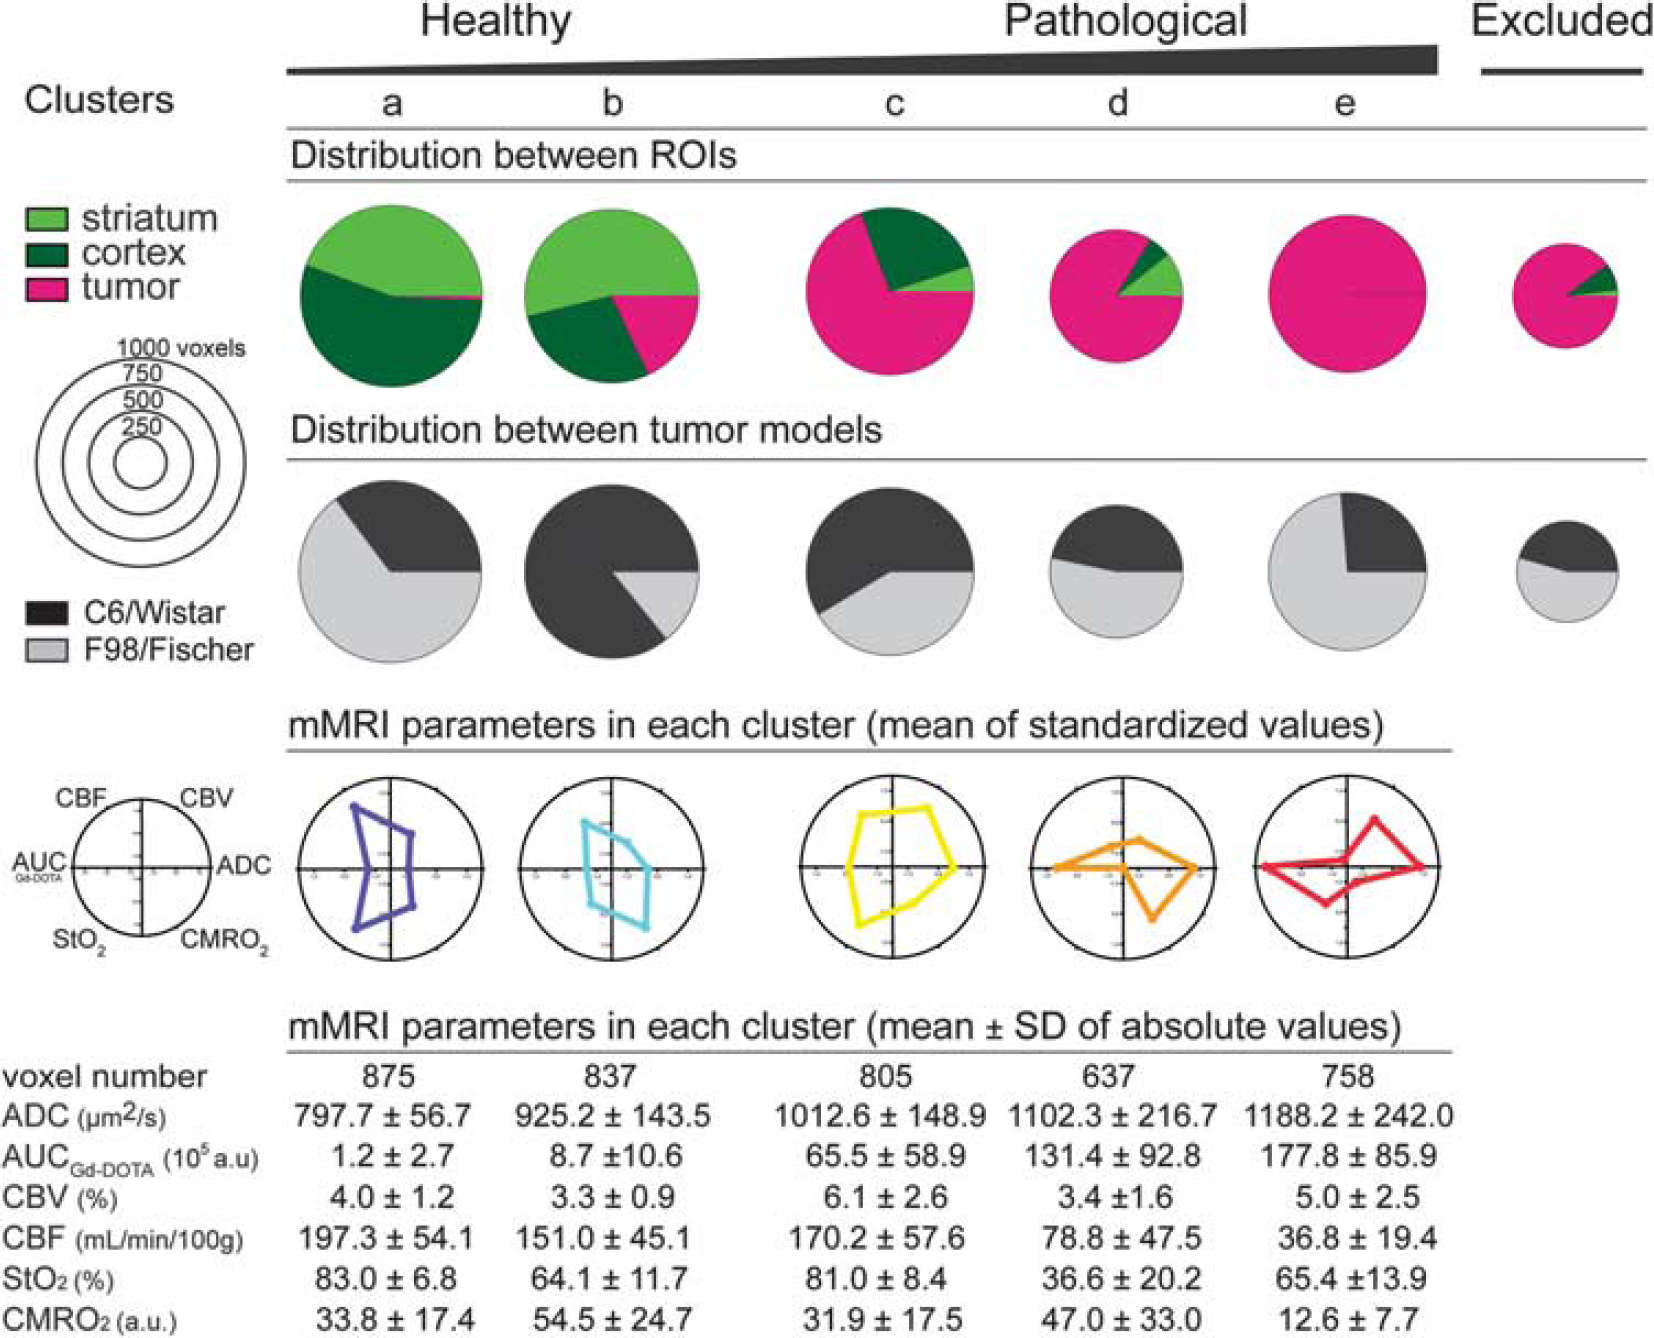
The five clusters are labeled from ‘healthy’ (voxels mainly located in the contralateral striatum and cortex regions of interest (ROIs)) to ‘pathologic’ (voxels mainly located in the tumor ROI) clusters. The green and pink pies represent the distribution of voxels assigned to a given cluster between the three ROIs. The black and gray pies represent the distribution of voxels assigned to a given cluster between the two animal models. The diameter of each pie graph is proportional to the number of voxels assigned to the cluster (a pie scale is displayed on the left). The web graphs represent the mean standardized value of each magnetic resonance imaging (MRI) parameter for each cluster. The table presents, for each cluster, the number of assigned voxels and the mean value of each MRI parameter (mean ± s.d.). Animal number = 26, C6/Wistar:
Mean quantitative values of each MRI parameter in each cluster are detailed in the table of Figure 3. Cluster
Regarding the distribution of each cluster in the two animal models, cluster
The cluster distribution in tumors is more heterogeneous than in contralateral tissues (Figure 2). Eight C6 tumors exhibit a bipolar pattern: the cortical part of the tumor (clusters
Each Cluster Corresponds to a Different Histologic Signature
Immunohistological analysis was performed to detect cells and necrosis (hematoxylin-erythrosine and DAPI), hypoxia (pimonidazole), and blood vessels (collagen IV).
In contralateral brain, clusters
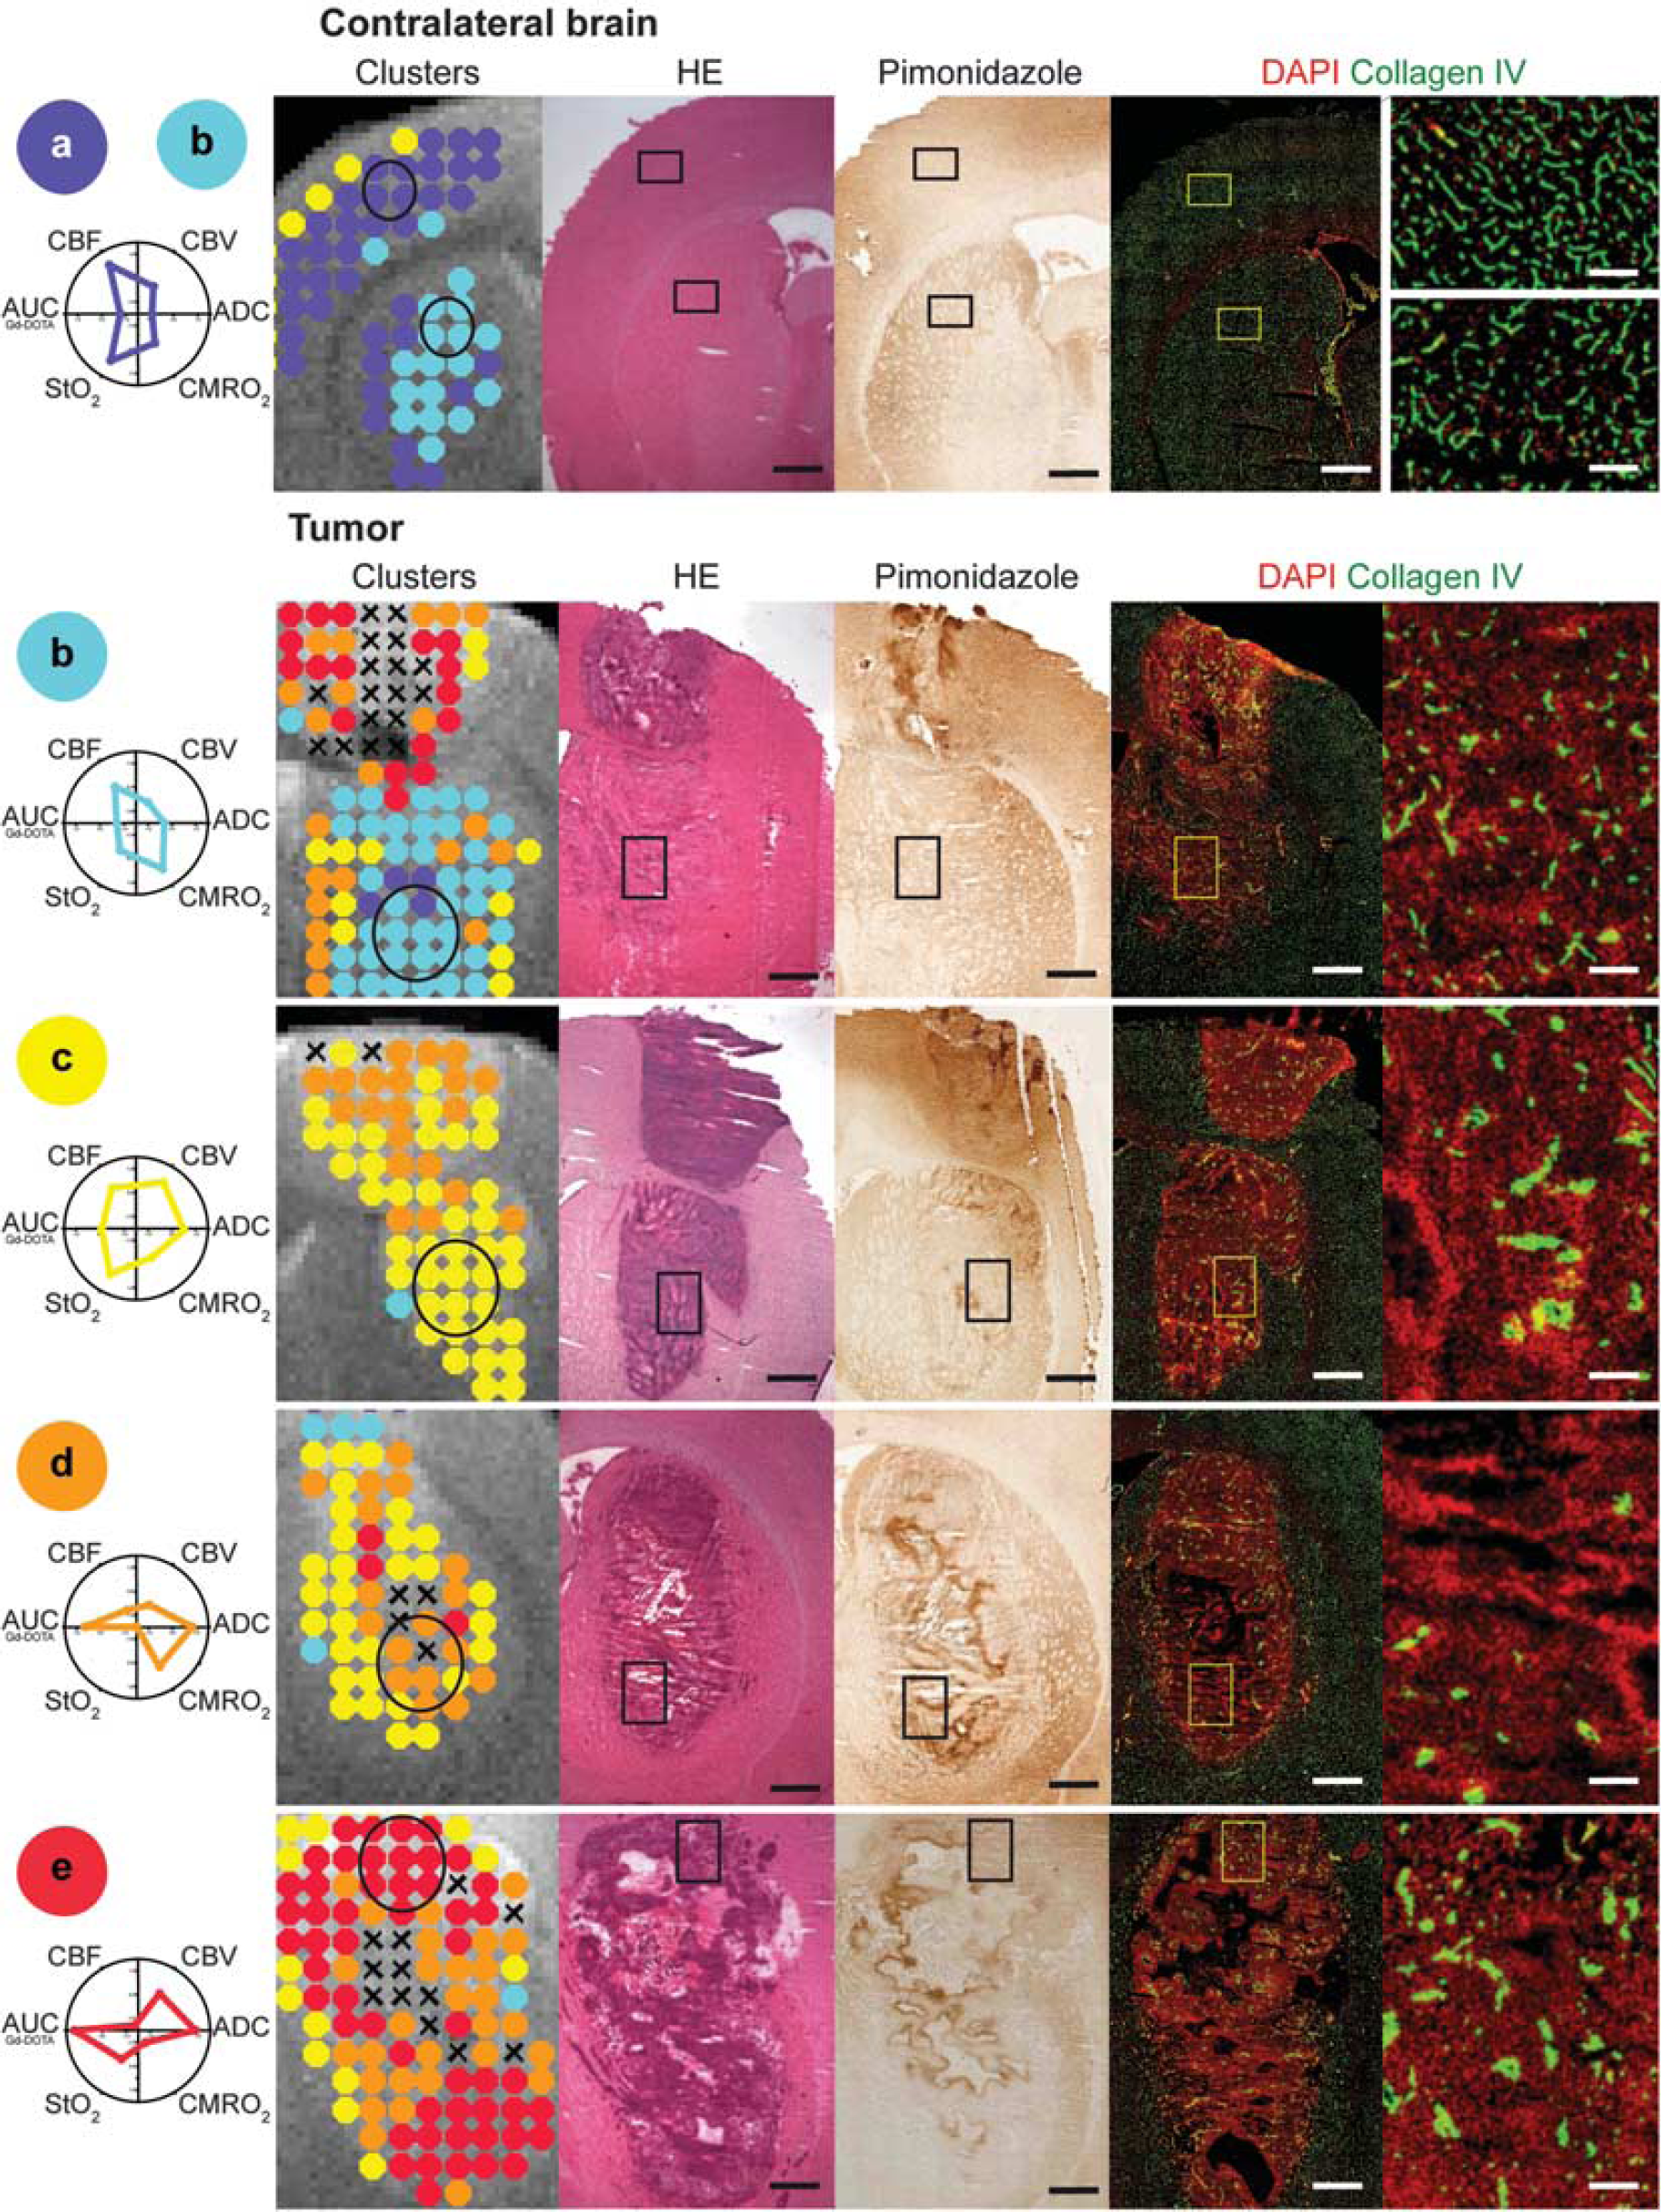
Histologic description of each cluster. To describe each cluster, a circle was drawn on the magnetic resonance imaging (MRI) map and the corresponding area is depicted as a rectangle placed on the three subsequent histologic sections (hematoxylin-erythrosine (HE), pimonidazole, and collagen IV/4′,6-diamidino-2-phenylindole (DAPI)). The last histologic section corresponds to a zoom in the previously mentioned rectangles. For sake of clarity, the mean standardized value for each MRI parameter is displayed below the cluster label. Cluster
Composition of Clusters within a Region of Interest Allows Tissue Type Prediction
Each ROI is characterized by its cluster composition and is classified into six classes (Wistar cortex, Wistar striatum, C6 tumor, Fischer cortex, Fischer striatum, F98 tumor). To evaluate mis-classification rates based on cluster composition, a cross-validation procedure was performed on all seventy-eight ROIs after applying LDA (Table 1). Among the 26 tumor ROIs, 11 out of 13 ROIs (84.6%) are correctly predicted for each tumor model. Tumor ROIs not correctly predicted (15.4%) are attributed to the other tumor model. Among the 52 healthy ROIs, 20 out of 26 ROIs (76.9%) are correctly predicted for the Wistar rat strain and 25 out of 26 ROIs (96.2%) for the Fischer rat strain. The prediction is less accurate for cortex ROIs (14 out of 26, i.e., 53.8%, are correctly predicted) than for the striatum ROIs (19 out of 26 ROI, i.e., 73.1%, are correctly predicted). Performing the clustering on the voxels from the two tumor ROIs did not change the level of prediction (data not shown).
Tissue type prediction based on the ‘leave-one-out’ procedure
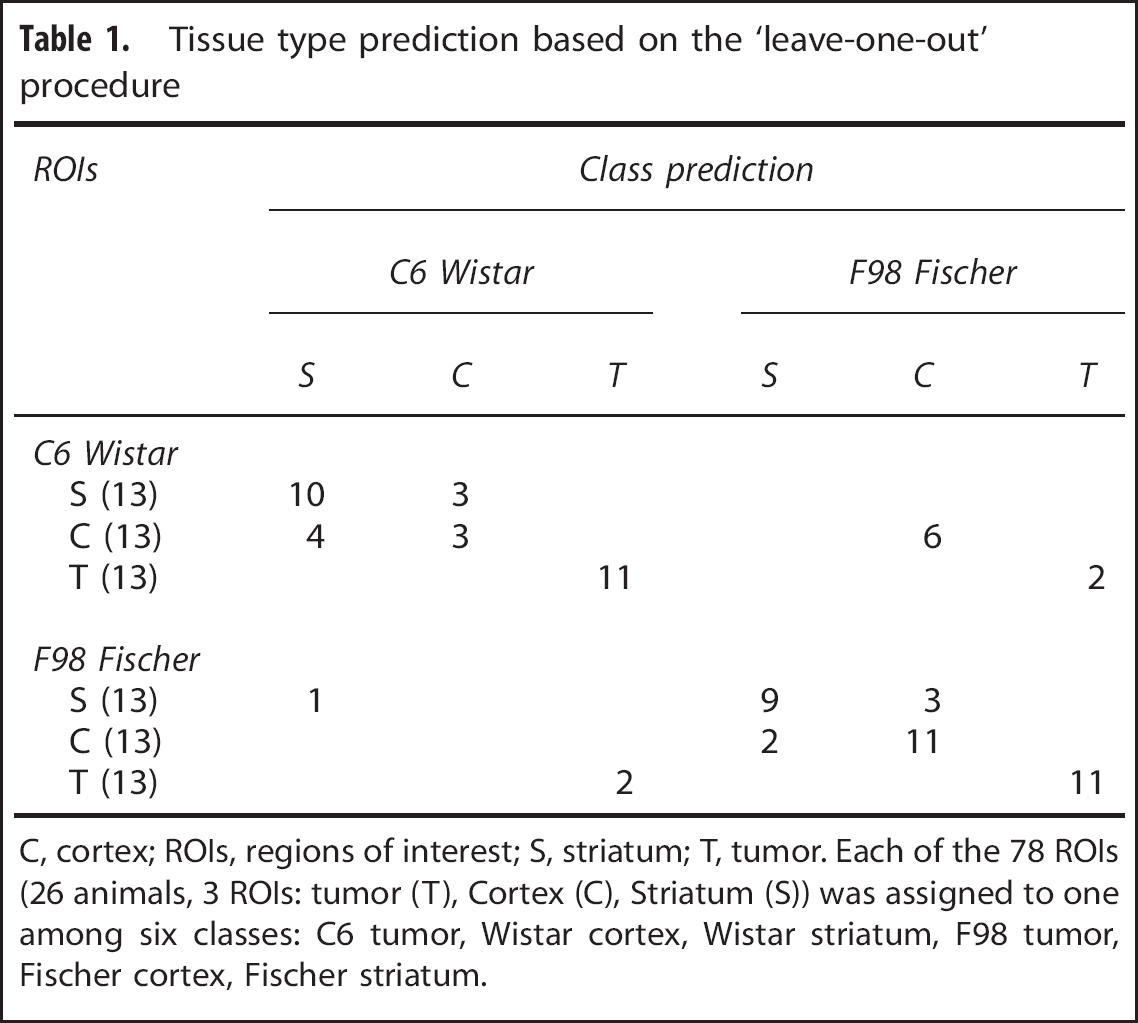
C, cortex; ROIs, regions of interest; S, striatum; T, tumor. Each of the 78 ROIs (26 animals, 3 ROIs: tumor (T), Cortex (C), Striatum (S)) was assigned to one among six classes: C6 tumor, Wistar cortex, Wistar striatum, F98 tumor, Fischer cortex, Fischer striatum.
We further explored the discriminatory power of each cluster and each MRI parameter for tissue prediction. Table 2 shows the classification accuracy when using all clusters and when removing a cluster from the analysis. Whatever the cluster removed, the overall classification is not improved. Similarly, Table 3 shows the classification accuracy when using all MRI parameters and when removing a MRI parameter from the analysis. Whatever the MRI parameter removed, the overall classification is not improved.
Classification power of each cluster on the classification
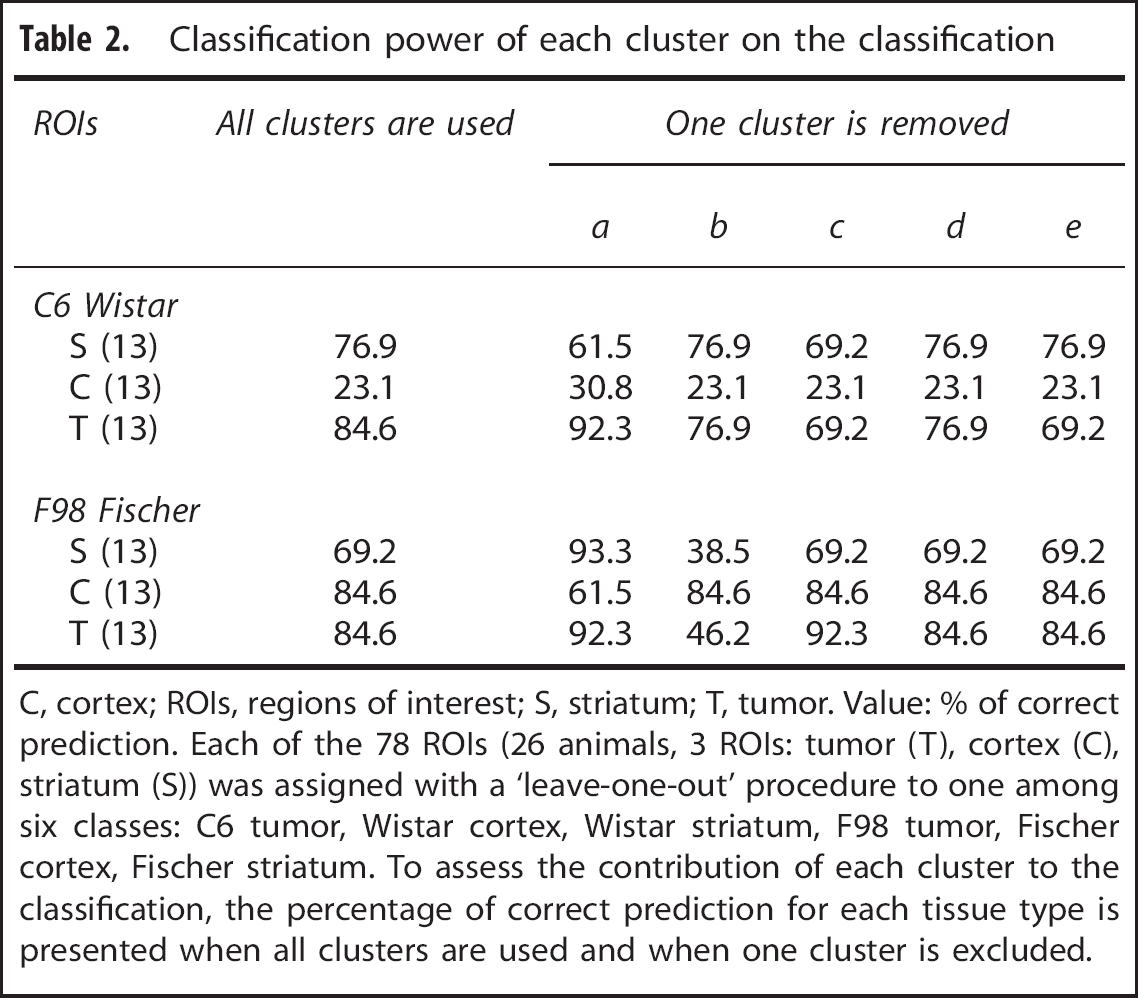
C, cortex; ROIs, regions of interest; S, striatum; T, tumor. Value: % of correct prediction. Each of the 78 ROIs (26 animals, 3 ROIs: tumor (T), cortex (C), striatum (S)) was assigned with a ‘leave-one-out’ procedure to one among six classes: C6 tumor, Wistar cortex, Wistar striatum, F98 tumor, Fischer cortex, Fischer striatum. To assess the contribution of each cluster to the classification, the percentage of correct prediction for each tissue type is presented when all clusters are used and when one cluster is excluded.
Contribution of each MRI parameter on the classification
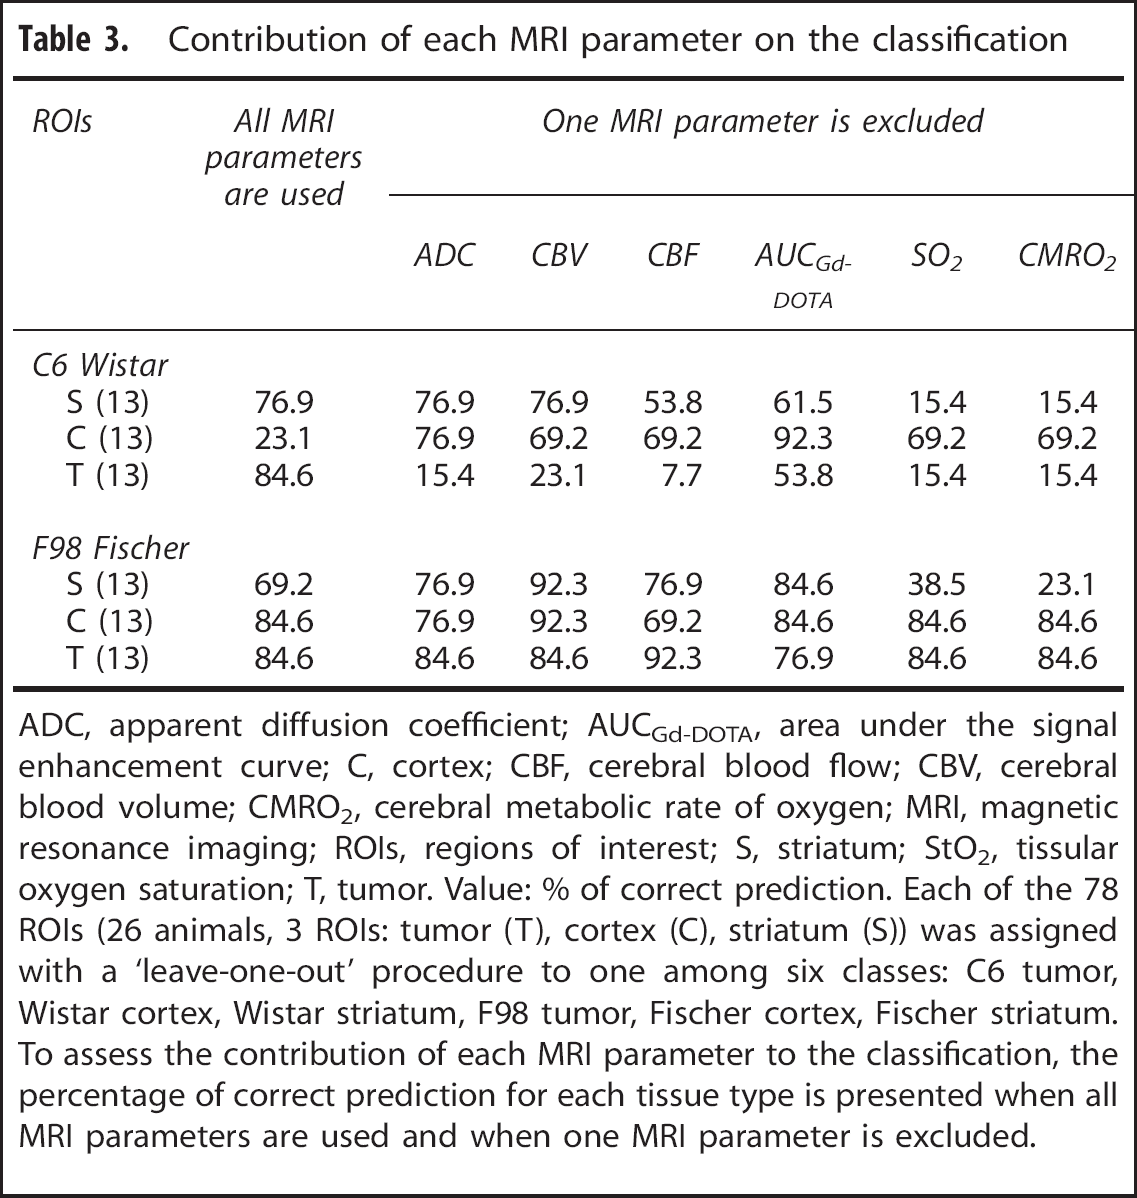
ADC, apparent diffusion coefficient; AUCGd-DOTA, area under the signal enhancement curve; C, cortex; CBF, cerebral blood flow; CBV, cerebral blood volume; CMRO2, cerebral metabolic rate of oxygen; MRI, magnetic resonance imaging; ROIs, regions of interest; S, striatum; StO2, tissular oxygen saturation; T, tumor. Value: % of correct prediction. Each of the 78 ROIs (26 animals, 3 ROIs: tumor (T), cortex (C), striatum (S)) was assigned with a ‘leave-one-out’ procedure to one among six classes: C6 tumor, Wistar cortex, Wistar striatum, F98 tumor, Fischer cortex, Fischer striatum. To assess the contribution of each MRI parameter to the classification, the percentage of correct prediction for each tissue type is presented when all MRI parameters are used and when one MRI parameter is excluded.
DISCUSSION
This study presents a combination of spatial selection and of unsupervised, model-based cluster analysis to integrate the large amount of information obtained with microvascular MRI in the context of brain tumors. The identified clusters, defined by their microvascular-based MRI features, correspond to different histologic features, and reveal an important intratumoral spatial structure. This suggests that the presence of a cluster within a tumor can be used to assess the presence of a tissue type within this tumor. At a larger scale, the cluster composition of a given ROI, i.e., a signature of the intratumoral structure, could be used to characterize tumor models as well as histology does.
Imaging complex cancer lesions, which are heterogeneous in space and time, is a real challenge. For tumor diagnosis, histology is the reference. However, several studies report that histologic diagnosis of glioma established after stereotactic biopsy, from a single point in the tumor, is associated with a substantial risk of inaccuracy. 24 Moreover, a biopsy cannot always be obtained: some tumors are not accessible to the surgeon and no repeated biopsies of a brain tumor are performed during the therapeutic follow-up.
To characterize the entire tumor in a non-invasive way, we propose the use of quantitative microvascular imaging. Indeed, it is well known that a developing tumor impacts vessel wall permeability, blood volume and flow, oxygenation and others physiologic parameters.25–29 Moreover, the physiologic links between CBF, CBV, StO2, CMRO2 are altered in tumors, as can be seen from the independent variations of perfusion estimates between clusters (Figure 3). Microvasculature is also a target for several anti-tumoral strategies. Beyond tumors, several brain diseases impact the microvasculature, such as stroke,30,31 Alzheimer,
32
or epilepsy.
33
Outside of the brain, several diseases, such as hypertension, diabetes impact the microvasculature as well. Quantitative microvascular imaging, which assesses both structural and functional aspects of perfusion, appears thus as a promising multiparametric MRI approach to obtain microvascular parameter-based
To obtain microvascular MR-resembling histology, 9 several approaches have used classification algorithms.10,11 They are however limited by the absence of an underlying statistical model, which prevents the use of probabilistic tools. In this study, we used an unsupervised, model-based, classification approach implemented in the software mclust. A comparison study provided evidence that mclust outperformed other clustering methods (k-means, hierarchical clustering, Supplementary Figure S3).
The use of model-based clustering on the entire brain led to a larger number of clusters in healthy tissue than in tumor. To focus on the tumor, we coupled spatial knowledge with the use of the clustering approach, as previously proposed with machine learning techniques.13,34–36 The conservative strategy used for tumor delineation in this study is not optimal. Instead of using a two-step approach (selection, clustering), further clustering strategies should directly combine spatial and physiologic informations. Such a combination should allow studying the tumor periphery, which cannot be properly estimated with manual delineation.
The use of contralateral tissue was the key to highlight tumor regions with mixed tumoral and healthy properties (cluster
The clusters defined with an unsupervised approach and using quantitative microvascular MRI characteristics were in line with the histologic features assessed in this study. This result relies on previously validated MRI methods. Indeed, the estimate of CBV was validated against histology, 38 the CBF against PET 39 and autoradiography, 39 the permeability against autoradiography, 40 the oxygenation against gas challenges 17 and pimonidazole. 19 As observed in the MRI maps, each parameter exhibits a different spatial distribution. This difference between spatial patterns is exploited by the unsupervised cluster analysis and yields the intratumoral structures reported in this study. Removing an MRI parameter from the analysis did not improve the overall tissue classification. Furthermore, as therapies can modulate all the measured MRI parameters,18,41,42 it therefore appears important to include them all.
In case of stereotactic biopsy performed for diagnostic tumor grading, a small piece of the tumor is characterized by a pathologist. The limits of this approach are well known: the small tumor sample may not arise from the most aggressive part of the tumor. Moreover, it may not represent the tumor heterogeneity. The cluster analysis proposed in this study could provide an
Design of homogeneous groups for preclinical pharmacological studies by removing tumors whose cluster composition is too far from the mean of the group or from a reference cluster data set. Previous reports have shown that two subtypes of the same tumor can indeed yield two different glioblastoma phenotypes Classification of tumors in patients, using a reference database; Evaluation of tumor evolution or tumor response after therapy, using the cluster composition of the tumor as the tumor signature.
The combination of spatial selection and cluster analysis can be used to structure the wealth of information gathered with multiparametric microvascular MRI. This approach, which highlights several types of pathophysiological features across two glioma models, is well suited for the characterization of tumor heterogeneity. Its translation to a clinical setting has a potential to ease tumor diagnosis, prognosis, and treatment follow-up.
Footnotes
The authors declare no conflict of interest.
ACKNOWLEDGMENTS
We thank Fondation ARC and ANR Imoxy for their financial support and the animal care facility of GIN, the IRMaGe facility, Yasmina Saoudi and Carole Carcenac, for their technical support. This work was partly funded by the French program ‘Investissement d'Avenir’ run by the ‘Agence Nationale pour la Recherche’; grant ‘Infrastructure d'avenir en Biologie Santé’ - ANR-11-INBS-0006.
References
Supplementary Material
Please find the following supplemental material available below.
For Open Access articles published under a Creative Commons License, all supplemental material carries the same license as the article it is associated with.
For non-Open Access articles published, all supplemental material carries a non-exclusive license, and permission requests for re-use of supplemental material or any part of supplemental material shall be sent directly to the copyright owner as specified in the copyright notice associated with the article.