
Abstract
The purpose of this study was to evaluate how cerebral blood flow and bolus arrival time (BAT) measures derived from arterial spin labeling (ASL) MRI data change for different hypercarbic gas stimuli. Pseudocontinuous ASL (pCASL) was applied (3.0T; spatial resolution = 4 × 4 × 7 mm 3 ; repetition time/echo time (TR/TE) = 3,600/11 ms) sequentially in healthy volunteers (n = 12; age = 30±4 years) for separate experiments in which (i) normocarbic normoxia (i.e., room air), hypercarbic normoxia (i.e., 5% CO2/21% O2/74% N2), and hypercarbic hyperoxia (i.e., carbogen: 5% CO2/95% O2) gas was administered (12 L/minute). Cerebral blood flow and BAT changes were quantified using models that account for macrovascular signal and partial volume effects in all gray matter and regionally in cerebellar, temporal, occipital, frontal, and parietal lobes. Regional reductions in BAT of 4.6% to 7.7% and 3.3% to 6.6% were found in response to hypercarbic normoxia and hypercarbic hyperoxia, respectively. Cerebral blood flow increased by 8.2% to 27.8% and 3.5% to 19.8% for hypercarbic normoxia and hypercarbic hyperoxia, respectively. These findings indicate that changes in BAT values may bias functional ASL data and thus should be considered when choosing appropriate experimental parameters in calibrated functional magnetic resonance imaging or ASL cerebrovascular reactivity experiments that use hypercarbic gas stimuli.
INTRODUCTION
Hypercarbic gas challenges are being used with increasing frequency to study cerebrovascular reactivity (CVR) in clinical populations,1–4 as well as for mechanistic studies of blood oxygenation level-dependent (BOLD) physiology.5–7 As BOLD contrast is a composite of several hemodynamic parameters, independent measures of cerebral blood flow (CBF) are often required to improve quantitative interpretation.8,9 Measures of CBF can be performed with single photon emission computed tomography or positron emission tomography, but both are moderately invasive, requiring the injection of a radioactive tracer. In contrast, arterial spin labeling (ASL) MRI does not require the administration of exogenous tracers, and thus is increasingly used when invasive CBF measurements are dose restricted or impractical. 10
In ASL, arterial blood water is magnetically labeled using a single or multiple radiofrequency pulses, after which a post-labeling delay (PLD) is allowed whereby the labeled blood water flows into the imaging slice and exchanges with tissue water. The reduction in tissue water magnetization that is observed subsequent to the radiofrequency label can be used to quantify the CBF in absolute units (ml blood/100 g tissue/minute) after appropriate calibration procedures.11,12
A common assumption in ASL vascular reactivity studies is that bolus arrival time (BAT), or the time required for blood water to reach the capillary exchange site, does not vary considerably between normocarbia and hypercarbia (i.e., either hypercarbic normoxia or hypercarbic hyperoxia). Regional variations in BAT during a normoxic normocarbic condition have been presented as part of a large, multicenter ASL study. 13 Furthermore, during neuronal activity and in response to opioid administration, it has been shown that the BAT reduces by approximately as much as the CBF increase.14,15 It is likely that similar changes in BAT occur during vascular stimulation and that these changes vary between brain regions.
More specifically, it is well known that the diameter of cerebral vessels and arterial blood pressure adjust in response to hypercarbia.16,17 The downstream manifestations of these changes will depend in a complex manner on pressure-autoregulation within the vasculature, as has been outlined in traumatic brain injury, 18 cardiovascular disease, 19 and cerebrovascular disease. 20 More recently, evidence has been provided for substantial heterogeneity of red blood cell velocity through the capillaries as well, 21 hypothesized to be mediated by capillary pericytes and/or capillary vascular disease that can also be influenced by the partial pressure of CO2 in arterial blood. As such, a mechanism for hypercarbia instigating changes in arterial blood velocity and corresponding BAT values is well established, yet quantitative in vivo measures of BAT changes in response to hypercarbia in humans have not been reported.
Quantifying such changes could be of great importance to ASL measurements of CBF, as ASL experiments performed at a single PLD may overestimate or underestimate true CBF depending on the change in BAT. Similarly, ASL techniques that label blood through principles of flow-driven adiabatic inversion, 10 or using radiofrequency pulse trains,22,23 are sensitive to the velocity of blood water through the labeling plane. Changes in this velocity, and the corresponding blood water labeling efficiency, could translate to calculated differences in CBF between baseline and stimulation.
Here, we perform mut-PLD ASL measurements to simultaneously quantify CBF and BAT in multiple brain regions in response to different types of common gas stimuli. Data are analyzed using a multi-compartment model that accounts for partial volume contributions between white and gray matter and separately models perfusion and intravascular blood water signal.24,25 Results of this study demonstrate the range of BAT values in different brain regions and reveal how BAT is influenced by changes in partial pressure of CO2 in arterial blood and the partial pressure of arterial oxygen. Findings are intended to provide an exemplar for how BAT values vary in healthy brain for hypercarbic gas stimuli.
MATERIALS AND METHODS
Ethical Considerations
Healthy, non-smoking volunteers (n = 12; age = 30±4 years; 7M/5F) provided informed, written consent in accordance with the Vanderbilt University Institutional Review Board (IRB #101567) and Helsinki Declaration of 1975 (and as revised in 1983) for this Health Insurance Portability and Accountability Act (HIPAA)-compliant study. No animal experiments were performed as part of this study.
Magnetic Resonance Imaging Parameters
Volunteers were scanned at 3.0T (Philips Medical Systems, Best, The Netherlands) using quadrature body coil transmit and a 32-channel SENSE-head receive coil. For each scan, pseudocontinuous ASL (pCASL) was performed with the following parameters: spatial resolution = 4×4×7 mm 3 , TE = 11 ms, TR = 3.6 seconds, averages = 12. Seven PLDs were acquired: 100 ms, 400 ms, 700 ms, 1,000 ms, 1,300 ms, 1600 ms, 1900 ms and the order of the PLDs was randomized in such a way that three consecutive scans were never collected in ascending or descending PLD order. The 12 averages were divided into two separate scans of ˜5-minute duration each. This strategy was applied so that volunteers would not be breathing hypercarbic gas for 8 minutes or more, which could (i) be uncomfortable, (ii) lead to vascular adaptation/habituation, and (iii) may not be comparable to typical hypercarbic gas experiments that use stimulus durations of ˜5 minutes or less.
The labeling pulse train consisted of a 1,000 ms train of 0.5 ms Hanning pulses. The 1,000-ms duration, which is shorter than the typical pCASL pulse train of 1,500 to 2,000 ms,26–28 was chosen to increase sensitivity to blood inflow and corresponding BAT variability, which was the topic of this investigation. Volunteers were instructed to keep eyes open during the pCASL scan. For each volunteer, an additional three-dimensional T1-weighted scan (MPRAGE; spatial resolution = 1 × 1 × 1 mm 3 , TR/TE = 8.9/3.2 ms) was acquired for co-registration and partial volume correction purposes. An M0 scan, using identical acquisition geometry as the pCASL scan but with TR = 20s and the spin labeling pulse train turned off, was acquired for purposes of blood M0 calculation and CBF calibration.
Paradigm
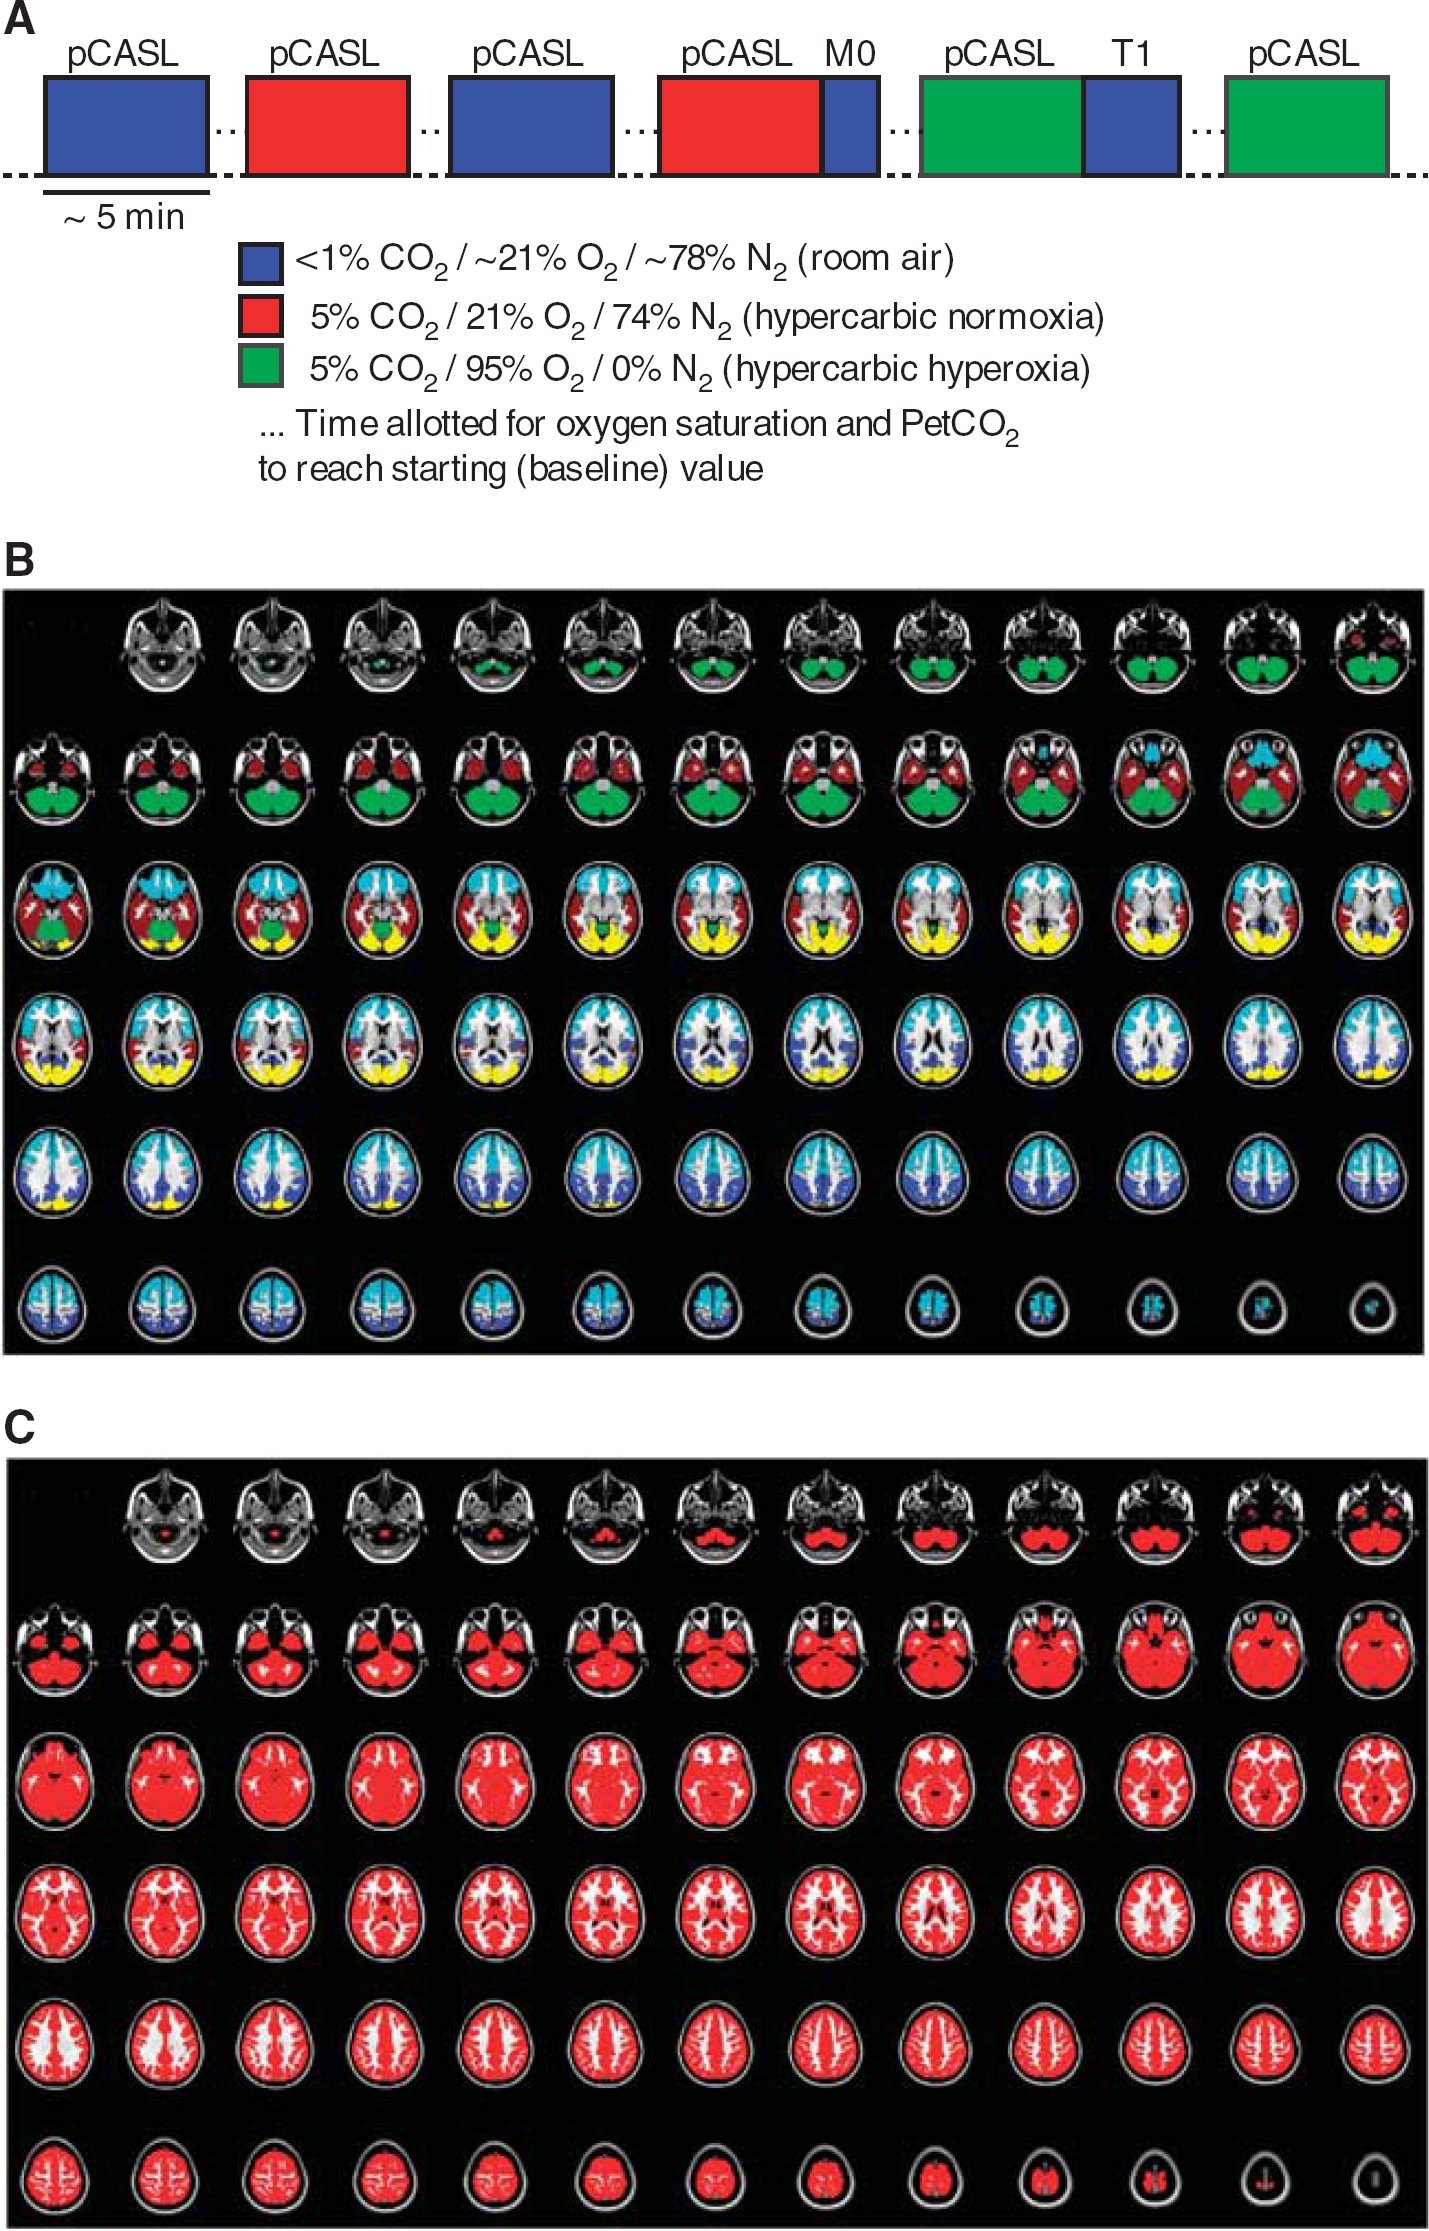
Gas delivery was kept at a constant rate (12 L/minute) throughout all scans, with gas delivered from compressed cylinders. Subjects wore close-fitting gas masks, which covered the mouth and nose. The attached reservoir bag was taped closed. Recordings of heart rate (HR), respiratory rate, arterial oxygen saturation fraction (Ya), and partial pressure of end-tidal CO2 (PetCO2) were made throughout all experiments. Arterial oxygen saturation fraction was measured with pulse oximetry on the right index finger. The multi-PLD pCASL protocol was performed twice in each subject for three different scenarios: (i) medical grade room air: ˜20.9% O2/78.1% N2 and balance of trace other elements in atmosphere (i.e., normoxic normocarbia), (ii): 5% CO2/21% O2/74% N2 (i.e., hypercarbic normoxia) and (iii) 5% CO2/95% O2 (i.e., hypercarbic hyperoxia) administration (Figure 1). Therefore, this study investigated how the effect of hypercarbia, both under normoxic conditions and together with hyperoxia, influenced CBF and BAT relative to normocarbia (i.e., room air breathing). These gas combinations were chosen as they are the most common gas stimuli used in both calibrated functional magnetic resonance imaging experiments and clinical CVR experiments.4,29 Between each stimulus block, time was allowed for blood gases to normalize to new levels. For changes from hypercarbia to normocarbia, this was evaluated by monitoring arterial oxygen saturations and PetCO2 values and requiring that they stabilize within the range of baseline values that were calculated during the first room air breathing period. In most volunteers, this occurred 30 to 60 seconds after switching the gas stimuli and ˜1 minute was given after the measurements stabilized before scanning began. For changes from normocarbia to hypercarbia, we waited for values to stabilize (30 to 60 seconds), after which an additional 1 — minute was allowed before scanning began. To evaluate variability between the stimulus blocks, we performed correlation analyses to understand whether biases were present between the two scans for each gas stimuli that could be due to incomplete time for blood gases to reach equilibrium.
(
Cerebral Blood Flow Quantification
Arterial spin labeling images were corrected for motion, pair-wise subtracted, and averaged for each PLD. For equilibrium blood water magnetization (M0,b) calculation, a pure CSF voxel in the ventricles was chosen in the M0 scan, which was then converted to M0,b by scaling with the blood water density (Cb = 0.87 mL/mL). Next, a single-compartment kinetic model was applied to the multi-PLD pCASL data, separately for each gas stimulus, and BAT and CBF were calculated (two measurements per gas type for each subject). Importantly, intravascular blood water signal and partial volume effects from gray and white matter will influence the BAT and CBF measurements if corrections are not implemented. One method for correcting for intravascular contamination is to apply bipolar crusher gradients to reduce the phase coherence of moving spins. While this approach has been used with demonstrated success,30,31 crushing is frequently performed in only one direction. Alternatively, complex gradient schemes are required to dephase spins in multiple directions, which generally increase the TE and reduce temporal resolution. Recently, an alternative approach was demonstrated that uses the information in the multi-PLD data to model out the intravascular component. 25 Briefly, the ASL difference magnetization in tissue (ΔMtiss) can be expressed as,
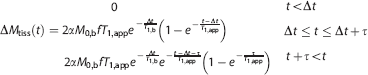
where T1,app = 1/T1,tiss + f/λ, f = CBF (mL/g per second), M0,b = the equilibrium blood water magnetization, α = 0.85 is the labeling efficiency, Δ is the BAT, τ = 1 second is the bolus duration, T1,tiss = 1.2 seconds 32 is the tissue T1, T1,b = 1.7 seconds 33 is the arterial blood water T1, and λ = 0.9mL/g 34 is the blood/tissue partition coefficient. The parameter t is the inflow time; i.e., the time since the start of the labeling, which is the bolus duration plus the PLD. Note that a range of tissue 35 and blood36,37 T1 values have been presented in the literature and the values used here are approximate choices. A reduction in T1,b from 1.7 seconds to 1.4 seconds was included in the hypercarbic hyperoxia scan to account for the effect of hyperoxia on T1,b 38 As has been demonstrated previously, 25 intravascular blood water magnetization (ΔMb) can be described by an additional component,
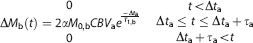
where CBVa is the arterial blood volume (mL/mL), Δta is the arterial BAT, and τa = 1 second is the arterial bolus duration. The total voxel signal is approximated in this model as,

Therefore, this model is identical to the common ASL kinetic model; however, this additionally includes macrovascular intravascular blood water signal.
In addition, the relatively coarse spatial resolution of ASL voxels introduces additional partial volume effects from different tissue types within a voxel. Therefore, we co-registered the ASL data to the T1-weighted structural image for each subject and calculated the fractional tissue volume in each voxel. 39 Next, a previously reported partial volume correction procedure was applied and gray matter CBF and BAT were calculated after accounting for voxel heterogeneity. 24 Briefly, this approach uses the partial volume estimates and different kinetic behavior of ASL signal in gray and white matter and creates separate estimates of the gray and white matter CBF and BAT. Owing to the relatively long white matter BAT relative to the blood water T1 at 3.0T, gray matter CBF and BAT were the topic of this study. Therefore, only gray matter values are presented and maps were masked by applying standard structural cortical and subcortical gray matter binary atlases (Figures 1B and C). For completeness, results are presented with and without (i.e., assuming pure gray matter voxels) the partial volume correction procedure.
Kinetic model fitting with and without partial volume correction were perfumed using the BASIL tool from the FMRIB Software Library (FSL: www.fmrib.ox.ac.uk/fsl/basil).
Analysis and Statistical Considerations
The purpose of this study was to assess the relationship between the study covariates (e.g., gas stimulus type: normocarbic normoxia, hypercarbic normoxia, and hypercarbic hyperoxia) and the CBF and BAT calculated from the multi-PLD pCASL approach.
To understand how BAT and CBF varied regionally, the data were co-registered 40 (degrees of freedom = 12) to a standard T1-weighted atlas (Harvard-Oxford cortical atlas) and values were calculated in the following gray matter regions: cerebellum, bilateral temporal lobes, occipital lobes, frontal lobes, and parietal lobes as shown in Figure 1B. Total gray matter was also separately considered, which comprises deep gray matter in addition to the above mentioned cortical areas (Figure 1C).
Mean BAT and CBF values for the two scans with each gas stimulus were averaged. Next, a two-tailed Student's t-test was used to evaluate differences in measures between regions and gas conditions with criteria for significance P<0.05. When inter-region differences were considered, a paired t-test was applied and significance thresholds were corrected for multiple comparisons; corrected P = 0.004.
In addition to the region of interest-based analysis, we also performed an image-based group analysis to identify where BAT and CBF changes were significantly different between gas conditions. To achieve this, a paired t-test was performed between different gas stimuli using the co-registered CBF and BAT maps and the FMRIB Local Analysis of Mixed Effects algorithm. As an additional constraint, we incorporated the variance maps (variance cope weighting file: -vcope argument) from each of the individual subject multi-PLD fits, which reflect the confidence of the CBF and BAT calculation within each voxel for each subject. By adding the variance as an additional parameter, the statistical maps are weighted by the reliability of the individual subject's data. Separately for CBF and BAT, comparisons were made between (i) room air versus hypercarbic normoxia, (ii) room air versus hypercarbic hyperoxia, and (iii) hypercarbic normoxia versus hypercarbic hyperoxia. Statistical maps were thresholded at z>2.3 and z< −2.3 (P<0.05).
RESULTS
Physiologic Monitoring
All volunteers completed the experiment with no adverse events reported. PetCO2 increased significantly (P<0.001) from the room air breathing condition (PetCO2 = 45.9±1.8 mm Hg) to the hypercarbic normoxia (PetCO2 = 51.4±2.3 mm Hg) and hypercarbic hyperoxia (PetCO2 = 49.0±2.1 mm Hg) conditions. Room air arterial oxygen saturation fraction (Ya) was 97.3±1.3. Relative to room air breathing, Ya increased less for hypercarbic normoxia (P = 0.012; Ya = 97.8±1.2) than for hypercarbic hyperoxia (P<0.001; Ya = 98.3±1.1) conditions. Heart rate did not differ significantly between the room air (HR = 70.5±11.6 beats/minute) and hypercarbic normoxia (HR = 70.3±10.0 beats/minute) or hypercarbic hyperoxia (HR = 67.7±8.8 beats/minute) conditions. Respiratory rate did not differ significantly between any of the gas stimuli: room air (13.7±3.5 breaths/minute); hypercarbic normoxia (12.9±4.2 breaths/minute); hypercarbic hyperoxia (13.4±3.5 breaths/minute).
Cerebral Blood Flow and Bolus Arrival Time Differences between Stimulus Types
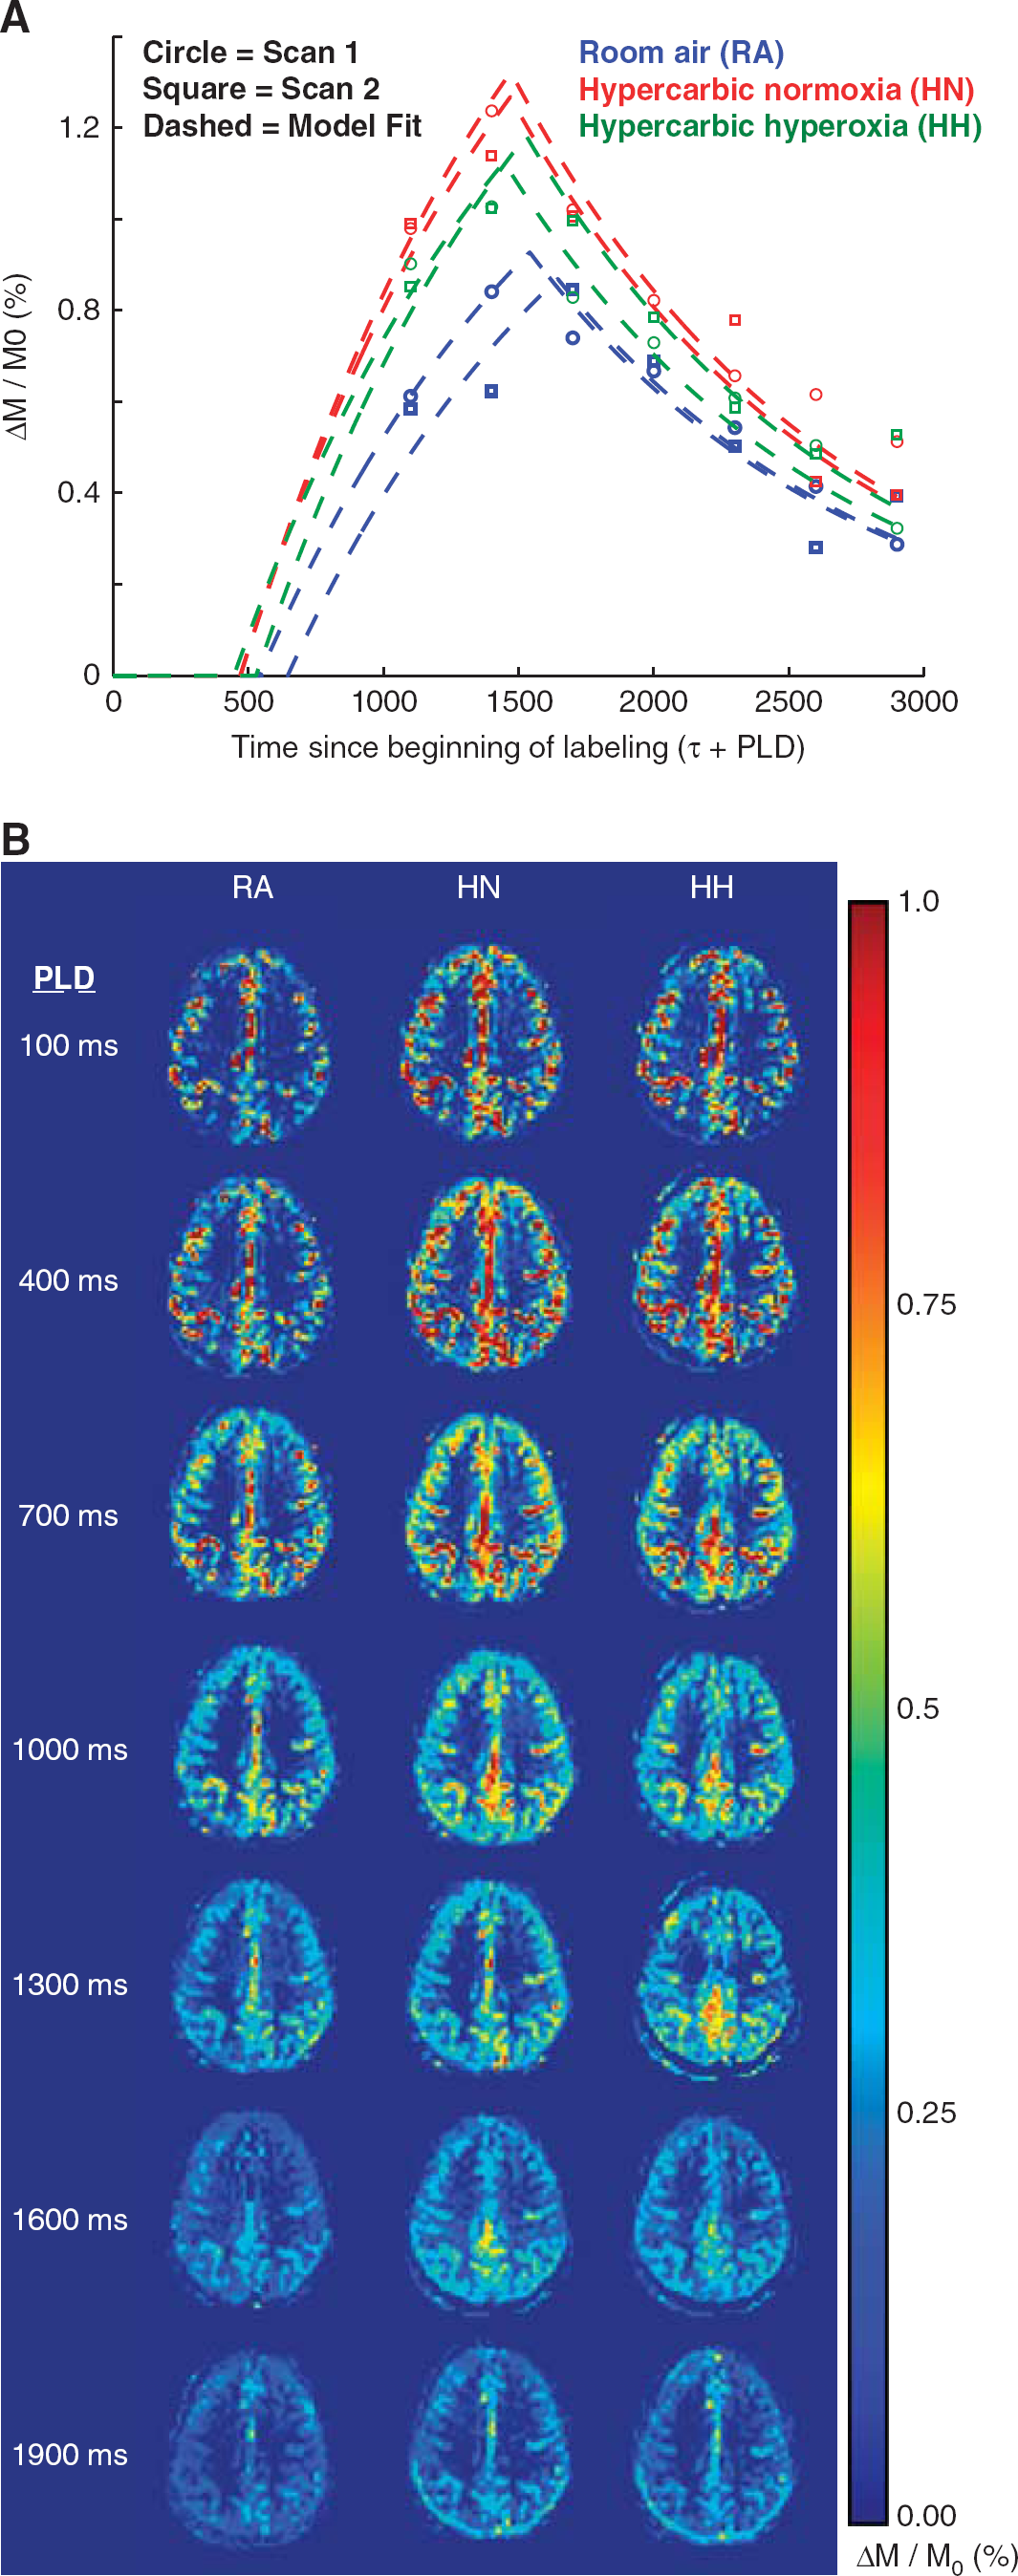
Figure 2 shows magnitude ASL difference images normalized by M0,b from a representative subject for the three different stimulus types before co-registration and CBF and BAT quantification. Clear differences in BAT (seen as temporal differences in the filling of the labeled blood water) and the CBF (seen as differences in the maximum signal intensity) are noticeable between the stimulus types. RA, room air; HN, hypercarbic normoxia; HH, hypercarbic hyperoxia. For this subject, the mean data in a representative brain region (parietal lobe) are included, along with the overlaid kinetic model extrapolated to a time point of zero.
(
Figure 3 shows scatter plots between scan 1 and scan 2 data for BAT and CBF, for data without (A,B) and with partial volume correction (C,D). These scans were performed in the same session but separated by periods of room air breathing. In all regions, the two scans provide values that correlate well on average (P<0.001), consistent with the two separate stimulus epochs providing comparable information and any residual changes in blood gases after the inter-stimulus waiting period not significantly altering the measurements.
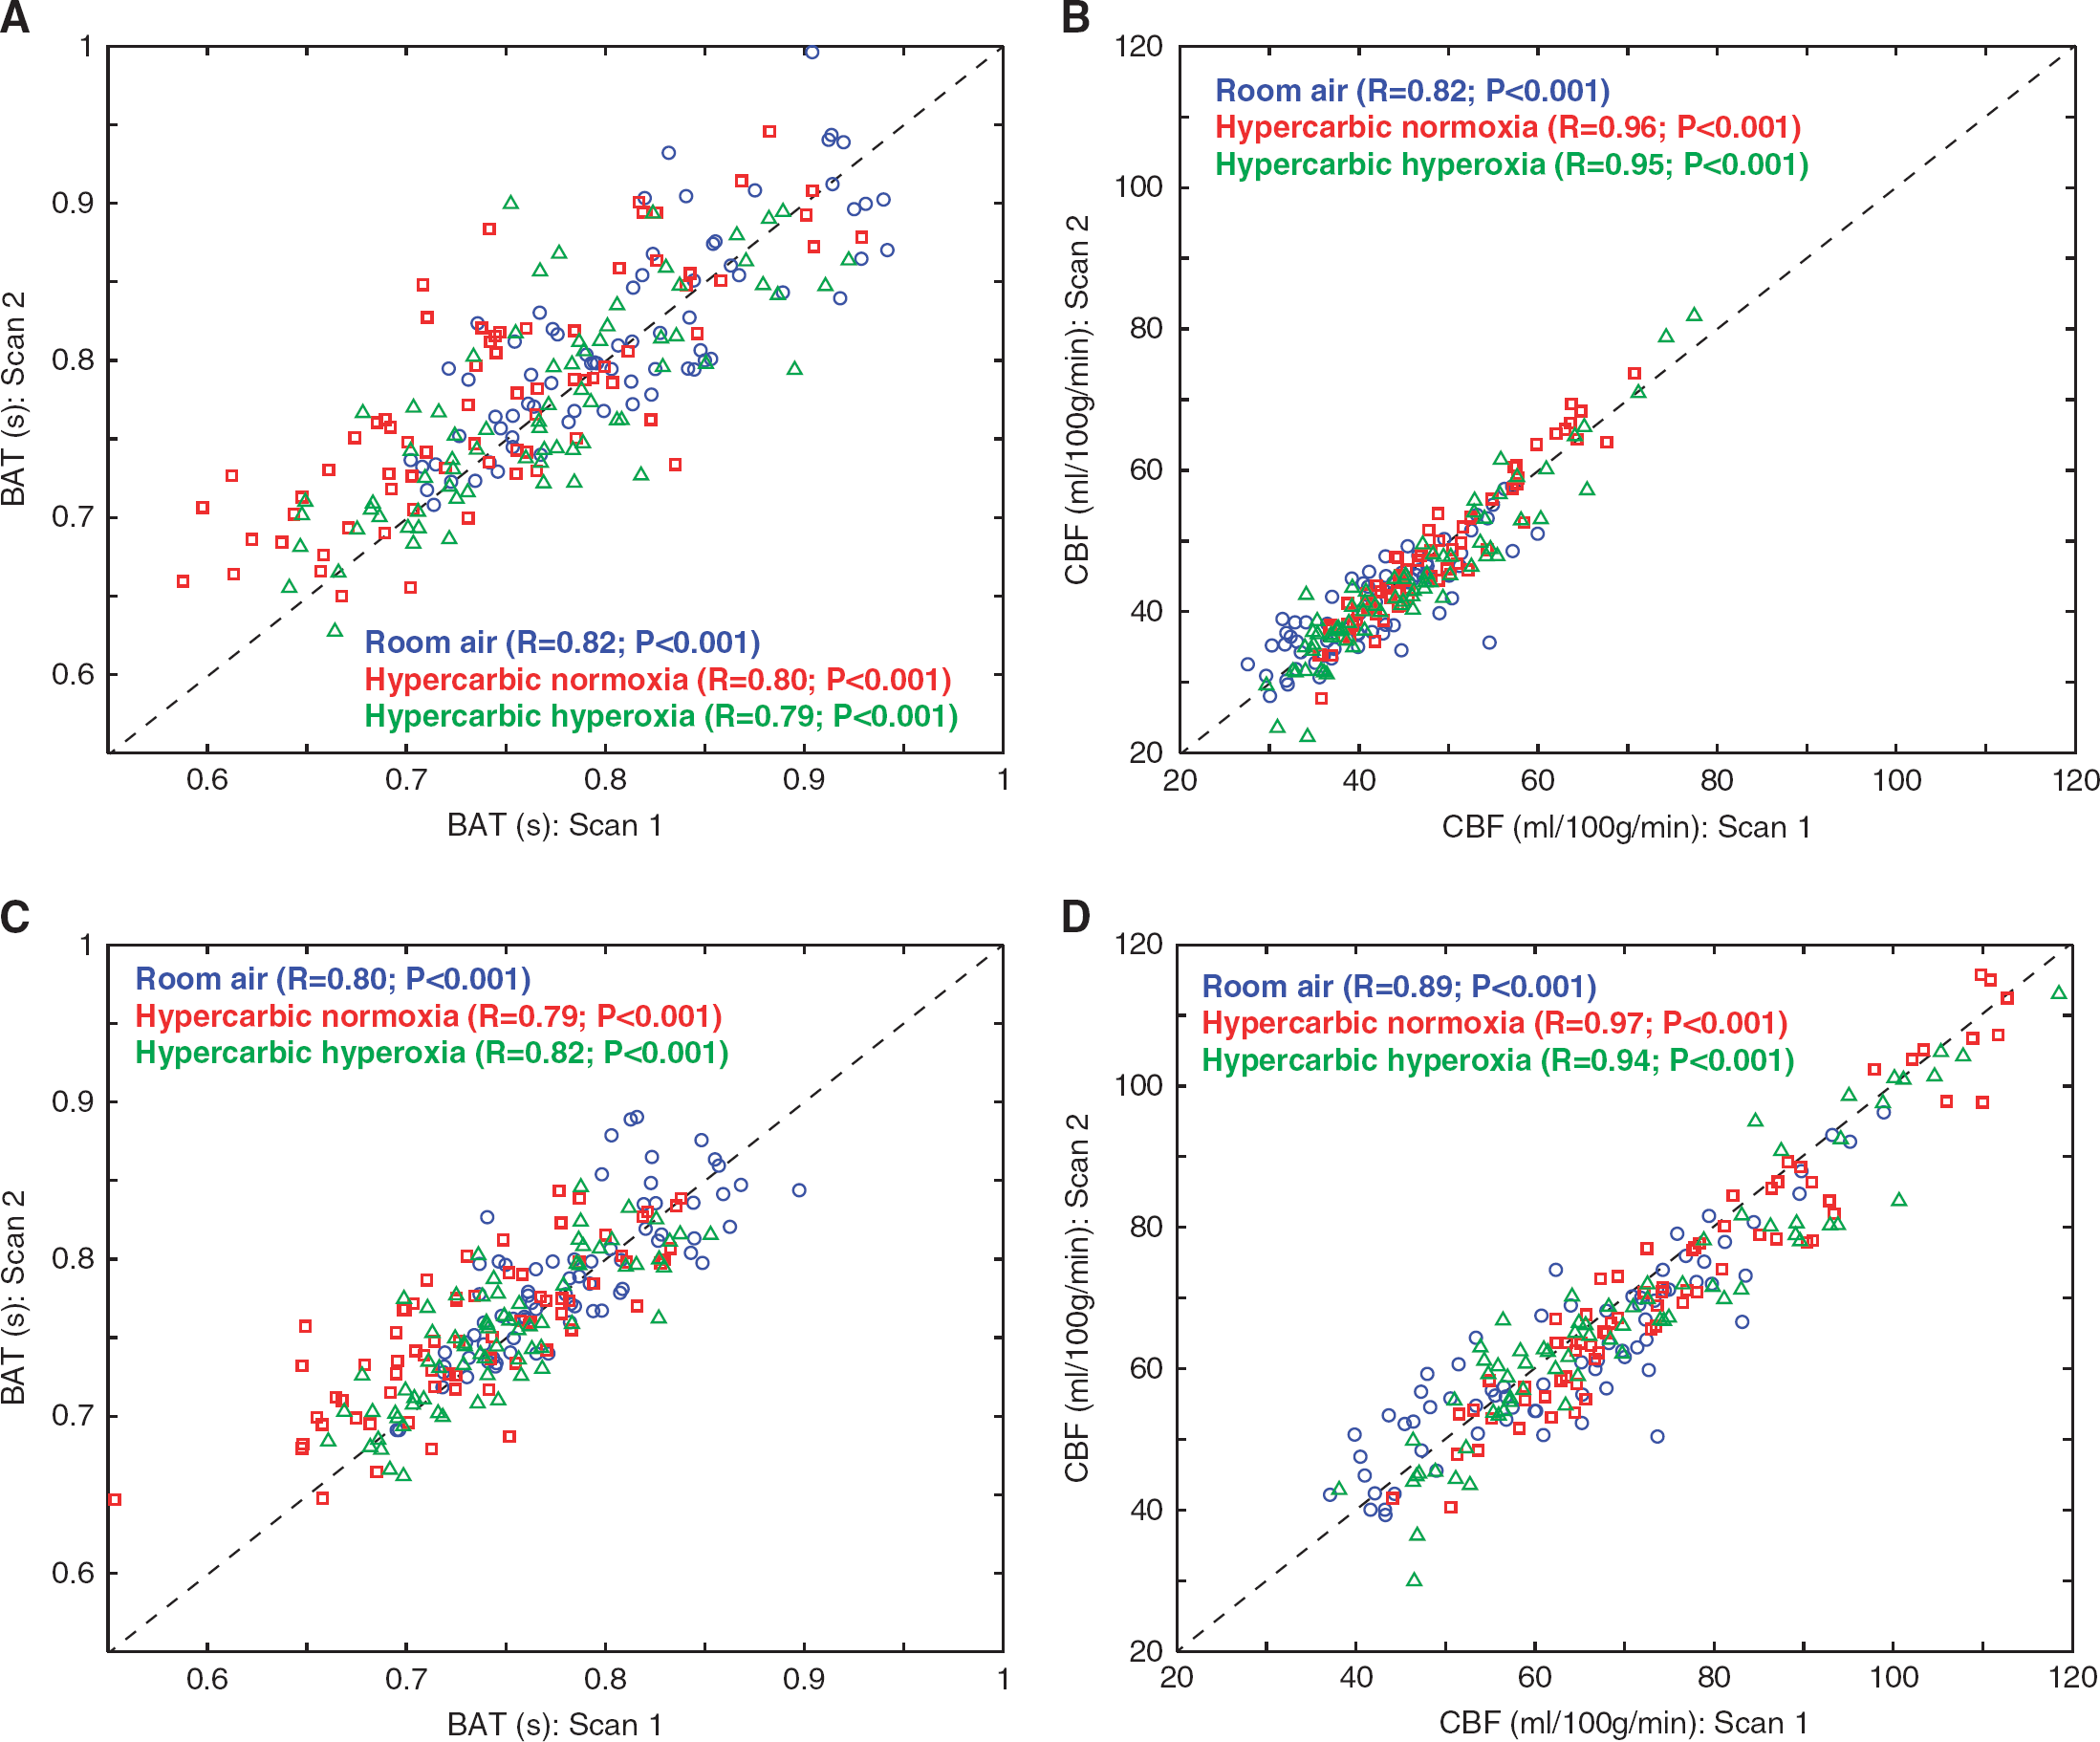
Scatter plots showing the relationship between scan 1 and scan 2 for the bolus arrival time (BAT) and cerebral blood flow (CBF). Room air (blue), hypercarbic normoxia (red), and hypercarbic hyperoxia (green) data are shown separately for all volunteers (n= 12) for mean values within each region considered (n = 6: total gray matter, cerebellar, bi-temporal, bi-occipital, bi-frontal, and bi-parietal). Data without (
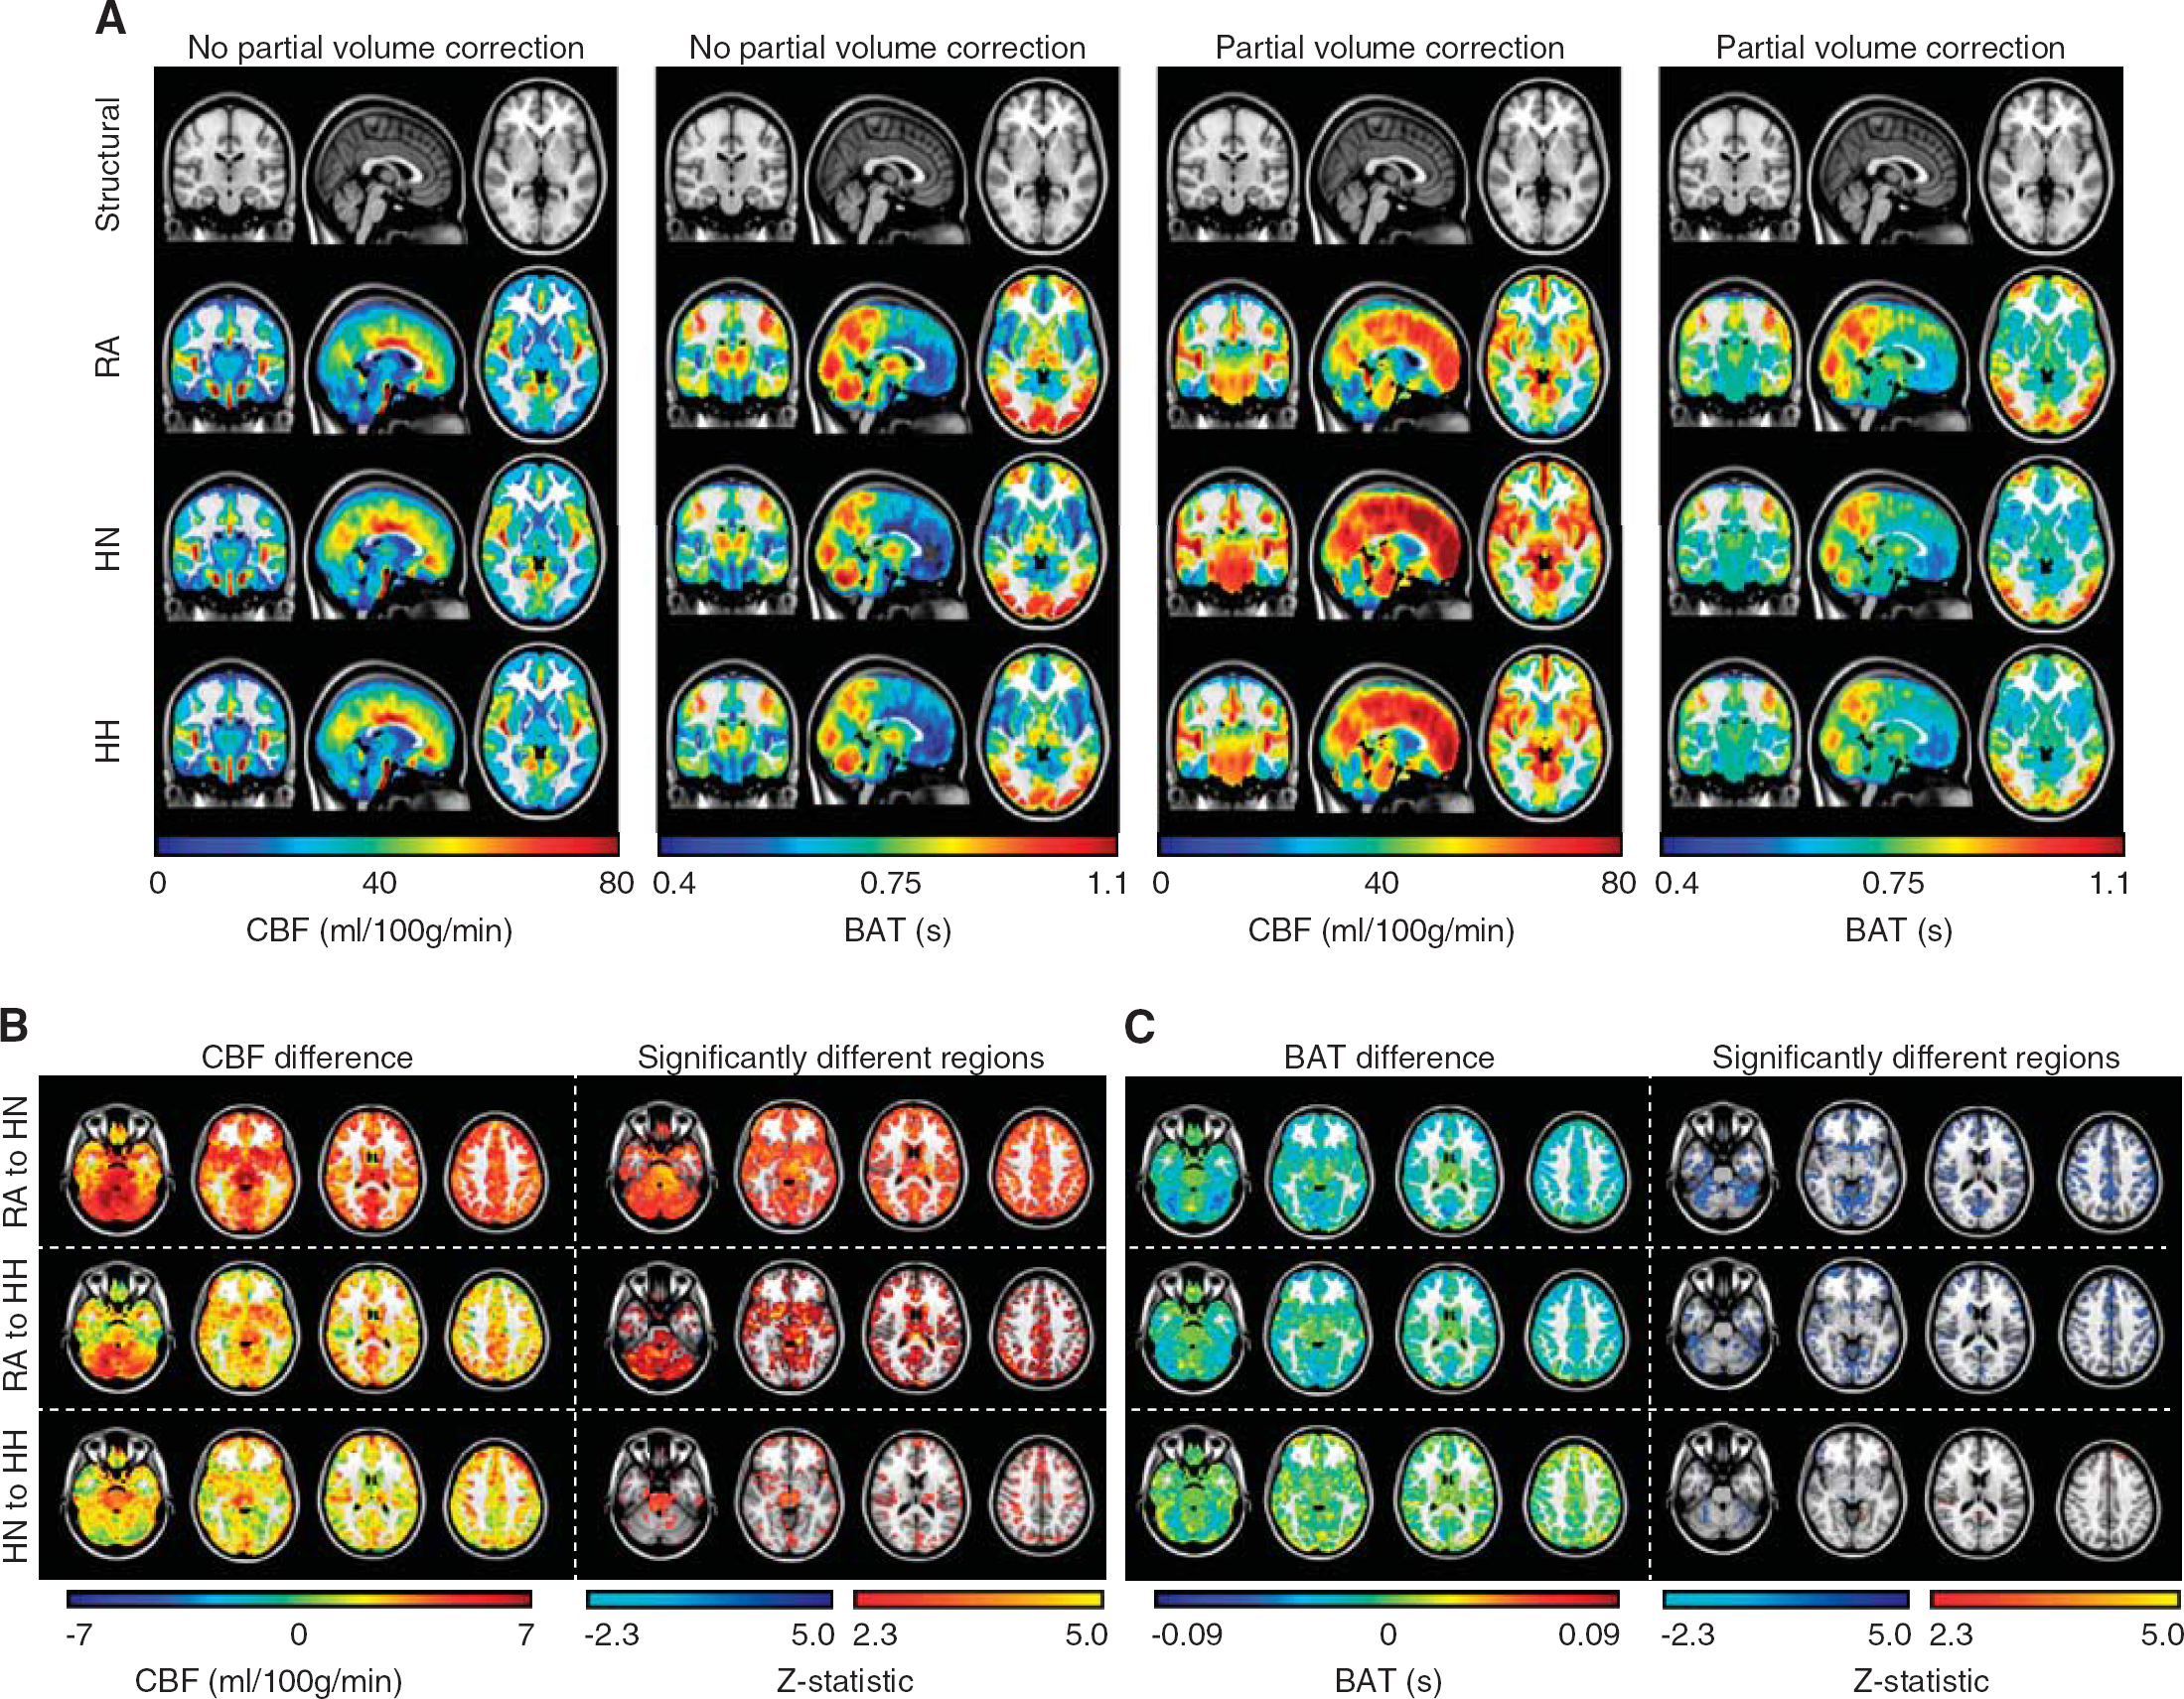
Figure 4 shows orthogonal representations of the mean CBF and BAT maps for the different stimuli. Analyses without (A,B) and with (C,D) partial volume correction are shown. Below, the results of the regional analysis are shown for the partial volume-corrected data, including the change in CBF (ml/100g/minute) and BAT (s), along with z-statistics depicting the spatial regions with significantly different values for the conditions shown (representative slices shown; all slices presented in Supplementary Figure 1). Quantitative values for all subjects are presented in Table 1 and typical ranges of parameters for a given subject are shown in Table 2.
(
CBF and BAT values
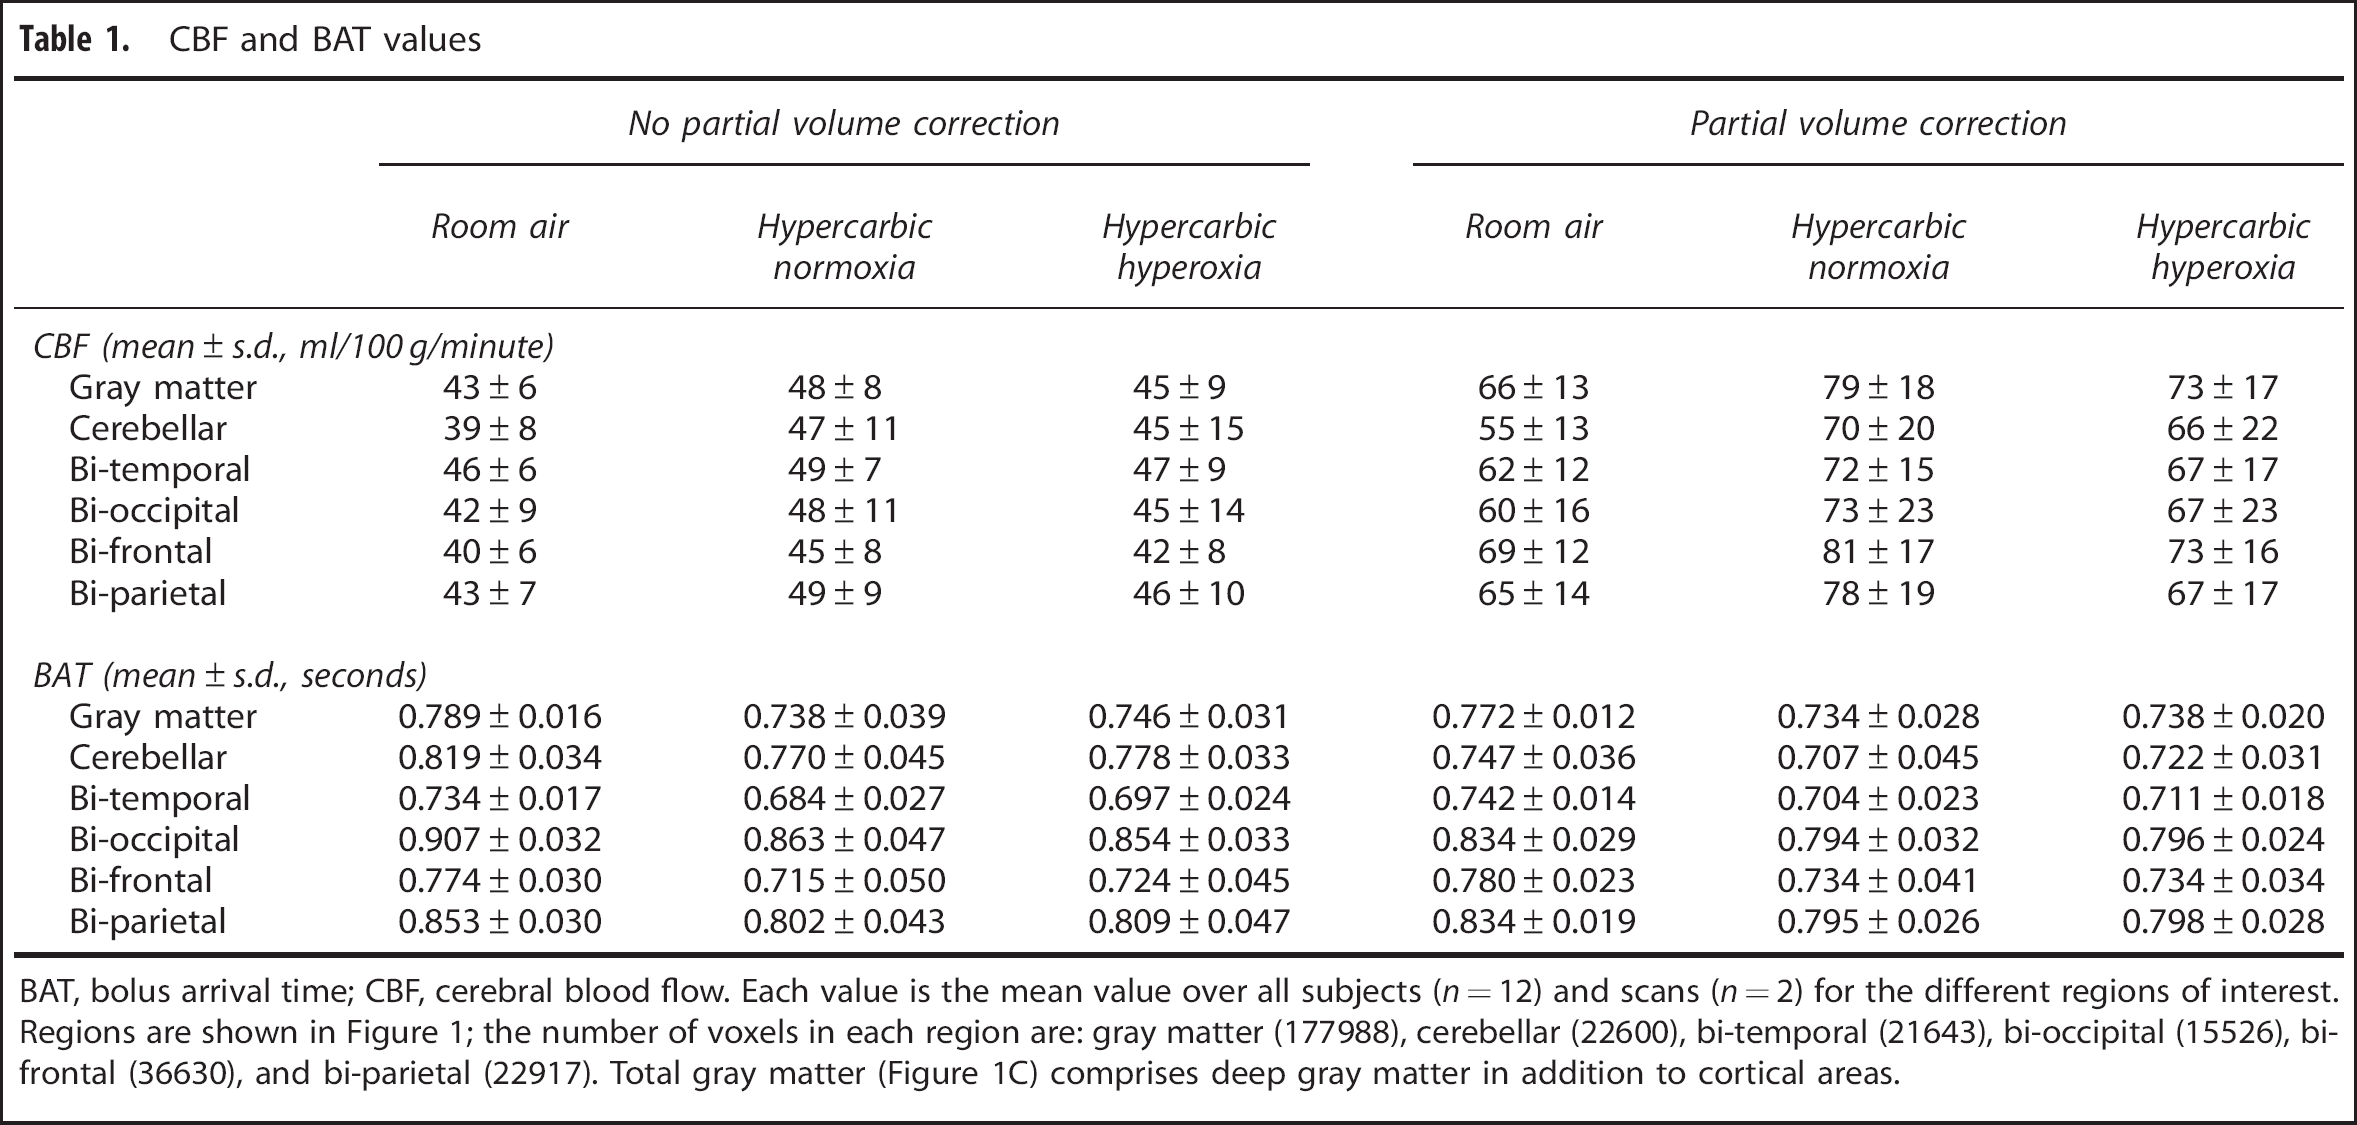
BAT, bolus arrival time; CBF, cerebral blood flow. Each value is the mean value over all subjects (n = 12) and scans (n = 2) for the different regions of interest. Regions are shown in Figure 1; the number of voxels in each region are: gray matter (177988), cerebellar (22600), bi-temporal (21643), bi-occipital (15526), bi-frontal (36630), and bi-parietal (22917). Total gray matter (Figure 1C) comprises deep gray matter in addition to cortical areas.
Representative CBF and BAT values for a single subject
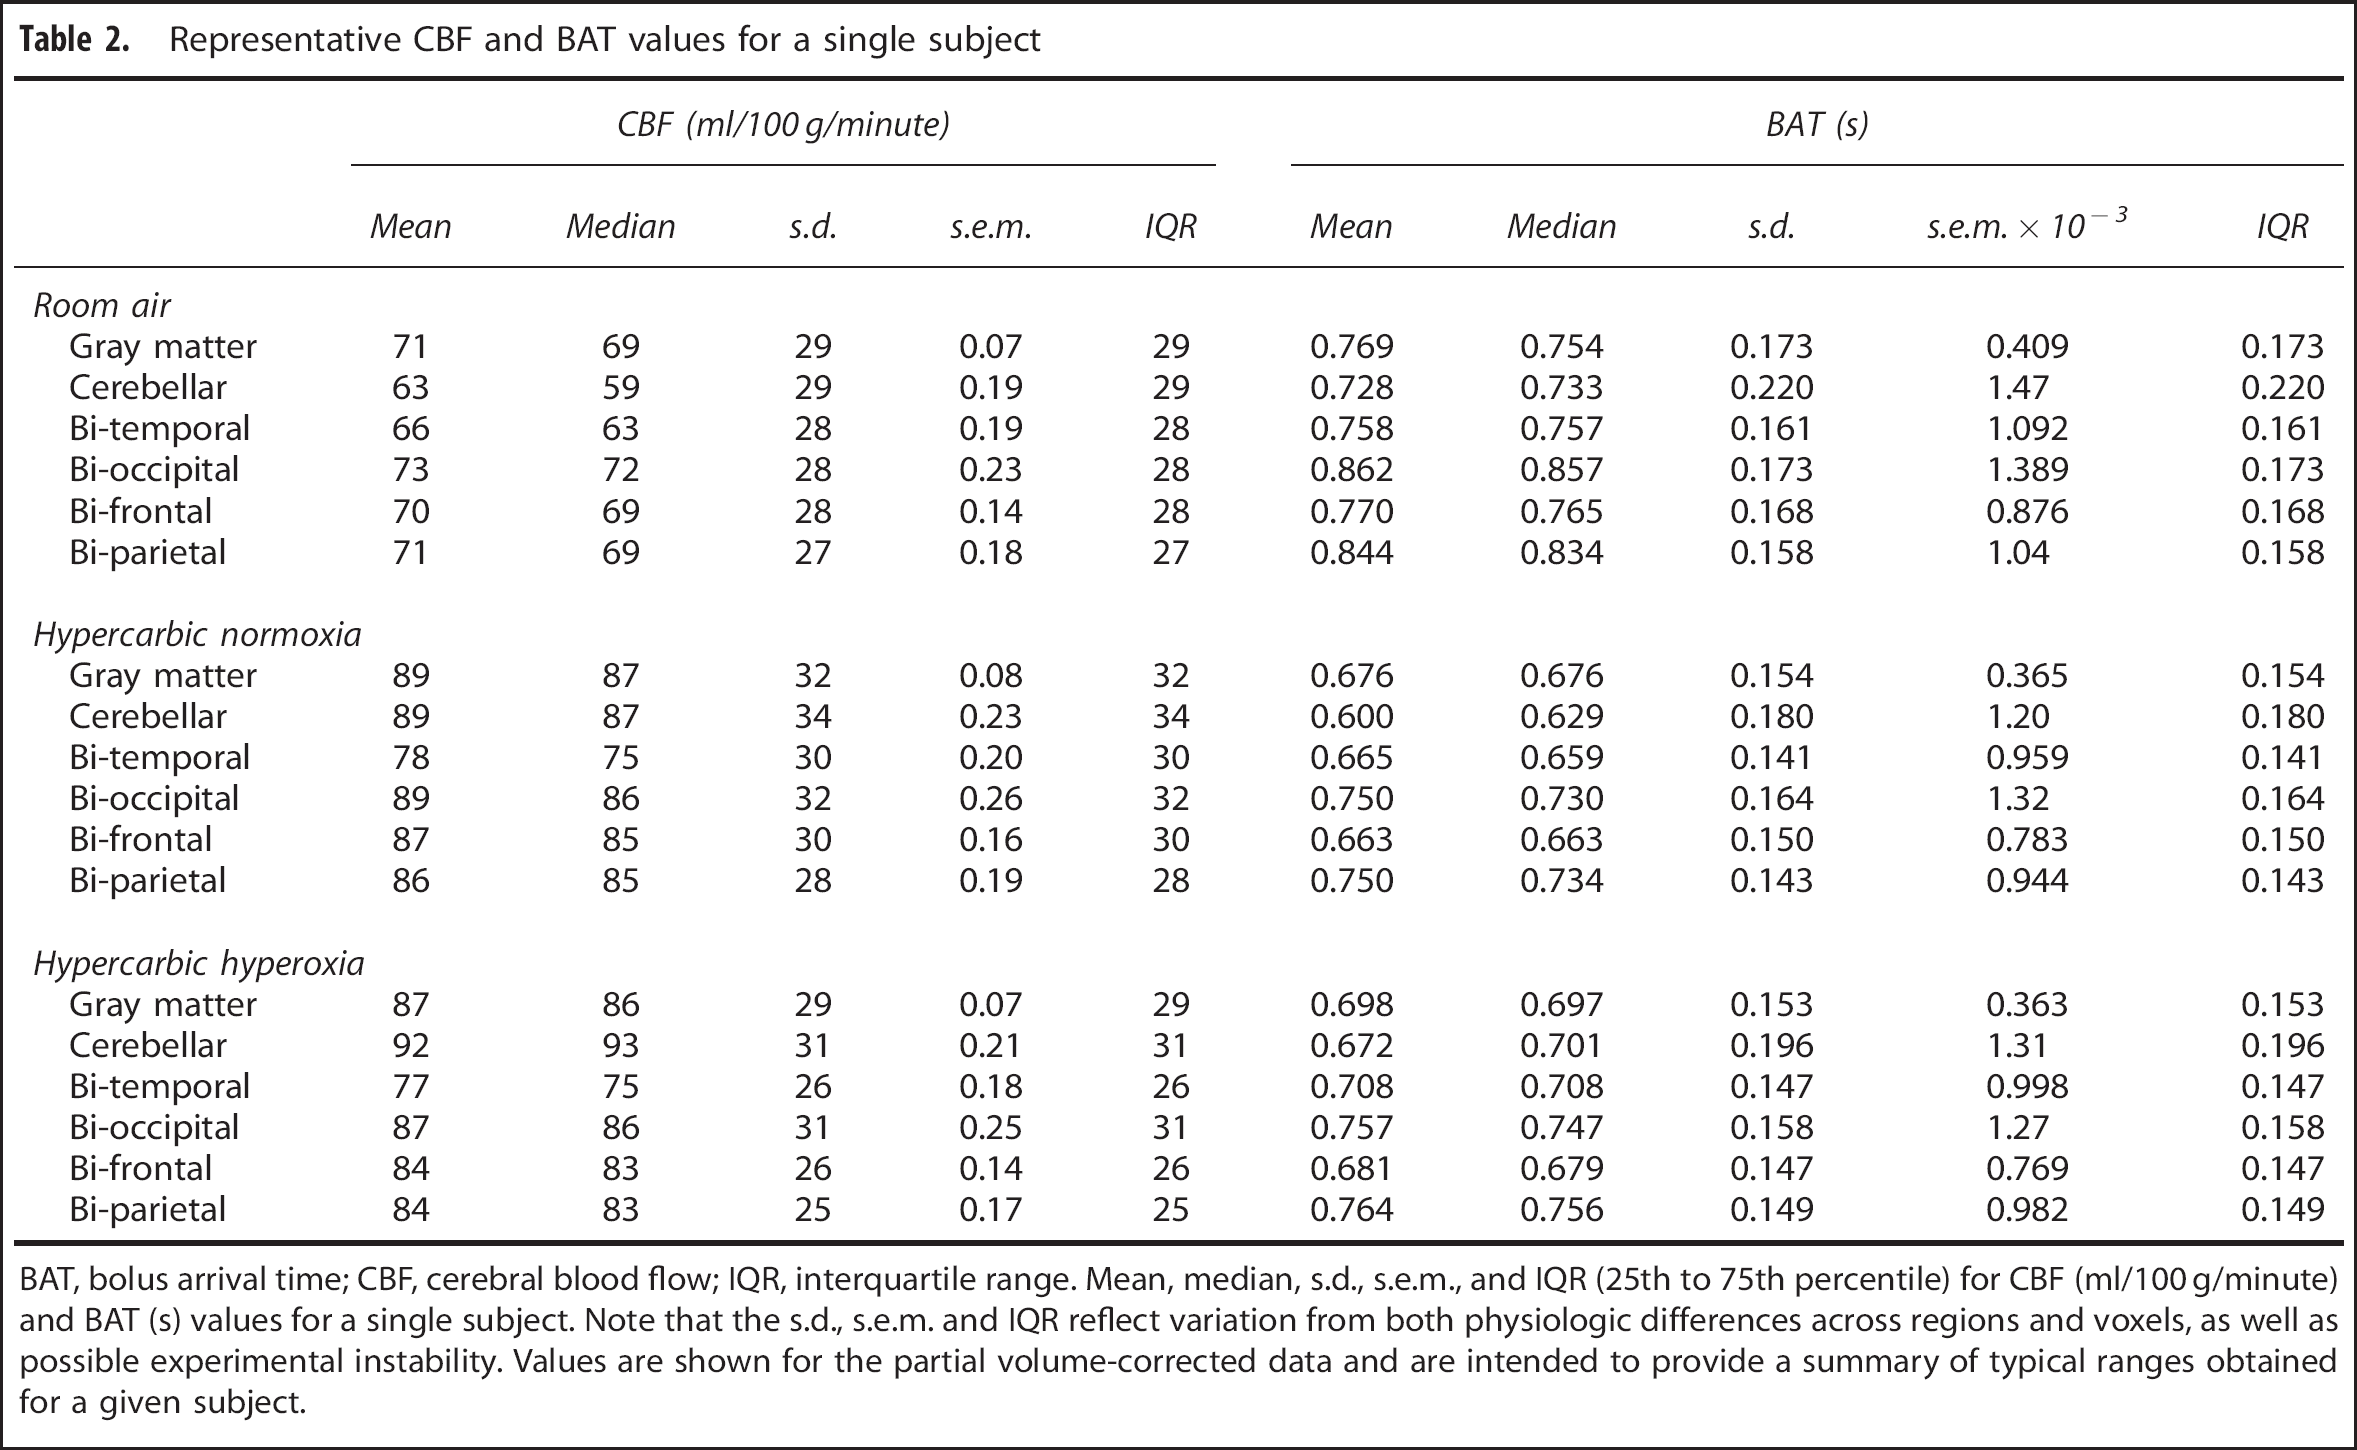
BAT, bolus arrival time; CBF, cerebral blood flow; IQR, interquartile range. Mean, median, s.d., s.e.m., and IQR (25th to 75th percentile) for CBF (ml/100 g/minute) and BAT (s) values for a single subject. Note that the s.d., s.e.m. and IQR reflect variation from both physiologic differences across regions and voxels, as well as possible experimental instability. Values are shown for the partial volume-corrected data and are intended to provide a summary of typical ranges obtained for a given subject.
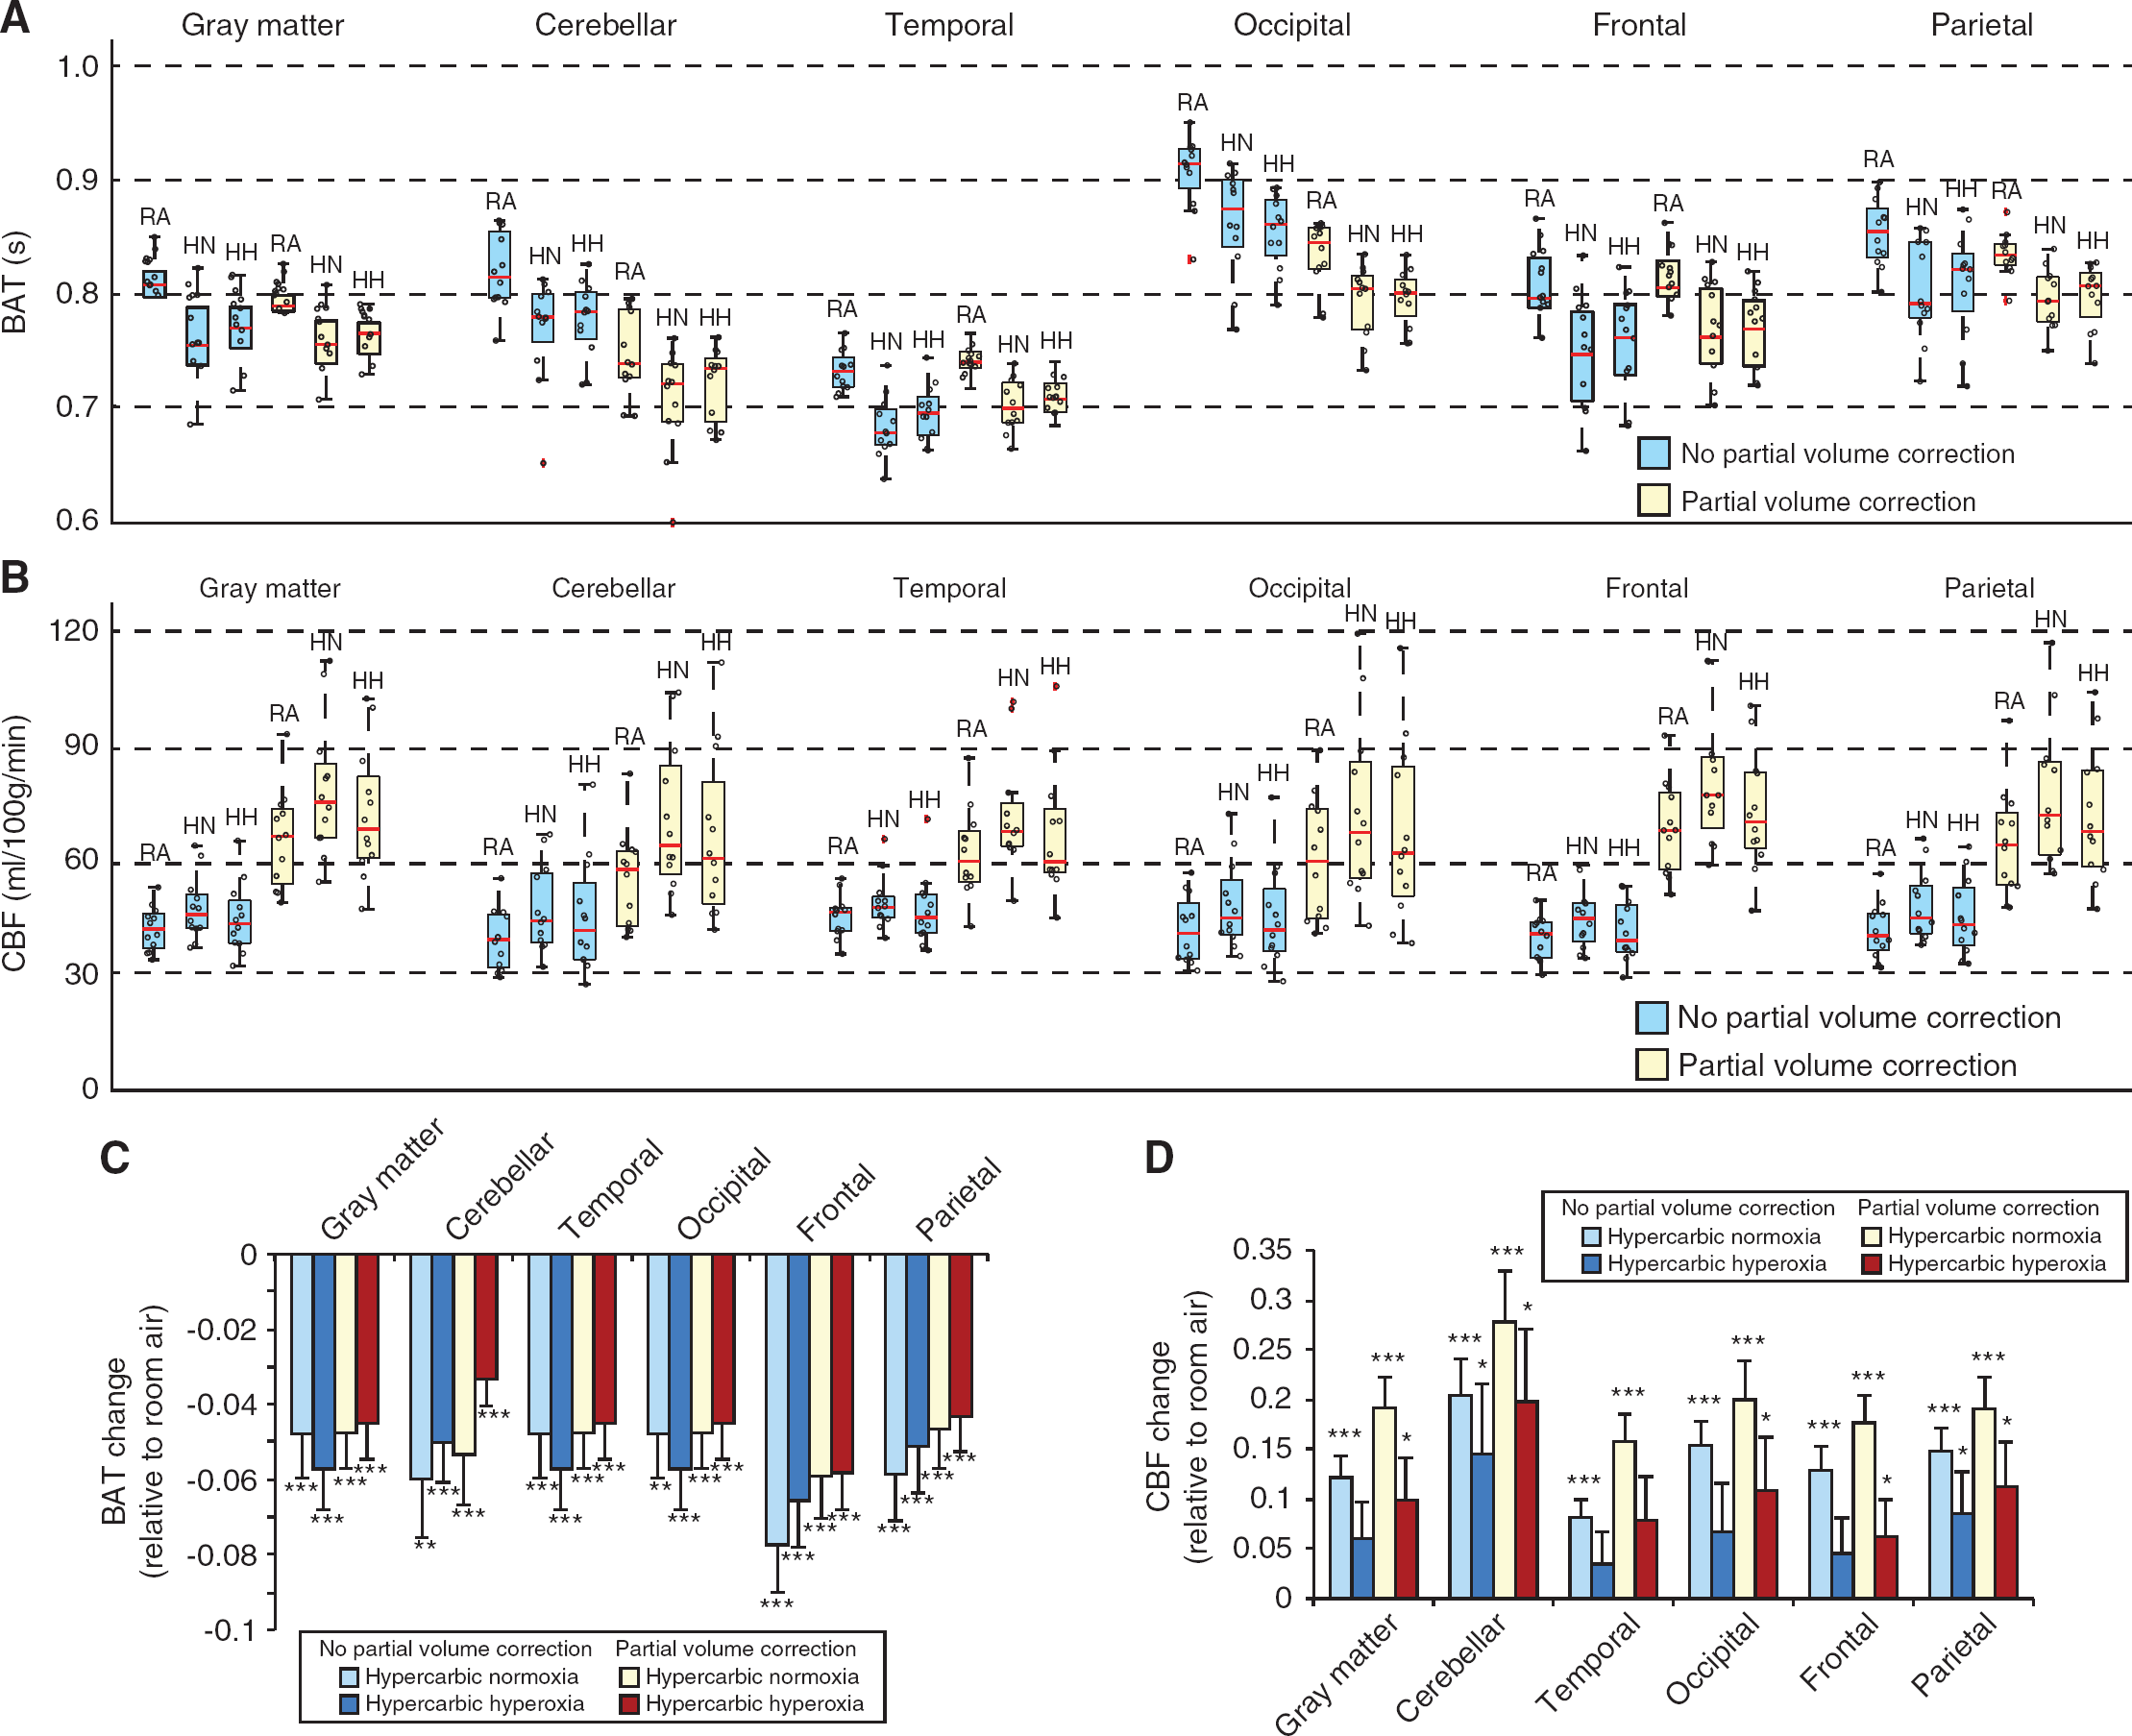
Figure 5 shows the quantified BAT and CBF for the different regions considered and stimulus types, with and without partial volume correction applied. (C,D) Bar plots summarizing the BAT and CBF fractional changes relative to the room air breathing condition for the different hypercarbic gas stimuli and anatomic regions.
(
Cerebral Blood Flow and Bolus Arrival Time Differences between Brain Regions
The data acquired here also allow for assessment of lobar differences in CBF and BAT. The below comparisons were performed for data obtained from room air breathing after the partial volume correction procedure. For CBF, the following brain regions yielded significantly different mean values after correcting for multiple comparisons: bi-parietal versus cerebellar (P<0.001); bi-frontal versus cerebellar (P< 0.001); bi-frontal versus bi-temporal (P = 0.003); cerebellar versus bi-temporal (P = 0.002). For BAT, the following brain regions yielded significantly different mean values after correcting for multiple comparisons: bi-occipital versus bi-frontal (P<0.001); bi-parietal versus bi-frontal (P<0.001); bi-occipital versus cerebellar (P< 0.001); bi-parietal versus cerebellar (P<0.001); bi-occipital versus bi-temporal (P<0.001); bi-parietal versus bi-temporal (P< 0.001); bi-frontal versus bi-temporal (P<0.001).
We also evaluated whether regions had different changes in BAT between the two conditions (e.g., room air to hypercarbic normoxia and room air to hypercarbic hyperoxia). For BAT, we observed that no two regions had different changes in BAT (Bonferroni-corrected critical P = 0.005). However, for differences between room air breathing and hypercarbic normoxia, a trend for a BAT difference was observed between bi-occipital and bi-frontal (P = 0.068) and between bi-parietal and bi-frontal (P = 0.053) lobes. For differences between room air and hypercarbic hyperoxia, a trend for a BAT difference was observed between bi-parietal and bi-frontal (P = 0.030) and between bi-frontal and cerebellum (P = 0.022).
DISCUSSION
Simultaneous measurements of CBF and BAT were made in vivo in humans for different levels of hypercarbic gas stimuli, motivated by the most common gas stimuli applied in CVR and calibrated functional magnetic resonance imaging investigations. The primary finding was that in addition to the well-known CBF increase associated with hypercarbia, BAT values reduce significantly with hypercarbia relative to normocarbia. When all gray matter is considered, hypercarbic normoxia causes a significant (P<0.001) reduction in BAT of 4.8±3.3% relative to room air and hypercarbic hyperoxia causes a significant (P<0.001) 4.5±3.3% reduction in BAT relative to room air. Regional brain differences were also observed, which are summarized in Figures 4 and 5 and Table 1.
Relevance of Partial Volume Correction
To achieve adequate SNR in the relatively short time window during which the hypercarbic gas stimuli could be safely administered, we used relatively large voxels (4 × 4 × 7 mm 3 ). While these voxel dimensions are approximately consistent with spatial resolutions employed in other ASL acquisitions, such large voxels will introduce partial volume effects. To account for this, we analyzed ASL data with and without partial volume correction. The correction approach applied has been reported previously 24 and involves calculating the partial volume estimates and different kinetic behavior of ASL signal in gray and white matter to create separate estimates of the gray and white matter CBF and BAT. Owing to the low white matter CBF, together with relatively long BAT in white matter relative to blood water T1 at 3.0T, we focused on gray matter CBF and BAT values only. As summarized in Figure 5 and Table 1, the results with and without partial volume correction were approximately consistent (i.e., BAT decreases and CBF increases with hypercarbia), however, the absolute values did differ as expected. CBF was very strongly increased with partial volume correction in total gray matter as well as in all cortical areas evaluated separately. The partial volume-corrected gray matter BAT values were generally lower than the gray matter BAT values that were not partial volume corrected and the partial volume-corrected gray matter CBF values were higher than the gray matter CBF values that were not partial volume corrected. These findings are consistent with the known effects of BAT being lower in gray matter relative to white matter and CBF being higher in gray matter relative to white matter. The exception to the above trend was that the BAT was only decreased in total gray matter and in cerebellar, bi-occipital, and bi-parietal cortical areas, whereas it was unchanged or even slightly increased in bi-frontal and bi-temporal cortical areas (Table 1) for partial volume-corrected data relative to non-partial volume-corrected data. Several reasons could be proposed for this finding. It is possible that the regions used (Figure 1) for frontal and temporal gray matter partial volume less with white matter than the other mask regions. An additional possibility is that distortions and signal dropout are generally largest in the temporal and frontal regions owing to the relative proximity of these regions to the sinuses and regions of tissue/air susceptibility differences. This leads to a reduction in signal-to-noise ratio in these regions, especially when hyperoxic gas mixtures (e.g., hypercarbic hyperoxia) are administered.
Implications for Calibrated Functional Magnetic Resonance Imaging Experiments
Calibrated BOLD functional magnetic resonance imaging experiments are being conducted with increasing frequency; the goal of these experiments is to discern quantitative hemodynamic and metabolic information from T2*-weighted BOLD contrast. In this approach, sequential measurements of BOLD and CBF responses to neuronal and vascular activity are generally performed, utilizing breath holding or hypercarbic gas challenges for the vascular stimulation. In these approaches, it is frequently assumed that the BAT does not change significantly between baseline and either the neuronal or vascular task (for a review see Blockley et al. 6 ). Here, we demonstrate that there is a significant reduction in BAT with hypercarbia administration, and earlier work has shown similar reductions in BAT with neuronal activity. 14 While these differences are relatively small, they are significant and could reduce the accuracy of the calibrated BOLD measurements when left unaccounted for. In practice, performing BAT measurements in all experiments may be impractical owing to time constraints and the relative difficulty of administering gas stimuli for a sufficient duration to enable these measurements. Therefore, the values presented here could serve as an exemplar for improving the accuracy in calibrated BOLD quantification studies in the future.
Two strategies could easily be applied that may reduce the sensitivity to this potential artifact. First, pulsed ASL approaches such as the quantitative imaging of perfusion using a single subtraction, second version (QUIPS II) or QUIPSS II with thin-slice periodic saturation (Q2TIPS) could be applied. 41 While these methods are not insensitive to large BAT changes, the influence of changes in BAT is reduced by creating a well-defined temporal profile of the blood water bolus. This is achieved by applying a single or combination of saturation pulses beginning at a distinct time (TI1) after the initial labeling pulse. Importantly, these methods can effectively control for the duration of the labeling bolus, however, do not inherently account for changes in BAT. However, when appropriate choices for TI1 and TR and the time width of the labeling region are made, these methods can be made insensitive to small BAT changes of ˜5% (as reported here) in contrast to other pulsed ASL (PASL) approaches that do not control for the labeling bolus duration. Second, ASL performed at long PLD will be less sensitive to differences in BAT than ASL performed at short PLD. There is a tradeoff as SNR will also reduce with PLD; however, the findings of this study suggest that long PLD times are warranted in functional ASL experiments for reducing sensitivity to BAT changes, in addition to their well-known relevance for allowing sufficient time for labeled blood water to arrive in the imaging slice and exchange with tissue water. As vascular stimulation from hypercarbic gas stimuli reduces BAT, quantification errors arising from not accounting for BAT changes are expected to be small when long PLDs are used (e.g., 1.5–2s) relative to the BAT (e.g. ˜1 second or less).
Lobar Differences in Bolus Arrival Time
For all stimuli, the highest BAT values were found in the occipital cortex with shorter values in temporal cortex. These findings align with previously published values in which BOLD signal changes after hypercapnia were 2.5 times delayed in the occipital cortex relative to temporal cortex. 42 Quantification of lobar variations in BAT is limited by the temporal resolution of the method deployed. In a study using dynamic susceptibility contrast MRI with a temporal resolution of 1.3 to 1.45 seconds, the occipital cortex had a significantly delayed BAT (1.81 seconds) compared with the frontal and temporal cortex (both 0.59 seconds). 43 Using a different approach, the QUASAR reproducibility study quantified arterial transit time during room air breathing and demonstrated prolonged arterial transit time in borderzone regions between anterior and middle cerebral artery territories and between middle and posterior cerebral artery territories. 13 Wong et al. 44 cited parietal transit time values in the range of 500 to 800 ms, consistent with our findings; however, they also cited longer occipital transit times (1000 to 1300 ms) relative to our findings. This discrepancy could partly be due to the occurrence that our volunteers may have been slightly hypercapnic as a result of the facemask, which would reduce the BAT slightly. In addition, transit times are sensitive to vascular architecture and geometry, and specifically the location of borderzone territories. These territories will vary spatially with the circle of Willis subtype and completeness of the posterior circulation (e.g., size and extent of posterior communicating arteries relative to the posterior cerebral arteries). Additional variability owing to spatial resolution, post-processing procedure (e.g., partial volume correction), region of interest considered, and tagging scheme could all contribute as well.
After correcting for multiple comparisons, we did not find any significant differences in BAT changes (e.g., between room and hypercarbia) between brain lobes. However, there was a trend for a change in BAT between several regions, as outlined in the Results. These data suggest that lobar differences in BAT changes are small, and it is possible that any small differences in BAT changes between brain lobes requires a larger sample size than used here to reach statistical significance. As such, whole-brain ASL reactivity data can likely be corrected for BAT differences using just a single correction value derived from the total gray matter BAT reduction reported in Table 1.
Hypercarbic Normoxia versus Hypercarbic Hyperoxia
Depending on application, hypercarbic normoxia (e.g., 5% CO2/21% O2/74% N2) and hypercarbic hyperoxia (e.g., carbogen: 5% CO2/95% O2) are frequently administered, especially for studies of CVR. In general, hypercarbic normoxia is more straight forward to interpret, as the additional confound of small vasoconstrictive effects of hyperoxia and T1 changes owing to hyperoxia are not relevant. However, hypercarbic hyperoxia remains a popular method for performing reactivity measurements, especially in cancer and in experiments of acute or subacute cerebrovascular disease where the increased oxygen that is delivered to tissue provides a possible additional safety mechanism. Relative to normocarbia, we observed a small but significant attenuation in the CBF increase, and BAT reduction, when hypercarbic hyperoxia was used relative to hypercarbic normoxia. One additional limitation of note in our current study was that the baseline PetCO2 value was at, or just beyond, the normal range of normocapnic values (typical range: 35 to 45 mm Hg; PetCO2 in this study: 45.9±1.8 mm Hg). We attribute this to a slight hypercarbic state within the non-rebreathing facemask. While the mask is technically non-rebreathing, the volunteer may still breathe in small amounts of exhaled gas that will have a higher CO2 fraction than atmospheric air. Therefore, the room air values may represent a very slight hypercapnic state rather than a pure normocapnic baseline.
In conclusion, in addition to CBF, BAT changes for different hypercarbic gas stimuli. These values should be considered when choosing optimal experimental parameters for calibrated functional magnetic resonance imaging experiments or CVR measurements.
Footnotes
References
Supplementary Material
Please find the following supplemental material available below.
For Open Access articles published under a Creative Commons License, all supplemental material carries the same license as the article it is associated with.
For non-Open Access articles published, all supplemental material carries a non-exclusive license, and permission requests for re-use of supplemental material or any part of supplemental material shall be sent directly to the copyright owner as specified in the copyright notice associated with the article.