
Abstract
HIV-1 genetic differences influence viral replication and progression to AIDS. HIV-1 circulating recombinant form (CRF)02_AG is the predominant viral subtype infecting humans in West and Central Africa, but its effects on HIV neuropathogenesis are not known. In the present study, we investigated the effects of Tat proteins from HIV-1 subtype B (Tat.B) and HIV-1 CRF02_AG (Tat.AG) on primary human brain microvascular endothelial cells (HBMEC), the major component of the blood–brain barrier (BBB). Using Affymetrix GeneChip Human Gene 1.0.ST arrays, we showed that Tat.AG had minimal effects while Tat.B induced transcriptional upregulation of 90 genes in HBMEC, including proinflammatory chemokines, complement components C3, C7, and complement factor B, matrix metalloproteinases (MMP)-3, MMP-10, and MMP-12. These results were confirmed by real-time PCR. Compared with Tat.AG, Tat.B significantly increased MMP-3, MMP-10, and MMP-12 activities in HBMEC, and the MMPs tissue inhibitor of metalloproteinase-2 blocked Tat-induced increase in MMPs activity. Western blot analyses also showed that Tat increased the expression of C3 and its cleaved fragment C3b in HBMEC. These data suggest that genetic differences between HIV-1 subtypes B and CRF02_AG influence the effects of Tat proteins from these two clades on HBMEC, including molecular and cellular functions, and canonical pathways, which would affect BBB dysfunction and viral neuropathogenesis.
Keywords
INTRODUCTION
Despite the successes of antiretroviral therapy, the brain remains a major target for HIV infection and a major viral reservoir. This viral infection of the central nervous system (CNS) commonly results in behavioral, motor, and cognitive impairments termed as HIV-1-associated neurocognitive disorders. 1 Brain microvascular endothelial cells form continuous capillaries and constitute the major component of the blood–brain barrier (BBB).2,3 One of the main features that form the structural and anatomic basis of the BBB is the presence of tight or occluding junctions between endothelial cells, which prevent paracellular diffusion of solutes via intercellular route and restrict BBB permeability.2,3 HIV infection of the CNS occurs as a result of the BBB breakdown, which enables HIV-1 and infected mononuclear phagocytes to enter the brain and spread infection to resident brain cells.3,4 This BBB breakdown can be caused by HIV and secreted viral factors such as HIV proteins. In fact, there is in vitro and in vivo evidence that HIV-1 virions and secreted viral proteins alter the BBB integrity and function, and increase monocyte entry into the CNS. 3
One such viral protein is the HIV-1 transactivator of transcription (Tat) protein. Tat is released by HIV-infected cells and can be detected in the serum of infected patients, can cross the BBB, 6 and is present in the CNS of HIV-infected humans. 7 It has been shown that HIV-1 Tat proteins can alter the function of many cells including brain endothelial cells and other cells of the neurovascular unit.8,9 HIV-1 Tat induces disruption of tight junction proteins in brain endothelial cells, 8 increases the adhesion of monocytes and T cells to the endothelium in vivo and in vitro, and alters T-cell interaction with endothelial extracellular matrix (ECM) proteins. 10 However, most of those studies were performed using Tat proteins from HIV-1 subtype B, the predominant clade circulating in the United States and Europe; whereas, over two-thirds of the 33.4 million people living with HIV/AIDS are in sub-Saharan Africa and are infected with non-B HIV subtypes, including the circulating recombinant form (CRF)02_AG. 11
HIV-1 currently has four defined groups (M, N, O, and P). 12 The major (M) group has 11 different subtypes (A1, A2, B, C, D, F1, F2, G, H, J, and K) and 55 CRFs. 12 One such CRF is the HIV-1 CRF02_AG, a recombinant of subtypes A and G, circulating in West and Central Africa; 13 with 52% to 84% of HIV-infected humans in that region infected with HIV-1 CRF02_AG.14,15 This Central and West Africa region includes 26 countries with over 456 million inhabitants. 16 It has been shown that subtype differences can affect the efficiency of long-terminal repeat transactivation, can influence Tat-induced cytokine and chemotactic activities,17,18 and can affect the progression to AIDS.19,20 In the current study, we showed differential effects of Tat proteins derived from HIV-1 subtypes B (Tat.B) and CRF02_AG (Tat.AG) on primary human brain microvascular endothelial cells (HBMEC), including a significant transcriptional upregulation of chemokines, complement factors and matrix metalloproteinases (MMPs), complement activation and increased MMP-3, MMP-10, and MMP-12 activity with Tat.B compared with Tat.AG. Ingenuity pathway analysis further suggests that these differential effects of Tat.B and Tat.AG are associated with differences in pathways, molecular and cellular functions.
MATERIALS AND METHODS
Brain Endothelial Cell Culture
Primary HBMEC were isolated from brain tissue obtained during surgical removal of epileptogenic cerebral cortex in adult patients, under an Institutional Review Board-approved protocol at the University of Arizona as described previously. 21 Routine evaluation by immunostaining for von-Willebrand factor, Ulex europaeus lectin and CD31 showed that cells were >99% pure. Freshly isolated cells were cultured in collagen-coated flasks or 6-well culture plates using DMEM/F12 media (Life Technologies, Grand Island, NY, USA) containing 10% fetal bovine serum (Atlanta Biologicals, Flowery Branch, GA, USA), supplemented with 10 mmol/l L-glutamine (Life Technologies), 1% heparin (Thermo Fisher Scientific, Pittsburgh, PA, USA), 1% endothelial cell growth supplement (ECGS; BD Bioscience, San Jose, CA, USA), 1% penicillin-streptomycin (Life Technologies), 1% fungizone (MP Biomedicals, Solon, OH, USA). Cells at passage 2 to 4 were used in this study.
Tat Treatment of Human Brain Microvascular Endothelial Cells and RNA Extraction
Recombinant Tat proteins from a subtype B HIV-1 isolate (Tat.B) (amino acids 1 to 86; accession number: P69697) were purchased from Diatheva (Viale Piceno, Fano, Italy). Recombinant Tat proteins from HIV-1 CRF02_AG (Tat.AG) (amino acids 1 to 86; accession number: AY371128) were made by Diatheva under a custom-order agreement with our laboratory, using similar procedures as for Tat.B.
Confluent HBMEC in 6-well plates were treated with Tat.B or Tat.AG at 100 ng/mL for 48 hours. Controls consisted of untreated cells and cells treated with heat-inactivated Tat (100 ng/mL). Each treatment condition was performed in triplicate, using HBMEC from three different human donors. For time-dependent experiments, HBMEC from a fourth human donor were treated with Tat.B at 100 ng/mL for 2, 4, 12, 24, and 48 hours. For dose-dependent experiments, HBMEC from a fifth donor were treated with Tat.B at 1, 10, and 100 ng/mL for 48 hours. After Tat treatment, cells were harvested; and total RNA was extracted using the RNeasy mini-kit (Qiagen, Valencia, CA, USA) according to the manufacturer's protocol. RNA yield and quality were checked using a NanoDrop spectrophotometer (NanoDrop Technologies, Wilmington, DE, USA) and for all samples, the 260/280 absorbance ratio was ≥2. The purity and quality of extracted RNA were further assessed using the RNA 6000 Nano LabChip Kit and Agilent-2100 Bioanalyzer (Agilent Technologies, Palo Alto, CA, USA) according to the manufacturer's instructions.
Microarray Data Generation
Microarray analysis of samples was performed using the Affymetrix GeneChip Human Gene 1.0 ST arrays (Affymetrix, Santa Clara, CA, USA). Briefly, 200 ng total RNA was reverse transcribed using the Affymetrix labeling kit and protocol as per the manufacturer's instructions. Probes were then hybridized to the Affymetrix GeneChip Human Gene 1.0 ST arrays, which include 764,885 probe sets and profiles the expression of >36,079 unique transcripts. After washing and staining, the chips were scanned using the Affymetrix GeneChip 3000 scanner in the University of Nebraska Medical Center (UNMC) microarray core facility. Images were analyzed using the Affymetrix GeneChip Operating Software and quality metric parameters including noise level, background, and efficiency of reverse transcription ascertained for all hybridizations. Data sets passing the stringent quality recommendations were further analyzed to identify differentially expressed genes. With false discovery rate (FDR) being controlled at a 0.05 level, only genes with a minimum average differential expression of 1.9-fold were considered.
Analysis of Microarray Data
The twelve eel files collecting gene expression profile of samples from three subjects under four treatment conditions (HBMC treated with Tat.B, Tat.AG, heat-inactivated Tat.AG, and untreated cells) were normalized using the Robust Multi-array Analysis method and summarized at the gene level using the Affymetrix Expression console software. The control (untreated cells) condition was considered as a reference. The Linear Models for Microarray Data method was used to assess the differential expression after Tat.AG treatment when compared with the other three conditions (Tat.B, heat-inactivated Tat.AG, and untreated control), and to assess differential expression between Tat.B and control. The Linear Models for Microarray Data method was considered to account for the confounding effects of subjects to the gene expression values. The FDR was estimated by the Benjamini Hochberg method to adjust for multiple comparisons. Genes with at least 1.9-fold change and the Benjamini Hochberg-adjusted P value of <0.05 (controlling the FDR at 0.05) were identified to be differentially expressed. Heatmap was drawn on the log2-fold change values in the Tat.AG, heat-Tat.AG, and Tat.B treatment conditions versus untreated control for each subject. The genes were clustered using hierarchical clustering based on Euclidean distance and average linkage. Differentially expressed genes were further analyzed using the Ingenuity Pathways Analysis 3.0 (IPA) software (Ingenuity Systems Inc, Redwood City, CA, USA).
Real-Time PCR
For each sample, cDNA was generated from 1 μg RNA using High Capacity cDNA Reverse Transcription Kit (Applied Biosystems, Foster City, CA, USA), according to the manufacturer's instructions. Reverse transcription was performed for 2 hours at 42°C. The cDNA obtained was used for quantitative real-time PCR using StepOnePlus Real-Time PCR Systems (Applied Biosystems). StepOne software v2.0 detection system (Applied Biosystems) was used, and gene quantification was performed using the Ct method as described in the software user manual. All PCR reagents and primers were obtained from Applied Biosystems; and primer IDs were as follows: MMP-3 (Hs00968305_m1), MMP-10 (Hs00233987_m1) MMP-12 (Hs00899662_m1), chemokine (C-C motif) ligand 5 (CCL5) (Hs00174575_m1), chemokine (C-X-C motif) ligand 6 (CXCL6) (Hs00605742_g1), chitinase-3-like protein 2 (CHI3L2) (Hs00970220_m1), transglutaminase-2(TGM2) (Hs00190278_m1), and C3 (Hs00163811_m1). For endogenous control, each gene expression was normalized to GAPDH (Hs99999905_m1).
Quantification of Matrix Metalloproteinase-3, Matrix Metalloproteinase-10, and Matrix Metalloproteinase-12 Activities
Human brain microvascular endothelial cells from three different donors were cultured in collagen-coated 6-well plates in DMEM/F12 media containing 10% fetal bovine serum supplemented with 10 mmol/l L-glutamine, 1% heparin, 1% ECGS, 1% penicillin-streptomycin, and 1% Fungizone (complete media). At 70% to 80% confluency, complete media was replaced by media without ECGS; 48 hours later, cells were washed, placed in media containing no ECGS or fetal bovine serum and treated with Tat.B or Tat.AG at 1, 10, 100, and 1000 ng/mL for 48 hours. Negative controls consisted of untreated cells, cells treated with heat-inactivated Tat proteins, and positive controls consisted of cells treated with lipopolysaccharide (LPS) (50μg/mL). Additional controls included cells treated with Tat in the presence of the MMPs inhibitor tissue inhibitor of metalloproteinase-2(TIMP2) (100 ng/mL). After Tat treatment, culture supernatant was collected for MMP activity assays and cells harvested for western blot analyses. The MMP-3, MMP-10, and MMP-12 activity in culture supernatant was quantified by fluorometric analyses using the MMP-3 Activity Fluorometric Assay Kit (BioVision, Milpitas, CA, USA), the SensoLyte520 MMP-10 Assay Kit, and the SensoLyte490 MMP-12 Assay Kit (AnaSpec Inc., Fremont, CA, USA), according to the manufacturers' instructions.
Protein Extraction and Western Blot Analyses
Protein extraction, quantification, and western blot analyses were performed as previously descri bed. 21 Briefly, cells were lysed using the mammalian cell lysis buffer CelLytic M (Sigma, St Louis, MO, USA), and protein quantified using the bicinchoninic acid assay as we previously described. 21 Twenty-five micrograms of proteins were fractionated in a 10% sodium dodecyl sulfate-polyacrylamide gel electrophoresis and transferred onto nitrocellulose membranes. Membranes were blocked for 1 hour with SuperBlock T-20 (Pierce, Rockford, IL, USA), blotted 2 hours or overnight with monoclonal antibodies to complement C3 or its cleaved proteins C3a and C3b (Abeam, Cambridge, MA, USA) at 1:5,000 dilution, then washed and visualized using the enhanced chemiluminescence system (Pierce) and gel doc system (Syngene, Frederick, MD, USA). After each western blot experiment, membranes were stripped using Restore Western Blot Stripping Buffer (Pierce) and reblotted with β-actin antibody to confirm equal loading. To confirm the presence of Tat proteins in Tat.AG preparations, we analyzed 4 μg to 1 ng proteins by western blotting using Tat monoclonal antibodies #1974 and #4138 22 from the NIH AIDS Reagent Program.
All experiments were approved by the UNMC Institutional Biosafety Committee, and performed in accordance with the UNMC protocol for research involving biohazardous materials.
Statistical Analysis
Data were analyzed by one- or two-way ANOVA followed by Tukey's multiple-comparisons tests using GraphPad Prism 5.0b (GraphPad Software, La Jolla, CA, USA). Threshold of significance level was 0.05.
RESULTS
Assessment of Microarray Data Quality
To examine the full spectrum of HIV-1 Tat protein-induced effects on the HBMEC genome, we used an Affymetrix system with the Affymetrix GeneChip Human Gene 1.0 ST arrays. After generating microarray data, we validated data quality among all donors' samples at the probe level. All arrays were consistent with respect to the probe intensity and showed a similar level of distribution between replicates. We further evaluated data quality at the probe-set level by conducting a Robust Multi-array Analysis with quantile normalization. Figure 1 shows the variability of the data (M) as a function of the mean (A) (MvA plot) for all samples. Data quality, probe intensity, and probe-set signals were consistent across arrays and across replicate samples.
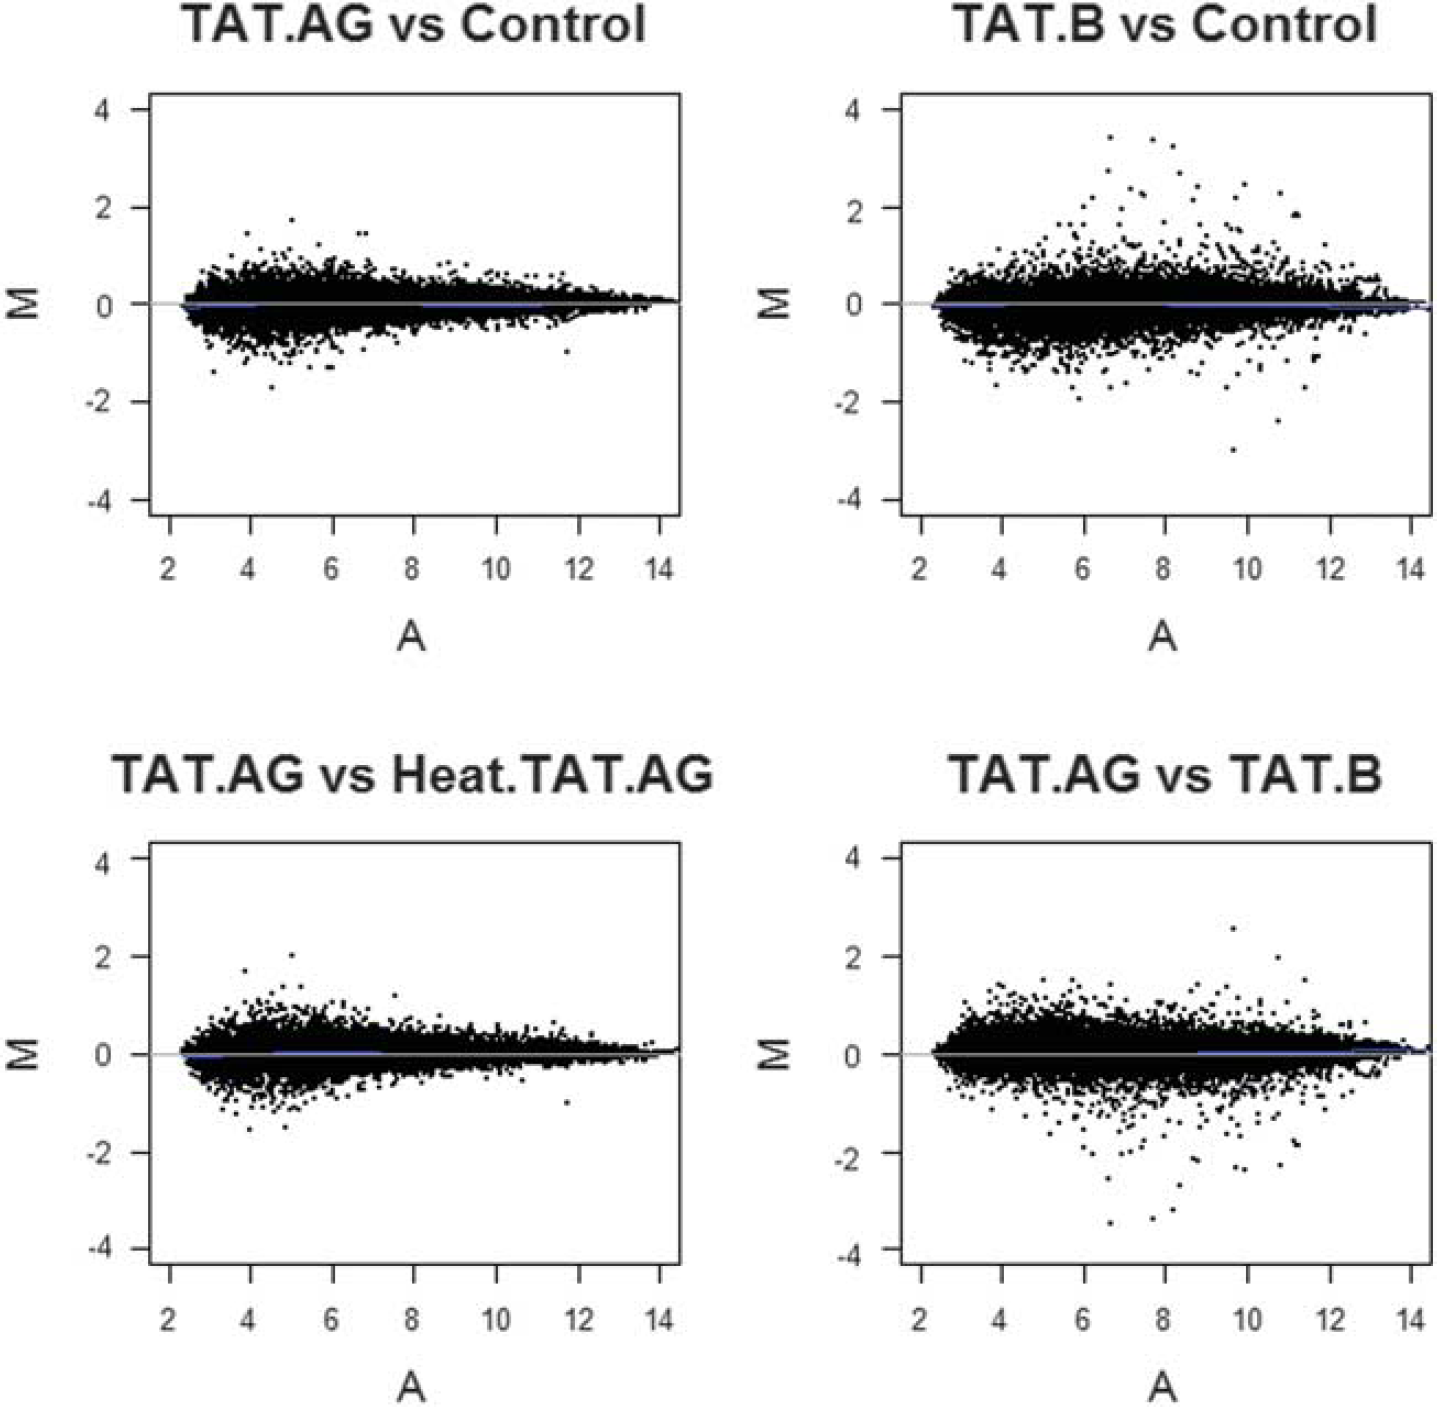
Assessment of microarray data quality. MvA plots of the probe-set signal estimates after Robust Multi-array Analysis model fit (GC Robust Multi-array Average background correction plus quantile normalization). None of the samples reveal any special pattern; data quality, probe intensity, and probe-set signals were consistent across arrays and across donor replicate samples. Y axis (M value) = log2 geometric mean intensity for condition 2 — log2 geometric mean intensity for condition 1; X axis (A value) = (log2 geometric mean intensity for condition 2 + log2 geometric mean intensity for condition 1)/2. Lines are drawn after the Loess fitting of M values and correspond to the zero level of M values. Sample IDs are as follows: Controls: untreated human brain microvascular endothelial cells (HBMEC), TAT.AG: HBMEC treated with HIV-1 Tat.AG; TAT.B: HBMEC treated with HIV-1 Tat.B; Heat. TAT.AG: HBMEC treated with heat-inactivated Tat.AG. All Tat proteins were used at 100 ng/mL, and all cells were treated for 48 hours. Each analysis was performed using replicate data from all three donors.
Microarray Analysis of Human Brain Microvascular Endothelial Cells Treated with Tat.B and Tat.AG
Using a stringent data filter as described in Materials and methods with a 1.9-fold cutoff, control of FDR at 0.05, and linear modeling, we identified 108 probe sets that were differentially expressed in HBMEC exposed to Tat.B, compared with HBMC exposed to Tat.AG, untreated cells, or cells treated with heat-inactivated Tat proteins (Figure 2). These 108 differentially expressed probe sets corresponded to 106 differentially expressed genes, of which 90 were upregulated and 16 were downregulated in Tat.B-treated cells, compared with Tat.AG-treated cells or untreated controls (Table 1; Figure 2). Human brain microvascular endothelial cells exposed to Tat.AG showed no significant differential transcription, and mRNA levels were overall similar to levels in untreated controls (Table 1; Figures 2–4).
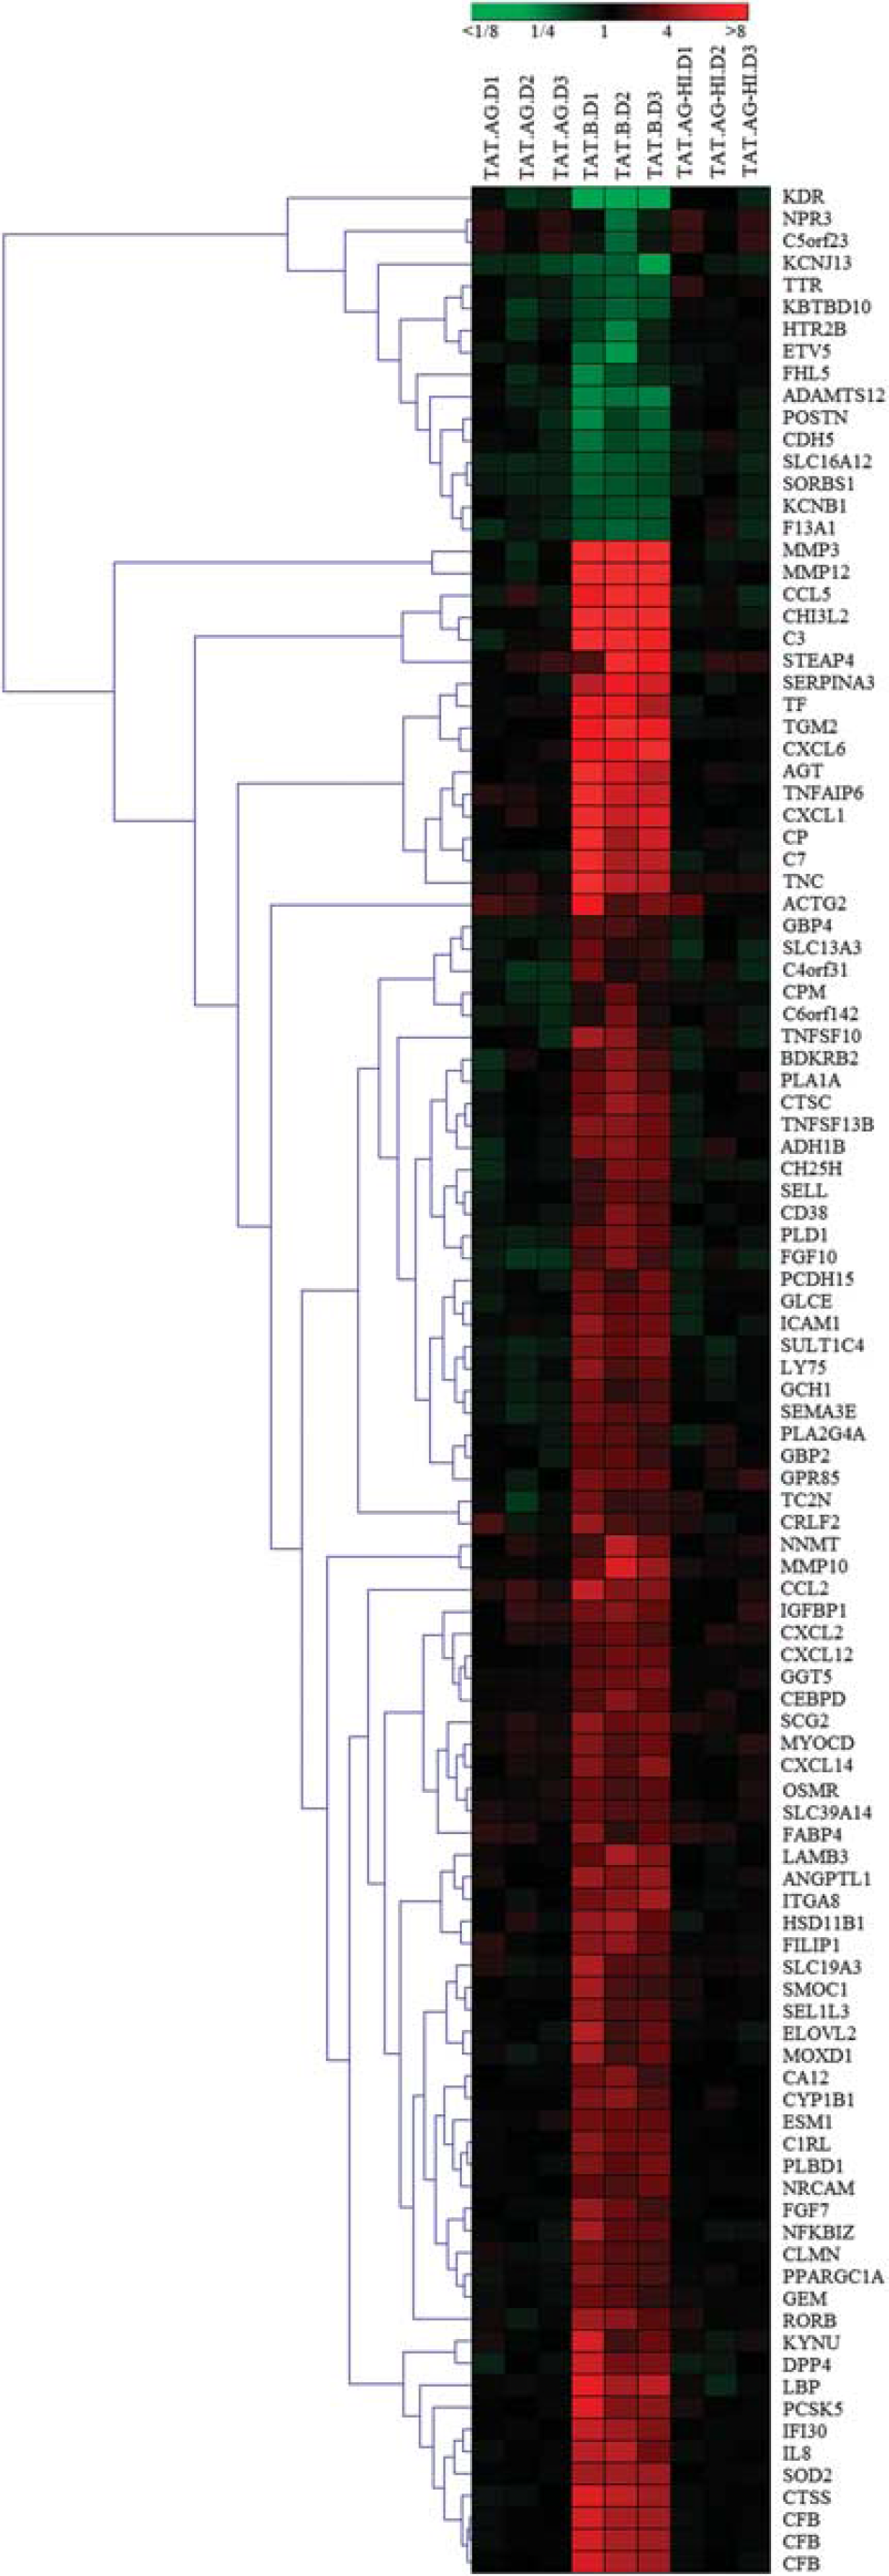
Hierarchical clustering of differentially expressed genes. Cluster images show the expression profiles of transcripts with at least 1.9-fold change and control of false discovery rate (FDR) at 0.05 when comparing human brain microvascular endothelial cells (HBMEC) treated with Tat-AG with all other treatment conditions: cells treated with Tat-B, heat-inactivated Tat-AG (TAT.AG-HI), and untreated control. All gene expression was estimated using untreated controls as a reference, and differential expression analysis was performed using the linear model for microarray data. Hierarchical analysis performed as described in Materials and methods. Expression levels are represented on a continuum from green (low abundance) to red (high abundance). Sample donors' IDs are as follows: D1: donor 1; D2: donor 2; D3: donor 3.
Differentially expressed genes in Tat-exposed HBMEC
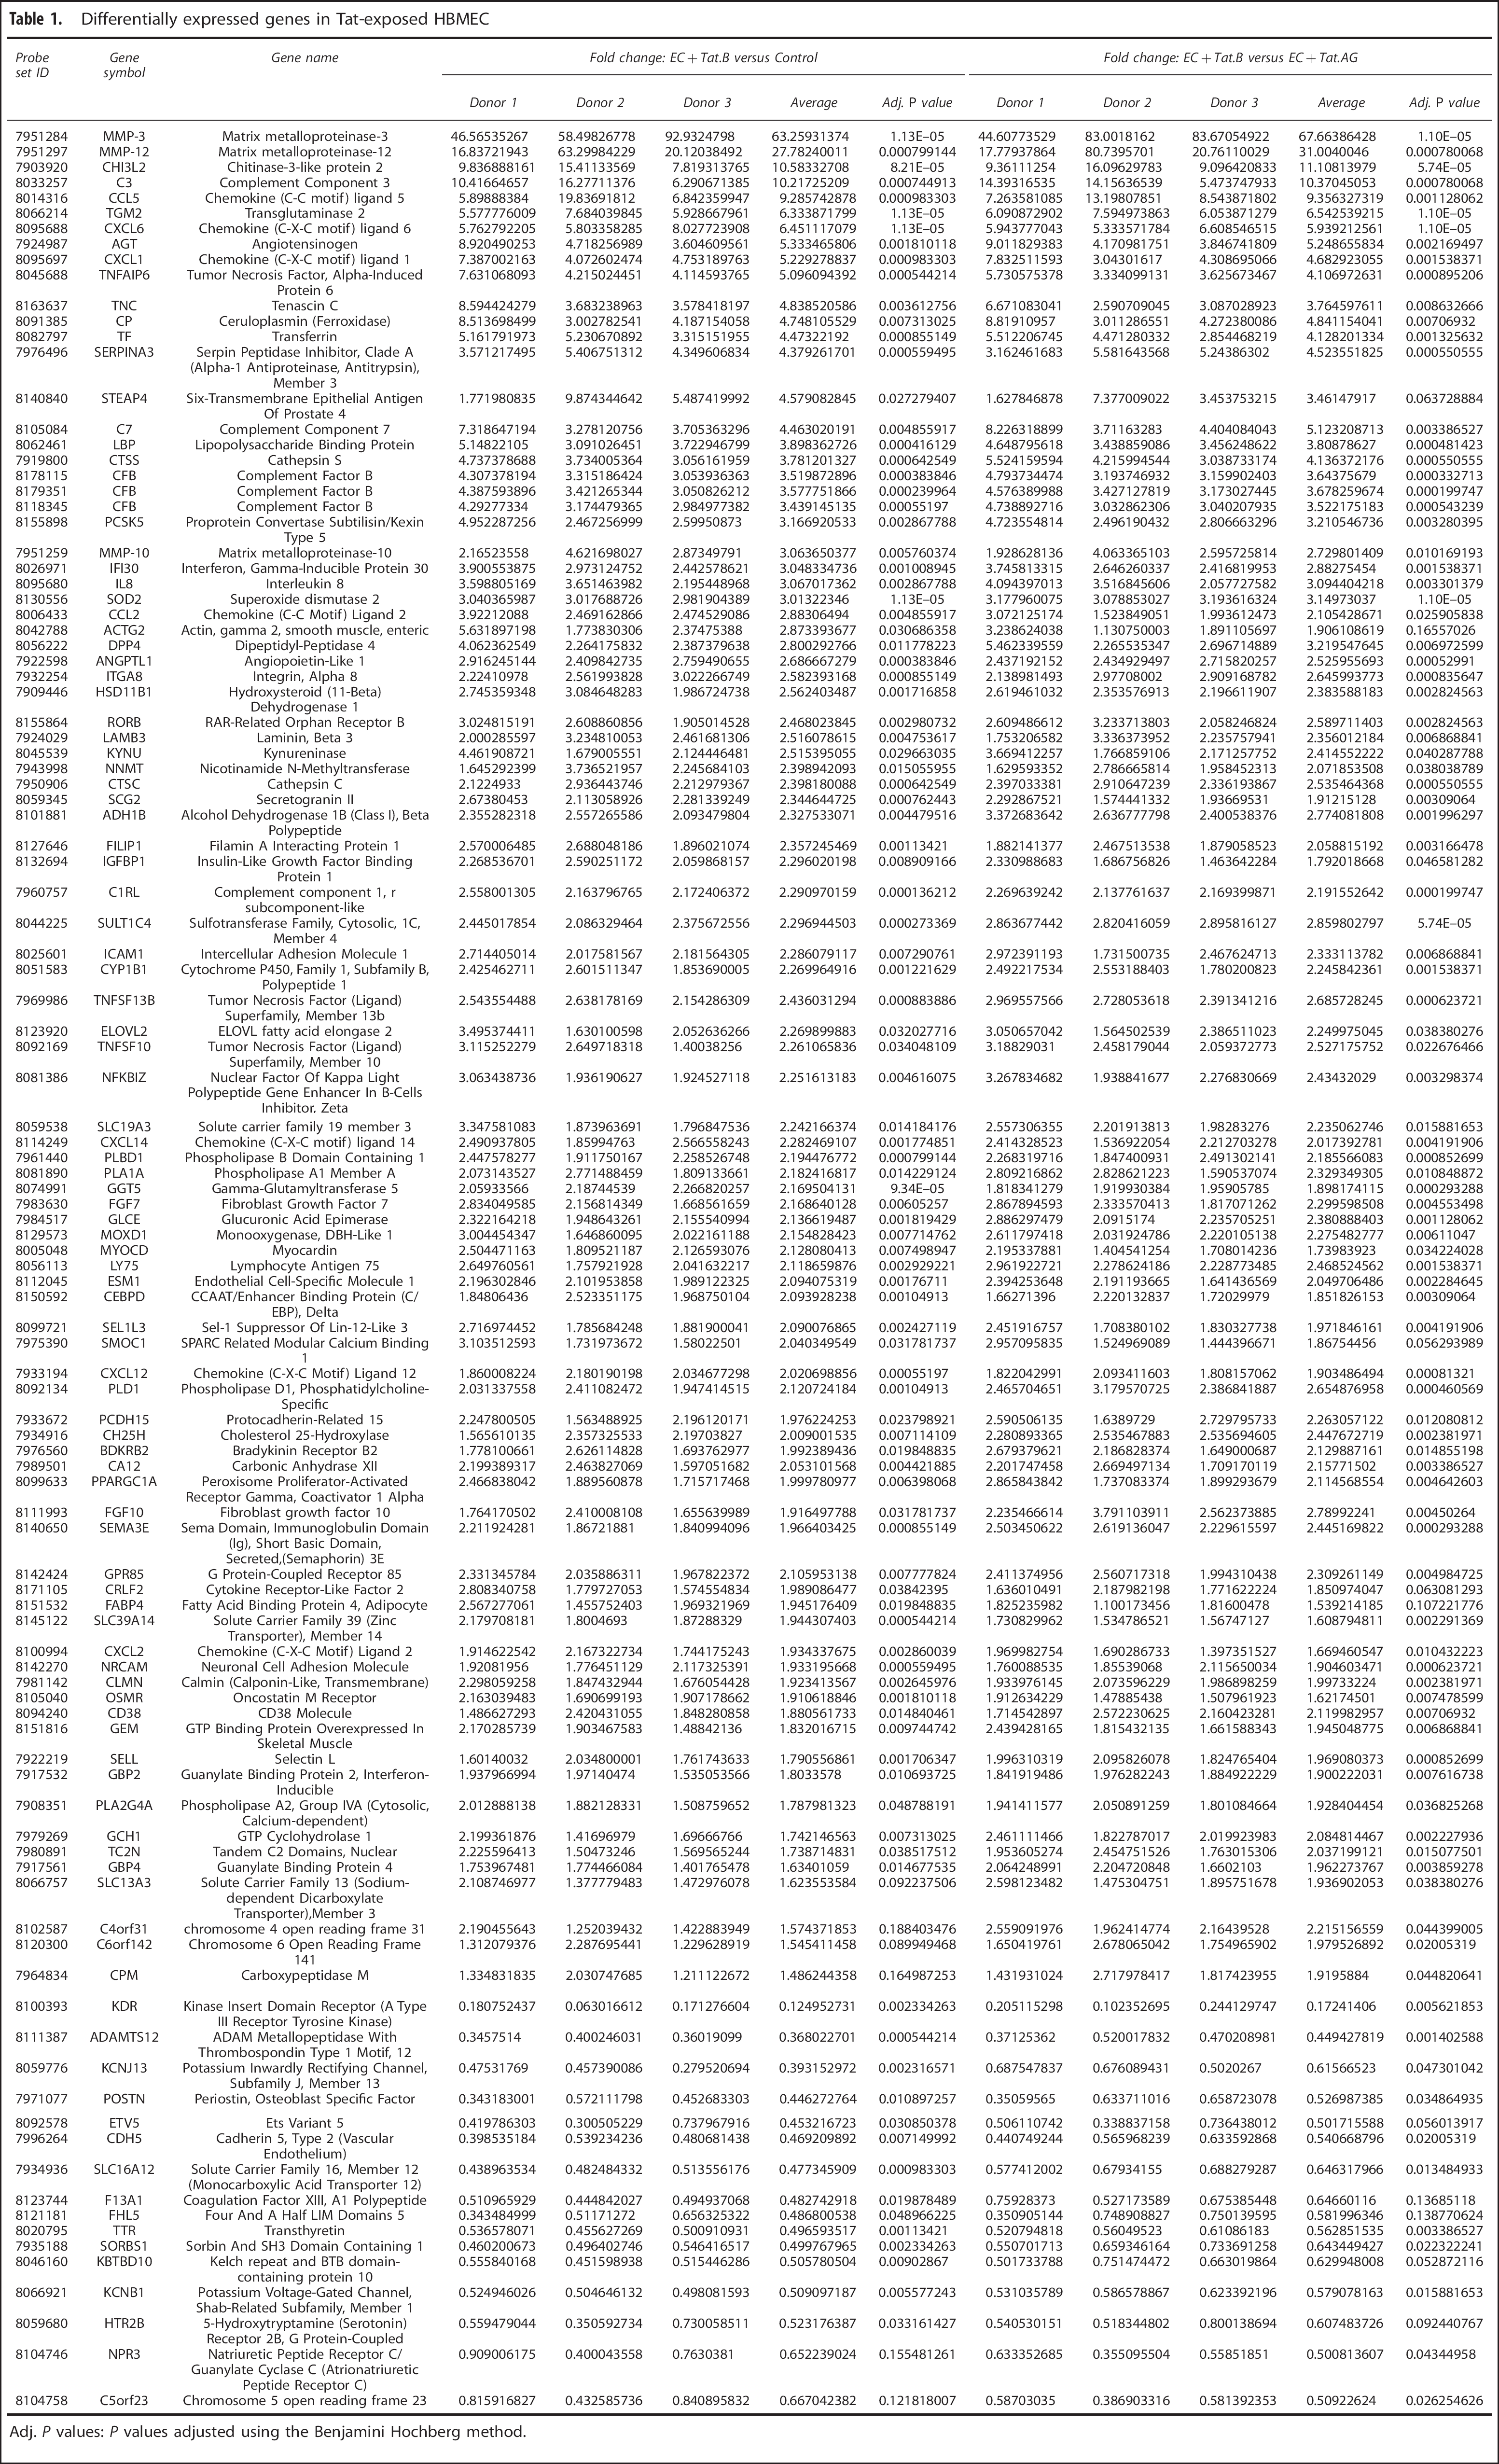
Adj. P values: P values adjusted using the Benjamini Hochberg method.
Upregulated genes in HBMEC exposed to Tat.B, compared with HBMEC exposed to Tat.AG or controls, included MMP-3 (> 63-fold), MMP-12 (>27-fold), and MMP-10 (>2.7-fold) (Table 1; Figure 2); all of which are endopeptidases associated with ECM, cellular matrix processing, and stability. Other upregulated genes and enzymes known to be associated with ECM included CHI3L2 (>10-fold), TGM2 (6.3-fold); tumor necrosis factor alpha-inducible protein-6 (4- to 5-fold), TNC (3.7- to 4.8-fold), serpin peptidase inhibitor A3 (4.5-fold), the meta Ho reductase six-transmembrane epithelial antigen of prostate 4 (1.6- to 3.4-fold), peptidases cathepsin S (3.8- to 4-fold), cathepsin C (2.4- to 2.5-fold), dipeptidyl peptidase 4 (3-fold), protein convertase PCSK5 (3-fold), superoxide dismutase 2 (3-fold) (Table 1; Figure 2). Chemokine upregulated included the CCL5 (9-fold), CCL2 (2-fold), interleukin-8 (3-fold), the CXCL1 (4.7- to 5-fold), CXCL14 (2-fold), CXCL12 (2-fold), and CXCL2 (1.6- to 2-fold). Other upregulated genes included intercellular adhesion molecule-1(2-fold) and genes associated with the complement pathway: complement component 3 (C3, > 10-fold), C7 (4- to 5-fold), complement factor B (CFB, 3.5-fold), transferrin (> 4-fold), and ceruloplasmin (4.8-fold) (Table 1; Figure 2). Genes downregulated in HBMEC exposed to Tat.B, compared with HBMEC exposed to Tat.AG or controls included kinase insert domain receptor (5.8- to 8-fold), and a disintegrin and metalloproteinase with thrombospondin motifs 12 (2.2- to 2.7-fold) (Table 1; Figure 2).
Canonical Pathways and Functions Associated with Genes Differentially Expressed in Tat.B-treated Human Brain Microvascular Endothelial Cells Compared with Tat.AG-Treated Cells
Ingenuity pathways analysis showed that specific pathways likely to be activated by genes differentially expressed in Tat.B exposed HBMEC included acute phase response signaling, leukocyte extravasation signaling, chemokine signaling, IL-8, IL-6, and IL-17 signaling, immune cells communication, clathrin-mediated endocytosis signaling, and actin cytoskeleton signaling (Supplementary Figure 1). Further analysis showed that these differentially expressed genes were associated with cellular movement, cell-to-cell signaling and interaction, cellular growth and proliferation, cellular function and maintenance, and antigen presentation (Supplementary Table 1).
Validation of Differential Molecular Alterations Induced by Tat.B and Tat.AG in Human Brain Microvascular Endothelial Cells
To validate the results of our genomic experiments, we performed real-time quantitative PCR with the same RNA samples used for microarray analysis. Data for three different human donors confirmed our microarray results and showed a significant upregulation of mRNA for MMPs (MMP-3, MMP-10, and MMP-12), TGM2, and CHI32 (Figure 3), as well as complement C3 and proinflammatory chemokines (CCL5 and CXCL6) (Figure 4) in HBMEC exposed to Tat.B, compared with cells exposed to Tat.AG or untreated controls. Additional independent experiments using primary HBMEC from another (fourth) human donor confirmed these findings and showed that Tat.B significantly increased mRNA for C3, CCL5, CXCL6, CHI32, TGM2, and MMPs (MMP-3, MMP-10, and MMP-12), while Tat.AG had no effect (Supplementary Figure 2). Untreated controls, cells treated with heat-inactivated Tat.B, and cells treated with heat-inactivated Tat.AG also showed no effect (Supplementary Figure 2).
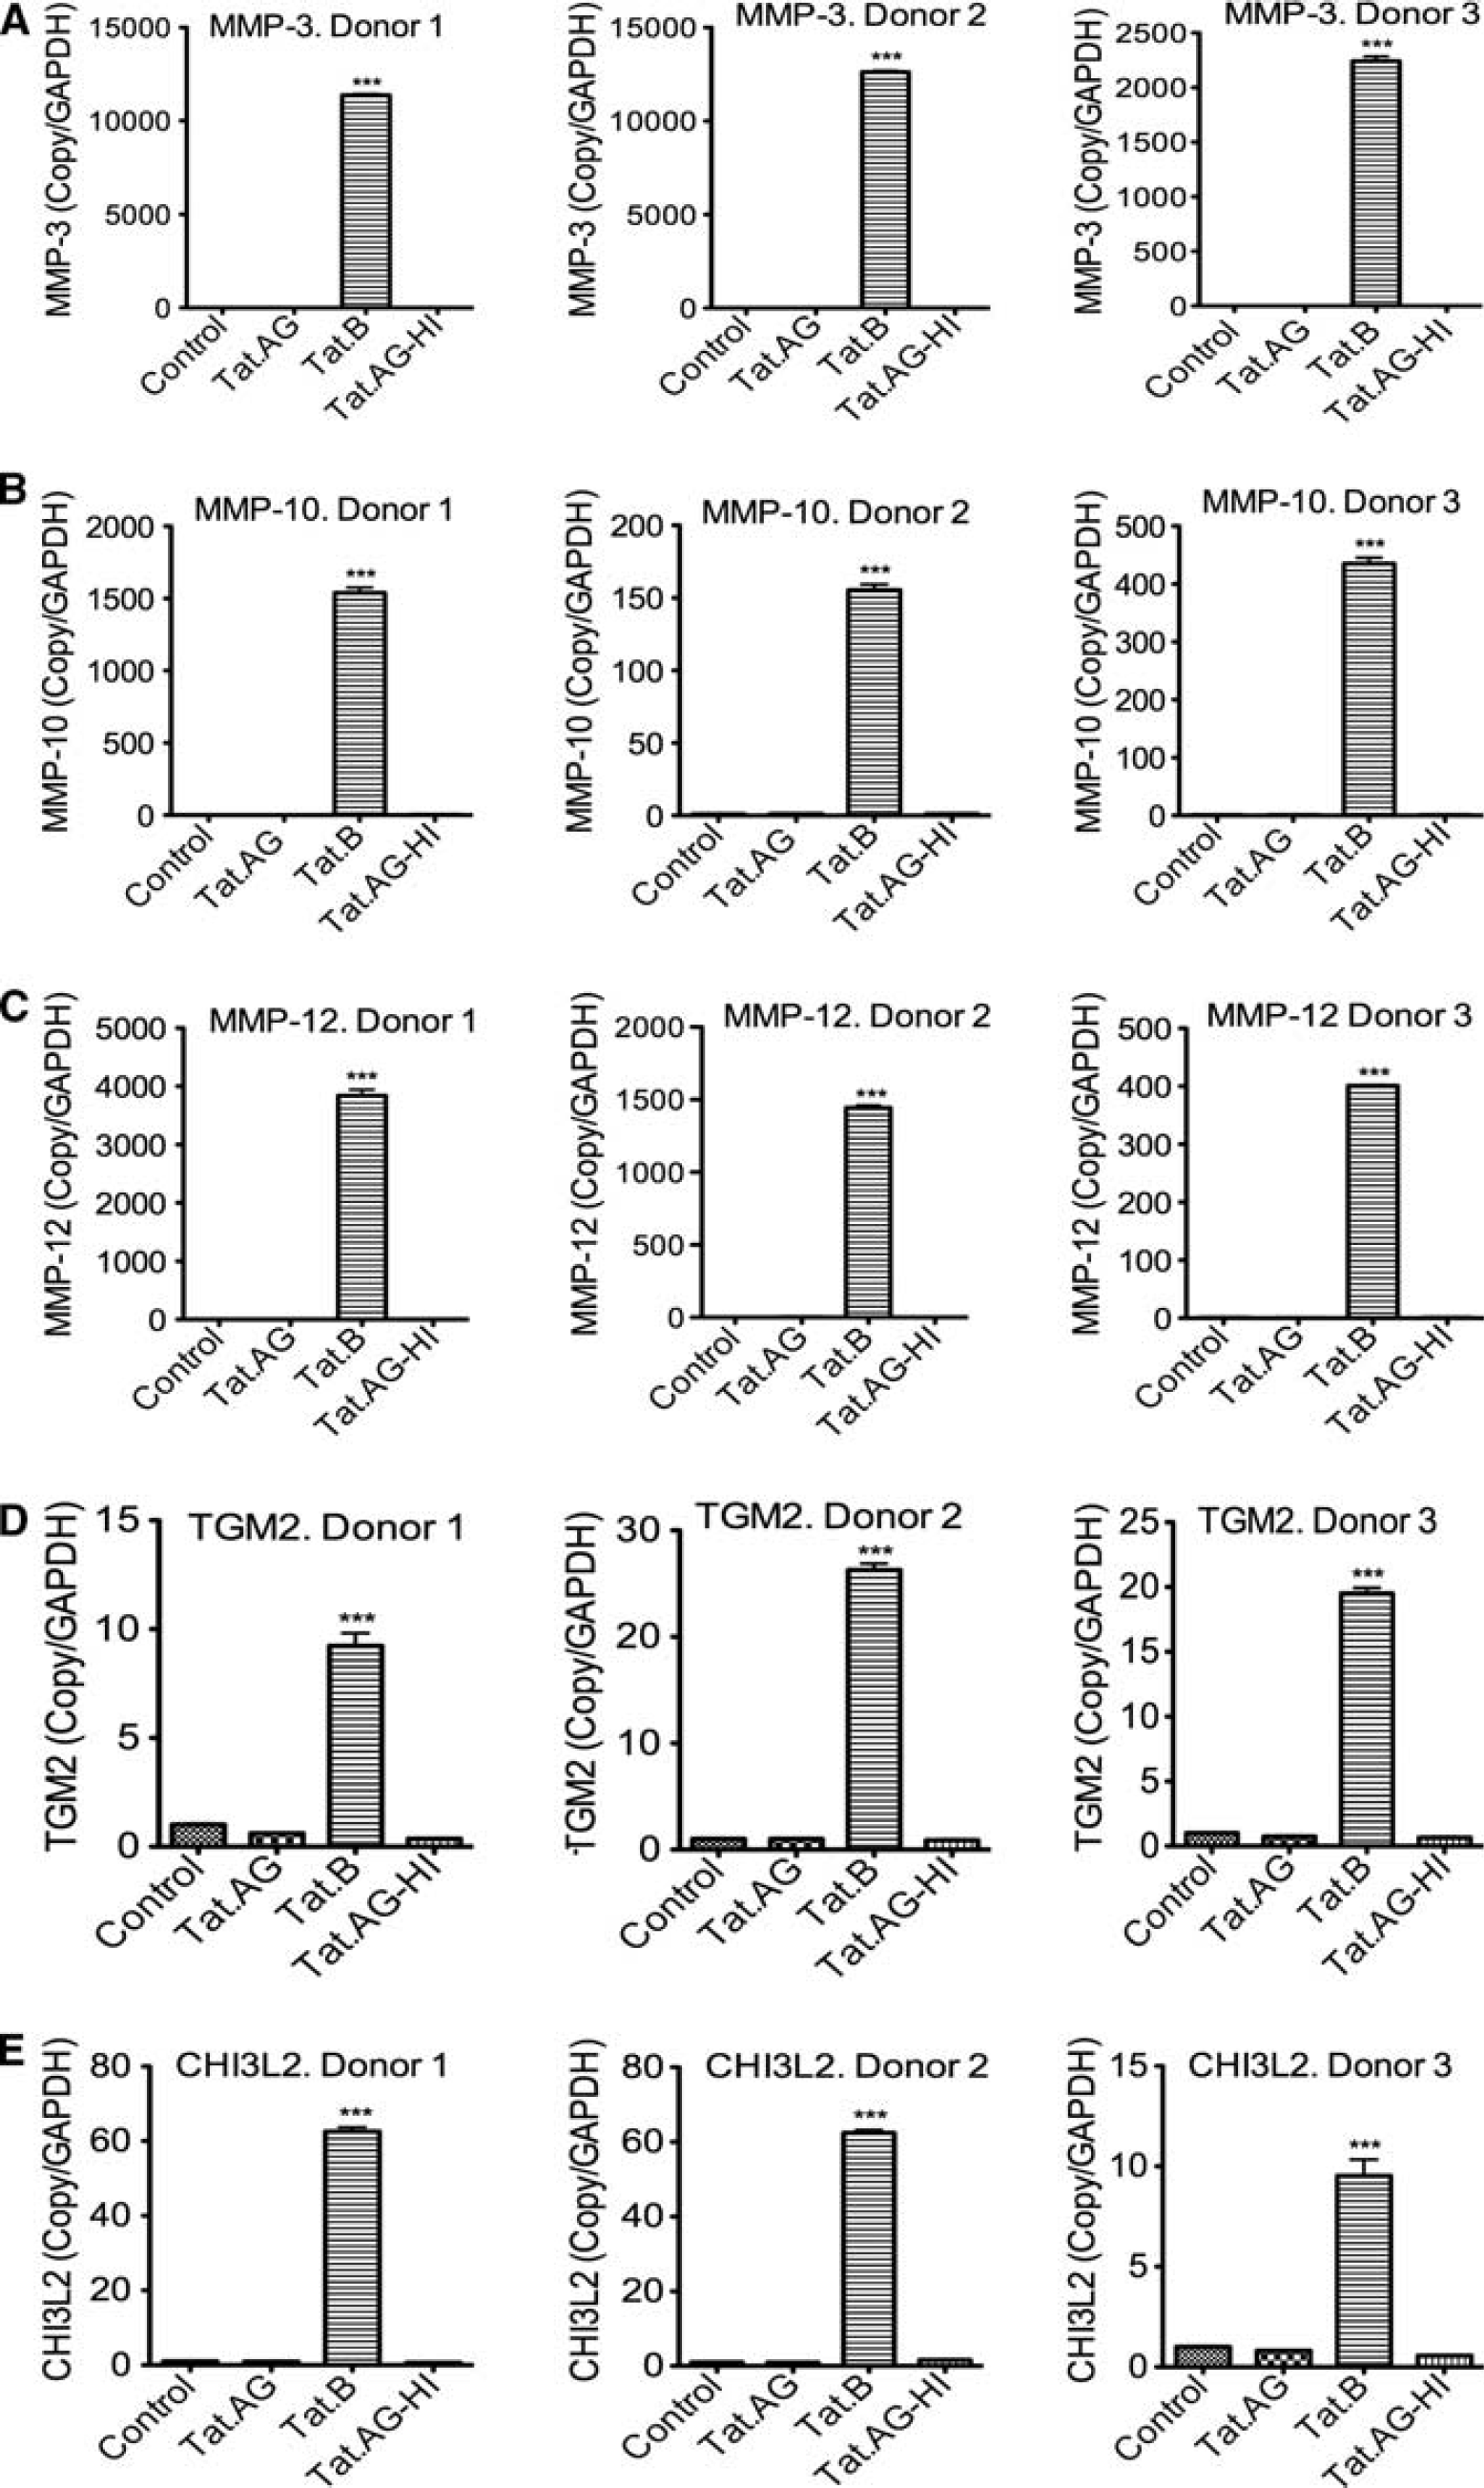
Real-time PCR validation of differentially expressed enzymes. Data confirmed that
compared with Tat.AG, Tat.B upregulates zinc endopeptidases matrix metalloproteinase
(MMP)-3
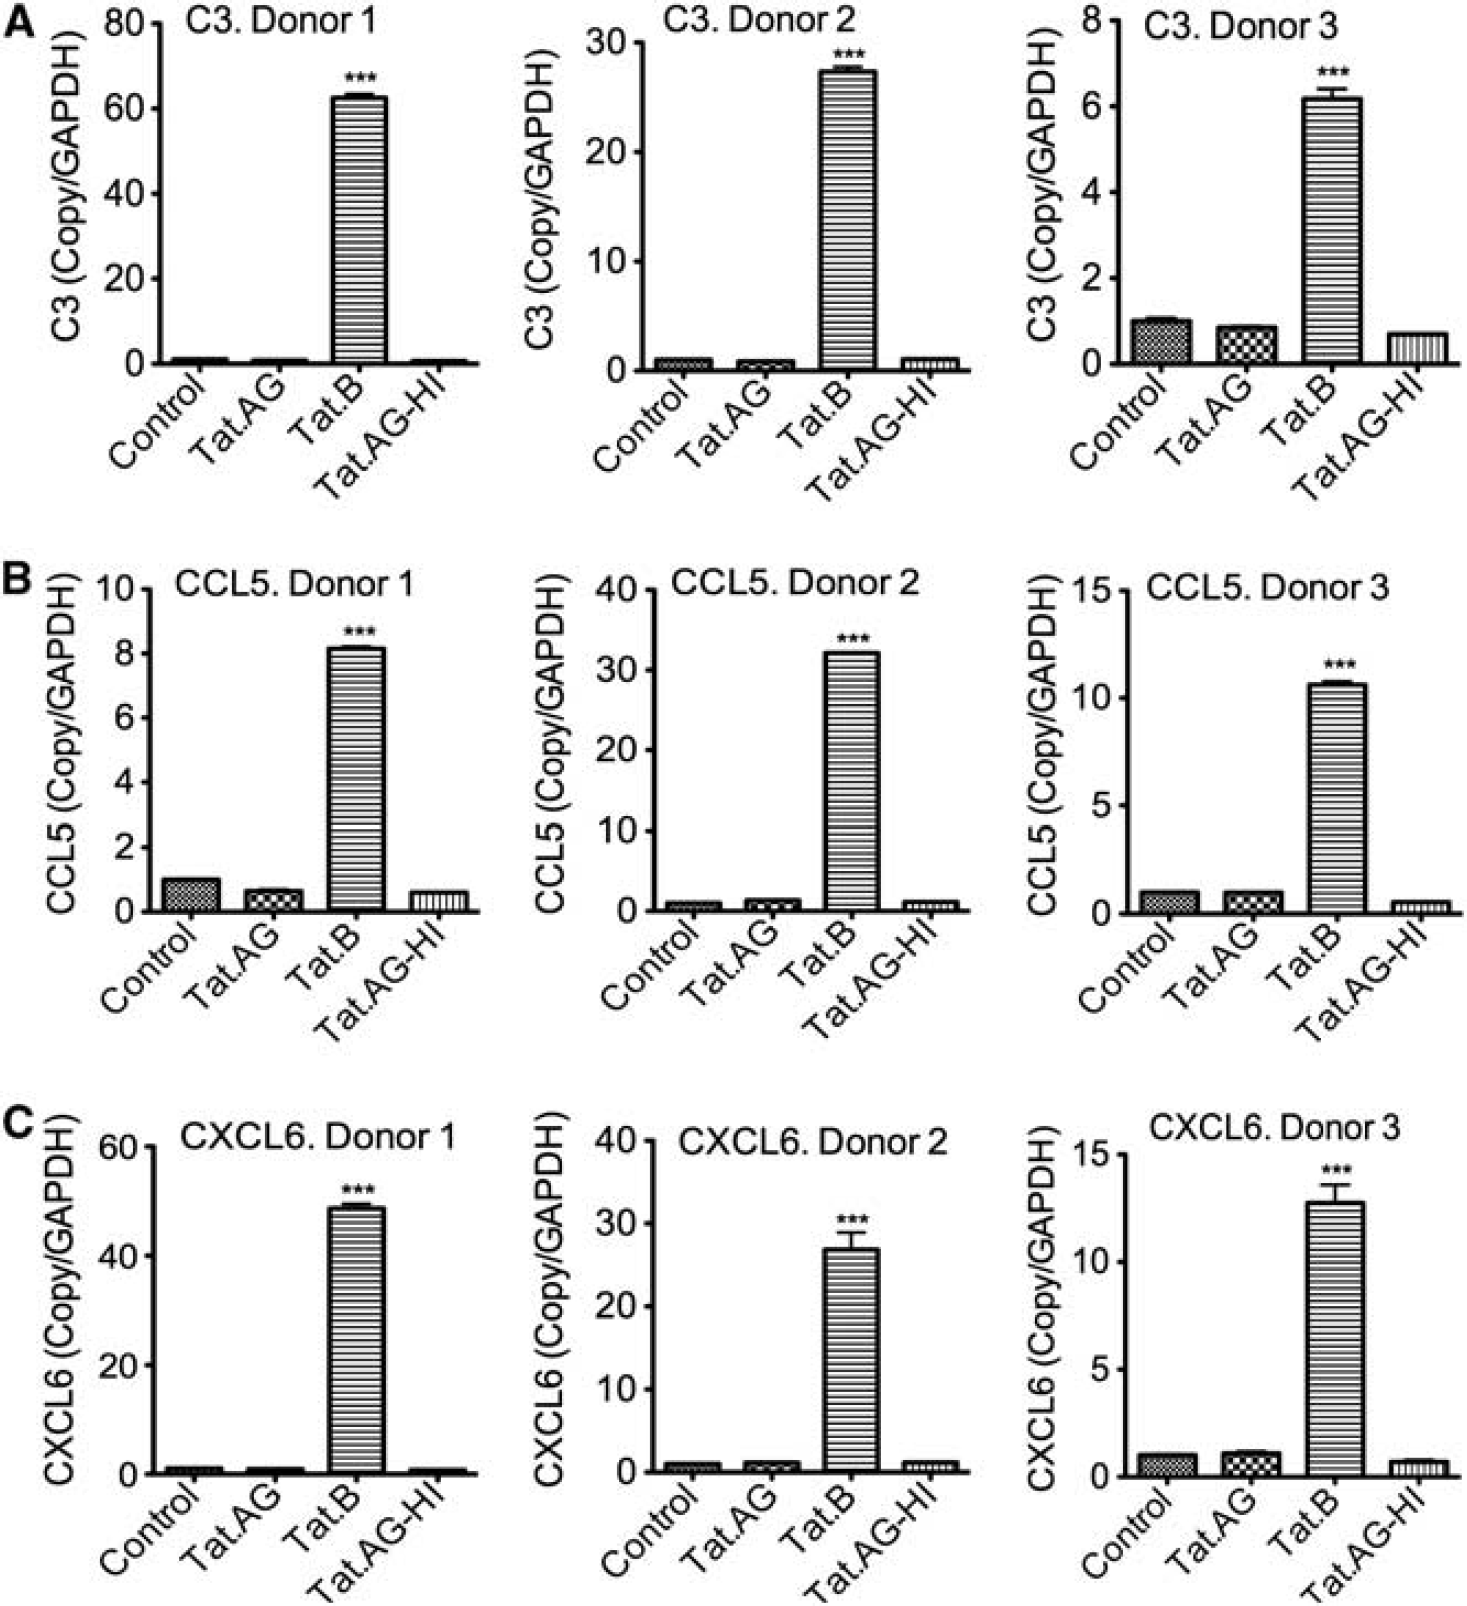
Real-time PCR validation of differentially expressed complement and chemokines. Data
confirmed that compared with Tat.AG, Tat.B upregulates C3
Time-course experiments showed that Tat.B increased C3 and chemokines (CCL5 and CXCL6) mRNA from 2 hours after treatment, with maximum levels between 12 and 48 hours (Supplementary Figures 3A–C). Tat.B also increased TGM2 and CHI32 mRNA from 12 hours, with maximal levels at 48 hours after treatment (Supplementary Figures 3D and E). Tat.B increased MMP-3, MMP-10, and MMP-12 mRNA levels in HBMEC from 2 to 4 hours after treatment, with maximal levels at 12, 4, and 24 hours after treatment respectively for MMP-3, MMP-10, and MMP-12 (Supplementary Figures 3F–H). Matrix metalloproteinase levels at 48 hours were lower than levels at earlier time points, but higher than MMP levels in untreated controls (Supplementary Figures 3F–H).
Dose-dependent experiments using primary HBMEC from a fifth donor confirmed Tat.B-induced transcriptional upregulation of C3, CXCL6, TGM2, MMP-3, MMP-10, and MMP-12, with highest mRNA levels observed with cells treated with 100 ng/mL Tat.B (Supplementary Figures 4A–F). No significant gene expression was observed in cells treated with 1 or 10 ng/mL Tat.B, and gene expression levels in those cells were similar to levels in untreated controls (Supplementary Figures 4A–F).
Tat.B Increases Matrix Metalloproteinase-3, Matrix Metalloproteinase-10, and Matrix Metalloproteinase-12 activities in Human Brain Microvascular Endothelial Cells, Compared with Tat.AG
It is known that MMPs degrade ECM components, and MMPs activation is associated with tissue remodeling and disease pathobiology. 23 To determine whether differential regulation of MMP-3, MMP-10, and MMP-12 mRNA by Tat.B, compared with Tat.AG, correlates with the activity of these MMPs, we used fluorometric assays to quantify MMP-3, MMP-10, and MMP-12 activities in Tat-treated HBMEC. Experiments using HBMEC from different donors showed that Tat.B significantly increased MMP-3 activity in HBMEC (by 6.6- to 10-fold, Figures 5A–C). Tat.AG also increased MMP-3 activity in HBMEC but to much lower levels than Tat.B (by 2.2- to 2.5-fold, Figure 5), even though no increase in MMP3 mRNA levels was observed in Tat.AG-treated cells. To further show the specificity of Tat-induced MMPs activity, we quantified MMPs activity in the presence of Tat and the MMPs inhibitor TIMP2. Tissue inhibitor of metalloproteinase-2 significantly reduced Tat.B (Figure 5D, P<0.001) and Tat.AG (Figure 5D, P<0.05) induced increase in MMP-3 activity. Tat.B increased MMP-10 activity in HBMEC from all three donors in a dose-dependent manner (Figures 5E–G, P<0.001) while Tat.AG had minimal effects on MMP-10 activity (Figures 5E–G). Tissue inhibitor of metalloproteinase-2 reduced Tat-induced increase in MMP-10 activity, but the difference was not statistically significant due to large variations among replicate samples (Figure 5H).
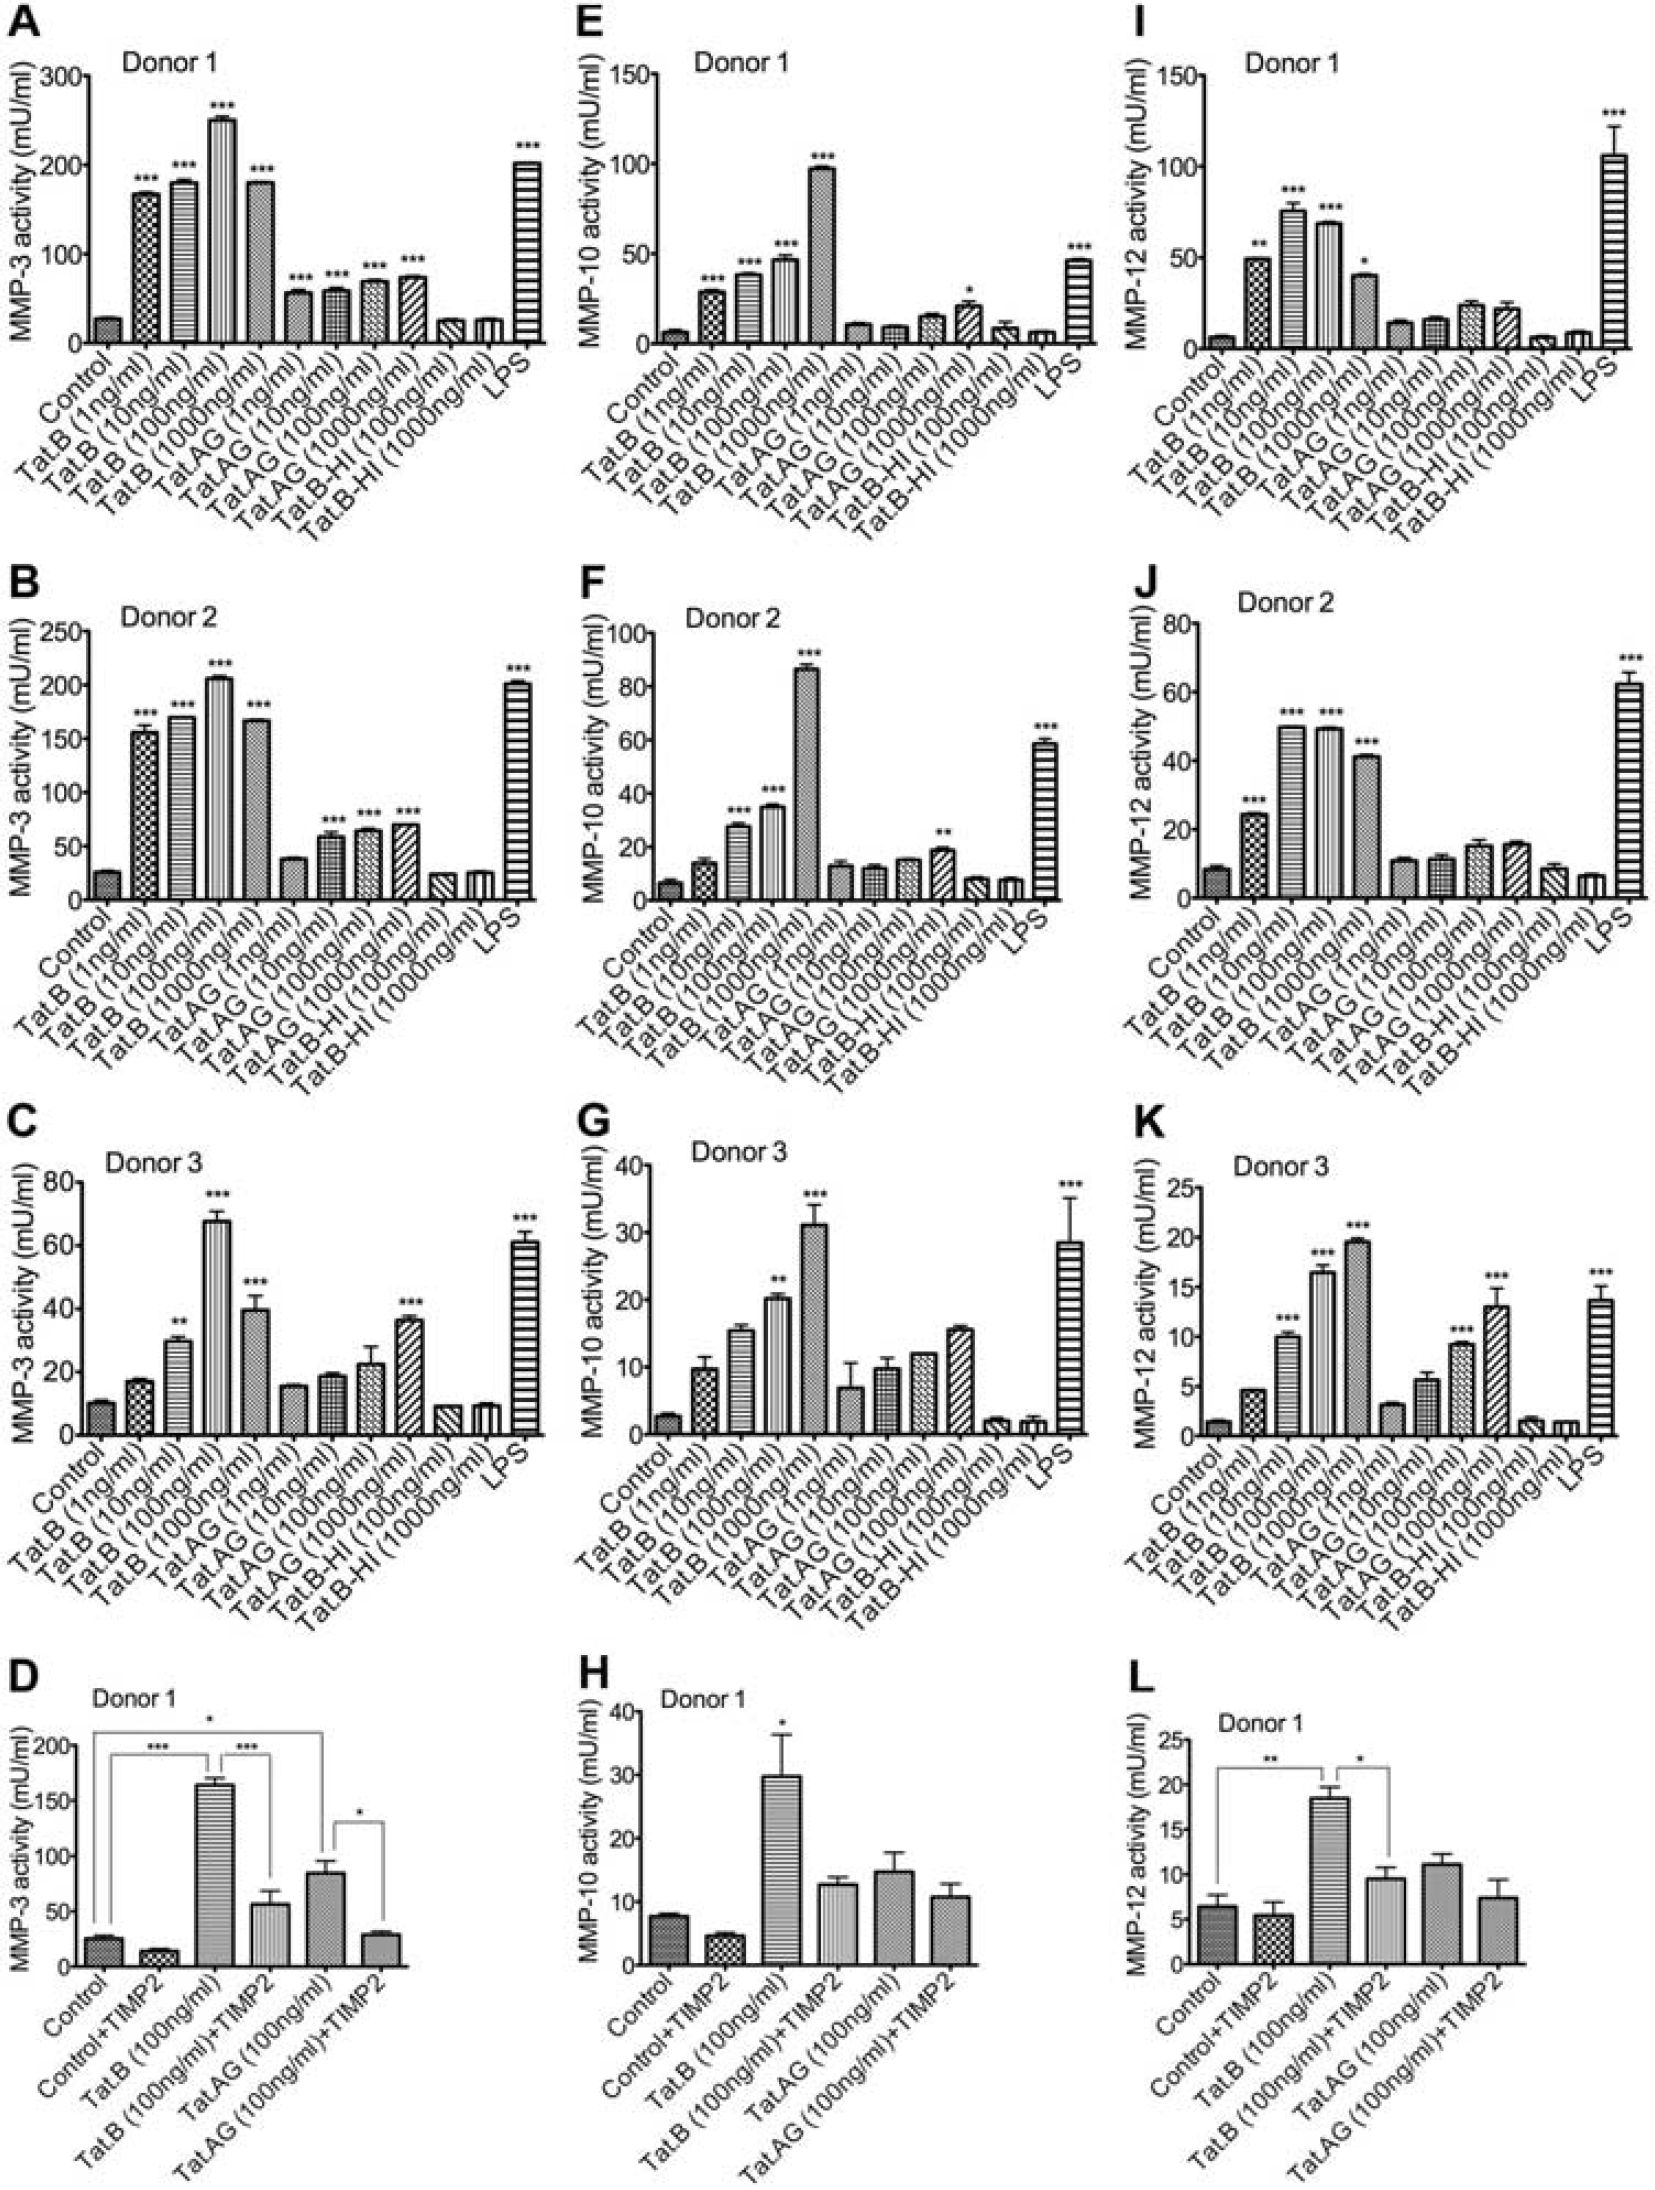
Increased matrix metalloproteinase (MMP)-3, MMP-10, and MMP-12 activities in human
brain microvascular endothelial cells (HBMEC) treated with Tat.B compared with cells
treated with Tat.AG. HBMEC were treated with Tat.B or Tat.AG at 1 to 1,000 ng/mL for
48 hours and MMPs activity in culture supernatants quantified by fluorometric assay as
described in Materials and methods. Controls are untreated HBMEC, Tat.AG represents
HBMEC treated with Tat.AG; Tat.B represents HBMEC treated with Tat.B; Tat.B-HI
represents HBMEC treated for 48 hours with heat-inactivated Tat.B. HBMEC treated for
48 hours with lipopolysaccharide (LPS) (50 7 g/mL) were used as positive controls.
Data using HBMEC from human donor 1 (
Tat.B significantly increased MMP-12 activity in HBMEC (Figures 5I-K). Tat.AG had minimal effects on MMP-12 activity in cells from two donors (Figures 5I and J) and increased MMP-12 activity in HBMEC from a third donor but to much lower levels than Tat.B (Figure 5K). The MMPs inhibitor TIMP2 significantly reduced Tat.B-induced increase in MMP-12 activity (P<0.05, Figure 5L). Human brain microvascular endothelial cells treated with heat-inactivated Tat.B or heat-inactivated Tat.AG showed no MMP-3, no MMP-10, and no MMP-12 activity (Figure 5), with MMP activity levels similar to levels in untreated controls. For all experiments, LPS was used as a positive control and all LPS-treated cells showed high MMP-3, MMP-10, and MMP-12 activity (Figure 5).
Tat Proteins Increased Complement Component C3 and C3b in Human Brain Microvascular Endothelial Cells
Our microarray data showed that Tat.B treatment of HBMEC significantly increased mRNA for C3, C7, and CFB, all of which are involved in the alternative activation pathway of the complement system. 24 To determine whether C3 transcription data correlate with its expression, we analyzed C3 levels in Tat-treated HBMEC by western blotting. Analyses of HBMEC from three human donors showed that both Tat.B and Tat.AG increased C3 expression in HBMEC, compared with untreated controls (Figure 6A). Further analyses showed that treatment of HBMEC with Tat.B and Tat.AG also increased the expression of C3b (Figure 6A), a fragment resulting from the proteolytic cleavage of C3 during complement activation. For donor 1 and donor 2, some increase in C3 and C3b expression was observed in cells treated with heat-inactivated Tat proteins but to a lesser extent than Tat-treated cells. Lipopolysaccharide treatment did not increase C3 levels but increased C3b levels in donor 1 and donor 2 (Figure 6A). We could not detect C3a in cell lysates by western blot analyses (data not shown). Additional western blot analyses confirmed the presence of Tat proteins in Tat.AG preparations, with HIV-1 Tat monoclonal antibody #1974 able to detect 400 ng of Tat.AG (Figure 6B), while HIV-1 Tat monoclonal antibody #4138 was able to detect 100 ng of Tat.AG (Figure 6C).
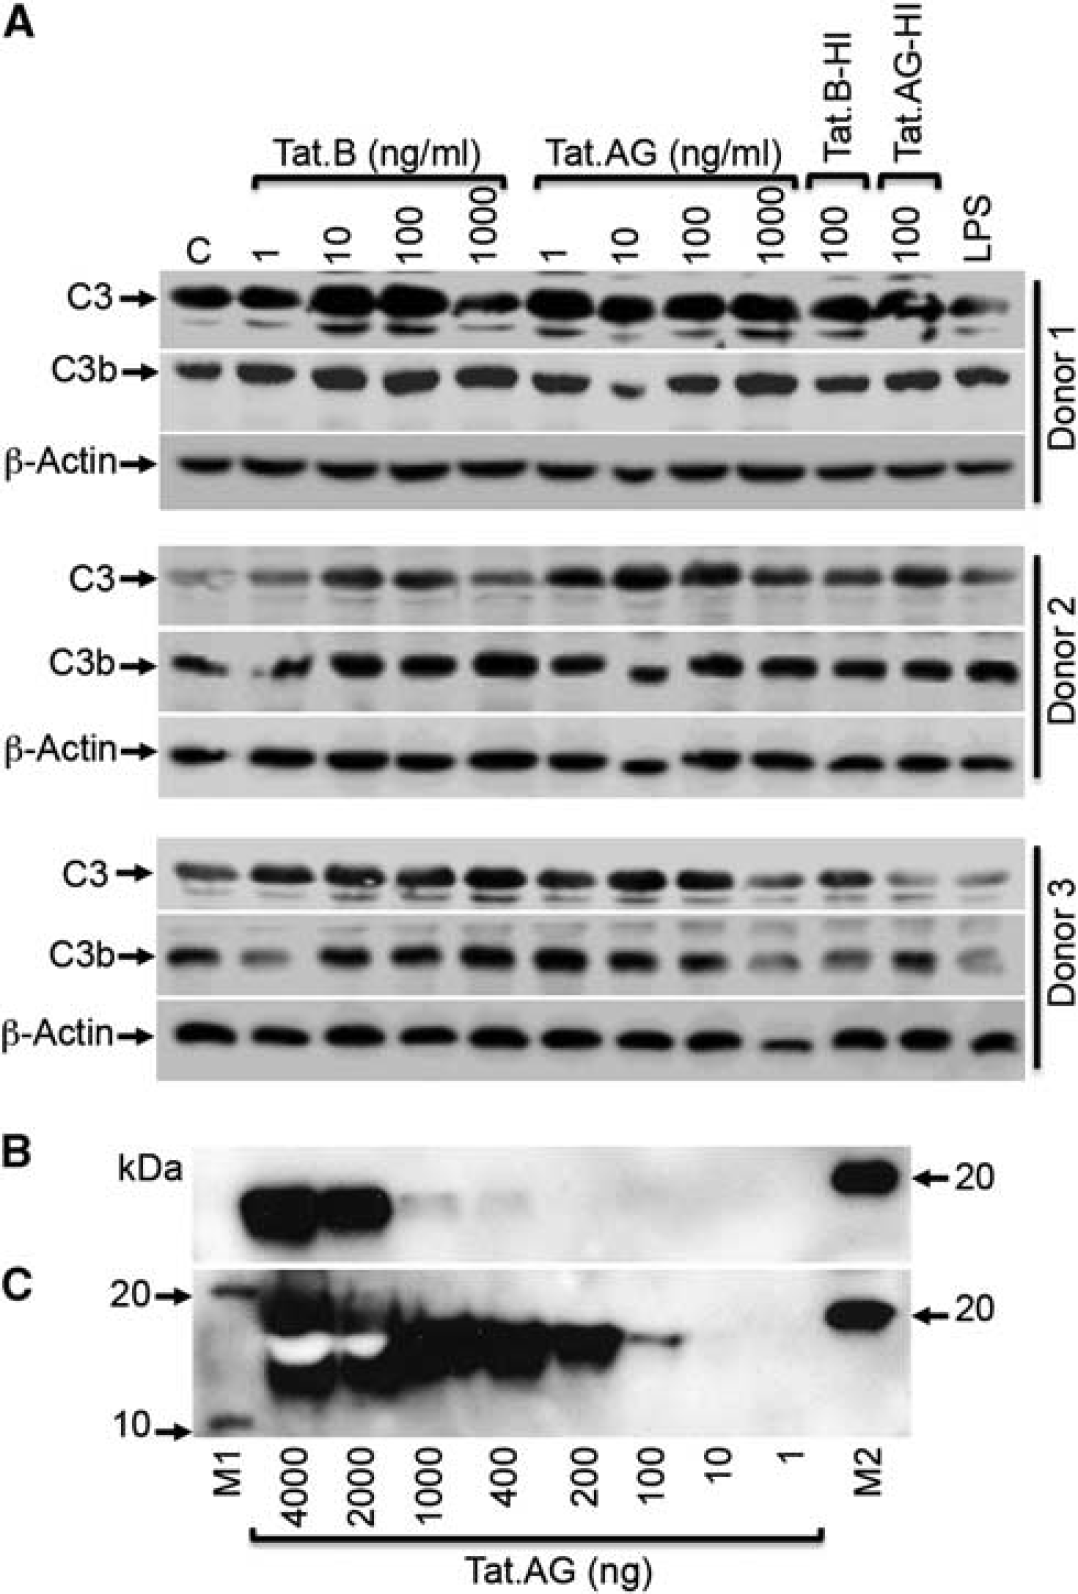
HIV-1 Tat proteins increases C3 and C3b expression in human brain microvascular
endothelial cells (HBMEC).
DISCUSSION
The HIV-1 Tat protein is a transcriptional regulator that has a critical role in the viral life cycle. It acts as an RNA viral transcription factor by interacting with the trans-activating response element to initiate the long-terminal repeat transcription. 22 Tat proteins are released by HIV-infected cells, can be detected in the serum and CNS of infected patients, and can also be taken up by noninfected cells.5,7 It has been shown that Tat can induce inflammation, toxicity, and injury to many cells types, including neurons,9,25,26 astrocytes,9,27 monocytes, and brain endothelial cells.6,8
HIV-1 clade diversity can influence Tat-mediated effects, including long-terminal repeat transactivation, toxicity, and chemotactic activities.17,18 Most of the studies of Tat-mediated effects have been performed using Tat from HIV-1 subtype B,5–9,22,25,27 with few others of clade C Tat.17,18 Over two-thirds of individuals currently living with HIV/AIDS reside in sub-Saharan Africa and are infected with non-B HIV subtypes, including the HIV-1 CRF02_AG, the predominant subtype circulating in West and Central Africa. 13–15 In the present study, we compare the effects of Tat proteins from HIV-1 subtypes B and CRF02_AG on primary HBMEC. Both microarray analyses and real-time PCR showed that compared with Tat.AG, Tat.B induced transcriptional upregulation of chemokines, complement factors, and MMP-3, MMP-10, MMP-12 in HBMEC, as well as other proteases and peptidases known to be involved in ECM processing and cleavage. Contrary to a previous study by Xu et al 28 showing that subtype B Tat increases MMP-9 levels in HBMEC, our current study did not show Tat-induced increase in MMP-9. This variation could be due to differences in experimental approaches, because we used Tat at 100 ng/mL and a 48-hour treatment time point, while Xu and collaborators 28 used Tat at 200 ng/mL and 30 minutes to 24 hours treatment time points.
As enzymes that degrade components of the ECM, MMPs have a major role in tissue remodeling during normal physiologic processes, as well as in disease immunopathology, including tissue damage and pathogen dissemination in infectious diseases.23,29 Matrix metalloproteinase-10 and MMP-3 belong to the stromelysins group while MMP-12 belongs to the metalloelastase qroup of MMPs.29,30 MMP-3 can degrade multiple components of the ECM, including collagen, proteoglycans, fibronectin, laminin, and elastin, 30 and can also activate other MMPs such as MMP-1, MMP-7, MMP-8, MMP-9, and MMP-13, 30 which are known to be involved in HIV-1-associated neurocognitive disorders pathogenesis (reviewed in Mastroianni et al 29 ). Matrix metalloproteinase-10 degrades proteoglycans and fibronectin and can also activate MMP-1, MMP-7, MMP-8, and MMP-9. 30 There is also evidence that infection with other viruses such as the West Nile virus increases MMP-3 levels, and this is associated with decreased expression of tight junction proteins on the brain endothelium and increased infiltration of leukocytes into the brain. 31 Cytokines upregulated MMP-3 mRNA and proteins, and increased vascular cell adhesion molecule-1 expression in human cerebral endothelial cells; MMP inhibitor prevented these effects. 32 Matrix metalloproteinases can disrupt endothelial basement membranes, damage endothelial tight junction, 33 and cause BBB leakage. 29 It has also been shown that during acute ischemia, MMPs disrupt tight junction proteins, cause BBB breakdown and increased vascular permeability; early inhibition of MMP activity prevented these effects. 33
Matrix metalloproteinases can also modulate inflammation; cytokines can induce MMPs expression and activation; and IL-6 can regulate MMP-10 expression via the JAK/STAT pathway. 34 MMP-12 also induces dose-dependent expression of IL-8 in epithelial cells, and this could be prevented by synthetic MMP inhibitors. 35 MMP-12 degrades elastin, the structural component of elastic fibers that are responsible for elasticity in various cells/tissues, including blood vessels. Matrix metalloproteinase-12 has also been associated with other CNS diseases; stroke is associated with macrophage activation and increased MMP mRNA levels, including MMP-3 and MMP-12. 36 Infection with mouse hepatitis B virus increases MMP-3 and MMP-12, and this increase was associated with higher viral virulence in the CNS. 37
Complement factors with significantly upregulated mRNA in HBMEC exposed to Tat.B compared with cells exposed to Tat.AG or untreated controls included C3, CFB, and C7, all of which are involved in the alternative pathway of the complement cascade and have a major role in immune system regulation and function. 24 During complement activation via the alternative pathway, C3 is proteolytically activated and cleaved by the C3 convertase to generate C3a and C3b fragments. 24 C3b remains covalently bounded to the cell surface, binds to CFB and produces a complex that recruit other factors to form C5. C5 is then cleaved by C5 convertase to generate C5a and C5b fragments, and C5b associates with C6, C7, C8, and C9 to form a membrane attack complex that lyses/damages the cells. 24 Our data show that only Tat.B significantly increased C3 mRNA, but both Tat.B and Tat.AG increased C3 and C3b protein levels in HBMEC, suggesting that Tat may differentially regulate C3 transcription and expression in HBMEC. We could not detect C3a in cell lysates by western blot analyses, which is not surprising since it is known that after C3 cleavage, C3a is released/secreted while C3b remains attached to the cell membrane. 24 Our results are in agreement with the literature showing that the complement system has a critical role in HIV infection, including CNS infection.38–40 HIV-infected cells activate the complement and cleave C3; 38 HIV-1 also increased C3 and C4 in human astrocytes, 39 and C3 levels are increased in the cerebrospinal fluid of infected patients with neurologic complications. 40 Our present study suggests that clade diversity may differentially affect Tat-induced complement transcription and activation, as well as acute phase response, endocytosis, chemokine, and cytoskeletal signaling on the brain endothelium.
Our current data are also in agreement with the literature showing that MMPs are involved in HIV-induced brain injury, including BBB breakdown, myelin degradation, and neuronal injury. 29 Data presented in this study are significant and to our knowledge, this is the first demonstration of Tat-induced complement activation, Tat.B-induced transcriptional upregulation of factors of the alternative pathway of the complement cascade in HBMEC, and Tat.B-induced transcriptional upregulation and activation of MMP-3, MMP-10, and MMP-12 in HBMEC, as well as chemokines and enzymes known to be involved in ECM processing and cleavage; while Tat.AG had no major effects on HBMEC. This increased upregulation and activation of MMP-3, MMP-10, and MMP-12 could result in increased ECM cleavage and BBB injury in individuals infected with HIV-1 subtype B. It is well known that the ECM is essential for maintaining the organization of vascular endothelial cells and maintaining a stable blood vessels structure. 41 The ECM supports endothelium function and property, including cellular integrity, morphology and contractility, and proliferation. 41 Dysregulation of MMP expression and increased MMP activity could further induce damage/remodeling of endothelial ECM. Disruption of the ECM in HIV/AIDS can contribute to transmigration of mononuclear phagocytes and dendritic cells through the vascular endothelium, to CNS trafficking of mononuclear phagocytes, and viral dissemination in the brain. Our current study shows that HIV-1 clade diversity can influence these Tat-mediated effects on HBMEC, and specifically affect cellular movement, cell-to-cell signaling and interaction, cellular proliferation and antigen presentation.
In summary, compared with Tat.AG, Tat.B induced transcriptional upregulation of proinflammatory chemokines, complement components factors, MMP-3, MMP-10, MMP-12, and other enzymes associated with ECM processing and cleavage in HBMEC. Compared with Tat.AG, Tat.B also significantly increased MMP-3, MMP-10, and MMP-12 activities in HBMEC; and TIMP2 blocked Tat-induced increase in MMPs activity. It is known that HIV-1 and viral proteins can induce neurocognitive impairment.1,3,4,7–10 However, most of these studies were performed with subtype B HIV-1 or in humans predominantly infected with subtype B virus, and there are currently no data on the incidence or prevalence of neurocognitive impairment in individuals infected with HIV-1 CRF02_AG. Our findings are important and show that genetic differences between HIV-1 subtypes B and CRF02_AG can influence the effects of Tat proteins derived from these two viral subtypes on the brain endothelium and viral neuropathogenesis. We comprehensively delineate putative underlying pathways of the observed differential effects of Tat.B and Tat.AG on HBMEC, and data will guide in-depth studies of the molecular mechanisms underlying these differential Tat effects on the brain endothelium.
Footnotes
The authors declare no conflict of interest.
ACKNOWLEDGMENTS
The authors thank the NIH AIDS Reagents Program for providing Tat monoclonal antibodies, the UNMC Microarray Core Facility for assistance with microarray analysis, Dr Avi Nath for useful discussions on Tat proteins and critical reading of the manuscript, Ms Sangya Singh for technical support, and Ms Robin Taylor for excellent editorial support.
References
Supplementary Material
Please find the following supplemental material available below.
For Open Access articles published under a Creative Commons License, all supplemental material carries the same license as the article it is associated with.
For non-Open Access articles published, all supplemental material carries a non-exclusive license, and permission requests for re-use of supplemental material or any part of supplemental material shall be sent directly to the copyright owner as specified in the copyright notice associated with the article.