
Abstract
High-resolution phase—contrast magnetic resonance imaging can now assess flow in proximal and distal cerebral arteries. The aim of this study was to describe how total cerebral blood flow (tCBF) is distributed into the vascular tree with regard to age, sex and anatomic variations. Forty-nine healthy young (mean 25 years) and 45 elderly (mean 71 years) individuals were included. Blood flow rate (BFR) in 21 intra- and extracerebral arteries was measured. Total cerebral blood flow was defined as BFR in the internal carotid plus vertebral arteries and mean cerebral perfusion as tCBF/brain volume. Carotid/vertebral distribution was 72%/28% and was not related to age, sex, or brain volume. Total cerebral blood flow (717±123 mL/min) was distributed to each side as follows: middle cerebral artery (MCA), 21%; distal MCA, 6%; anterior cerebral artery (ACA), 12%, distal ACA, 4%; ophthalmic artery, 2%; posterior cerebral artery (PCA), 8%; and 20% to basilar artery. Deviating distributions were observed in subjects with ‘fetal’ PCA. Blood flow rate in cerebral arteries decreased with increasing age (
Introduction
Understanding the balance of the blood flow to the brain, i.e., its distribution and factors affecting the blood flow rate (BFR), can give important new information to be used for evaluating patients with cerebral vascular disease. Although total cerebral blood flow (tCBF) has been reported to be 616 to 781 mL/min in healthy subjects,1, 2 very few have investigated BFR in the cerebral vascular tree; i.e., the BFR in the circle of Willis (CW) 1 and in more peripheral cerebral arteries.
Until now the most commonly used methods to study BFR in arteries in clinical practice and for research purposes has been color duplex and Doppler ultrasonography. These methods cannot give information about BFR in distal cerebral arteries. However, phase-contrast magnetic resonance imaging (PCMRI) enables measurement of BFR in milliliters per minute 3 (mL/min) and is currently the only method that can measure BFR within cerebral 4 and extracerebral arteries5, 6 down to a diameter ∼1.5 mm. 7
An accurate blood flow measurement in specific arteries is important since it reflects blood distribution and possible compensatory mechanisms of the collateral flow, which are important for treatment decisions and for determining outcome of ischemic stroke. 8 There is also an increasing interest for determination of cerebral blood flow in different patient groups with vascular disease 9 such as cerebral ischemia 10 and carotid stenosis, 11 and also in patients with cognitive impairment 12 and migraine. 13 Further, global hypoperfusion has been proposed as an etiological factor in vascular theories related to mild cognitive impairment 14 and Alzheimer's disease. 15
The aim of this study was to describe how tCBF is distributed into the cerebral arterial tree. Reference values for BFR of 15 cerebral and 6 extracerebral arteries in 94 healthy subjects were determined with regard to age, sex, and anatomic variation.
Materials and methods
In summary, by putting an ad in the local newspaper, 111 subjects were included in this prospective single-center study. The subjects were recruited into two groups based on age: healthy young (HY, 20 to 30 years) and healthy elderly (HE, 64 to 80 years) individuals. History, neurologic examination, mini-mental state estimation, electrocardiogram, and blood pressure measurement were obtained. Phase-contrast MRI was used to determine BFR in 21 arteries per subject.
Subjects
Healthy subjects were defined as having no previous hypertension, cardiac disease, renal disease, or peripheral vascular disease. Blood pressure 160/90 mm Hg and mini-mental state estimation <28 points were exclusion criteria as well as ventricular hypertrophy, arrhythmia, or previous myocardial infarction detected on electrocardiogram. Medications affecting the central nervous system were not allowed and subjects should not have a central nervous system disorder. Subjects with contraindication for MRI examination (e.g., claustrophobia) or pathologic assessment on MRI angiography were excluded as well. Figure 1 describes the recruitment process and the reasons for exclusions. The final study group consisted of 49 subjects included in the HY group (mean age±s.d., 25±2 years; 27 women) and 45 subjects in the HE group (mean age±s.d., 71±4 years; 23 women).
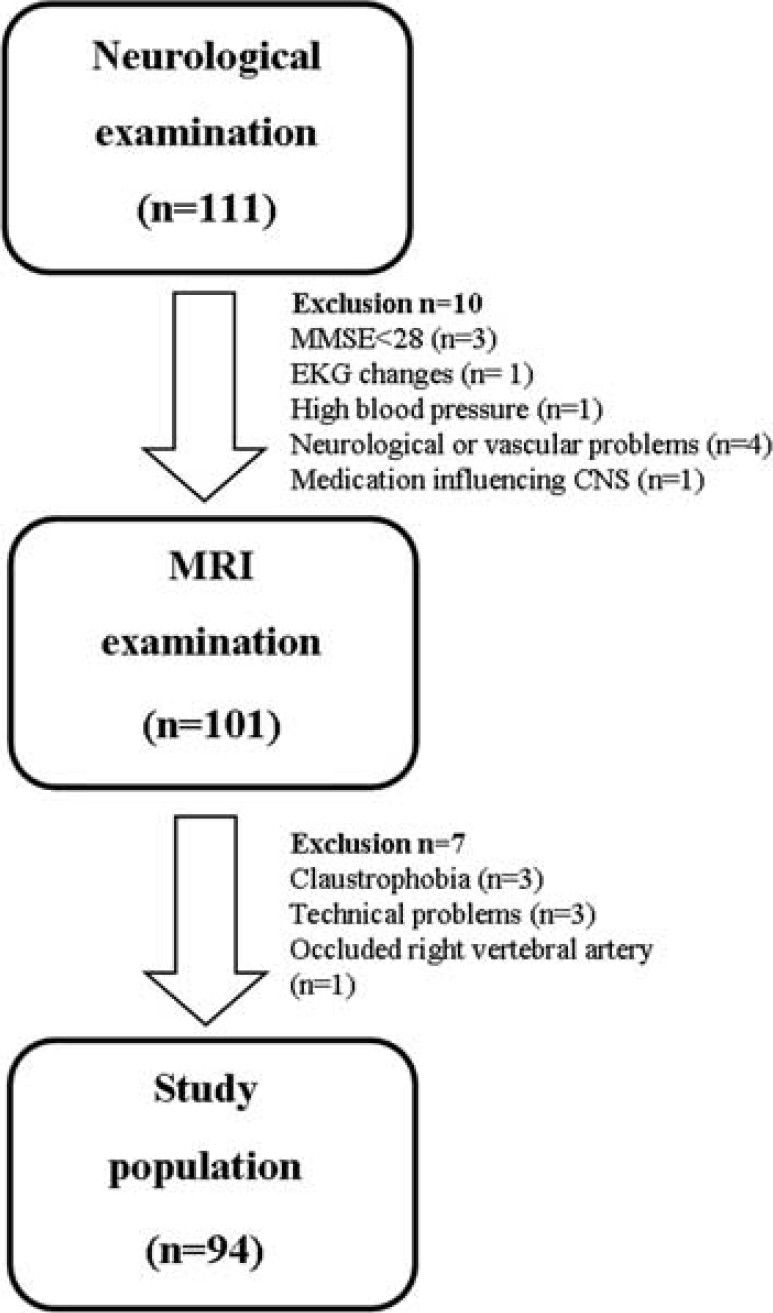
Study population. Of 111 subjects included, 10 were excluded after the physical examination; 101 subjects proceeded to MRI examination, of which 3 subjects were excluded because of claustrophobia, 3 because of technical problems, and 1 because of an asymptomatic occlusion of the right vertebral artery. In total the study population consisted of 94 healthy subjects.
The ethical review board of Umeå University (IRB) approved the study. Oral and written information about the study was given. Written consent was obtained from all subjects.
Magnetic Resonance Imaging
Magnetic resonance imaging data were collected using a 3-Tesla scanner (GE Discovery MR 750, Waukesha, WI, USA) with a 32-channel head coil. An angiogram was constructed using a three-dimensional time-of-flight sequence, used for identifying vascular pathologic assessment anomalies and for planning PCMRI measurements. Sagittal T1-weighted sequences with 1-mm slice thickness were used for calculating brain volume.
High-resolution—PCMRI data were collected with a two-dimentional fast phase—contrast sequence with the following parameters: repetition time/echo time=9/5 ms, slice thickness 3 mm (except for internal carotid artery (ICA) and vertebral artery (VA) where a slice thickness of 5 mm was used), 15° flip angle, 180 × 180 mm field of view, 512 × 512 acquisition matrix, 0.35 × 0.35 mm in-plane resolution, six views-per-segment, and two averages. The chosen velocity encoding (VENC) value was the same for a given artery, i.e., using the same VENC for ICA for all subjects, same VENC for middle cerebral artery (MCA) for all subjects, etc. The lowest VENC was used for middle meningeal artery (MMA; 20 cm/s) and highest for MCA (120 cm/s). Retrospective cardiac gating was used. The duration of the MRI examination was ∼1 h.
During the MRI examination, an operator (KA) evaluated the source images of three-dimensional time-of-flight data in the axial, sagittal, and coronal directions to place a perpendicular PCMRI plane for each artery of interest. The investigated arteries and the corresponding location of the PCMRI planes are shown in Figure 2. The cerebral arteries were defined as the ICA, VA, basilar artery (BA), MCA, anterior cerebral artery (ACA), posterior cerebral artery (PCA), distal MCA (MCAdist), and the distal ACA (ACAdist). External carotid artery (ECA), MMA, and the ophthalmic artery (OA) were considered as extracerebral arteries.
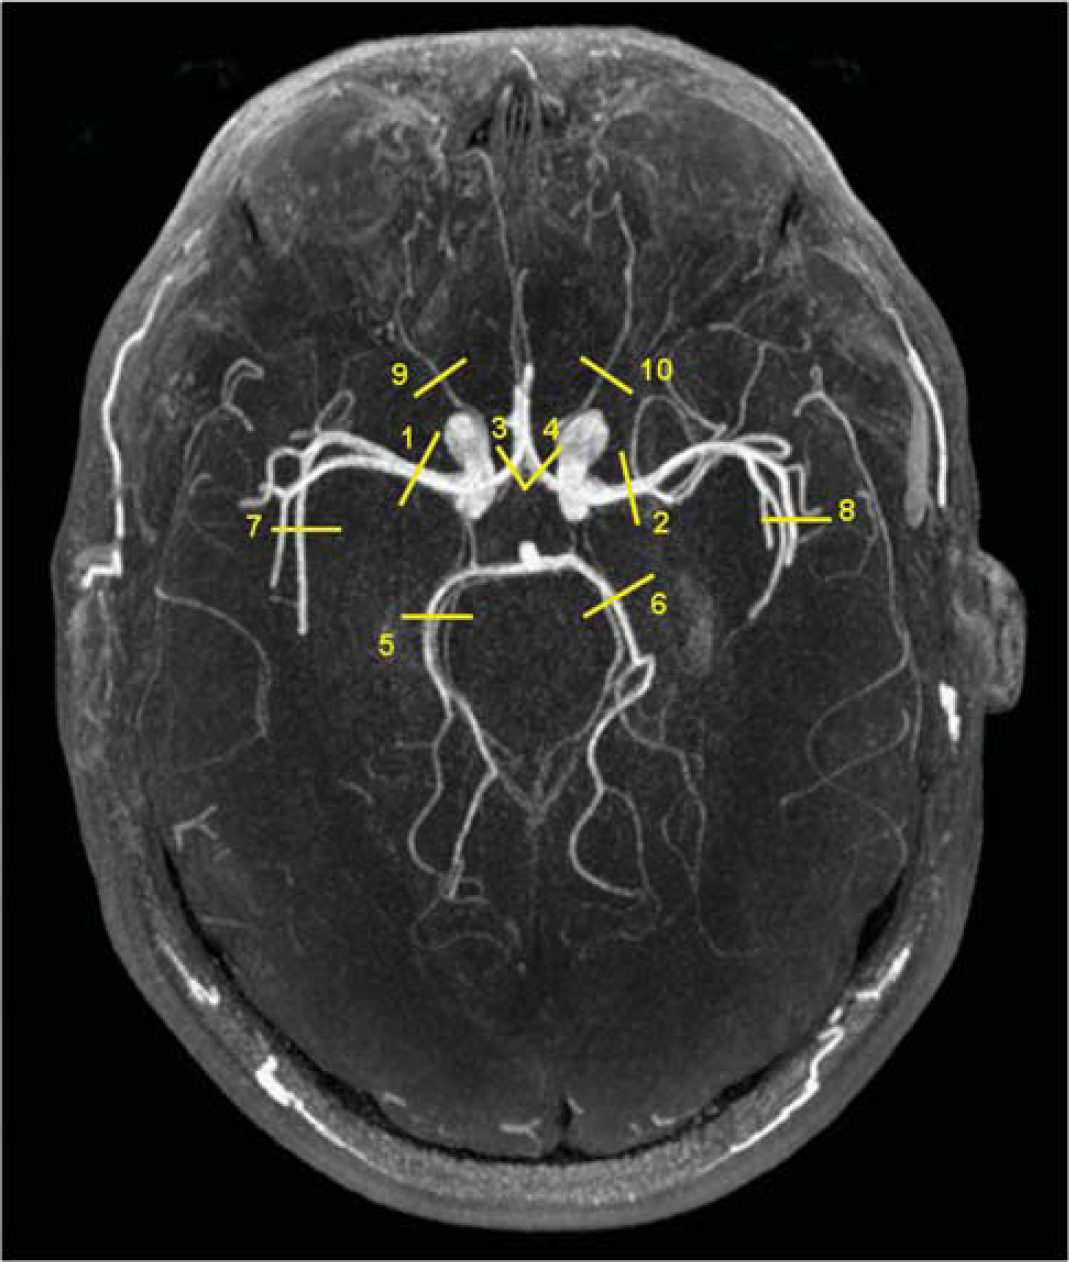
Phase-contrast magnetic resonance imaging (PCMRI) planes for the investigated cerebral arteries. The PCMRI planes of the cerebral arteries were visualized in an axial reconstructed MR angiogram based on the maximum intensity projection method. All PCMRI planes were perpendicular to the arteries of interest. (1, 2) the right (R) and left (L) middle cerebral artery (MCA) at the level of M1. When M1 segment was too short, the flow rate of the M2 branches were measured and summed to derive the flow rate of M1; (3, 4) R and L anterior cerebral artery (ACA) at A1 branch, i.e., before the anterior communicating artery; (5, 6) R and L posterior cerebral artery at P2 segment, i.e., distal to the aperture of the posterior communicating artery; and (7, 8) the R and L distal MCA at the Sylvian fissure. (9, 10) the R and L ophthalmic artery proximally after branching off from internal carotid artery; distal ACA plane was localized above the corpus callosum, not shown in the figure.
The BFR of ICA, VA, and ECA were measured using one PCMRI plane at the level of the first and second cervical vertebrae. Basilar artery flow was assessed above the anterior inferior cerebellar arteries and MMA was measured at the level of the foramina spinosa. Blood flow rate of MCAdist was measured by choosing the largest visualized MCA branch at the level of the Sylvian fissure. Distal ACA BFR was measured by choosing the two largest visible pericallosal branches of ACA.
Phase-Contrast Magnetic Resonance Imaging Analysis
Postprocessing of the PCMRI data was performed using Segment v1.8 software (http://medviso.com) by one observer (LZ) on deidentified images. A circular or elliptical region of interest was drawn to delineate the lumen boundary of the artery using the magnitude images. The area and size of the region of interest were kept constant during the cardiac cycle. The velocity (cm/s) was computed in each voxel of the phase image and averaged over the region of interest. Finally, the BFR was computed by multiplying the average velocity during the cardiac cycle and the cross-section region of interest area. The unit of the BFR was expressed in milliliters per minute.
Total cerebral blood flow was calculated by adding the mean flow rates of the two ICA and the two VA. Mean cerebral perfusion in mL/min/100 mL 16 was computed by dividing tCBF by brain volume and then multiply by 100.
Interrater Reliability
In 10 randomly chosen subjects (5 HE), the BFR of the ICA, MCA, ACA, and the PCA on the left side as well as the BA were measured by two operators working independently from each other. An intraclass correlation coefficient 17 was used to quantify the interrater variability, which was >0.9, which was considered as excellent.
Morphology of the Circle of Willis
Based on the three-dimensional time-of-flight data, the morphology of the CW was investigated using the Sectra IDS7 software (Sectra AB, Linköping, Sweden). One investigator (LZ) analyzed all images, and to validate this evaluation, a senior neuroradiologist (RB) reinvestigated 25% of the material. The concordance was 100% between the two investigators. Incomplete CW was defined as absence or hypoplasia of a component artery, where the threshold diameter for hypoplasia was set as <0.8 mm. 18 Relevant anatomic variations that could affect the BFR were defined as missing or hypoplastic A1 or P1 segments of the ACA and PCA, respectively, or a fetal type PCA; 19 i.e., a P2 segment arising from the ICA.
Brain Volume
The anatomic T1-weighted data were processed with the VBM8 toolbox (http://dbm.neuro.uni-jena.de/vbm.html) with default parameters in the SPM8 software (http://www.fil.ion.ucl.ac.uk/spm/) using Matlab R2013b (The MathWorks Inc., Natick, MA, USA). The segmentation method of VBM8 is based on adaptive maximum, a posteriori approach. 20 The different tissues were classified into classes such as gray matter and white matter. The quality of the segmentation was controlled by visual inspection. The brain volume was computed as the sum of gray matter and white matter volumes.
Statistical Analysis
The data were analyzed using PASW Statistics version 18 (IBM, Chicago, IL, USA). For testing the normal distribution of the BFR, we used a one-sample Kolmogorov-Smirnov test without the Lilliefors correction. To compare the mean BFR between the right and left arteries, a paired
Results
Circle of Willis had a visible complete configuration in 48 out of 94 subjects (51%). Twenty-two subjects had a missing or hypoplastic posterior or anterior communicant artery. Five subjects had a missing A1 segment of ACA and fetal-type PCA was seen in 19 subjects unilaterally and in one subject bilaterally. One subject had both a missing A1 and a fetal-type PCA.
Blood flow rate could be assessed in 1,893 arteries (96%). Blood flow rate was not successfully measured in 81 arteries (1 ICA, 37 ECA, 5 MCA, 5 ACA, 1 BA, 2 VA, 7 ACAdist, 1 MCAdist, 6 OA, and 16 MMA) because of a nonoptimal PCMRI plane, technical problems or not being visible on time of flight, or magnitude image. The nonmeasured BFR in ECA was because the VENC and the PCMRI plane were set for measuring BFR in ICA. The BFR for each artery was normally distributed (
Total Cerebral Blood Flow
Total CBF was decreased in HE compared with HY (HY: 771±122 mL/min; HE: 657±94 mL/min,
There was a significant reduction in brain volume with regard to age (HY: 1294±116 mL; HE: 1171±98 mL,
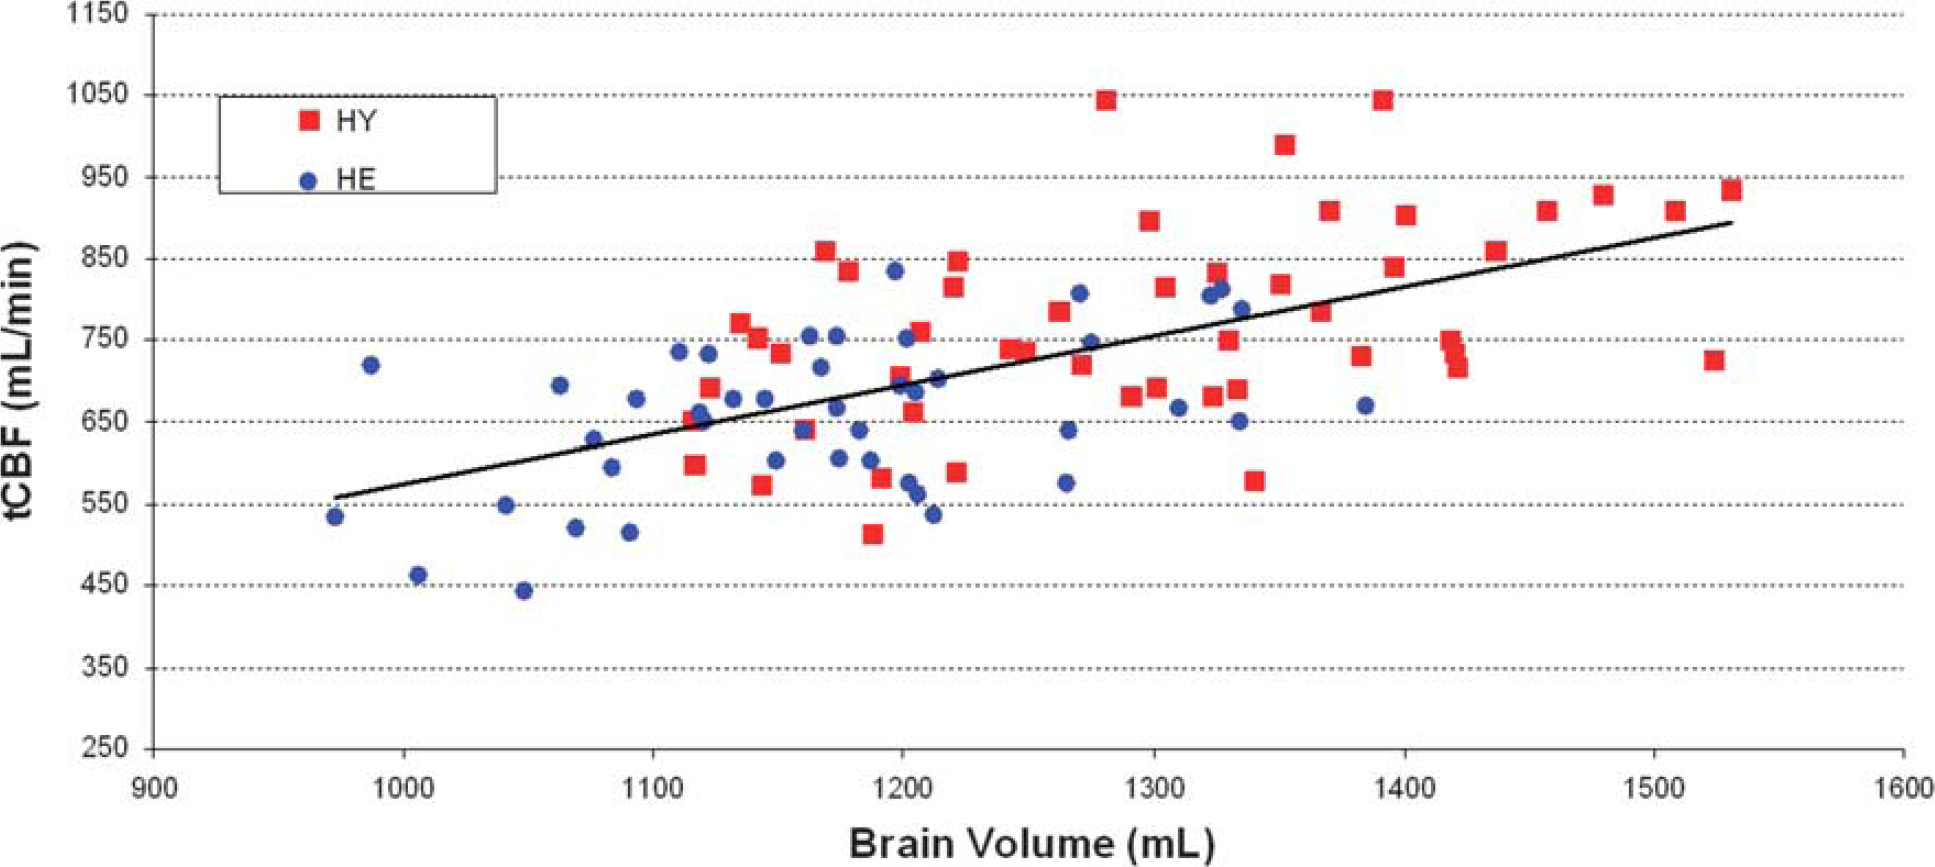
Relationship between total cerebral blood flow (tCBF) and brain volume. Scatter plot showing the significant linear relationship between tCBF and brain volume. HE, healthy elderly; HY, healthy young.
For all subjects, the mean cerebral perfusion was 58±8 mL/min/100 mL. Higher values were found in women (women: 61±8 mL/min/100 mL; men: 55±6 mL/min/100 mL,
Distribution of Total Cerebral Blood Flow in the Individual Arteries
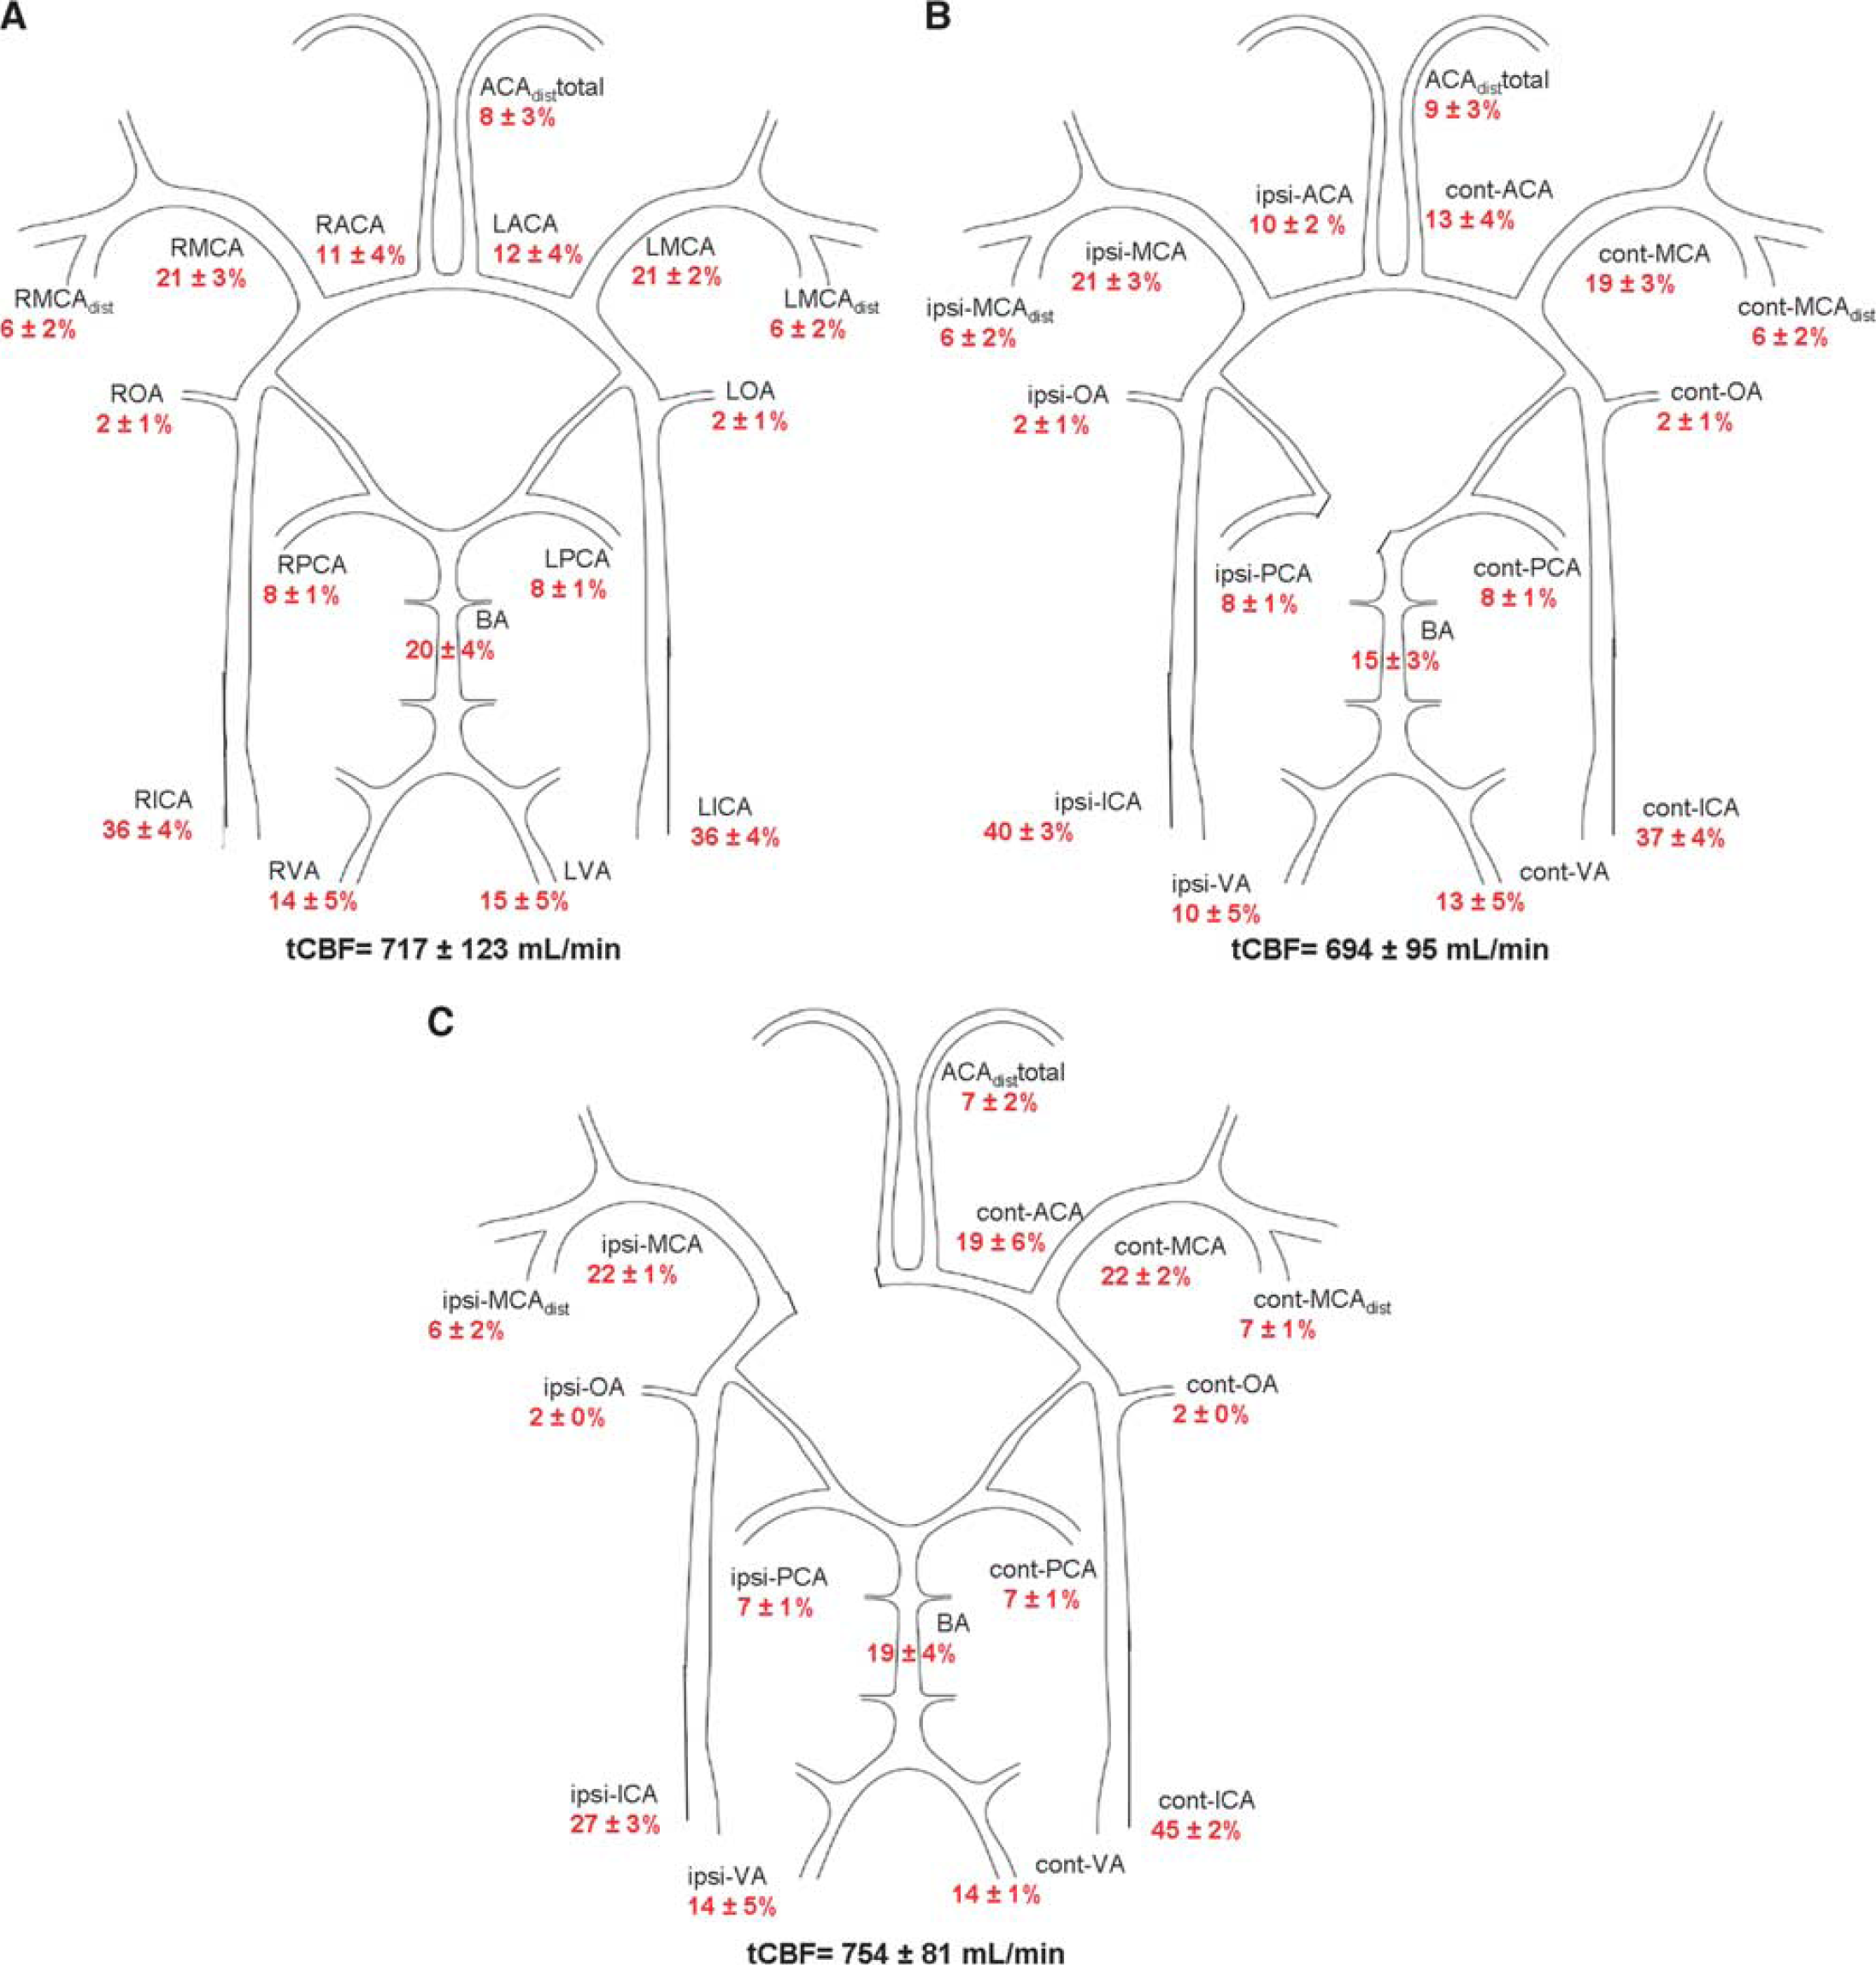
The distribution of tCBF in percentage for the individual arteries for all subjects is shown in Figure 4A. The anterior cerebral BFR (sum of the right and left ICA) was 515±96 mL/min and represents 72% of tCBF. For the posterior circulation (sum of the right and left VA), the flow rate was 202±44 mL/min (28% of tCBF). The distribution of tCBF in the anterior/posterior circulation was independent of age (HY: 72/28%±4%, HE: 72/28%±4%,
(
Blood Flow in the Individual Arteries
For cerebral arteries a decrease in the BFR was found in HE compared with HY for all cerebral arteries (Table 1). BFR in PCA was lower in men compared with women (
Blood flow rate values for each artery in young, elderly, and all healthy individuals
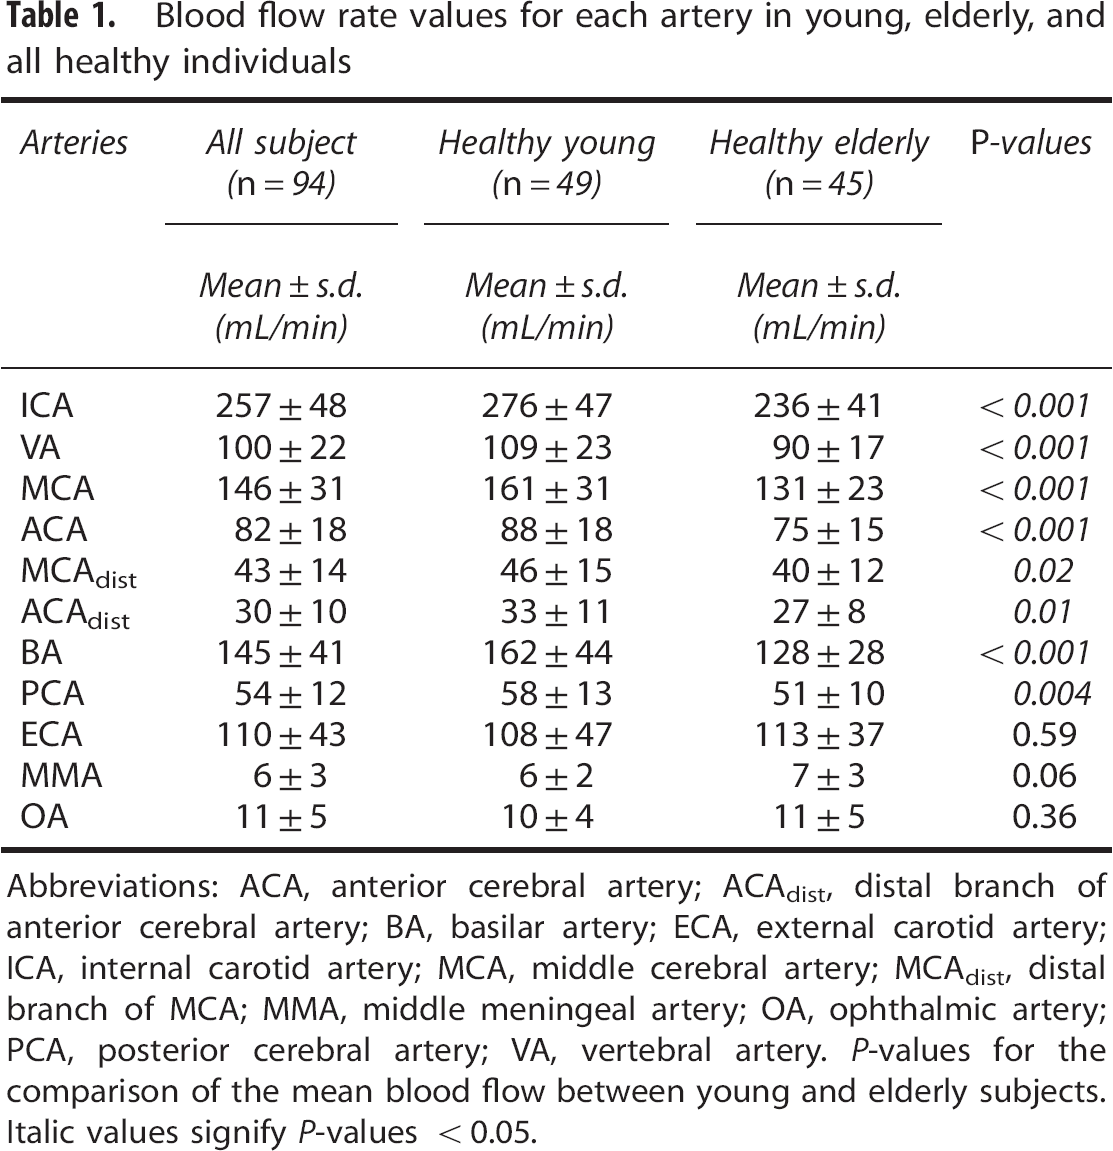
Abbreviations: ACA, anterior cerebral artery; ACAdist, distal branch of anterior cerebral artery; BA, basilar artery; ECA, external carotid artery; ICA, internal carotid artery; MCA, middle cerebral artery; MCAdist, distal branch of MCA; MMA, middle meningeal artery; OA, ophthalmic artery; PCA, posterior cerebral artery; VA, vertebral artery.
Blood flow rate values for each artery in women and men
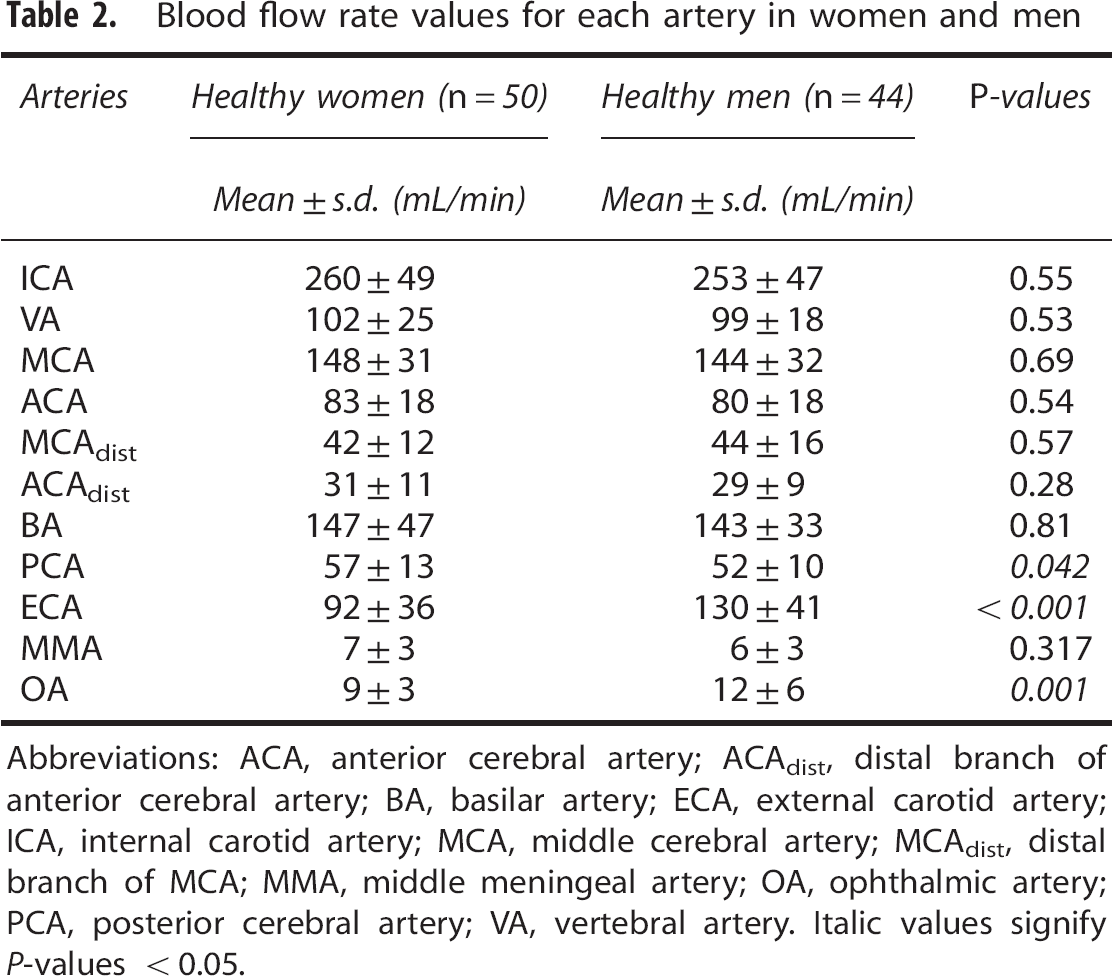
Abbreviations: ACA, anterior cerebral artery; ACAdist, distal branch of anterior cerebral artery; BA, basilar artery; ECA, external carotid artery; ICA, internal carotid artery; MCA, middle cerebral artery; MCAdist, distal branch of MCA; MMA, middle meningeal artery; OA, ophthalmic artery; PCA, posterior cerebral artery; VA, vertebral artery. Italic values signify
Regarding BFR in extracerebral arteries, ECA, MMA, and the OA, there were no differences between age groups (Table 2). In MMA, there was even a tendency, however not significant, toward higher flow rates in HE compared with HY (
Anatomic Variation of Circle of Willis and Blood Flow
In subjects with unilateral fetal-type PCA (
In subjects with missing or hypoplastic A1 segments (
Discussion
In the present study, reference values are presented for a young and an old group of healthy subjects providing the basic data for investigating blood flow in cerebral vascular disease and its compensatory mechanisms, e.g., collateral circulation. Recent advances in PCMRI technique have led to improved spatial resolution making it possible to measure flow even in distal cerebral branches. Based on the results shown in Figure 4A, we propose a method to examine the cerebral arterial circulation and its distribution.
Inflow to the Brain—Total Cerebral Blood Flow
Global hypoperfusion has been proposed as an etiological factor in vascular theories related to mild cognitive impairment 14 and Alzheimer's disease. 15 Therefore, determining the total inflow of blood to the brain (tCBF) is important when approaching these diseases. In this study, tCBF was independent of sex and declined ∼2.7 mL/min per year, which is in line with previous studies.21, 22 The determined tCBF was highly correlated to brain volume in HY and HE subjects, respectively (Figure 3). This has previously been reported in elderly but not in HY. 23
Cerebral autoregulation is defined as the relationship between blood flow and perfusion pressure 24 and should guarantee a stable cerebral blood flow. Each PCMRI flow measurement in this study represents mean values of BFR sampled during a couple of minutes. The investigations were unprovoked regarding physical and cognitive activity. Blood pressure was in normal range and there was no cardiovascular disease. Thus, it can be assumed that the subjects were on the linear and steady-state portion of the autoregulation curve and that the reference values presented in this study could be used to delineate patients with global hypoperfusion. We would suggest hypoperfusion being defined as a mean cerebral perfusion <42 mL/min/100 mL, i.e., 2 s.d. lower than our mean value.
In contrary to velocity measurements with transcranial Doppler, PCMRI provides the absolute blood flow (in milliliters per minute) and is not restricted to measurements in the large vessels around the CW. 7 Mean cerebral perfusion is defined as tCBF in relation to brain volume in mL/min/100 mL. Using MRI, both these parameters are measured with high accuracy, and therefore we consider this a very accurate method to approximate tCBF. Previous studies have showed a high reproducibility of tCBF using PCMRI where the coefficient of variation was 11% or less.25, 26 Furthermore, a very good reproducibility of brain volume (coefficient of variation below 1%) measurement has been shown using MRI data and Statistical Parametric Mapping tools (Wellcome Trust Centre for Neuroimaging, Institute of Neurology, London, UK).27, 28 Previous MRI studies have reported mean values ∼49 to 51 mL/min/100 mL for elderly, which was lower compared with our finding (56 mL/min/100 mL for HE).16, 23, 29 One possible explanation could be that the subjects in those studies were population based or not healthy subjects, in contrast to our study that only included subjects without neurologic or vascular disease. Therefore, the measured tCBF could be expected to be reduced in those studies. Discrepancies in methods used in previous studies compared with the current, such as field strength, PCMRI sequence (cardiac gating versus no cardiac gating), anatomic levels (measuring tCBF at ICA and VA versus ICA and BA) and methods for brain volume measurements could be other explanations.
Several methods are available for brain perfusion measurement. The classic being Kety-Schmidt method that is based on measuring the concentration of inhaled nitrous oxide or Xenon133 in arterial and venous circulation. 30 In different studies the mean values for this method range between 45 and 64 mL/min/100 g for HY men (∼47 to 67 mL/min/100 mL).30, 31, 32 Other approaches are based on imaging methods such as computed tomography, positron emission tomography, single-photon emission computed tomography, and MRI arterial spin labeling. There are advantages and disadvantages, and a number of assumptions, for each mentioned technology. Choosing the appropriate technology depends on the specific aim of a study. Since no gold standard exists for perfusion or tCBF assessment, comparisons of results between the different methods are challenging, and it is beyond the scope of this paper to discuss pros and cons with different technologies to measure CBF.
Blood Flow Distribution—the Collateral Circulation
The prognosis of ischemic stroke is worse in patients with an impaired collateral system 33 and a better understanding of the compensatory mechanism of the collaterals is needed for treating this group of patients. 34 Thus, there is a need for noninvasive methods that can measure and grade the flow in specific intracranial arteries and describe the interaction of flow between different collateral systems. 35 By measuring at multiple sites, as in this study, the flow and division of blood into proximal and distal branches of the cerebral vascular tree could be described. An unbalanced arterial BFR pattern together with a normal cerebral perfusion in a specific region indicates that collaterals not normally supplying that region are in use. Accordingly, by analyzing the complementary BFR pattern and the cerebral perfusion there is a potential to assess the collateral recruitment.
Since tCBF is strongly related to age and brain volume, we prefer to report flow in cerebral arteries as proportions of tCBF (Figure 4A). We suggest this approach to be used in future studies as this reflects the balance and the collateral recruitment.
The ratio between the anterior and the posterior circulation of the tCBF was ∼3:1, with no laterality (Figure 4A), which is supported by findings of previous studies.2, 21, 36 This proportion was independent of age, sex, and brain volume, and could therefore be suggested as a potential biomarker for easy detection of potential flow disturbances and signs of an activated collateral system. A decrease in BFR between 12% and 21% because of aging was seen in all cerebral arteries (Table 1), which confirms a previous study. 1
The 15% age-related reduction in tCBF between HY and HE, can partly be directly attributed to the 10% decrease in brain volume. For the remaining 5% other age-related factors should play an important role in the reduction of tCBF. Factors like decreased cardiac output and hypertension leading to arterial stiffness and cerebral pathologic assessment such as arteriosclerosis, 37 leukoariosis, 38 beta-amyloid deposition, 39 and general decrease in cerebral energy metabolism should be further investigated.40, 41
No differences in BFR for individual cerebral arteries related to gender were found, except for higher flow in the PCA in women. We have no obvious explanation for PCA difference based on anatomic or physiologic knowledge. Furthermore, the finding was borderline significant in multiple artery testing and should therefore be interpreted with caution.
Flow and flow direction in MMA, OA, and ECA are measures of the extracerebral arterial collateral circulation. 42 Generally, their contribution of blood to the brain could be assumed as negligible when investigating healthy subjects, but should be taken into account in patients with, e.g., stenoocclusive disease. An interesting observation was that flow in extracerebral arteries, possibly involved in the collateral circulation, did not decrease but rather increased with aging.
Anatomic variations of the CW are common. Only half of the patients in this study had a complete CW. Figures 4B and 4C, show how PCMRI could be used to illustrate flow redistribution caused by anatomic variations. We could also show that in subjects with a fetal-type PCA, the proportion of blood going into the ipsilateral ACA was lower compared with the opposite side. This is in our opinion a way to show the function of the collateral system; i.e., if an artery has lower flow or a different origin, the collateral system compensates so that the flow into distal branches is unchanged.
When investigating small arteries (OA, MMA, ACAdist, and MCAdist) with PCMRI, there is a risk of overestimating flow because of partial volume effects. 43 However, we have previously shown a good agreement between flow measured by PCMRI and a reference phantom. 7 The high-resolution—PCMRI technique used in this study, with manual placement of the PCMRI planes, was tedious and requires a skilled operator during the investigation, but it provided us with accurate reference data necessary for further development toward clinical usefulness. Already today, we can see that the so-called whole brain 4D-PCMRI will in the near future make it possible to measure flow in all vessels larger than ∼1mm44, 45 within ∼10 minutes. It will also be possible to automatically construct a flow tree showing proportions of tCBF in intracranial vessels, similar to the one shown in Figure 4A. Thus, the PCMRI technique and blood flow distribution analysis can be developed into a useful clinical tool in the caring of stroke patients.
Conclusion
This study reports the tCBF and its distribution into the main cerebral arteries in 94 healthy subjects. It describes a new method to outline the flow profile of the cerebral vascular tree, including reference values that can grade the collateral flow system and define global hypoperfusion.
Footnotes
ACKNOWLEDGMENTS
Supported by the Swedish Research Council Grant 621-2011-5216; European Union Objective 2 Norra Norrland (Project: 148273 CMTF); The County Council of Västerbotten; and Swedish Heart and Lung Foundation Grants 20110383 and 20140592.
The authors declare no conflict of interest.