
Abstract
The purpose of this study was to investigate the relationship between hyperperfusion and hemorrhagic transformation (HT) in acute ischemic stroke (AIS). Pseudo-continuous arterial spin labeling (ASL) with background suppressed 3D GRASE was performed during routine clinical magnetic resonance imaging (MRI) on AIS patients at various time points. Arterial spin labeling cerebral blood flow (CBF) maps were visually inspected for the presence of hyperperfusion. Hemorrhagic transformation was followed during hospitalization and was graded on gradient recalled echo (GRE) scans into hemorrhagic infarction (HI) and parenchymal hematoma (PH). A total of 361 ASL scans were collected from 221 consecutive patients with middle cerebral artery stroke from May 2010 to September 2013. Hyperperfusion was more frequently detected posttreatment (odds ratio (OR)=4.8, 95% confidence interval (CI) 2.5 to 8.9, P<0.001) and with high National Institutes of Health Stroke Scale (NIHSS) scores at admission (P<0.001). There was a significant association between having hyperperfusion at any time point and HT (OR=3.5, 95% CI 2.0 to 6.3, P<0.001). There was a positive relationship between the grade of HT and time—hyperperfusion with the Spearman's rank correlation of 0.44 (P=0.003). Arterial spin labeling hyperperfusion may provide an imaging marker of HT, which may guide the management of AIS patients post tissue-type plasminogen activator (tPA) and/or endovascular treatments. Late hyperperfusion should be given more attention to prevent high-grade HT.
Keywords
Introduction
During the past few decades, the use of multimodal magnetic resonance imaging (MRI) and CT to delineate the ‘penumbra’ has been the leading imaging approach in the selection of acute ischemic stroke (AIS) patients for thrombolytic and endovascular recanalization therapy. 1 Earlier cohort studies suggested that specific mismatch patterns between perfusion and diffusion MRI lesions may predict clinical responses to thrombolytic therapy.2, 3, 4 Recent randomized clinical trials, however, failed to show that favorable penumbral patterns on neuroimaging can identify patients who would differentially benefit from thrombolytic and recanalization therapy,5, 6, 7 despite a higher rate of reperfusion achieved in treatment groups. In contrast to the snapshot definition of penumbra based on a single pretreatment exam, recent molecular, vascular, and imaging studies indicate a more complex and dynamic situation in the ischemic core that also changes with time—as proposed by the concept of ‘heterogeneity in the penumbra’.8, 9 Such emerging concepts in stroke pathophysiology call for serial neuroimaging both pretherapy and posttherapy to trace the dynamics of reperfusion and to guide further interventions.
Hemorrhagic transformation (HT) is a major risk and a potentially life-threatening complication in patients who receive thrombolysis.10, 11 Past physiologic and imaging studies have linked HT with changes in blood—brain barrier (BBB) permeability and loss of cerebral blood flow (CBF) autoregulation, both of which could lead to posttreatment hyperperfusion that may occur within regions of the brain that reperfuse after initial ischemic injury. Animal stroke models showed that the degree of hyperperfusion in severely damaged cortex is strongly associated with the leakage of Evans blue and intracerebral petechial hemorrhage.12, 13 Earlier positron emission tomography (PET) literature and recent MRI studies suggested that tissues presenting postischemic hyperperfusion may experience metabolic failures and tend to develop infarction.14, 15, 16 The time course of hyperperfusion may also have a critical role in determining the progression of HT and brain tissue. While late postischemic hyperperfusion is often associated with tissue necrosis, early postischemic hyperperfusion might not be detrimental and may even be beneficial.17, 18 To date, however, there remains a large knowledge gap on the dynamic relationship between hyperperfusion and grades of HT during the clinical course of AIS.
In our clinical practice, we found that hyperperfusion can be readily detected with arterial spin-labeled (ASL) perfusion MRI and serial ASL imaging may chronicle the dynamics of territorial perfusion from acute to chronic phases after stroke onset. In the present study, we characterized hyperperfusion on serial ASL scans in a large retrospective series of AIS patients. The main goals of this study were to systematically investigate: (1) the incidence and risk factors of hyperperfusion in AIS patients, (2) the correlation between postischemic hyperperfusion and HT, and (3) the dynamic relationship between the time course of hyperperfusion and grades of HT.
Materials and methods
Patient Selection
The present study was performed on data collected from May 2010 to September 2013 in an ongoing prospective registry of patients evaluated with diffusion—perfusion MRI at our academic medical center. Image data were included in this study if: (1) acute ischemic lesions occurred within the middle cerebral artery (MCA) distribution on diffusion-weighted imaging (DWI); (2) baseline MRI was performed within 24 hours of symptom onset; (3) ASL imaging was acquired along with routine clinical MRI, and (4) the absence of previous intracranial hemorrhage, brain surgery, or large territorial lesion. The institutional review board of the University of California Los Angeles approved the study and waived requirement for informed consent. Analysis of patient data was performed in accordance with the Declaration of Helsinki.
Magnetic Resonance Imaging Protocols and Analysis
All patients underwent MRI on Siemens 1.5 T Avanto or 3.0 T TIM Trio systems (Erlangen, Germany), using 12 channel head coils. Arterial spin labeling was performed at various time points after stroke onset as part of a routine clinical MRI protocol including DWI, gradient recalled echo (GRE), FLAIR (fluid attenuated inversion recovery), and perfusion imaging sequences. A pseudo-continuous ASL pulse sequence with background suppressed 3D GRASE (gradient and spin echo) readout was applied with the following parameters: repetition time (TR)/echo time (TE)/label time/postlabel delay (PLD), 4,000/22/1,500/2,000 ms; field of view, 22 cm; matrix size, 64 × 64, 26 × 5 mm slices; GRAPPA factor of 2, 4/8 partial k-space along slice direction with zero-filling for image reconstruction, 30 pairs of label and control images with a scan time of 4 minutes. In December 2011, a pseudo-continuous ASL GRASE protocol with four PLDs (1,500, 2,000, 2,500, and 3,000 ms) was implemented and the present analysis included CBF data obtained with the PLD of 2,000 ms to match the single delay protocol for the analysis of this paper. On the basis of our experience, the CBF maps of PLD 2,000 ms and derived using 4 PLDs are highly comparable. 19 The imaging parameters of the 4-PLD ASL protocol were the same as those of the single PLD protocol except that eight pairs of label and control images were acquired for each PLD resulting in a scan time of 4 minutes 30 seconds. Two global inversion pulses were applied during the PLD for background suppression. The first background suppression pulse was applied immediately after the labeling pulses, while the interval of the second background suppression pulse was adjusted based on the PLD, T1 of gray and white matter to achieve ∼85% suppression for gray- and white-matter signals.19, 20
Data analysis was performed with Interactive Data Language (IDL, Boulder, CO, USA) software programs developed in-house. Motion correction was performed on ASL images of each PLD. Pairwise subtraction between label and control images was performed followed by averaging to generate the mean difference image. Quantitative CBF maps were calculated based on a previously published model. 20 The infarction core was defined as apparent diffusion coefficient value<550 × 10−6 mm2/s within a brain mask on baseline DWI. Cerebral blood flow maps, GRE, and FLAIR images were corregistered with DWI for each time point in each subject using SPM8. All corregistered imaging modalities were displayed on the same axial slices for ratings.
A 1–3 Likert-type scale was used by two raters respectively to evaluate the ASL image quality with scoring as follows: (1) poor image quality, not interpretable; (2) fair diagnostic image quality, some distortion and noise, acceptable delineation of major structures; and (3) good image quality, no to minimal distortion with detailed delineation of all structures. Also, the two raters were asked to note the presence of hyperperfusion. Hyperperfusion was defined as patchy areas with visually perceivable increased CBF on ASL maps either within or around the corresponding lesion observed on DWI images when compared with the homologous contralateral hemisphere. Special attention was paid to differentiate delayed arterial transit effects from hyperperfusion with the former being thread-like and winding high signals within cortical vessels due to delayed arrival of labeled blood. 21 For patients with 4-PLD ASL examinations, arterial transit time (ATT) maps were inspected to confirm hyperperfusion which was supposed not to present prolonged ATT values (see Supplementary Figure 1).
Gradient recalled echo scans were used to grade HT, which was categorized as hemorrhagic infarction (HI, low grade) or parenchymal hematoma (PH, high grade) according to published criteria. 22 HI1 was defined as small petechiae along the margins of the infarct; HI2, as confluent petechiae within the infarcted area but no space-occupying effect; PH1, as blood clots in 30% of the infarcted area with some slight space-occupying effect; and PH2, as blood clots in >30% of the infarcted area with a substantial space-occupying effect. The two raters who were blinded to the clinical information independently reviewed the MRIs to determine the types of HT on GRE.
In a separate reading session, any discrepancies with regard to the presence of hyperperfusion, HT grades between the raters were resolved by consensus agreement. Arterial spin labeling images with an imaging quality score of 1 by both raters were discarded.
Finally, quantitative CBF values in areas with hyperperfusion were calculated in a retrospective manner. A free-form region of interest (ROI) was hand drawn on multislice CBF maps, which have been normalized into the Montreal Neurological Institute template using SPM8 to delineate hyperperfusion areas by two experienced readers independently. The average CBF was acquired both in the hyperperfusion ROI and its mirror counterpart on the contralateral hemisphere. Relative CBF was defined as the ratio between CBF values in the hyperperfusion ROI and in its contralateral counterpart (CBFrelative=CBFhyperperfusion/CBFcontralateral).
Statistical Analysis
Statistical analysis was performed using SAS version 9.4 (Cary, NC, USA). The weighted kappa test was used to evaluate the interrater agreement. Intraclass correlation coefficient was applied to evaluate reliability between two readers in terms of CBF values of hyperperfusion areas. The Chi-square test (and Fisher's exact test) and t-test were used to determine whether there were statistically significant differences between clinical characteristics when stratified by HT or hyperperfusion. Before analysis, initial DWI lesion volume was transformed using a cubic root transformation (to satisfy the assumption of normal distribution). Patients with 1-PLD and 4-PLD ASL examinations were then analyzed separately to see whether there were differences for the detection of hyperperfusion. Multiple logistic regression (stepwise) analysis was used to identify predictors for HT that were significant in the univariate analysis. The Cochran-Armitage test was performed to assess the relationship between hyperperfusion and number of treatments. The Spearman's rank correlation was used to evaluate time course of hyperperfusion (the time when hyperperfusion was first detected on ASL) and grades of HT (from HI1 to PH2). A P-value of less than 0.05 (2-sided) was considered to be statistically significant.
Results
Demographic and Clinical Information
A total of 361 ASL scans were collected from 221 AIS patients (age=72±17 (mean±s.d.) years; 45% males) from May 2010 to September 2013, excluding 5 ASL scans rated as non-diagnostic. Overall, 104/221 (47%) patients had serial ASL imaging at various time points during hospitalization and 117/221 (53%) had ASL imaging at a single time point. The 4-PLD ASL was performed on 89 and single PLD ASL on 132 patients. The time interval between stroke onset and initial ASL imaging was median 7.05 hours, interquatile range 3.35 to 18.23. A histogram indicating the times and frequencies of ASL examinations can be found in Supplementary Figure 2.
The average score of image quality of included ASL maps was 2.44±0.48. There were 211 and 150 ASL scans collected at 1.5 and 3.0 T with an average image quality score of 2.41±0.46 and 2.49±0.48, respectively (P=0.13). The κ coefficient was 0.631, 0.803, and 0.737 for ASL imaging quality, the presence of hyperperfusion, and HT grades, respectively, between the two raters.
Hyperperfusion was detected in 76/221 (34%) patients. Overall, HT affected 80/221 (36%) patients, including 23/221 (10%) HI1, 20/221 (9%) HI2 (Figure 1), 21/221 (10%) PH1 (Figure 2), and 16/221 (7%) PH2 (Figures 3 and 4). All but one patient had HT occurring within a week (mean time period±s.d.=1.2±1.4 days) and eight (10%) patients were observed to progress from HI to PH (Figures 3 and 4). Figures 1, 2, 3, 4 show representative AIS cases with ASL hyperperfusion who developed different types of HT, respectively. Supplementary Figure 3 shows ASL perfusion-weighted images acquired at the four different PLDs on an AIS case presenting hyperperfusion.
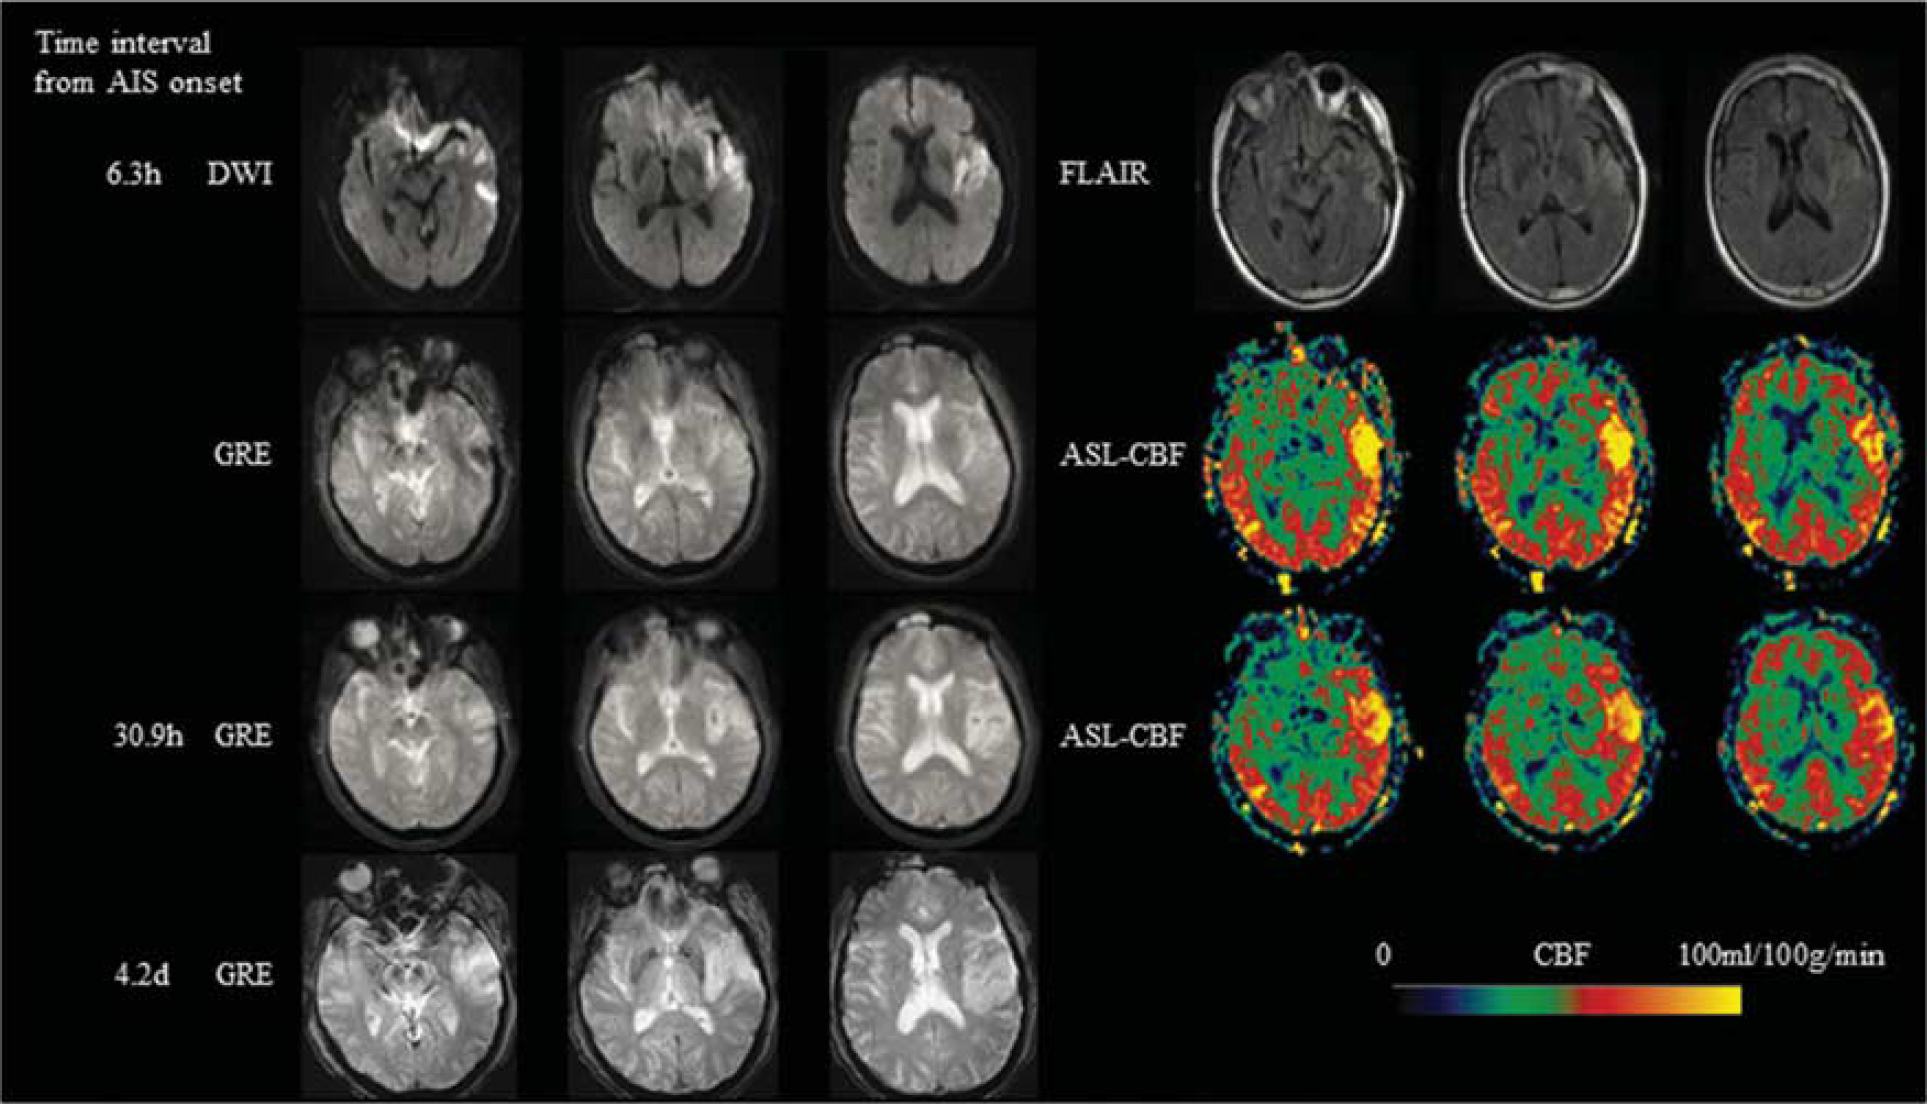
Representative AIS case with aligned diffusion-weighted imaging (DWI), fluid attenuated inversion recovery (FLAIR), gradient recalled echo (GRE), and ASL-CBF. A 71-year-old male with a history of hypertension, presented with dysarthria, right-sided weakness and numbness and was found to have a left middle cerebral artery (MCA) stroke with a Baseline National Institutes of Health Stroke Scale (NIHSS) of 9. Intravenous (IV) tissue-type plasminogen activator (tPA) was given 1.5 hours after onset. ASL scanned 6.3 hours after onset showed hyperperfusion in the left MCA region. Hemorrhagic transformation (HI-2) was seen in the infarction area on GRE scanned 30.9 hours after onset. Imaging at 4.2 days after onset showed dissolved hemorrhage. ASL, arterial spin labeling; CBF, cerebral blood flow.
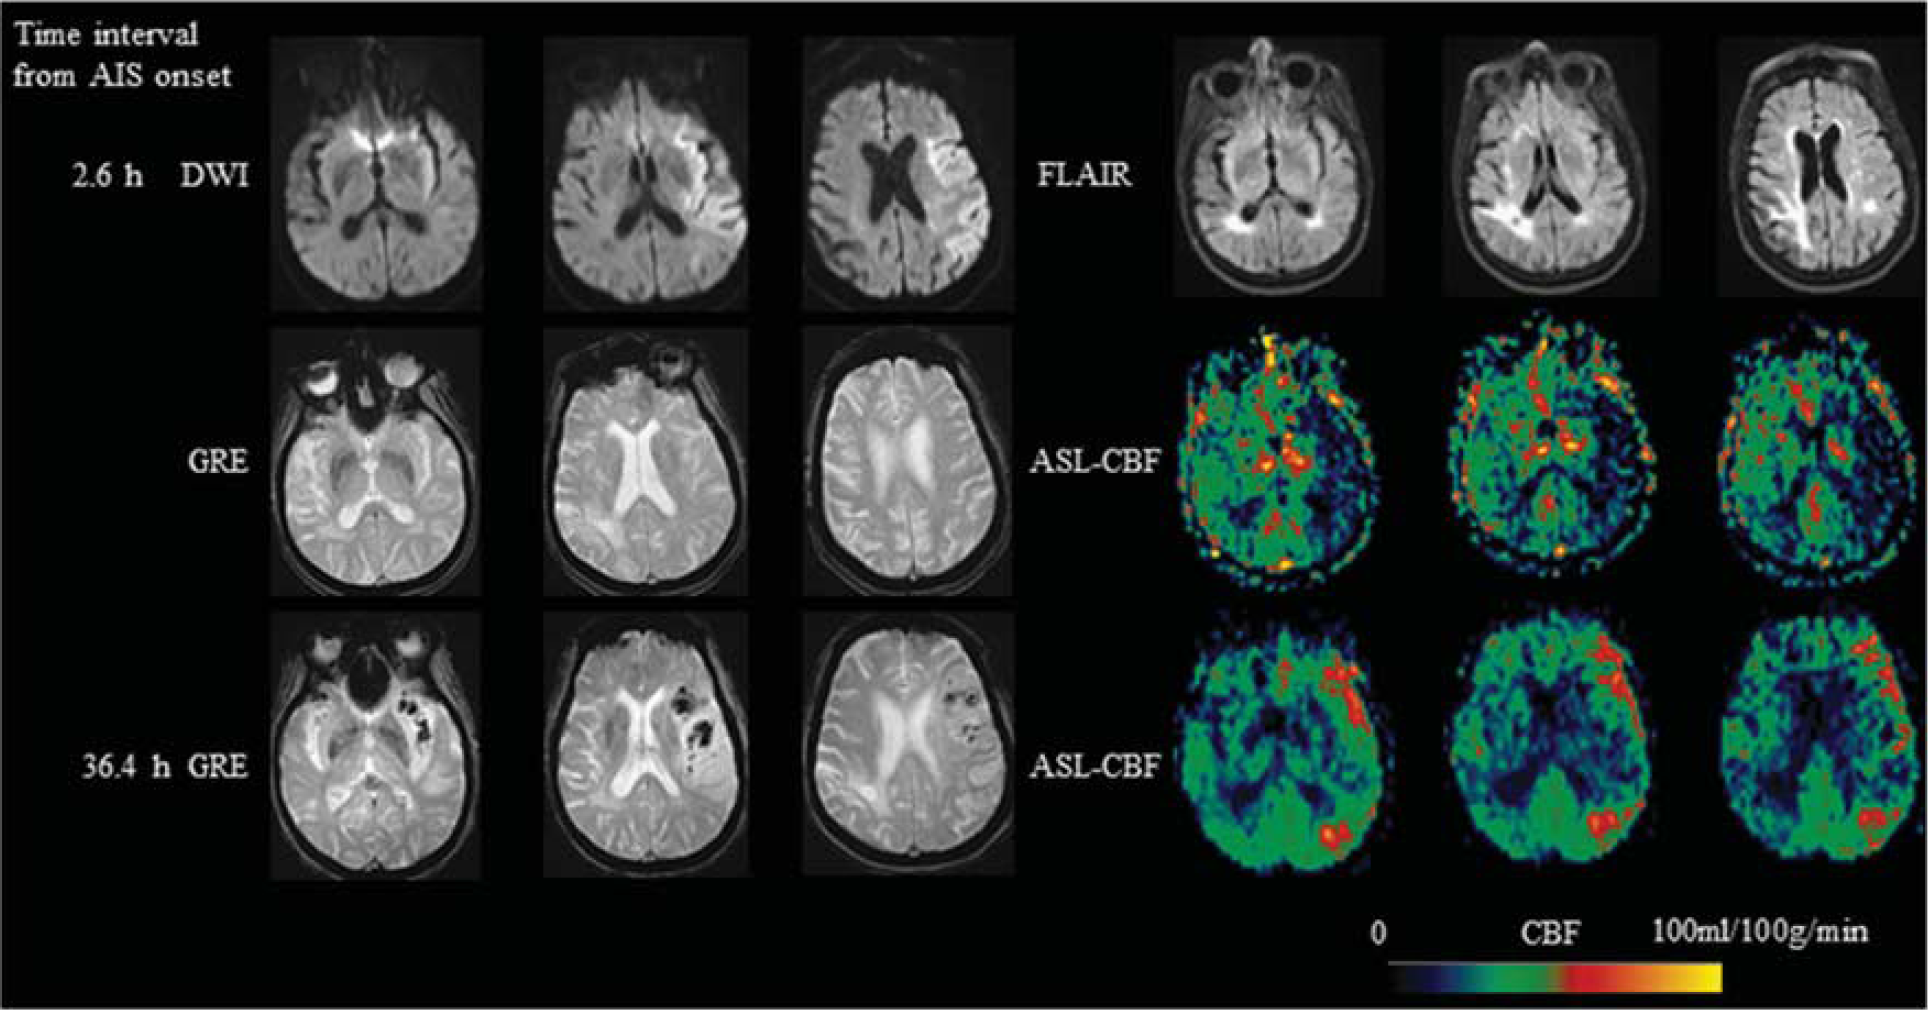
An 85-year-old female with a history of atrial fibrillation, presented with aphasia, hemianopsia, weakness of right side and was found to have a left MCA stroke with a Baseline NIHSS of 19. IV tPA was given 3 hours after onset and then intraarterial tPA and clot retrieval was performed 5 hours after onset. ASL scanned 2.6 hours after onset showed hypoperfusion in the left MCA region. Imaging at 36.4 hours after onset showed left MCA hyperperfusion and hemorrhagic transformation (PH-1) was seen in the infarction area on GRE. MCA, middle cerebral artery; NIHSS, National Institutes of Health Stroke Scale; IV, intravenous; tPA, tissue-type plasminogen activator; ASL, arterial spin labeling; PH, parenchymal hematoma; GRE, gradient recalled echo; CBF, cerebral blood flow.
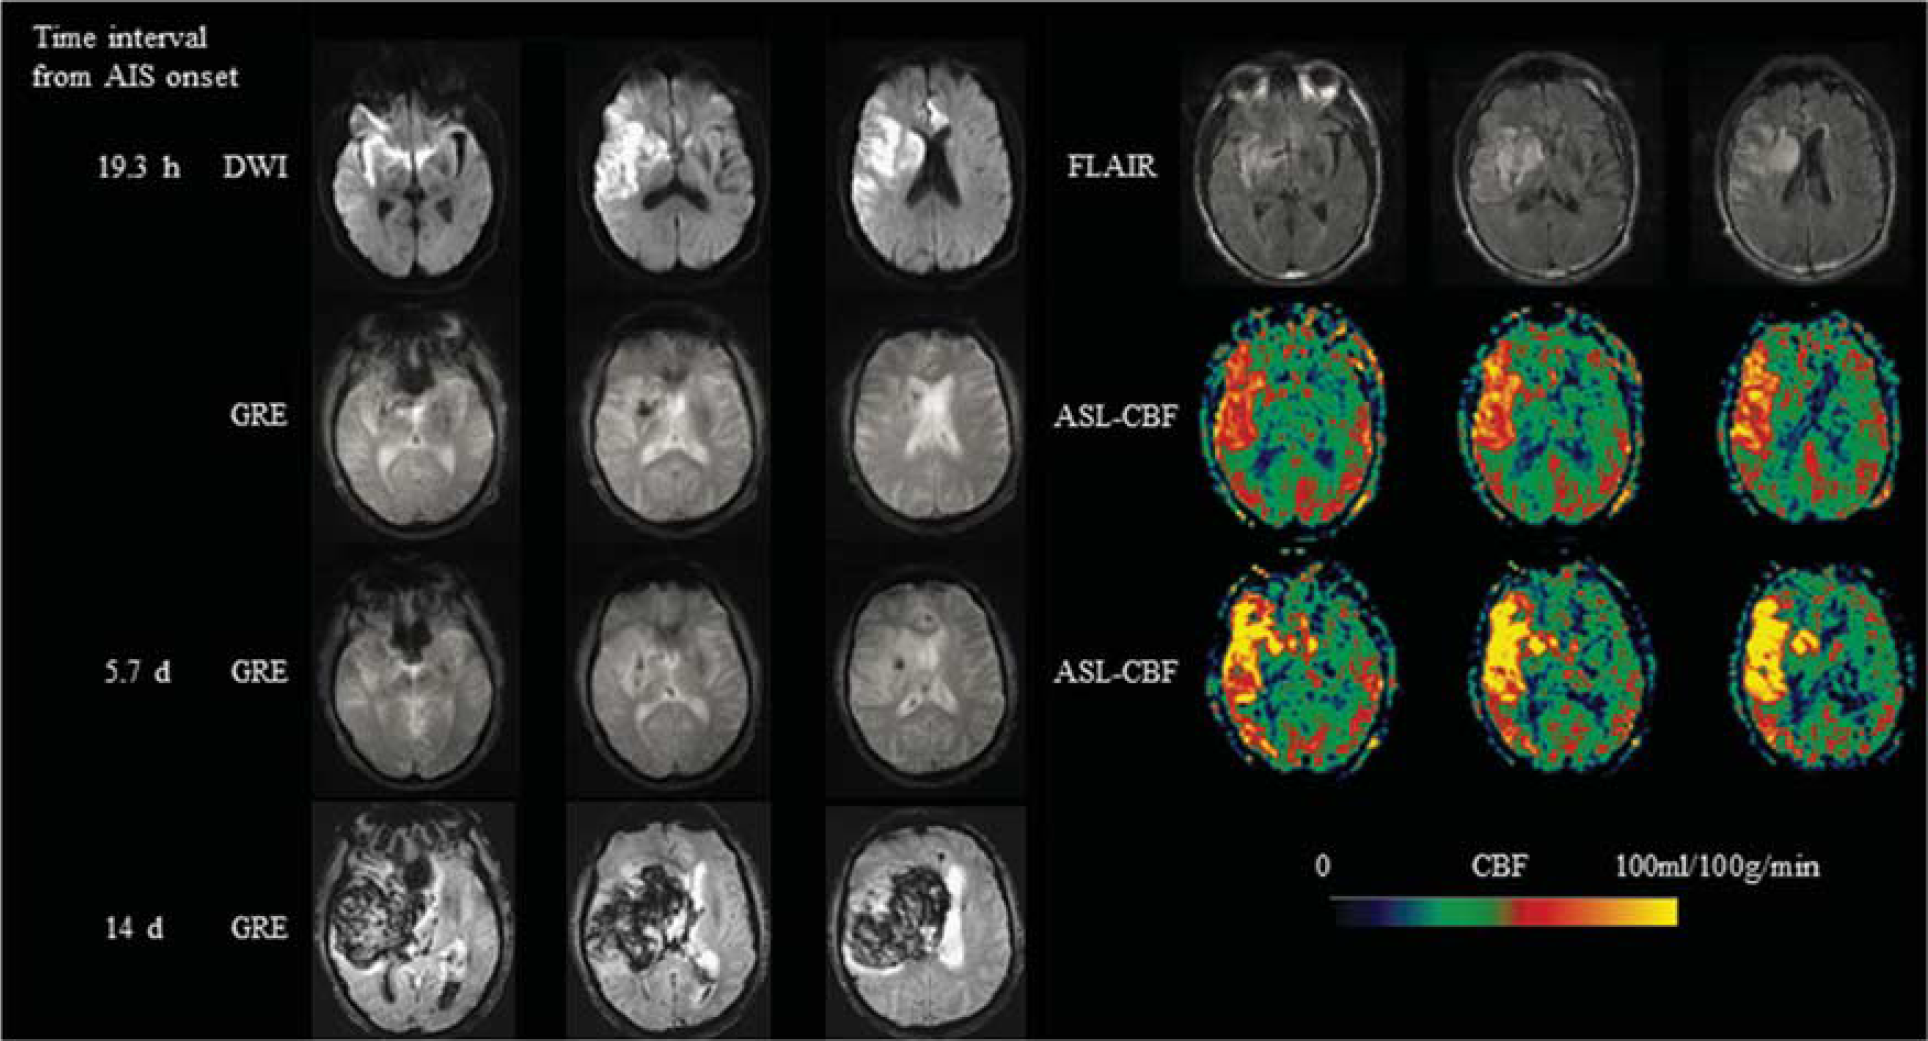
A 75-year-old male with no significant past medical history, presented with sudden-onset left-sided weakness and fall and was found to have a right MCA stroke with a Baseline NIHSS of 17. IV tPA was given 2.8 hours after onset and then clot retrieval was performed 3.6 hours after onset. Hemorrhagic transformation (HI-2) in the right basal ganglia was seen in the infarction area on GRE scanned 19.3 hours after onset. Corresponding ASL scan showed hyperperfusion in the right MCA region. Hyperperfusion still existed on ASL 5.7 days from onset. A hematoma (PH-2) developed 14 days after onset. MCA, middle cerebral artery; NIHSS, National Institutes of Health Stroke Scale; IV, intravenous; tPA, tissue-type plasminogen activator; HI, hemorrhagic infarction; GRE, gradient recalled echo; ASL, arterial spin labeling; PH, parenchymal hematoma; CBF, cerebral blood flow.
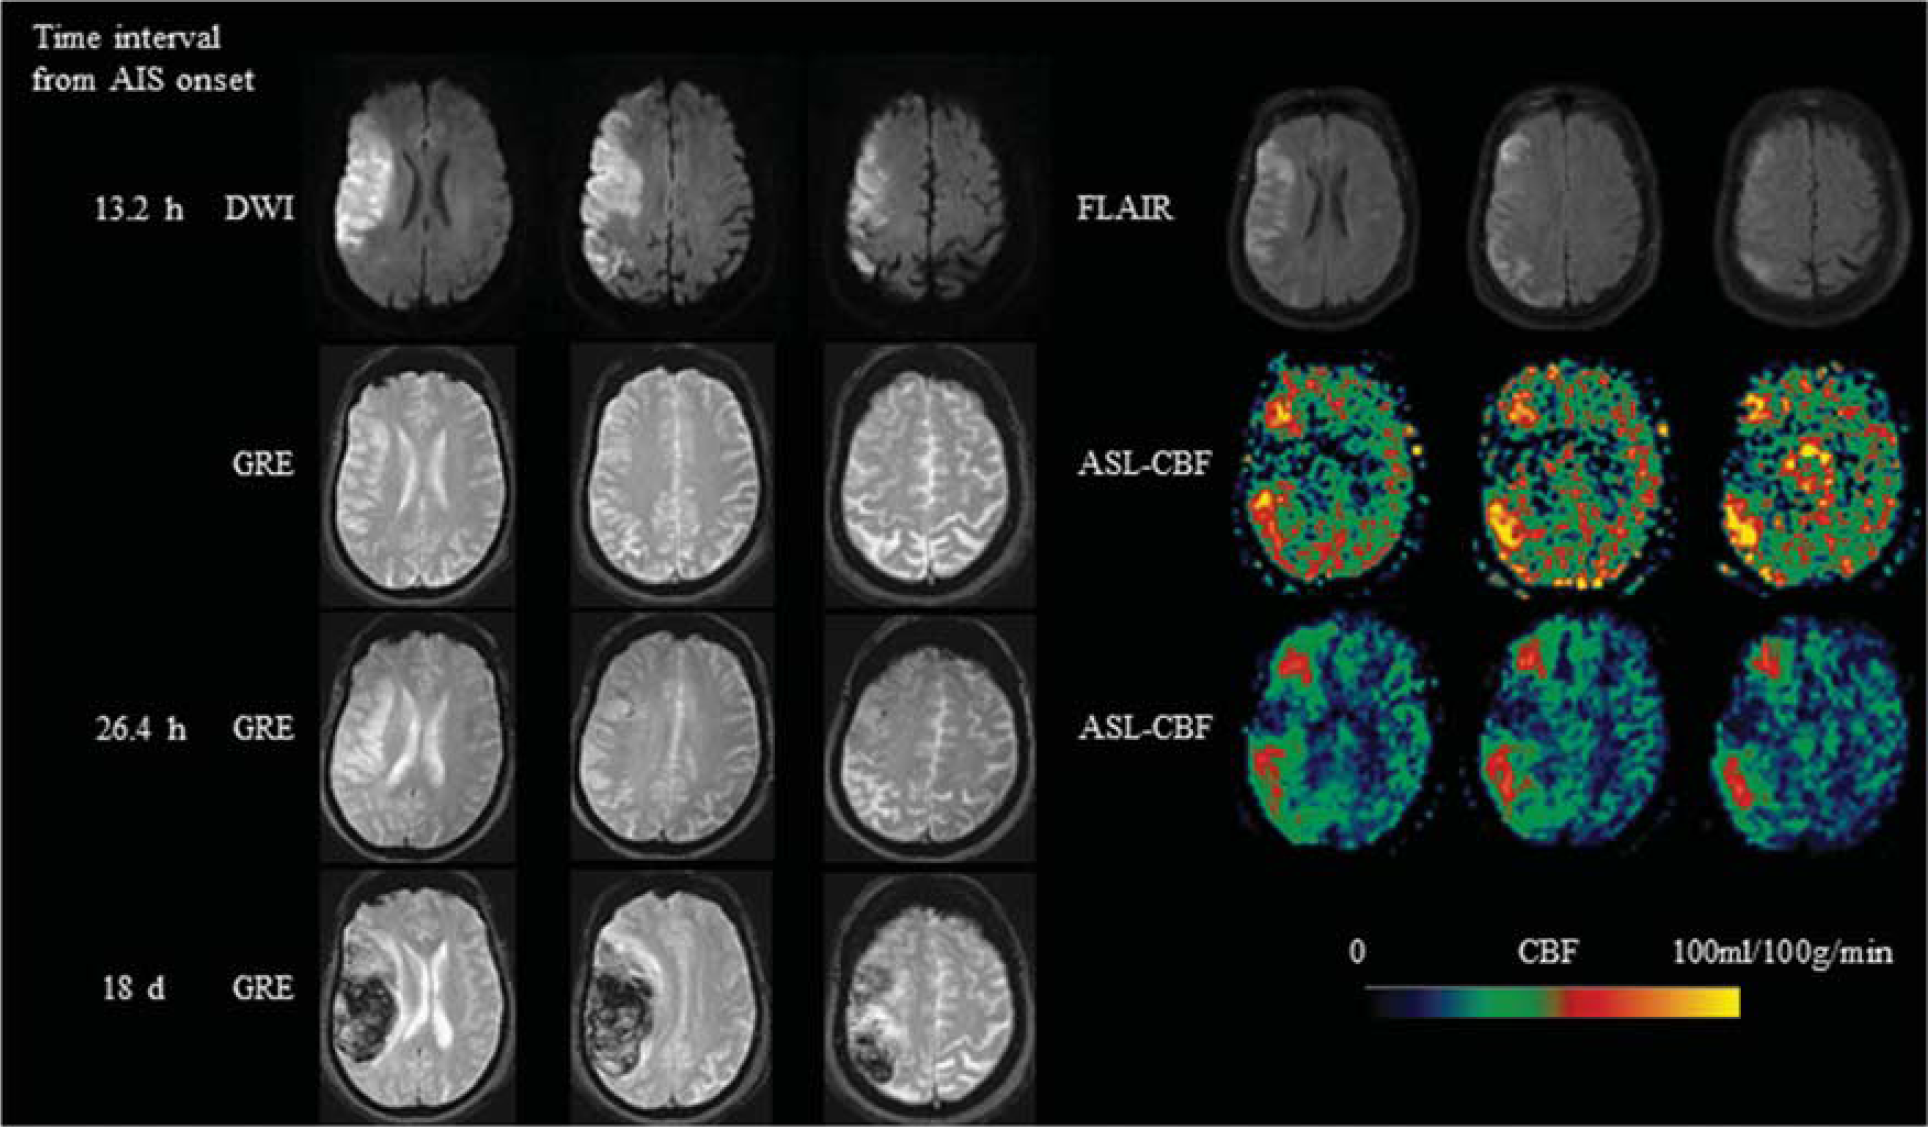
A 78-year-old female with no significant past medical history, presented with left facial droop, dysarthria, left hemiparesis and left neglect and was found to have a right MCA stroke with a Baseline NIHSS of 18. IV tPA was given 2 hours after onset and then clot retrieval was performed 4.7 hours after onset. ASL scanned 13.2 hours after onset showed hyperperfusion in the right MCA region. Hemorrhagic transformation (HI-2) was seen in the infarction area on gradient recalled echo (GRE) scanned 26.4 hours after the onset. A hematoma (PH-2) developed 18 days after onset. MCA, middle cerebral artery; NIHSS, National Institutes of Health Stroke Scale; IV, intravenous; tPA, tissue-type plasminogen activator; ASL, arterial spin labeling; HI, hemorrhagic infarction; PH, parenchymal hematoma; CBF, cerebral blood flow.
Risk Factors of Hemorrhagic Transformation
Table 1 summarizes the risk factors of HT. Hemorrhagic transformation was associated with higher National Institutes of Health Stroke Scale (NIHSS) scores on admission (P<0.001), initial DWI lesion volume (P=0.002), the presence of hyperperfusion (odds ratios (ORs) 3.5, 95% confidence intervals (CIs) 2.0 to 6.3), any reperfusion treatment (OR 4.8, 95% CI 2.5 to 8.9), intravenous tissue-type plasminogen activator (tPA) treatment (OR 3.1, 95% CI 1.8 to 5.6), clot retrieval treatment (OR 4.1, 95% CI 2.0 to 8.5), the presence of atrial fibrillation (OR 2, 95% CI 1.1 to 3.9), and current smoker (P=0.01). Stent treatment was associated with a higher odds of hyperperfusion, however, was not statistically significant (OR 3.6, 95% CI 0.87 to 15, P=0.05). Based on stepwise multivariate logistic regression analysis, HT was related with hyperperfusion (OR 2.9, 95% CI 1.5 to 5.6), intravenous tPA treatment (OR 2.7, 95% CI 1.4 to 5.0), clot retrieval treatment (OR 3.0, 95% CI 1.3 to 6.4), atrial fibrillation (OR 2.2, 95% CI 1.1 to 4.4), and DWI lesion volume (OR 1.04, 95% CI 1.0 to 1.1). Although NIHSS was a significant risk factor for HT in the univariate analysis, it was not a significant predictor in the multivariate model. Hyperperfusion was a significant predictor of HT both in patients examined with 1-PLD ASL (P=0.003) and in patients examined with 4-PLD ASL (P=0.003) (see Supplementary Tables 1 and 2).
List of demographic, clinical, and laboratory variables stratified by HT
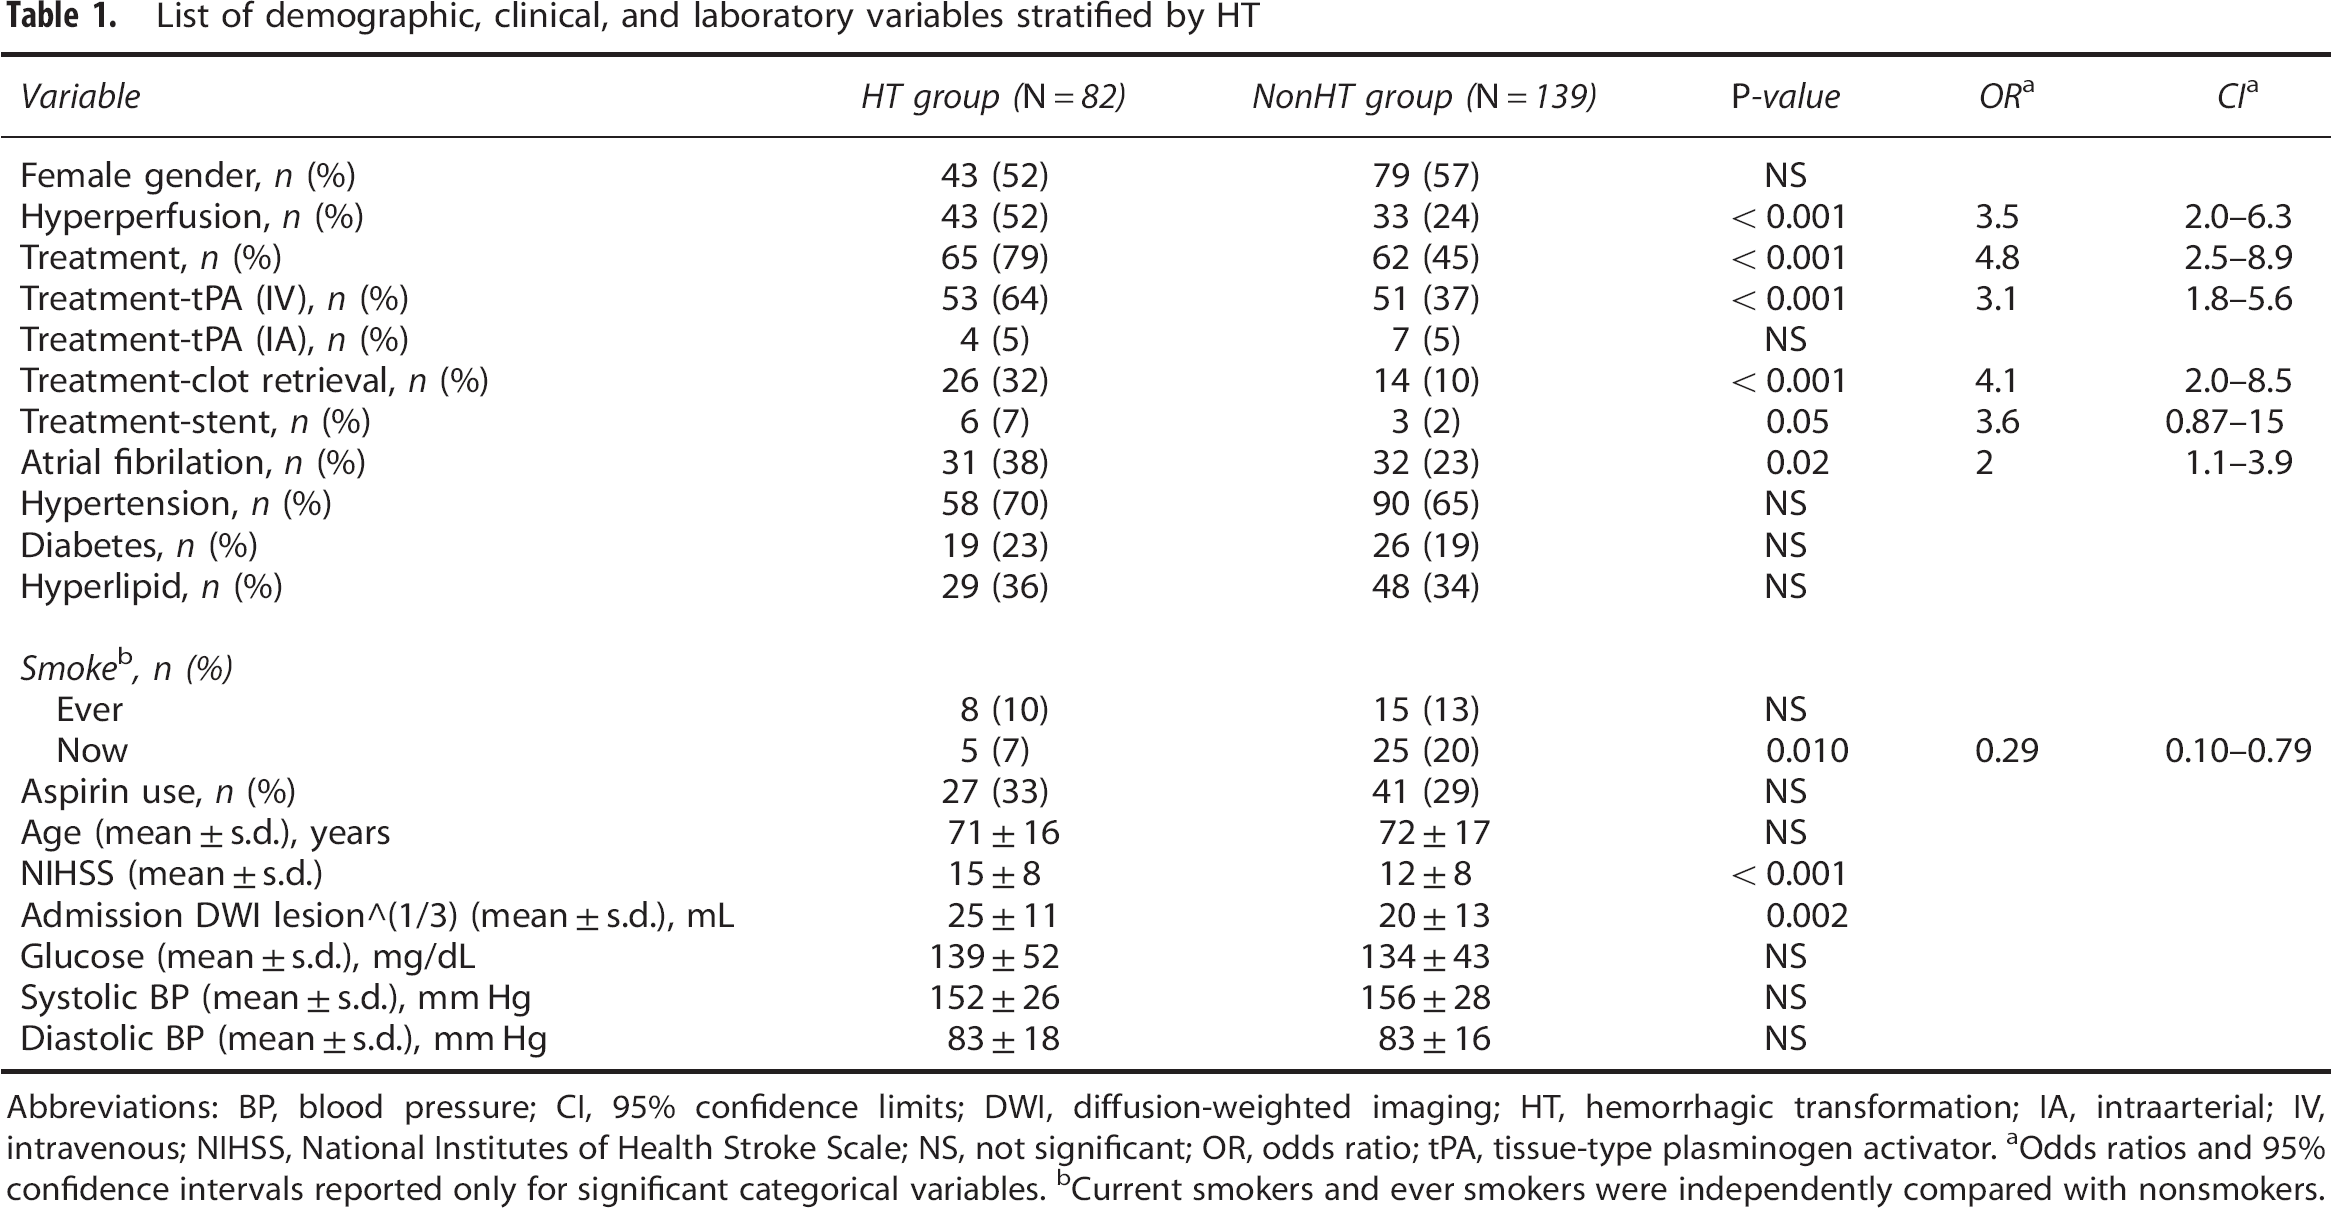
Abbreviations: BP, blood pressure; CI, 95% confidence limits; DWI, diffusion-weighted imaging; HT, hemorrhagic transformation; IA, intraarterial; IV, intravenous; NIHSS, National Institutes of Health Stroke Scale; NS, not significant; OR, odds ratio; tPA, tissue-type plasminogen activator.
Odds ratios and 95% confidence intervals reported only for significant categorical variables.
Current smokers and ever smokers were independently compared with nonsmokers.
Rate and Risk Factors of Hyperperfusion
Table 2 summarizes the risk factors of ASL hyperperfusion. Hyperperfusion was associated with any reperfusion treatment (OR 4.9, 95% CI 2.5 to 9.3), intravenous tPA treatment (OR 2.7, 95% CI 1.5 to 4.8), clot retrieval treatment (OR 2.9, 95% CI 1.4 to 5.8), and high NIHSS scores on admission (P<0.001).
List of demographic, clinical, and laboratory variables stratified by hyperperfusion
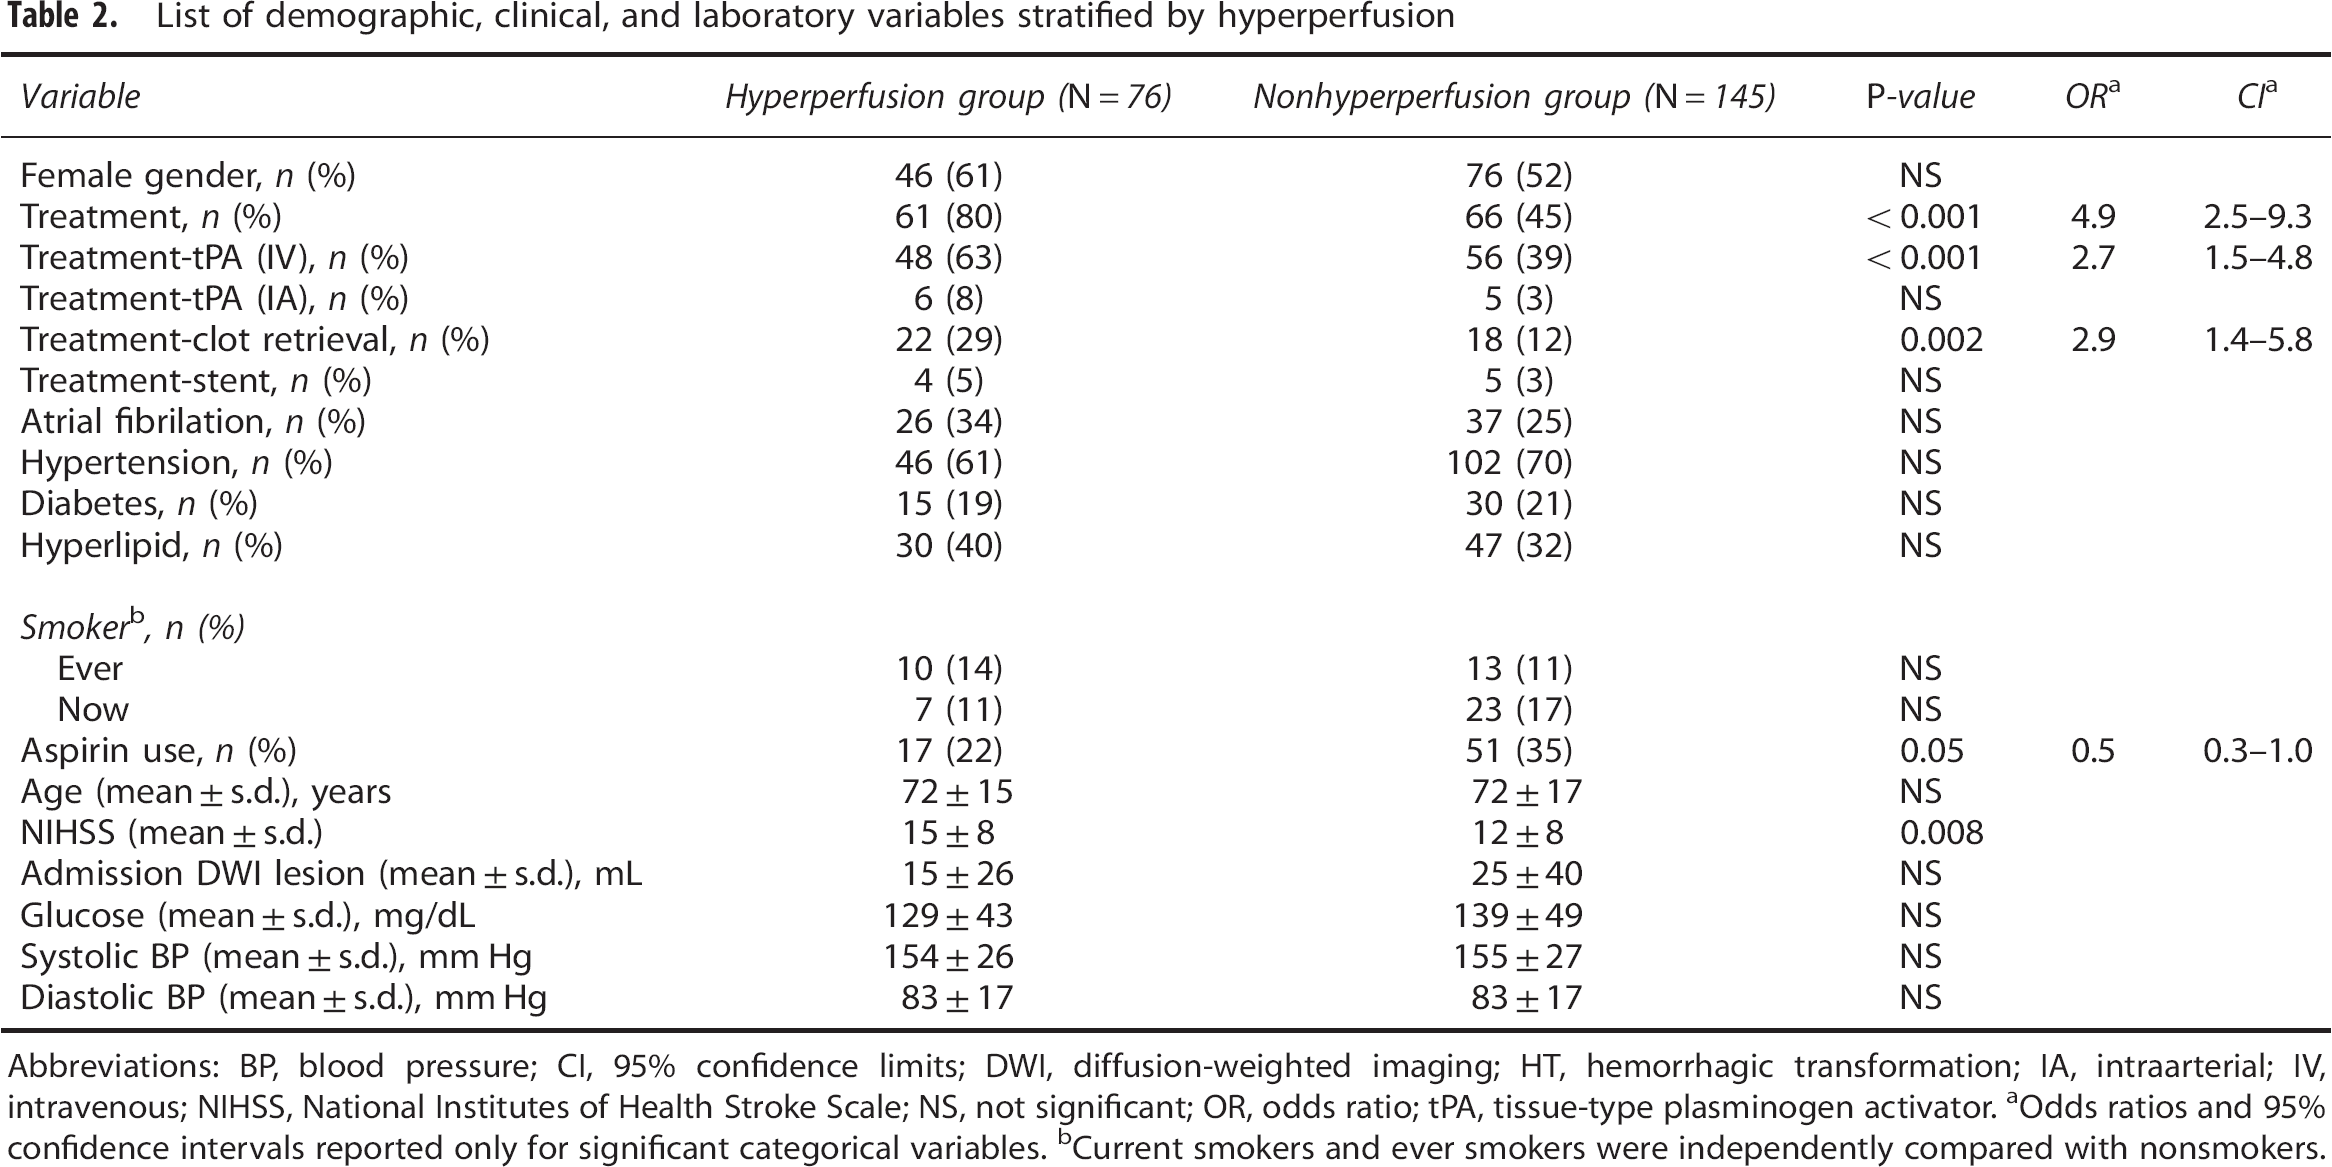
Abbreviations: BP, blood pressure; CI, 95% confidence limits; DWI, diffusion-weighted imaging; HT, hemorrhagic transformation; IA, intraarterial; IV, intravenous; NIHSS, National Institutes of Health Stroke Scale; NS, not significant; OR, odds ratio; tPA, tissue-type plasminogen activator.
Odds ratios and 95% confidence intervals reported only for significant categorical variables.
Current smokers and ever smokers were independently compared with nonsmokers.
An incidence of hyperperfusion of 48% and 16% was observed in patients with and without reperfusion treatment, respectively. The Cochran-Armitage trend test indicated that there was a statistically significant relationship between hyperperfusion and the number of reperfusion treatments (P<0.001). Patients who had one reperfusion treatment were 4.8 times as likely to have hyperperfusion as those who did not have any treatment; patients who had two reperfusion treatments were 6.2 times as likely. However, the odds ratio for three reperfusion treatments was not significant, likely due to the fact that only a few patients had three treatments.
Relationship Between Hyperperfusion and Hemorrhagic Transformation
There was a statistically significant relationship between ever having hyperperfusion and HT (57% versus 27%, OR=3.5, 95% CI 2.0 to 6.3, P<0.001) (Table 1).
Hyperperfusion can occur within or around corresponding DWI lesions. There were no statistically significant differences between the two types of hyperperfusion with respect to HI (57% versus 48%, P>0.05) and PH (21% versus 17%, P>0.05). The presence of both hyperperfusion and HT was observed in 42/221 (19%) patients. Among them, 15/42 (35.7%) patients developed hyperperfusion before the occurrence of HT; 20/42 (47.6%) patients showed hyperperfusion and HT at the same imaging time point; and 7/42 (16.7%) patients developed hyperperfusion after the occurrence of HT. Hyperperfusion and HT overlapped spatially in 29/42 (69%) patients and occurred in distinct areas in the rest, 13/42 (31%) patients.
Parenchymal hematomas did not differ in frequency among patients with and without hyperfusion (19.7% versus 15.2%, P>0.05).
Time Course of Hyperperfusion and Relationship with Grades of Hemorrhagic Transformation
There was a positive relationship between grades of HT (from HI1 to PH2) and time to hyperperfusion with the Spearman's rank correlation of 0.44 (P=0.003) (Supplementary Figure 4), which indicated that late hyperperfusion was more likely to be associated with higher grade HT. Among the 76 patients who had hyperperfusion, 48 patients had first ASL scans within 12 hours from onset. Parenchymal hematoma occurred in 1/20 (5%) and 8/28 (29%) patients with first hyperperfusion within and after 12 hours from onset, respectively (Figure 5), indicating a potential trend that patients who developed first hyperperfusion after 12 hours from stroke onset were more likely to experience PH than those with first hyperperfusion within 12 hours (Fisher's exact test, P=0.06). National Institutes of Health Stroke Scale scores, initial DWI lesion volume, and number of thrombolysis treatments were not significantly different between the two groups (see Supplementary Table 3).
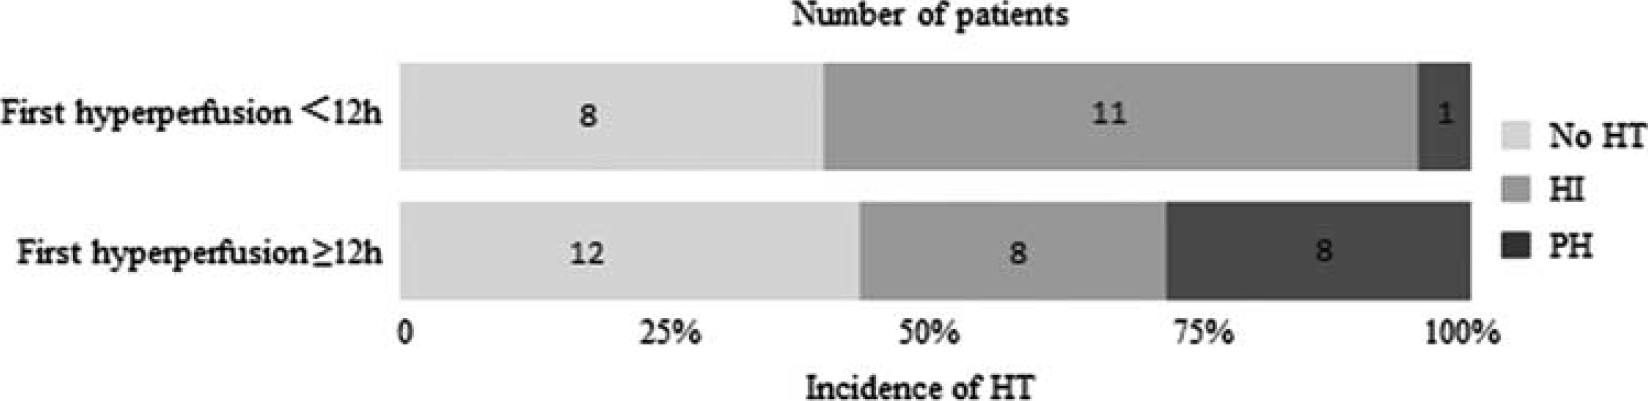
Time course of hyperperfusion and corresponding percentages of different grades of hemorrhagic transformation (HT).
Quantitative Analysis of Hyperperfusion
The intraclass correlation coefficient between CBF values by two readers was 0.96, which indicates excellent reliability. Average CBF in hyperperfusion ROIs and contralateral mirror ROIs was 70.1±25.5 and 43.8±18.1 mL/100 g per minute respectively (P<0.001) with CBFrelative=1.7±0.5. Average CBF in hyperperfusion ROIs and contralateral mirror ROIs within leptomeningeal MCA territory was 72.4±25.7 and 45.5±18.2 mL/100 g per minute respectively (P<0.001) with CBFrelative=1.7±0.4. Average CBF in hyperperfusion ROIs and contralateral mirror ROIs within perforator MCA territory was 53.1±18 and 31.3±12 mL/100 g per minute respectively (P<0.001) with CBFrelative=1.8±0.6.
Discussion
The main finding of this study was that hyperperfusion on ASL images acquired at any time point after stroke onset was significantly associated with HT. Patients presenting hyperperfusion within or around DWI lesions were approximately three times as likely to experience HT compared with patients without hyperperfusion. Multivariate logistic regression analysis indicated that hyperperfusion was an independent risk factor of HT, controlling the effects of NIHSS scores at admission, DWI lesion volume, and thrombolysis treatment. Furthermore, stratified analyses by both single and 4-PLD ASL showed significant relationship between hyperperfusion and HT. The mechanisms underlying HT are not completely understood. Previous studies showed that HT may be caused by metabolic failures and accumulated by-products that can cause vasoplegia and also are implicated in modulating BBB permeability.14, 15, 23, 24 As a result, HT is more likely to occur within and/or around brain tissues severely damaged during ischemia when recanalization is achieved. Diffusion lesions indicate severely damaged ischemic tissue that is likely to infarct. Previous physiologic and imaging studies showed that these tissues might have undergone changes in BBB permeability and loss of CBF autoregulation, both of which could lead to hyperperfusion after reperfusion. As a result, we commonly observed hyperperfusion within DWI infarct regions in our study cohort.
The present study also investigated the incidence and risk factors of hyperperfusion. Patients receiving intravenous thrombolysis were three times as likely to develop hyperperfusion compared with those without thrombolytic treatment. Existing ASL studies on stroke25, 26 have linked hyperperfusion to the ‘luxury perfusion’ seen on PET CBF imaging studies and suggested that hyperperfusion may be associated with positive outcomes in AIS. 18 Hyperperfusion after revascularization has been observed in both CT and dynamic susceptibility contrast perfusion MRI studies.16, 27 In contrast to regions showing normal perfusion after recanalization, regions presenting hyperperfusion mainly developed infarction and had greater bioenergetic compromise in pretreatment imaging measures. 16 As suggested by PET literature,14, 15 luxury perfusion may indicate metabolic failures such as low oxygen extraction fraction. The observed significant association between hyperperfusion and HT in our study provides support to the hypothesis that postischemic hyperperfusion may reflect loss of autoregulation (or vasoparalysis) and greater regional vulnerability to HT in AIS patients.
Parenchymal hematoma is a more severe form of HT than HI and is independently associated with an increased risk for death or disability. 28 It will therefore be important to improve the prevention of high-grade HT in the posttreatment management of AIS. Our study showed that there was no significant difference between the incidence of PH in patients with and without hyperperfusion. However, we observed a statistically significant association between late occurrence of hyperperfusion and high-grade HT. In addition, there was a trend suggesting that hyperperfusion occurring after 12 hours after stroke onset was more likely to be associated with PH compared with those occurring within 12 hours. The reason may be that tissues experiencing a longer time to recanalization are more severely damaged in terms of their capability for maintaining normal metabolic activity, autoregulation of CBF and BBB permeability. Early hyperperfusion may indicate reperfusion in ischemic tissue that is still at least partially viable. As suggested by several clinical studies, hyperperfusion at an early stage may have a protective or harmless role in the progression of stroke,17, 18, 29 supporting the clinical benefit from thrombolysis and early reperfusion. Therefore, the recognition of late-stage hyperperfusion (12 hours after onset in this study) may enable timely intervention to avert PH with blood pressure moderation and BBB stabilizing therapies in the future.
It is worth noting that the incidence of death or disability at 3 months after stroke onset was higher in patients with HI compared with patients without HT. 28 Hemorrhagic infarction grades of HT may not be benign and the likelihood of a poor outcome after thrombolysis was proportional to the spatial extent of hemorrhage. 30 Our study also showed HI can progress into PH in 8/37 (22%) patients. Therefore, it might be beneficial to prevent all kinds of HT in clinical practice that could be heralded by hyperperfusion on ASL.
Our study revealed that postischemic hyperperfusion can be reliably detected by serial ASL imaging, with a high degree of consistency between readers. Compared with other brain perfusion imaging techniques relying on radiation (e.g., PET and CT perfusion imaging) and dynamic susceptibility contrast MRI, ASL is an entirely noninvasive and quantitative technique that possesses several unique advantages for tracing the evolution of the pathophysiology in AIS and to guide therapies. 31 While the main limitation of ASL in stroke has been the potential underestimation of tissue perfusion in the presence of prolonged arterial transit delays, hyperperfusion is easily detectable in ASL since the ATT is shortened or at least not prolonged. Quantification of CBF in hyperperfused brain regions can be achieved with a standard PLD typically used for normal brain perfusion imaging. 20 Cerebral blood flow values in hyperperfusion areas may vary widely due to many factors such as patient's baseline CBF, blood pressure, tissue's viability, and brain location of hyperperfusion. Despite all these influencing factors, our research showed that CBF values in hyperperfusion areas were about 1.7 times as high as those in the contralateral ROIs which may contribute to the development of automatic programs to detect postischemic hyperperfusion in future. The accuracy for the detection and quantification of hyperperfusion can be further improved using multiPLD ASL, which can provide ATT maps to differentiate hyperperfusion from collateral flow with prolonged ATT. 19 In contrast, the conspicuity of hyperperfusion along with its quantification may be challenging for dynamic susceptibility contrast perfusion imaging, given the shortened passage of the bolus contrast and the subsequently reduced number of data points.
The penumbra theory was derived from animal models of stroke suggesting a homogenous core of injury surrounded by a ‘penumbral’ region that could be salvaged.7, 32 To date, however, no randomized, controlled trial has shown that patients who are selected for thrombolysis and/or mechanical thrombectomy on the basis of the penumbral-imaging pattern have better clinical outcomes than patients who are treated without imaging guidance or with nonpenumbral imaging patterns. 5 Because the benefits of revascularization treatment are highly time dependent, except at a few advanced academic medical centers most patients are treated without using the penumbral pattern for patient selection. Recently, ambulance-based thrombolysis has been introduced without an increase in adverse events, 33 evidencing a global trend to minimize the alarm-to-treatment time in AIS. It is expected that a larger fraction of patients otherwise presenting too late will be shifted into the time window of thrombolysis and thus increasing thrombolysis rates.33, 34 Endovascular therapy is thought to be the next step when intravenous tPA fails to achieve early reperfusion. 35 However, a major risk and complication of thrombolytic therapy is HT. In fact, more than half of the patients treated with thrombolysis did not recover completely or died and HT accounted for most of the early excess deaths compared with patients without thrombolytic treatment. 36 Endovascular therapy after intravenous tPA can also increase the rate of HT. 37 In summary, recent negative results from randomized clinical trials and the global trend to minimize the alarm-to-treatment time in AIS along with the findings from the present study suggest that it may be time to expand the research focus of stroke neuroimaging from pretreatment patient selection to posttreatment management and particularly to the prevention of HT after thrombolytic and/or revascularization therapy.
This study has several limitations. First, as an initial step to investigate the relationship between hyperperfusion and HT in AIS only patients with MCA stroke were selected to provide a relatively homogeneous cohort. Second, since ASL was not acquired concurrently with GRE at every time point in each patient, the causal relationship between hyperperfusion and HT cannot be fully investigated. This may partially explain the different types of temporal sequences with respect to the occurrence of hyperperfusion and HT observed in the present study. Finally, information on the clinical outcome was not available for all patients, limiting our capability for inferring the clinical impact of hyperperfusion. A multicenter trial with well-controlled design is required to address the temporal sequence of hyperperfusion and its relationship with HT and clinical outcome during the time course of AIS.
Single and serial ASL perfusion imaging in diverse patients with MCA stroke both prethrombolytic and postthrombolytic and/or endovascular treatments revealed the importance of hyperperfusion. Postischemic hyperperfusion was reliably detected on ASL and was significantly associated with HT. There was a trend that patients with late hyperperfusion were more likely to experience high-grade HT. Our study represents an important initial step to generate the hypothesis on the temporal sequence of hyperperfusion along with its effect on HT, which should be further investigated in larger scale prospective clinical trials.
Footnotes
References
Supplementary Material
Please find the following supplemental material available below.
For Open Access articles published under a Creative Commons License, all supplemental material carries the same license as the article it is associated with.
For non-Open Access articles published, all supplemental material carries a non-exclusive license, and permission requests for re-use of supplemental material or any part of supplemental material shall be sent directly to the copyright owner as specified in the copyright notice associated with the article.