
Abstract
Quantitative oxygen extraction fraction (OEF) in cortical veins was studied in patients with multiple sclerosis (MS) and healthy subjects via magnetic resonance imaging (MRI) phase images at 7 Tesla (7 T). Flow-compensated, three-dimensional gradient-echo scans were acquired for absolute OEF quantification in 23 patients with MS and 14 age-matched controls. In patients, we collected T2∗-weighted images for characterization of white matter, deep gray matter, and cortical lesions, and also assessed cognitive function. Variability of OEF across readers and scan sessions was evaluated in a subset of volunteers. OEF was averaged from 2 to 3 pial veins in the sensorimotor, parietal, and prefrontal cortical regions for each subject (total of ∼10 vessels). We observed good reproducibility of mean OEF, with intraobserver coefficient of variation (COV)=2.1%, interobserver COV=5.2%, and scan—rescan COV=5.9%. Patients exhibited a 3.4% reduction in cortical OEF relative to controls (P=0.0025), which was not different across brain regions. Although oxygenation did not relate with measures of structural tissue damage, mean OEF correlated with a global measure of information processing speed. These findings suggest that cortical OEF from 7-T MRI phase is a reproducible metabolic biomarker that may be sensitive to different pathologic processes than structural MRI in patients with MS.
Introduction
The healthy brain consumes 20% of total body energy through aerobic metabolism, 1 and continuous oxygen delivery to the brain is critical to maintain viability of neural tissue. The ability to noninvasively image brain oxygenation would offer new insight into disease states including acute disruptions to the oxygen supply of the brain, such as stroke 2 and tumor, 3 as well as more subtle metabolic changes in neurodegenerative disorders such as Alzheimer's diseases 4 and multiple sclerosis (MS). 5 However, oxygenation imaging in vivo is technically challenging. Traditional approaches with 15O positron emission tomography cannot be readily applied in the clinic because of the complex setup necessary to administer short-halflife radiotracers.
One promising new magnetic resonance imaging (MRI) approach quantifies oxygenation levels on gradient-echo phase images. Because deoxyhemoglobin molecules in veins are paramagnetic, the susceptibility shift between a vessel and its neighboring brain tissue creates oxygenation-dependent field perturbations that manifest on MRI phase images.6, 7 Through modeling each vessel as a long cylinder parallel to the main magnetic field, there is a simple relationship between the observed phase difference between venous blood and brain tissue to the underlying oxygen extraction fraction (OEF) in the vein. This approach has been showed in large draining vessels of the brain 8 and femoral vessels of the knee. 9
Because OEF quantification is made in individual veins, the phase-based method innately offers regional metabolic information given sufficient spatial resolution of the vessels. 10 Furthermore, these measurements can take advantage of improved resolution achievable with high signal-to-noise ratio images acquired at ultra-high field (7 Tesla; 7 T and higher) to probe smaller veins that are more indicative of local brain function. 11 This technique has not been attempted at 7 T and there is little understanding of the variability in oxygenation values across scan sessions and readings.
As a potential clinical application of the MRI method, there is recent evidence that metabolic disturbance in MS could relate to lesion formation and inflammation near cortical veins 12 as well as cognitive decline in patients. Initial studies on brain oxygen consumption in MS performed using 15O positron emission tomography showed reductions of absolute cerebral blood flow and cerebral oxygen metabolism in both gray matter (GM) and white matter (WM).5, 13 Similarly, MRI observations of decreased T2∗ relaxation rate in frontal normal-appearing WM 14 and reduced visibility of periventricular veins on susceptibility-weighted images 15 indicate decreased oxygen extraction in MS. T2∗-weighted imaging at 7 T has also revealed vascular alterations (reduced periventricular venous density) in patients that are consistent with widespread hemodynamic and metabolic changes related to the disease. 16 In a previous study, Ge et al 17 applied T2-relaxation-under-spin-tagging MRI to directly measure absolute OEF in the sagittal sinus of patients with relapsing-remitting MS (RRMS) with MRI. Ge et al found reductions in global OEF in patients relative to healthy controls, which correlated with clinical disability and lesion volume (LV).
The first aim of this study was thus to implement phase-based oxygenation measurements at high field MRI. At 7 T, we achieved submillimeter resolution in gradient-echo phase images to estimate OEF in small vessels, and assessed the intraobserver, interobserver, and scan—rescan reproducibility of the measurements. With this phase MRI approach, we compared OEF in separate cortical regions in patients at different stages of MS relative to age-matched healthy controls. Finally, because the pathologic and clinical correlates of altered oxygen metabolism are not well understood, we performed an exploratory analysis to evaluate quantitative OEF changes against MRI measures of tissue damage and measures of clinical disability in patients.
Materials and Methods
Patients and Control Subjects
Thirty-seven subjects including 23 patients (17 women; mean age±s.d.=41.8±7 years) and 14 age-matched controls (8 women; mean age±s.d.=39.5±7 years) were recruited for this prospective study. Demographic and clinical information, including Expanded Disability Status Scale (EDSS) scores, 18 for the patients are provided in Table 1. Eligibility criteria for patients were: age between 18 and 64 years, a diagnosis of clinically isolated syndrome or clinically definite MS, 19 absence of a clinical relapse within three months, and no corticosteroid therapy within 1 month of study initiation. RPK and ASN, board-certified and MS neurologists, recruited patients presented with clinically isolated syndrome/early MS (N=6); RRMS (disease duration of >3 years; N=11); and secondary-progressive MS (N=6); according to accepted disease phenotype criteria for clinical and research purposes. 19
Demographics and cognitive characteristics of 23 patients with multiple sclerosis
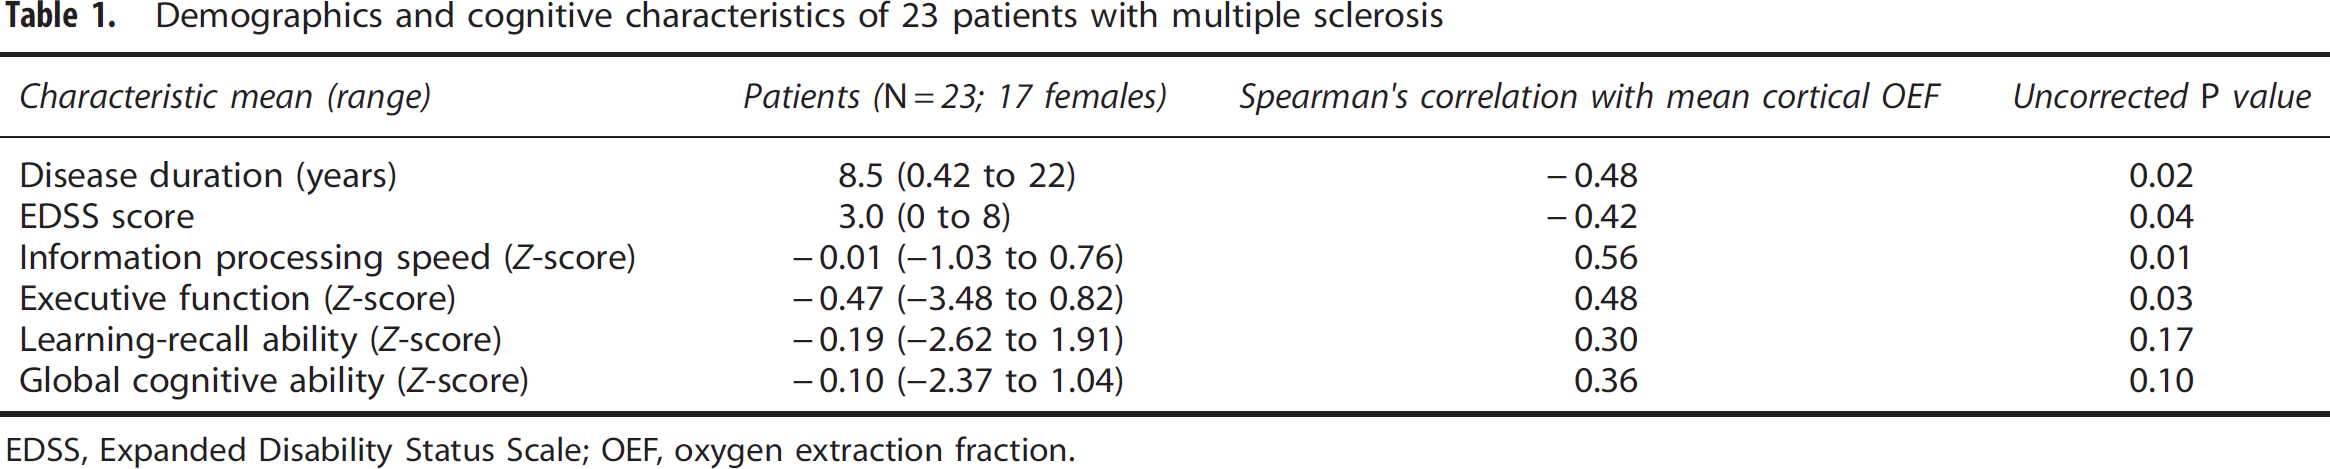
EDSS, Expanded Disability Status Scale; OEF, oxygen extraction fraction.
Exclusion criteria for this study included significant psychiatric and/or neurologic disease other than MS, medical comorbidity, or a condition that could affect OEF measurements including cardiovascular disease, respiratory syndrome, liver disease, or anemia. Seventeen patients were on immunomodulating treatments and five were untreated at the time of MRI. Disease duration was assessed as the time elapsed from the onset of MS-related symptoms and enrollment in the present study. The study was performed with informed consent from each subject under approval from the local Institutional Review Board (Partners Human Research Committee, Boston, MA, USA).
Data Acquisition
Subjects were first scanned on a 7-T MRI (Siemens, Erlangen, Germany) with a 32-channel phased-array coil developed in-house. Five controls were scanned twice in sessions scheduled a week apart, with repositioning based on localizers. 20 For OEF measurements, axial three-dimensional fast low-angle shot (FLASH) gradient-echo images were acquired with magnitude and phase. Scan parameters included repetition time=26 ms; echo time (TE)=6 to 6.4,10 ms; in-plane resolution=330 × 330 μm2; field of view=168 × 192 × 64 mm3; slice thickness=1 mm; flip angle=15°; bandwidth=130 Hz/pixel; generalized autocalibrating partially parallel acquisition acceleration=2. 21 These scan parameters were optimized for phase quantification in veins at 7 T and not for tissue magnitude contrast.
Sixty-four slices were acquired either as two slabs (six patients and one control) or one slab (remaining participants) to cover the supratentorial brain. Separate scans with flow compensation in all directions were collected for each TE, with total acquisition time ∼16 minutes. High-resolution anatomic scans for characterizing WM LV, deep GM LV, and cortical lesion counts (LCs) included two-dimensional FLASH-T2∗-weighted spoiled gradient-echo images (repetition time/TE=1,000/22 ms, two slabs, in-plane resolution=330 × 330 μm2, slice thickness=1 mm, 0.25 mm slice gap, and acquisition time per slab ∼7 minutes).
Within a week of the 7-T scan, all patients and 12 control subjects also underwent anatomic scanning at 3 T with a multiple-echo, magnetization-prepared rapid acquisition sequence 22 for tissue segmentation using FreeSurfer (http://surfer.nmr.mgh.harvard.edu/). 23 The structural scans were acquired with repetition time=2,530 ms, inflow time=1,200 ms, TE=1.7/3.6/5.4/7.3 ms, flip angle=7°, resolution=0.9 × 0.9 × 0.9 mm3, and bandwidth=651 Hz/pixel.
Data Processing for Oxygen Extraction Fraction Quantification
The FLASH phase images were high-pass filtered for each slice (96 × 96 pixel Hanning filter) to mitigate background field inhomogeneities and remove phase wraps while preserving the phase signal in narrow vessels of interest (1 to 4 pixel diameter). 24
For each subject, using the Desikan atlas from FreeSurfer, 25 OEF was quantified for 2 to 3 veins in each of the sensorimotor (precentral and postcentral regions), parietal, and prefrontal regions of the cortex and averaged to obtain a measure of mean cortical OEF. Candidate pial veins were only included in the analysis if they were parallel to the main magnetic field (B0), as viewed from a sagittal cut, and the diameter was <6 pixels (∼2 mm). The selected vessels were then modeled as long cylinders parallel to B0 to quantify the susceptibility difference between the vessel and parenchyma,7, 8, 10 as depicted in Figure 1. Candidate veins are illustrated on magnitude and phase images from two additional patients in Figure 2.
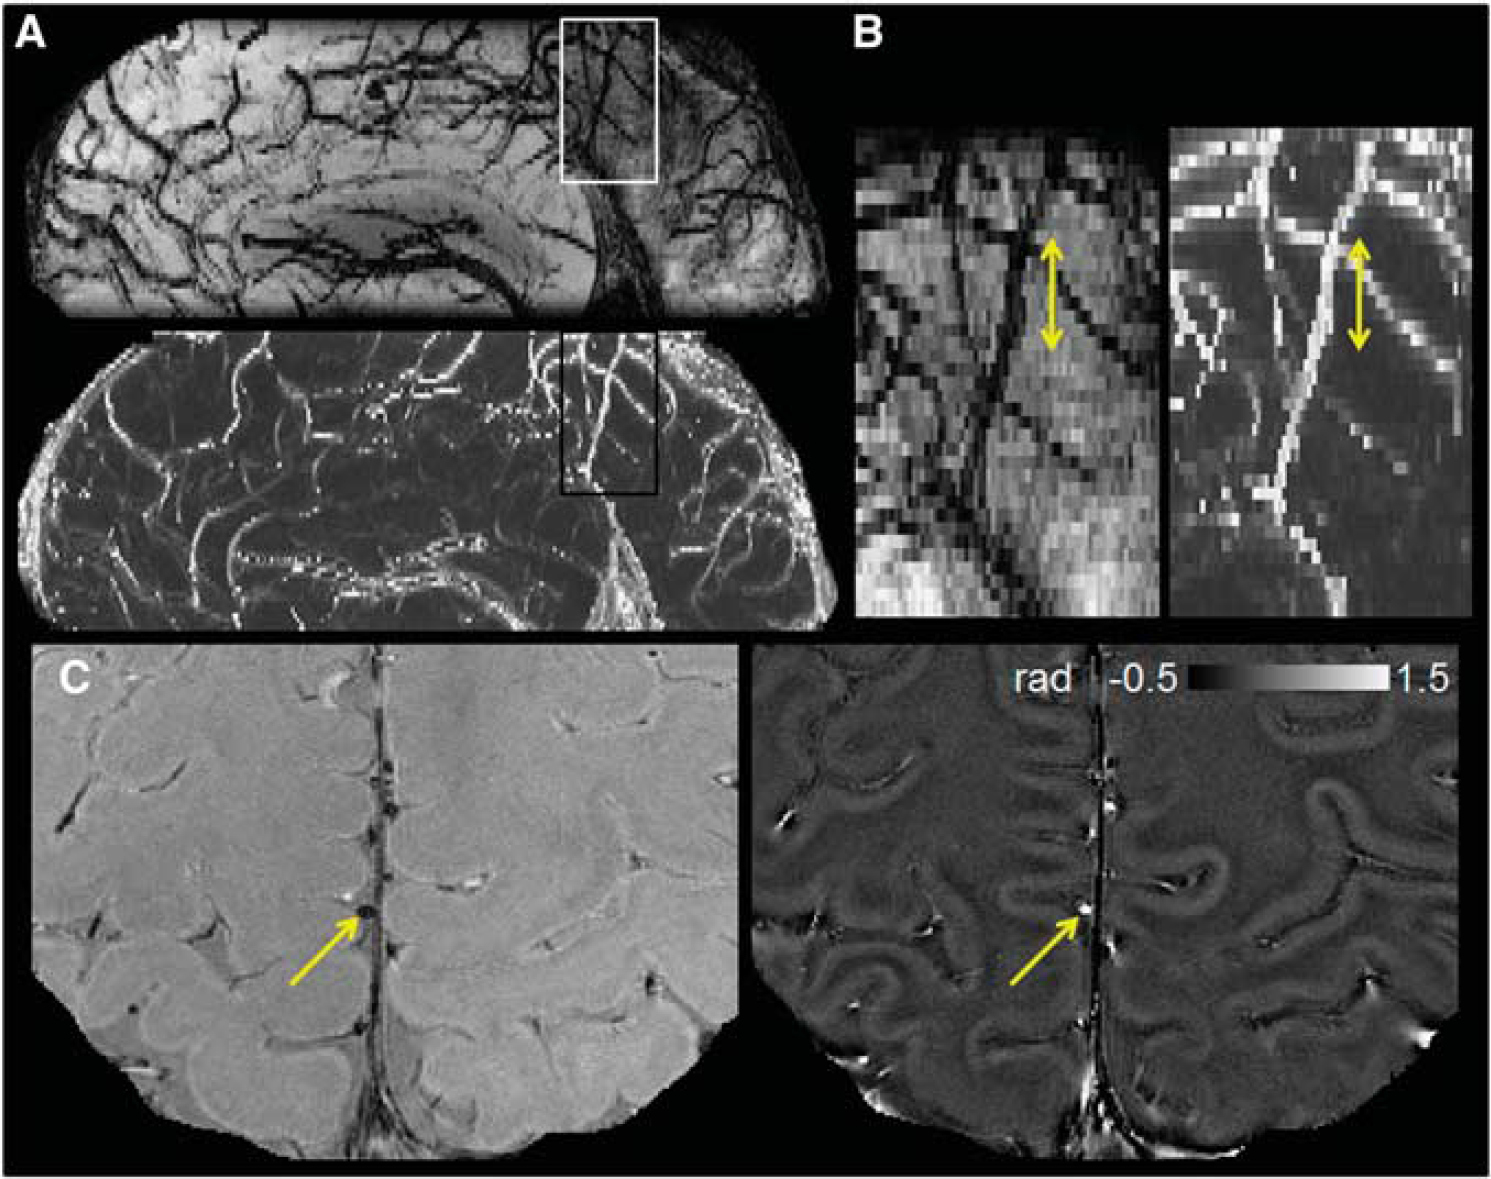
Orientation and geometry of representative cortical vessel segment in a patient with clinically isolated syndrome. (
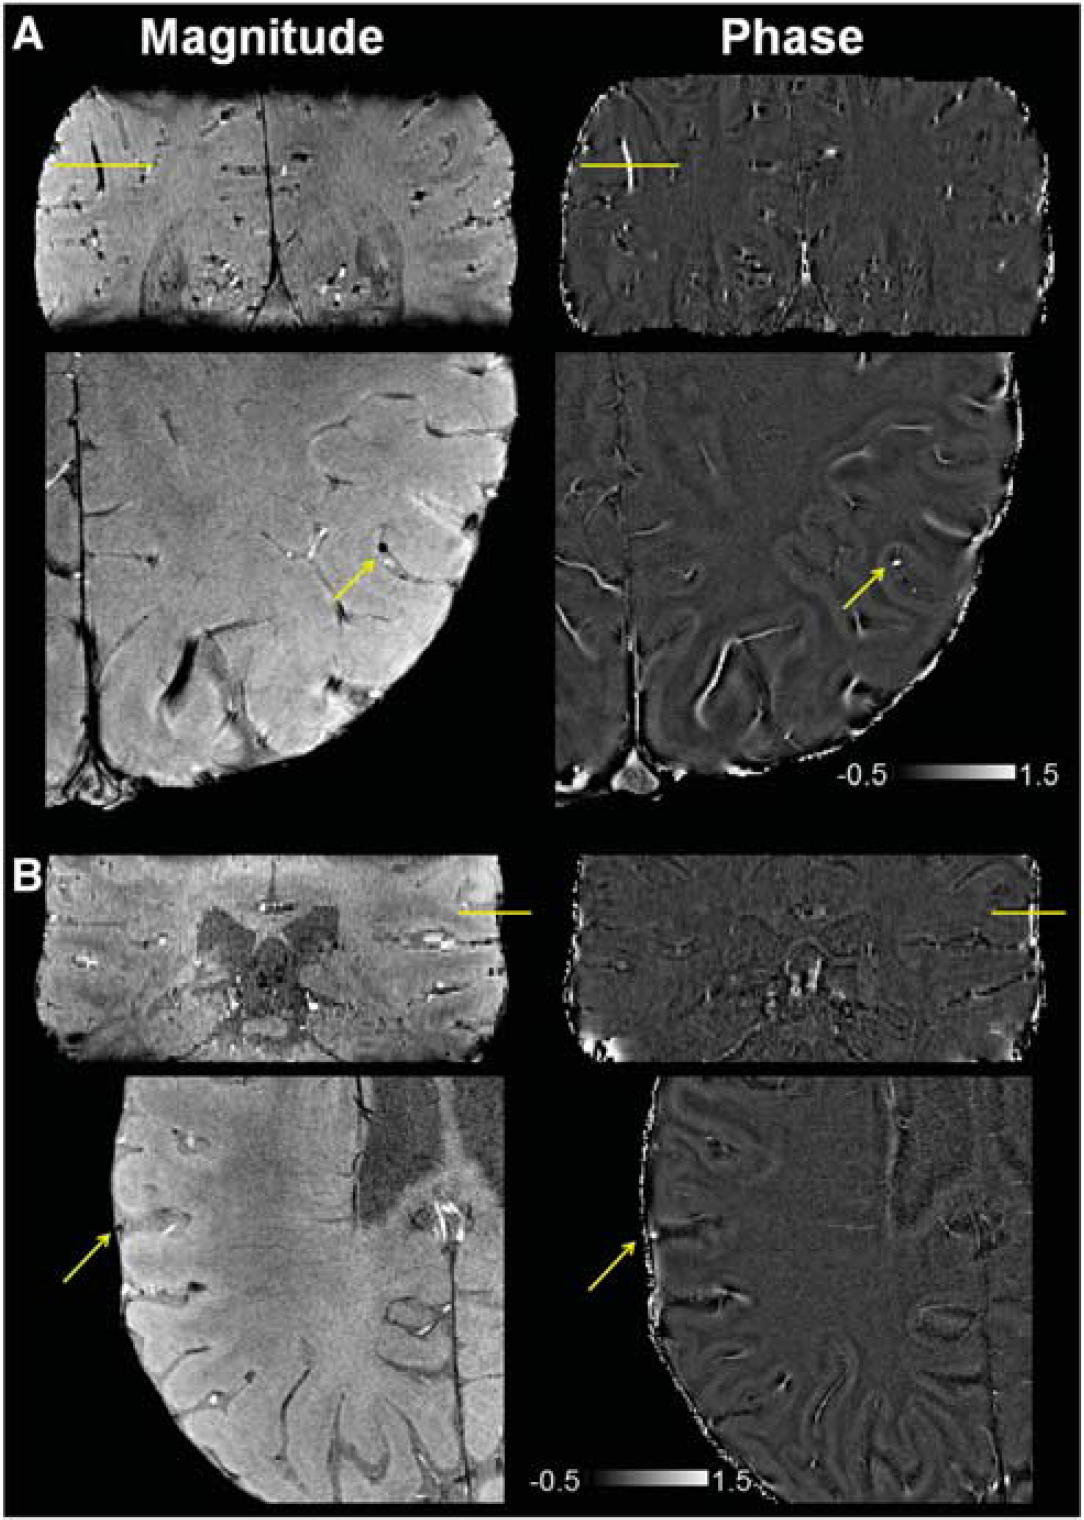
Magnitude and phase images (in radians) from gradient-echo acquisitions in two patients with (
After vessel identification, the field shift between the vein and tissue, ΔBvein-tissue, was calculated from the phase signal evolution across both echoes. Phase inside the vessel was averaged from 1 to 4 hyperintense pixels per slice across 2 to 3 slices intersecting the vein, while phase from tissue was estimated from a manually drawn region with volume of 19.5 to 26.1 mm3 adjacent to the vessel. Applying MR susceptometry, local OEF was determined for each parallel vein through the relationship ΔBvein-tissue=1/6·4π ΔχdoHct OEF·(3cos2θ−1)·B0; Hct, hematocrit.7, 10 Here, the vessel tilt angle θ was assumed to be 0, Δχdo=0.27 p.p.m. (cgs) was the susceptibility shift per unit Hct between fully deoxygenated and fully oxygenated blood. 26 Blood Hct was measured in 16 patients within 4 months of the MRI scan, and assumed to be 42% in all remaining subjects.
To evaluate the reproducibility of the OEF values, one observer (APF) identified vessels and measured OEF in five patients and five controls, then repeated the analysis on the images after 1 week. Independently, a second observer (STG) quantified OEF from the same dataset. Both observers were masked to subject demographic information, and used a graphical user interface developed in-house (MATLAB, Natick, MA, USA) to facilitate visualization of vessels and selection of appropriate voxels for OEF measurements. The first observer also measured OEF for the two scans acquired a week apart in five separate healthy volunteers. Candidate vessels were selected independently for all OEF readings and both observers were masked to subject diagnosis and patient characteristics.
Magnetic Resonance Imaging Characterization of Tissue Volumes, Lesion Volumes, and Lesion Counts
FreeSurfer cortical and subcortical segmentations were performed on the root-mean-square average across the echoes of the 3-T multiple-echo, magnetization-prepared rapid acquisition scan. To correct for topological defects in the segmentation caused by hypointense MS lesions, WM and leukocortical lesions were filled on the WM mask in FreeSurfer. Reconstructed surfaces and subcortical segmentations 27 were subsequently checked in each subject to ensure accuracy before extraction of cortical thickness and thalamic volumes for each subject.
Two separate observers, masked to subject demographic and clinical characteristics and with over 10 years of experience in radiology, quantified LCs from focal cortical hyperintensities on two-dimensional-FLASH-T2∗ magnitude images in patients. 28 Cortical lesions were categorized as type I (leukocortical) extending across both WM and GM; type II (intracortical) within the cortical tissue; or type III/IV (subpial) extending throughout the cortical width without entering the WM. 29 Cortical LCs only included lesions in agreement between the two observers, and were only assessed in 21 patients because of slight motion artifacts. Deep GM and WM hyperintense lesions were segmented from two-dimensional-FLASH-T2∗ magnitude images with a dedicated software (Alice, Hayden Image Processing Solutions, Boulder, CO, USA) using a local threshold contouring technique to quantify LVs. 28
Neuropsychological Testing Methods
Within a week of the 7-T session, a licensed neuropsychologist (NKM, with over 20 years of experience) administered neuropsychological testing to all patients, including the Symbol Digit Modalities Test; Controlled Oral Word Association Test; Trail Making Test (Trails A and B); California Verbal Learning Test-II, Brief Visuospatial Memory Test—Revised; and Wisconsin Card Sorting Test–64 Card Version. The Wechsler Test of Adult Reading was administered to assess premorbid intelligence. Raw test scores were converted to Z-scores based on age- (and when available, education- and gender-) based norms, referenced in Supplementary Appendix 1.
To assess cognitive domains commonly affected by MS, for each patient we calculated a score for information processing speed (averaging Trail A, Symbol Digit Modalities Test, and Controlled Oral Word Association Test Z-scores), executive function (averaging Wisconsin Card Sorting Test–64 Card Version (total categories), Wisconsin Card Sorting Test–64 Card Version (total preservative responses), and Trails B Z-scores), and learning-recall ability (averaging Brief Visuospatial Memory Test—Revised (total learning), Brief Visuospatial Memory Test—Revised (delayed recall), California Verbal Learning Test-II (Total Recall Score], and California Verbal Learning Test-II (long delay free recall) Z-scores). A global cognitive score was computed for each patient by averaging scores from the three cognitive domains.
Statistical Analysis
Statistical analysis was performed using the Statistical Analysis System software (SAS, Cary, NC, USA). Reproducibility of mean cortical OEF was assessed with coefficients of variation (COV=s.d./mean) between each couple of OEF readings for intraobserver and interobserver comparisons; or between each couple of acquisitions for scan—rescan comparisons. Differences in OEF across regions and between patients and controls were assessed using a repeated measures analysis of variance. This comparison was followed by Mann—Whitney tests for each cortical area, with correction for multiple comparisons by controlling for false discovery rate. Across all patients, associations between mean cortical OEF and MRI indices of cortical thickness, thalamic volume, and structural tissue damage (LCs and LVs) were explored using Spearman's rho correlation tests. Similar correlations were computed for mean cortical OEF with patient clinical characteristics and with cognitive performance among patients.
Results
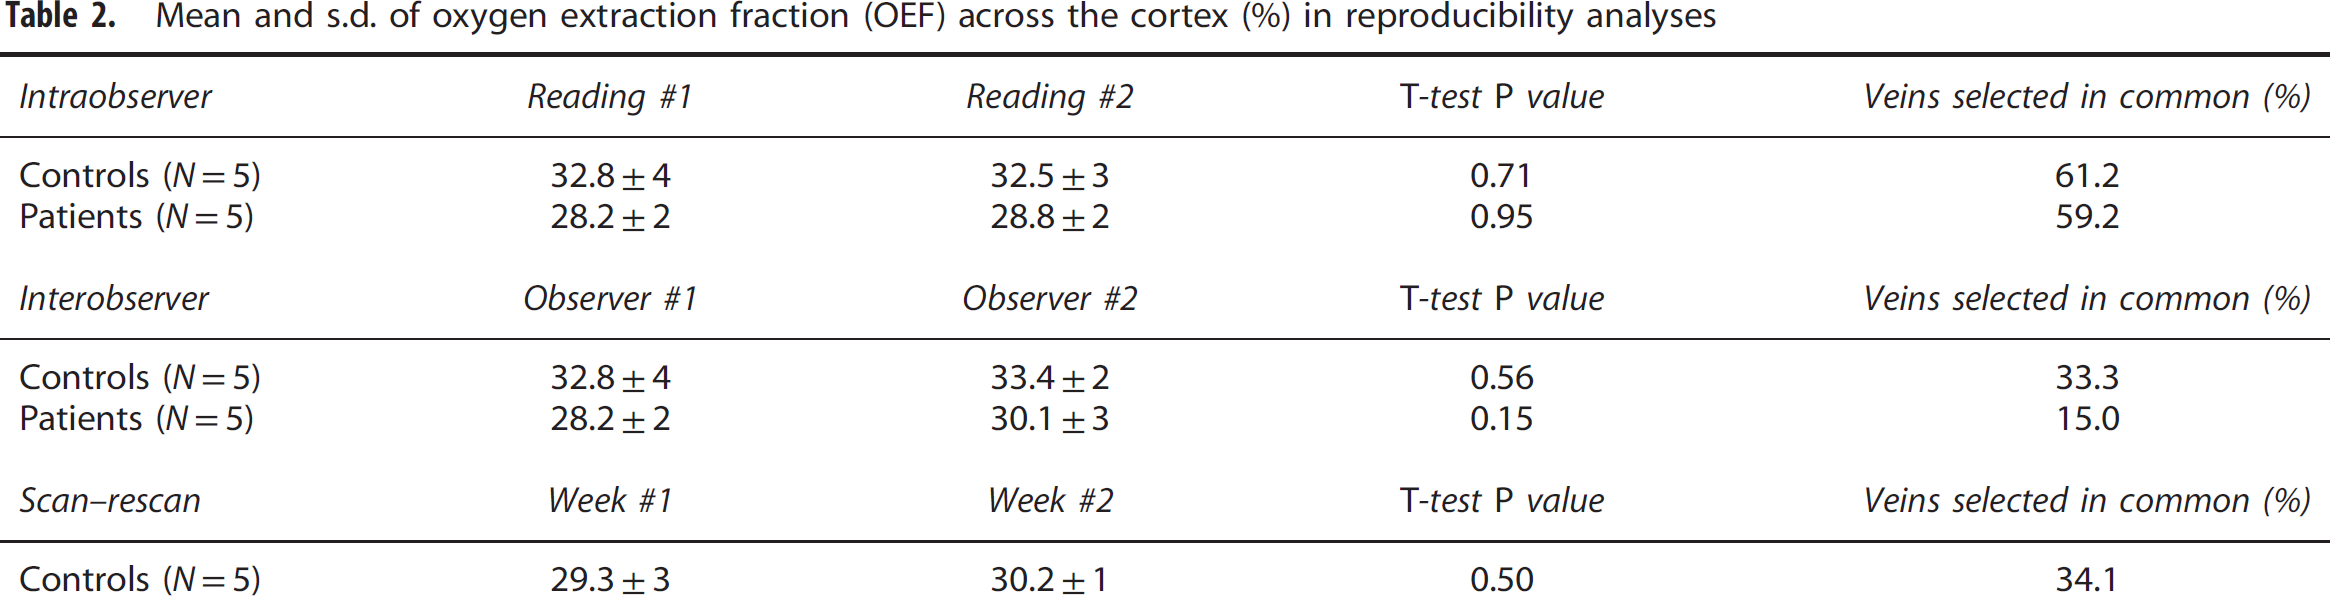
The mean and s.d. of Hct values measured in patients was 42.0%±3%. Quantitative results from the reproducibility analysis of mean cortical OEF are presented in Table 2. No significant differences in cortical OEF averaged across subjects were found between readings made by the same observer, between different observers, or between scan sessions a week apart. The intraobserver reproducibility of mean OEF was excellent, with COV=2.1%; interobserver and scan—rescan analyses revealed similar low COV's of 5.2% and 5.9%, respectively. Not surprisingly, the overall percentage of vessels independently reidentified was higher (60.2%) for intraobserver comparisons, relative to interobserver (25.9%), and scan—rescan (34.1%) comparisons. To visualize the variability in cortical OEF, Bland—Altman plots of intraobserver and interobserver OEF reproducibility for 10 subjects are depicted in Figures 3A and 3B. Scan—rescan OEF values for five separate healthy controls are plotted with confidence intervals computed from the mean s.d. across the group (Figure 3C).
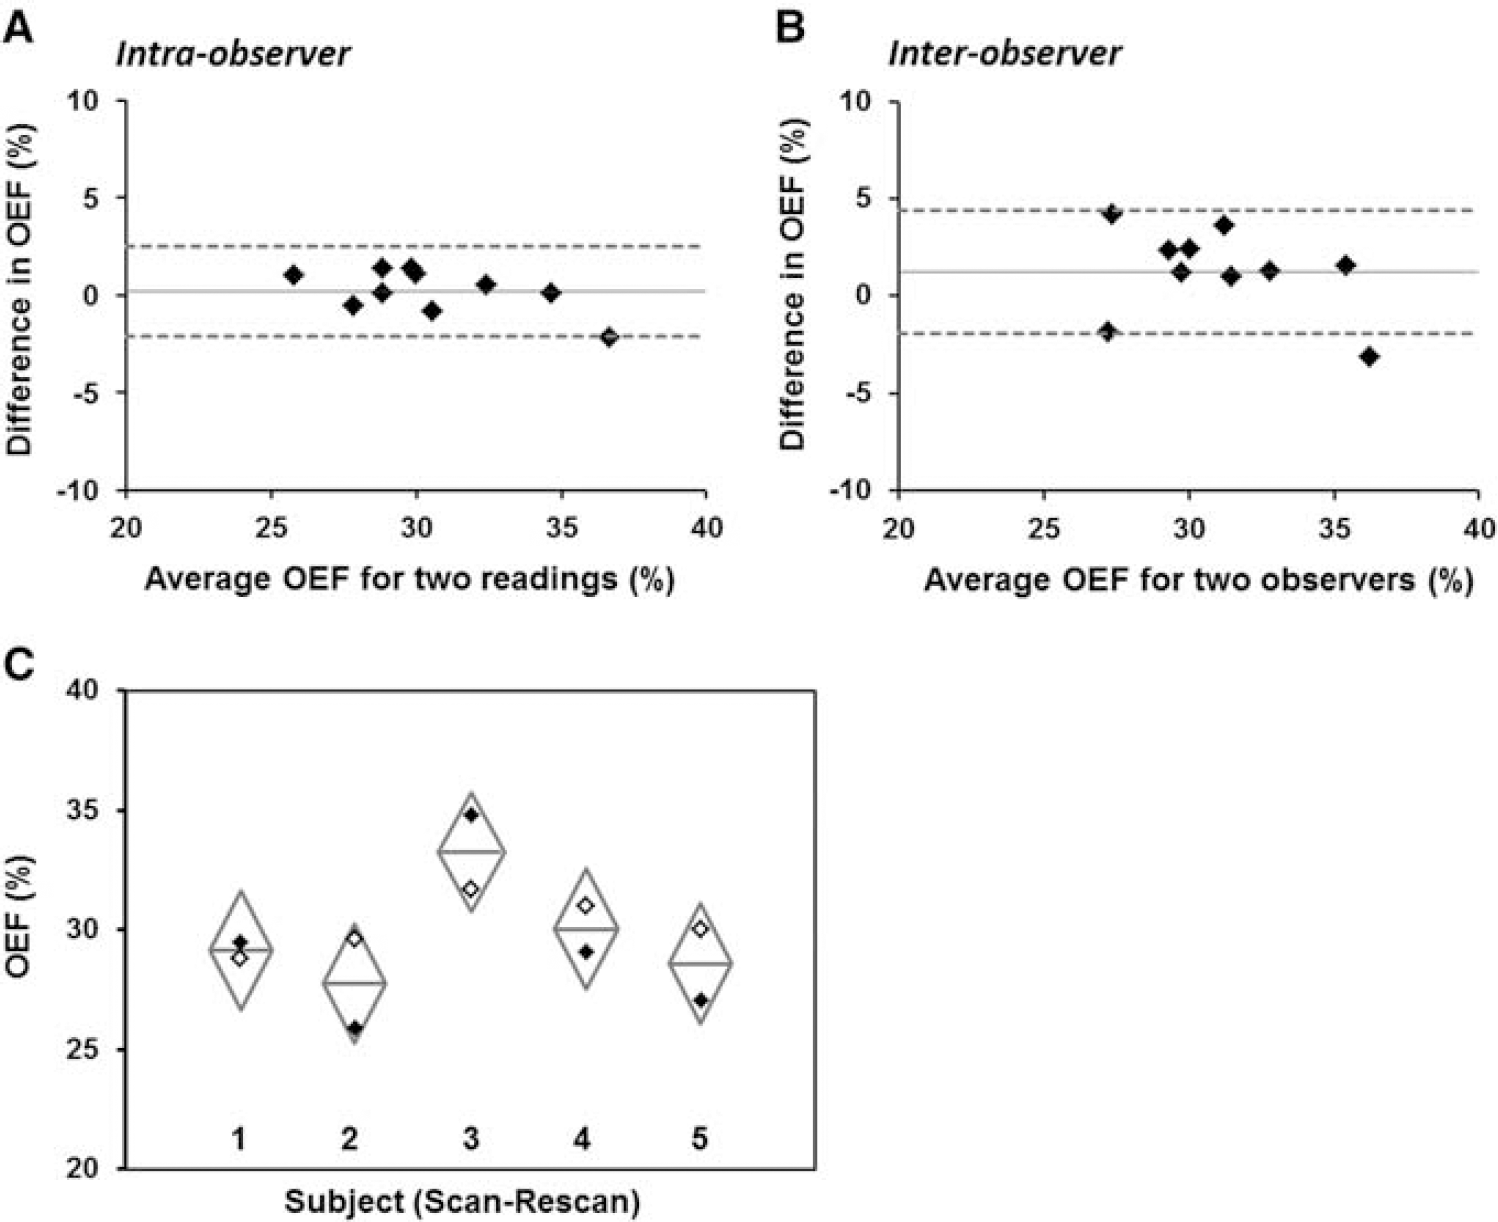
Bland—Altman plots depicting (
Mean and s.d. of oxygen extraction fraction (OEF) across the cortex (%) in reproducibility analyses
Mean cortical OEF was 31.5%±3% across all controls (N=14), and 28.1%±3% across all patients (N=23). From the repeated measures analysis of variance, oxygen extraction was found to be lower in all patients compared with controls (P=0.0025), but there was no difference in OEF across the cortical regions (P=0.98). Boxplots of OEF are shown separately in each cortical area and averaged across the cortex in Figure 4. The Mann—Whitney tests revealed decreased OEF in the sensorimotor (corrected P=0.02), parietal (corrected P=0.03), and prefrontal cortices (corrected P=0.01).
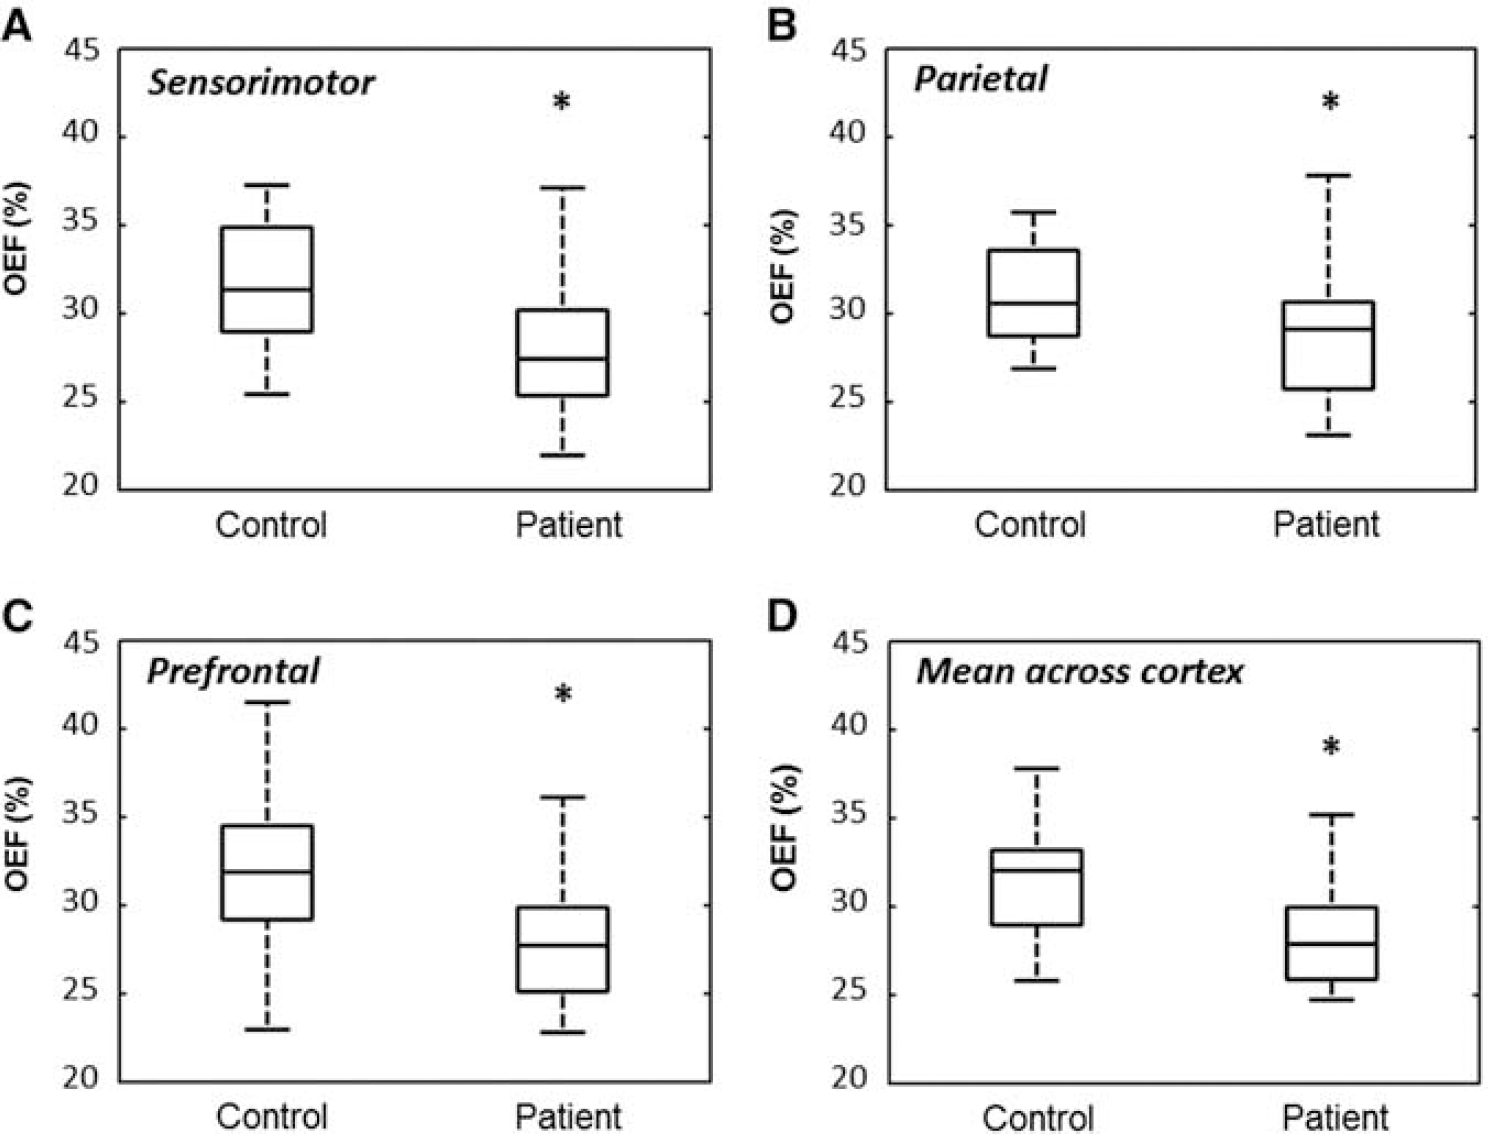
Box-plot representation of OEF in 14 controls and 23 patients with MS in the (
Magnetic resonance imaging measures of cortical thickness, thalamic volume, and structural tissue damage across patients are presented in Table 3. A weak relationship was detected between mean cortical OEF and cortical thickness (ρ=0.41, uncorrected P=0.05). Because an association was found between OEF and cortical thickness, the analysis of variance was repeated with cortical thickness as a nuisance factor. Oxygen extraction remained significantly lower in patients compared with controls (P=0.03) after adjusting for cortical thickness. No relationship was detected between OEF and MRI measures of structural tissue damage, including LVs and LCs.
Magnetic resonance imaging characteristics of 23 patients with multiple sclerosis
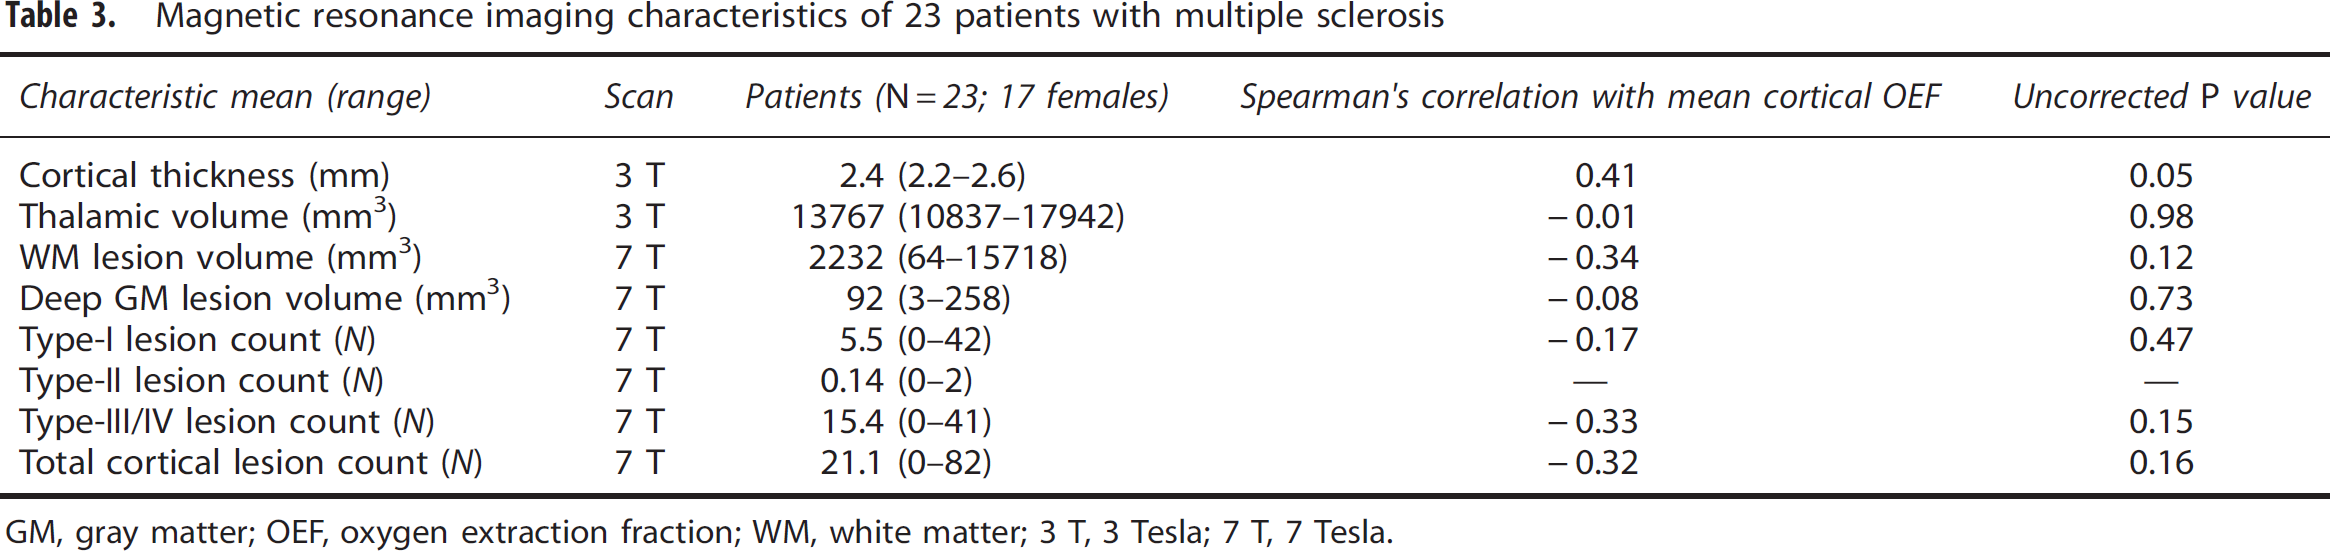
GM, gray matter; OEF, oxygen extraction fraction; WM, white matter; 3 T, 3 Tesla; 7 T, 7 Tesla.
However, correlations were observed between mean cortical OEF and patient disease duration (ρ=−0.48, uncorrected P=0.02) and with EDSS score (ρ=−0.42, uncorrected P=0.04). Across all patients, performance on cognitive evaluations revealed relatively minor cognitive impairment with the lowest mean normalized score of −0.47 in executive function (Table 1). The strongest correlation detected was between mean cortical OEF and information processing speed (ρ=0.56, P=0.01), which remained significant even after adjusting for premorbid intelligence (Wechsler Test of Adult Reading) in patients (ρ=0.50, P=0.02; Figure 5).
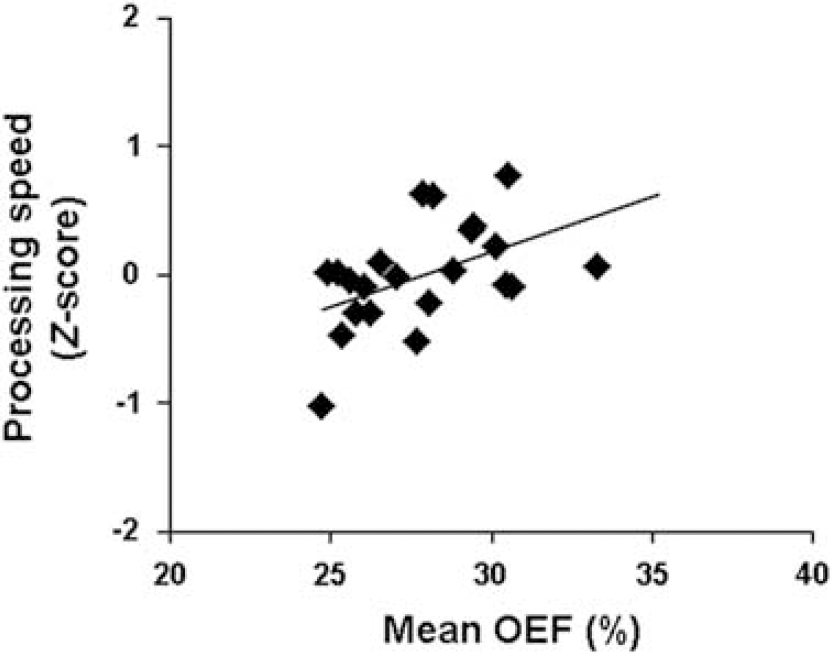
Scatter plot of the correlation between mean cortical OEF with a global measure of information processing speed (ρ=0.50, P=0.01). This correlation remained significant even after adjusting for premorbid intelligence of patients (P=0.02).
Discussion
This study represents the first application of a phase-based MRI method to quantify OEF in the cortex of patients with MS. This approach exploited the paramagnetic effect of deoxyhemoglobin on high-resolution phase images at 7 T to estimate absolute cortical OEF in pial veins. We observed a 3.4% absolute reduction of mean cortical OEF in a heterogeneous cohort including patients with clinically isolated syndrome, RRMS, and secondary-progressive MS relative to healthy controls. This reduction is consistent with 5.7% decrease of global OEF in patients with RRMS compared with controls, as measured by T2-relaxation-under-spin-tagging MRI in the sagittal sinus. 17
Ultra-high field MRI (7 T and above) allows for a twofold to threefold increase in signal-to-noise ratio over 3 T MRI, 11 which enables improved spatial resolution of images. Through use of 7-T phase images, we achieved voxel volume of 0.11 mm3 in this study, compared with 0.50 mm3 across the brain 10 and 0.48 mm3 in the neck 30 from previous 3 T investigations. As such, we were able to assess OEF in individual pial veins of smaller size, and monitor regional oxygenation in patients from the sensorimotor, parietal, and prefrontal areas. There was no difference in oxygenation between the regions across subjects, which suggests that OEF reduction in MS presents diffusely throughout the cortex. This finding is consistent with positron emission tomography studies that found no regional distribution to metabolic abnormalities in MS, and posited that cerebral metabolic hypoactivity in the disease may reflect autoimmune changes in the brain independent of focal, visible lesions.5, 13 These diffuse OEF changes may also explain the excellent intraobserver (COV=2.1%), interobserver (COV=5.2%), and scan—rescan (COV=5.9%) agreement of mean cortical OEF values in controls and patients, even though vessels were selected independently for all reproducibility analyses.
Physiologic Interpretation of Findings
In our work, oxygenation measurements are interpreted to reflect cortical function. Although the exact tissue origin of venous blood for selected vessels are unknown and may represent both GM and WM contributions, we believe that OEF measurements in this study primarily reflect cortical function. Physiologically, the flow in GM is nearly three times that in WM, as measured by 15O positron emission tomography imaging (ratio=2.9) 31 and dynamic MRI with contrast agent (ratio=2.7). 32 This flow difference suggests that OEF values in venous blood are weighted more heavily by GM function. Furthermore, many of the vessels chosen for analysis in this work are located on the pial surface of the brain, which drain superficially from cortical tissue; 33 whereas the WM and deep GM structures drain medially into the internal cerebral veins and straight sinus. 34
This study found only a weak relationship between oxygenation and cortical thickness, but not with other MRI metrics of structural tissue damage. However, the finding of a negative correlation between OEF and EDSS is consistent with the positive correlation between oxygen saturation and EDSS previously identified by Ge et al. 17 Both studies suggest that patients with reduced oxygen extraction in the cortex tend to have higher clinical disability. In this work, we did not assess spinal cord damage, and previous studies have shown that higher EDSS values can also be driven by spinal cord pathologic assessment. In our cohort, however, only one patient presented with EDSS score of 8, and two patients presented with EDSS of 6. All remaining patients exhibited EDSS score of 4 or less. Because few patients had relatively high EDSS scores, spinal cord pathologic assessment is expected to have minimal influence on the correlations between EDSS and our cortical OEF measurements. In addition, pathologic data 35 and in vivo data36, 37 showed that cortical pathologic assessment, i.e., lesions and diffuse cortical damage, is also linked to higher EDSS. Cortical pathologic assessment, potentially including OEF changes, thus contributes to neurologic disability in MS in addition to spinal cord damage.
Among the clinical measures, however, our OEF measurements were most strongly correlated with cognitive performance in patients, particularly information processing speed. This finding is not surprising as cognitive changes appear early in the disease, even at the first demyelinating event, and our MS population includes early patients with relatively few neuropsychological deficits. Because our OEF estimates correlated with clinical outcomes but not with MRI structural measures, oxygenation may be sensitive to pathologic processes different from those detected by anatomic MRI scans.
There are also demographic and methodological reasons that may explain the lack of correlation between OEF and structural MRI measures. We recruited a relatively small cohort of patients, half of whom are in early stages of disease. Accumulation of macroscopic tissue damage is less likely in early stages, such that a direct relationship between structural damage (LV and LC) and OEF changes may be difficult to detect. Furthermore, our LC analyses were based only on focal cortical lesions and did not consider subpial demyelination, which tends to involve larger cortical surfaces. 38 Surface-based techniques for assessing diffuse cortical changes 36 may provide more sensitive measures to investigate the relationship between cortical lesions and oxygen dysfunction in MS.
The results of our study are meaningful in light of recent interest in energy metabolism failure in the brain as a biomarker of MS disease progression and disability.39, 40 Pathologic examinations have revealed increased neuronal energy demand in response to demyelination in MS.41, 42 Concurrently, impaired mitochondrial function43, 44 makes it difficult to meet this increased metabolic demand. This pathophysiology, in conjunction with oxidative damage caused by inflammation, 45 may contribute to energy failure and ultimately cell death in the cortex. It is currently unknown whether OEF reductions are independent of cortical lesion growth, or whether one process drives the other. To address this question in future work, we can combine advanced quantitative susceptibility mapping methods with high-resolution 7-T phase imaging to delineate between OEF in veins draining cortical lesions and those draining normal-appearing tissue.
We observed a trend of progressive decrease in OEF with MS disease type in our small cohort. Mean cortical OEF was 29.8%±3% in patients with clinically isolated syndrome, 28.0%±3% in patients with RRMS, and 26.5%±2% in patients with secondary-progressive MS. However, the differences between patient subgroups were not significant via repeated measures analysis of variance because of the small sample size. Longitudinal evaluations of OEF are needed in larger patient cohorts to better understand the relationship between metabolic changes and progressive disability in MS. Another limitation to this study is the lack of blood flow measurements, which can be coupled with OEF to directly quantify the cerebral metabolic rate of oxygen. Previous studies using phase-contrast and dynamic susceptibility contrast MRI have found either unchanged or reduced brain perfusion in MS,17, 46 indicating overall decrease in cerebral metabolic rate of oxygen. Thus, OEF changes describe a key component of hypometabolism in MS that is specific to neurons rather than glial cells, 47 and may offer an independent biomarker to understand the metabolic underpinnings of cognitive impairment in patients.
Limitations of the Method
In this study, OEF was measured directly on MRI phase images through a simple cylinder model of the vessel geometry. However, this model-based approach is limited to veins parallel to the main field because phase values are inherently orientation-dependent. Nonzero vessel tilt angles have been shown to create up to ∼6% absolute OEF underestimation for tilt angles <15°, 10 and up to 40% error for veins oriented at or near the magic angle. Although changes in vessel density and morphology have been showed in MS,16, 48 there is no evidence for stereotyped changes in vein orientation because of disease, at least on the scale of pial vessels identified in this work. For this reason, vessel tilt may contribute to increased OEF measurement variance, but in a similar manner for patient and control subject groups. As an alternative approach, more sophisticated quantitative susceptibility mapping techniques have been proposed to reconstruct the underlying three-dimensional susceptibility distribution from phase images. Quantitative susceptibility mapping could enable mapping of OEF along veins of arbitrary orientation and geometry in the brain vasculature,49, 50 and mitigate measurement error because of vessel tilt. More work, however, is necessary to improve the robustness of quantitative susceptibility mapping methods, especially in the presence of nonlocal streaking artifacts that arise from solving the ill-posed dipole inversion problem.
The accuracy of phase-based OEF measurements would also benefit from improved techniques to remove background field. This study applies a Hanning high-pass filter (width of 96 × 96 pixels) to remove the global phase, because the approach is straightforward to implement and is consistent with processing steps in susceptibility-weighted imaging. However, this filter could lead to slight underestimation of relevant phase shifts and thus of OEF, particularly in larger veins with few high-frequency anatomic features. We note that this measurement error could be exacerbated by additional underestimation because of partial-volume effects that may persist between vessels and tissue. To address these limitations, we recommend use of more sophisticated field removal algorithms based on the harmonic property of background phase,51, 52 as these methods are relatively less sensitive to the local structure of the object. Accurate global field removal is also critical to OEF imaging with quantitative susceptibility mapping reconstruction, which requires nonlocal phase information to recover the underlying susceptibility at each voxel.
Accurate measurement of blood Hct is also critical to calibrate quantitative OEF from susceptibility. Our study measured Hct in patients within 4 months of the MRI acquisition, but Hct may to vary from day to day, depending on hydration status and other physiologic or pathologic conditions. For this reason, we excluded from the study any subject with a pathologic condition that may affect Hct (e.g., anemia, liver disease, pulmonary and cardiovascular disease). For individuals in which Hct was not measured, we assumed a value of 0.42 to be consistent with previous literature, 17 and because it represents the approximate average Hct value in healthy adult individuals. We note, however, that the lack of consistent Hct information may have contributed increased variance to the OEF estimates, with slight OEF overestimation for low Hct and slight OEF underestimation for high Hct. For this reason, we excluded subjects with anemia or other conditions able to affect Hct, such that the assumed value of 0.42 is reasonable. In future work, blood Hct could be measured as part of the MRI scan protocol in each subject to achieve more accurate OEF measurements.
Despite the gains in signal-to-noise ratio from implementing this method at 7 T, ultra-high field imaging also poses unique challenges because of more severe main field and excitation inhomogeneities, as well as decreased T2∗ relaxation rates. 53 These phenomena lead to signal loss and difficult phase unwrapping problems, especially in cortical areas near the air—tissue susceptibility interfaces. Such artifacts cannot be easily addressed because the flow-compensation gradients, necessary for accurate phase estimation in venous blood, constrain the minimum TE and TE spacing of the acquisition. At these TEs, the signal loss prevented OEF measurements for veins located in the orbitofrontal and temporal lobes in this study. Alternative acquisitions with z-shim compensation can tailor excitation pulses to mitigate through-plane signal loss caused by bulk susceptibility shifts and enable oxygenation assessment in regions with challenging susceptibility artifacts. 54
Conclusion
Although our findings need to be reproduced in a larger patient sample, this preliminary study suggests that cortical OEF from susceptibility MRI is a reliable metabolic biomarker. We provide evidence that OEF reflects MS disease disability and information processing speed, and may be sensitive to different processes underlying disease progression than typically assessed via MRI metrics of structural damage. Metabolic markers such as OEF could serve as clinical outcomes for trials of patients in early stages of disease to identify appropriate therapies even before disability arises. Evaluation of metabolic changes with high-resolution MRI may serve to monitor the efficacy of therapies such as tissue-protective treatments in MS.
Footnotes
ACKNOWLEDGMENTS
The authors thank Dr Julien Cohen-Adad for technical advice, Drs Lawrence Wald and Boris Keil for valuable help with the 7-T coil, Dr Mark Vangel for discussion on statistical analyses, and Dr Nikos Evangelou for insights on data interpretation.
APF receives research support from the National Science Foundation Graduate Research Fellowship, the Advanced Multimodal Neuroimaging Training Program, and the NIH (1R01-EB007942).
STG has nothing to disclose.
RPK is a scientific consultant for Biogen Idec, Teva, and Genzyme; serves as section editor of Neurology MedReviews; receives research support from Biogen Idec; receives partial salary support from Harvard Medical School; and receives support for his fellowship training program from the NMSS and support for research activities with the Accelerated Cure Project.
NKM has nothing to disclose.
ASN received fellowship training and financial support through the NMSS (FP 1770A1) and Harvard Medical School SCSP (NH 1 KL2 RR025757-0).
TB served as a consultant for Siemens Medical Solutions and Bayer.
ET has nothing to disclose.
BRR has received honoraria for nonindustry sponsored activities and receives research support from the NIH (1R90-DA023427-01 (PI), 5R01-EB002066-18 (PI), 5P41-RR14075 08 (PI), 1U24-RR021382 04 (PI), T90-DA022759-01 (PI), P01-AT002048-05 (PI), and 1UL1-RR02578-01 (PI)). Dr Rosen is also affiliated with the Department of Meridian & Acupuncture, Collaborating Center for Traditional Medicine, East-West Medical Research Institute and School of Korean Medicine, Kyung Hee University, 26 Kyungheedae-ro, Dondaemun-gu, Seoul 130–701, Republic of Korea.
EA receives research support from Siemens Healthcare, the Siemens-MIT Alliance, and the NIH (1R01-EB007942 (PI) and 1R01-EB006847).
CM served as a consultant for Biogen and receives research support from the NIH (2PO1-NS35611-11A1 (Investigator) and NMSS 4281-RG-A1 (PI)).
References
Supplementary Material
Please find the following supplemental material available below.
For Open Access articles published under a Creative Commons License, all supplemental material carries the same license as the article it is associated with.
For non-Open Access articles published, all supplemental material carries a non-exclusive license, and permission requests for re-use of supplemental material or any part of supplemental material shall be sent directly to the copyright owner as specified in the copyright notice associated with the article.