
Abstract
A method for the detection and tracking of propagated fluorescence transients as indicators of depolarizations in focal cerebral ischemia is described, together with initial results indicating the potential of the method. The cortex of the right cerebral hemisphere was exposed for nonrecovery experiments in five cats anesthetized with chloralose and subjected to permanent middle cerebral artery (MCA) occlusion. Fluorescence with 370-nm excitation (attributed to the degree of reduction of the NAD/H couple) was imaged with an intensified charge-coupled device camera and digitized. Sequences of images representing changes in gray level from a baseline image were examined, together with the time courses of mean gray levels in specified regions of interest. Spontaneous increases in fluorescence occurred, starting most commonly at the edge of areas of core ischemia; they propagated usually throughout the periinfarct zone and resolved to varying degrees and at varying rates, depending on proximity of the locus to the MCA input. When a fluorescence transient reached the anterior cerebral artery territory, its initial polarity reversed from an increase to a decrease in fluorescence. An initial increase in fluorescence in response to the arrival of a transient may characterize cortex that will become infarcted, if pathophysiological changes in the periinfarct zone are allowed to evolve naturally.
The role of transient focal depolarizations 1 (TFDs) in the evolution of ischemic neuronal change in the boundary zones associated with focal cerebral cortical ischemia is assuming progressively greater importance. Evidence that TFDs are pathogenic has steadily accumulated since this concept was first (to our knowledge) suggested (Strong et al., 1983a) and is referred to in Discussion.
Studies of TFDs in experimental occlusion of the middle cerebral artery (MCAO) have been based until very recently on the use of electrodes at single or dual sites, and attempts have been made to construct a topographical and time model of TFD origin and propagation based on this technology (Nedergaard and Hansen, 1993). A magnetic resonance method for detection of propagated changes in apparent diffusion properties of water in the cerebral cortex of rats subjected to MCAO has recently appeared (Hasegawa et al., 1995). However, neither of these methods lends itself well to detailed analysis of the frequency and sites of origin and of the variables determining the rate and ultimate extent of propagation of TFDs in focal cortical ischemia.
A method is needed that views the maximum possible area of the ischemic boundary zone, with adequate temporal and spatial resolutions, and whose results can be readily compared with related variables such as cerebral blood flow. We have previously described cortical surface fluorescence imaging methods that allow quantitative mapping of cerebral blood flow (Kirkpatrick et al., 1994), and we have now extended this system to permit detection and tracking of TFDs, using the redox potential of the NADH couple (as indicated by the 450-nm fluorescence of NADH) as a marker of TFDs. In this article we describe the method and report and illustrate initial results from MCAO in cats, which suggest that the technique we have adopted has substantial potential. The material has been presented elsewhere in abstract form and orally (Strong et al., 1995).
METHODS
Animal preparation
Nonrecovery experiments were carried out, with home office approval, in five adult cats in the weight range 3.5–5.0 kg. Anesthesia was induced with 4% halothane in oxygen. Intravenous and arterial catheters were inserted, the trachea intubated, and anesthesia then maintained with intravenous α-chloralose 60 mg/kg given over 2 min. This was supplemented with further smaller doses if mean arterial pressure rose above 140 mm Hg and on three occasions briefly with 0.75% halothane during the surgical preparation. Halothane was not used during imaging or during the preceding 30 min. Following neuromuscular blockade with atracurium besylate, ventilation with 60% N2O/40% O2 was commenced, with the rate adjusted to achieve a PaCO2 of 30 ± 3 mm Hg. The MCA was exposed by the transorbital route and occluded by diathermy and surgical division after baseline measurements of fluorescence. A right convexity craniectomy measuring some 3 × 2 cm was carried out and the dura excised, extending laterally from the midline, exposing the marginal and suprasylvian gyri (MG,SG) and the outer part of the ectosylvian gyrus (EG). The scalp was hitched to a head crown, and the surface of the brain was covered with warm (37.5°C) mineral oil to a depth of ∼0.5 cm. Illumination and imaging were carried out through the pool; there was no loss of definition as a result, and the oil used does not autofluoresce. In later experiments the brain surface temperature was monitored by thermistor and maintained between 37 and 38°C by direct electric lamp illumination between imaging sequences. The animal's core temperature was monitored using a rectal digital thermometer, and normothermia maintained with a homeothermic blanket control unit (Harvard).
Image acquisition
The experimental system closely resembled that described previously (Kirkpatrick et al., 1994) and comprises in summary (a) fluorescence excitation (75-W xenon source) at 370 nm delivered via a liquid light guide and oblique epiillumination, (b) intensified charge-coupled device camera (Prostab, Maidenhead, U.K.), and (c) a frame-grabbing system (Synoptics Ltd., Cambridge, U.K.) within a personal computer host, programmed with appropriate image acquisition sequences. Digitization of images (5122 pixels) was into 8 bits at frame speed. A single pixel corresponded to an area of cortex of 34 × 34 μm2. To generate each stored image, 16 consecutive frames were integrated, giving 12 significant bits, and 4 nonsignificant bits added (the software allows the saving of either 8- or 16-bit but not 12-bit images). Sequences of between 20 and 130 images were acquired at a rate of 7.25 images/min, before and after MCAO. A fresh baseline image was used for each sequence; thus, in any sequence, pre- or post-MCAO, only changes in fluorescence occurring during that sequence were routinely measured or displayed.
Image processing
The software allows (a) graphical display of a sequence of mean gray levels (g.l.) in a region of interest (ROI) against time and (b) display of the current image as a difference from a baseline image. Differences (16-bit) were scaled to 8-bit images, i.e., g.l. 0–255. The full range of a rainbow pseudocolor lookup table was applied to the g.l. range 111–145 in the 8-bit images, so that a featureless green image of intermediate level (128, 8-bit scale) would represent no change in fluorescence from baseline at any site. Calculations of mean g.l. in ROIs and their time courses were made using 16 bits. ROIs were selected in relatively avascular areas of cortex and were made small (∼0.7 × 0.7 mm) so as to minimize averaging of a propagated transient change in fluorescence. Extensive use was made of a software routine to view retrospectively sequences of difference images (1.3 images/s); this greatly aided exclusion of potential artifacts. 2
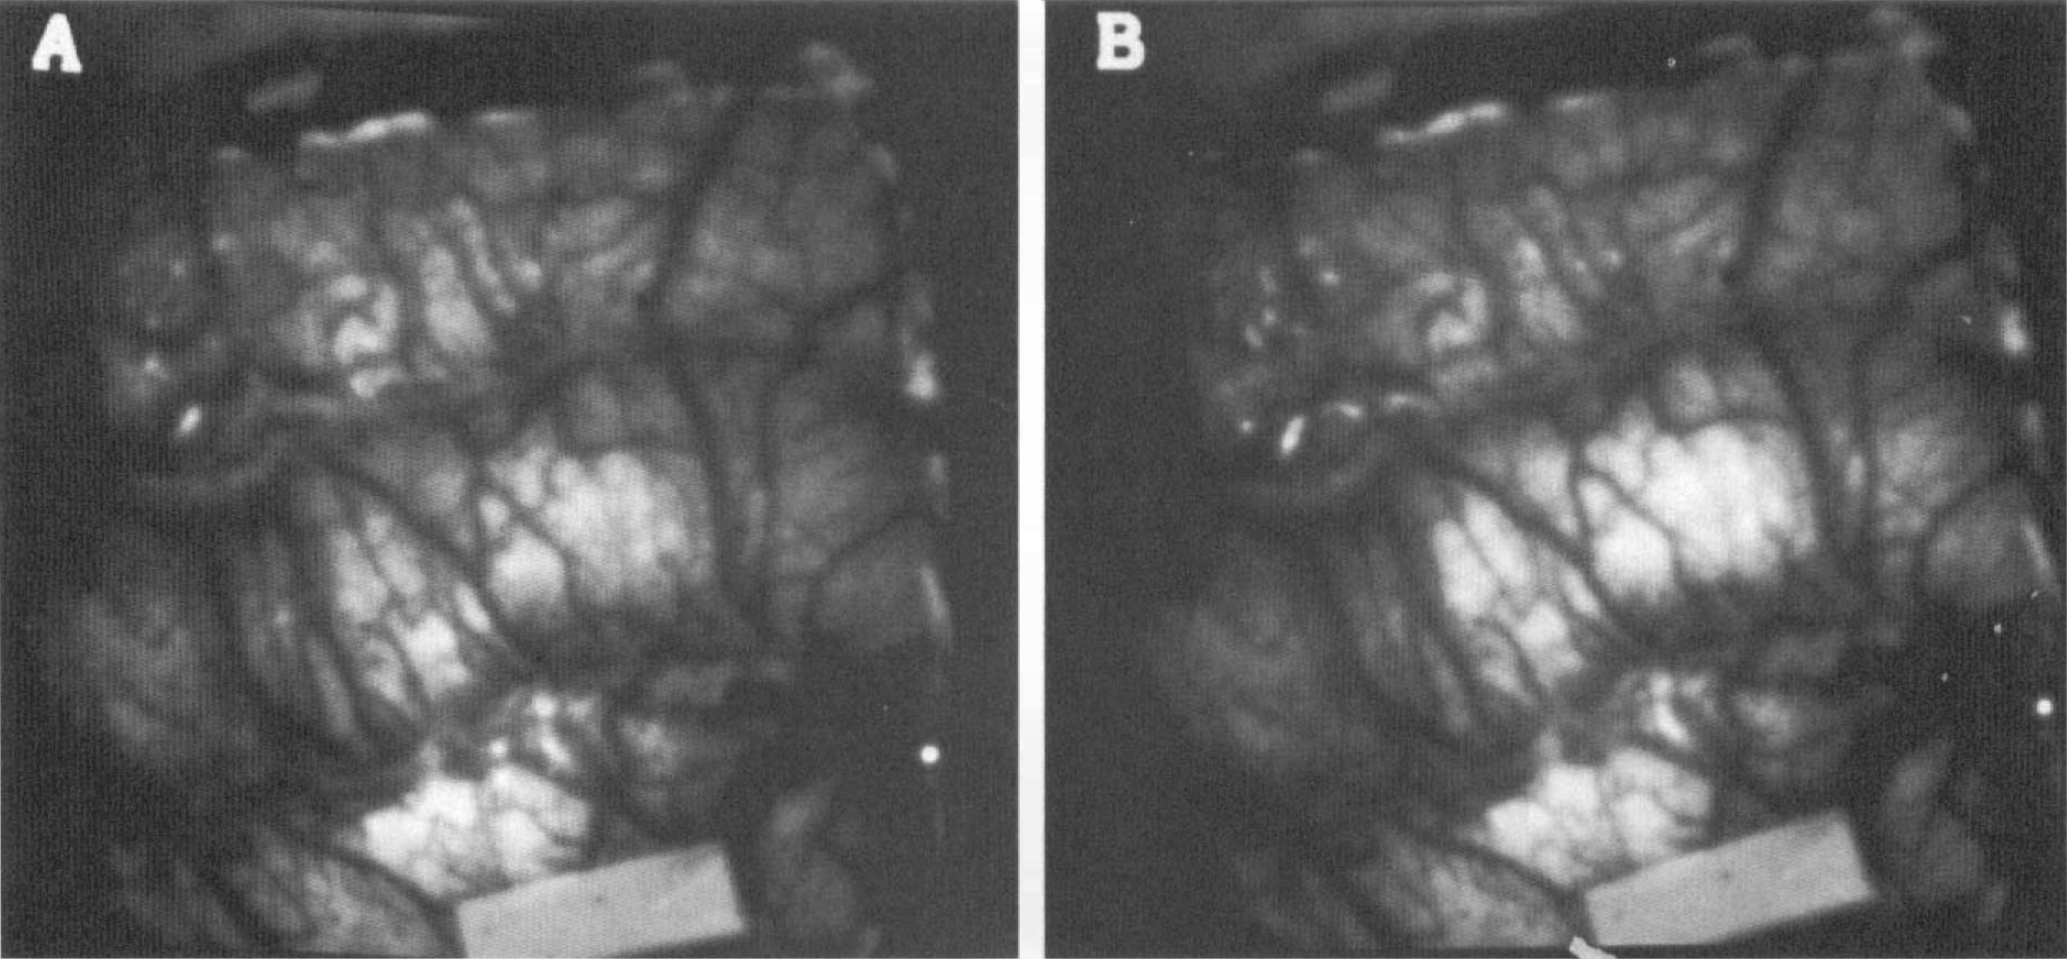
Contour maps illustrating the propagation of a TFD were prepared by segmenting areas of increased fluorescence in a difference image and filtering (Sobell). Contours were collected into a single image and the rate of propagation calculated in millimeters per minute from knowledge of the time interval between images. Image dimensions were calibrated using a 5.0-mm paper target (Fig. 1).
Examples of raw gray level fluorescence images (following middle cerebral artery occlusion-, same sequence as Fig. 5a). The baseline image (
Results from Example 1: eight difference images (lateral aspect, right hemisphere) selected from a sequence of 90, illustrating the early phase and propagation of a fluorescence transient 72 min after middle cerebral artery occlusion. The gray level values are differences from baseline on an 8-bit scale: gray level 128 (green, 0 on color calibration bar) represents no change from baseline image. Time from baseline is indicated in each panel. The calibration target (long axis = 5 mm) is seen in (b) (final panel, beside *.FFA filename),
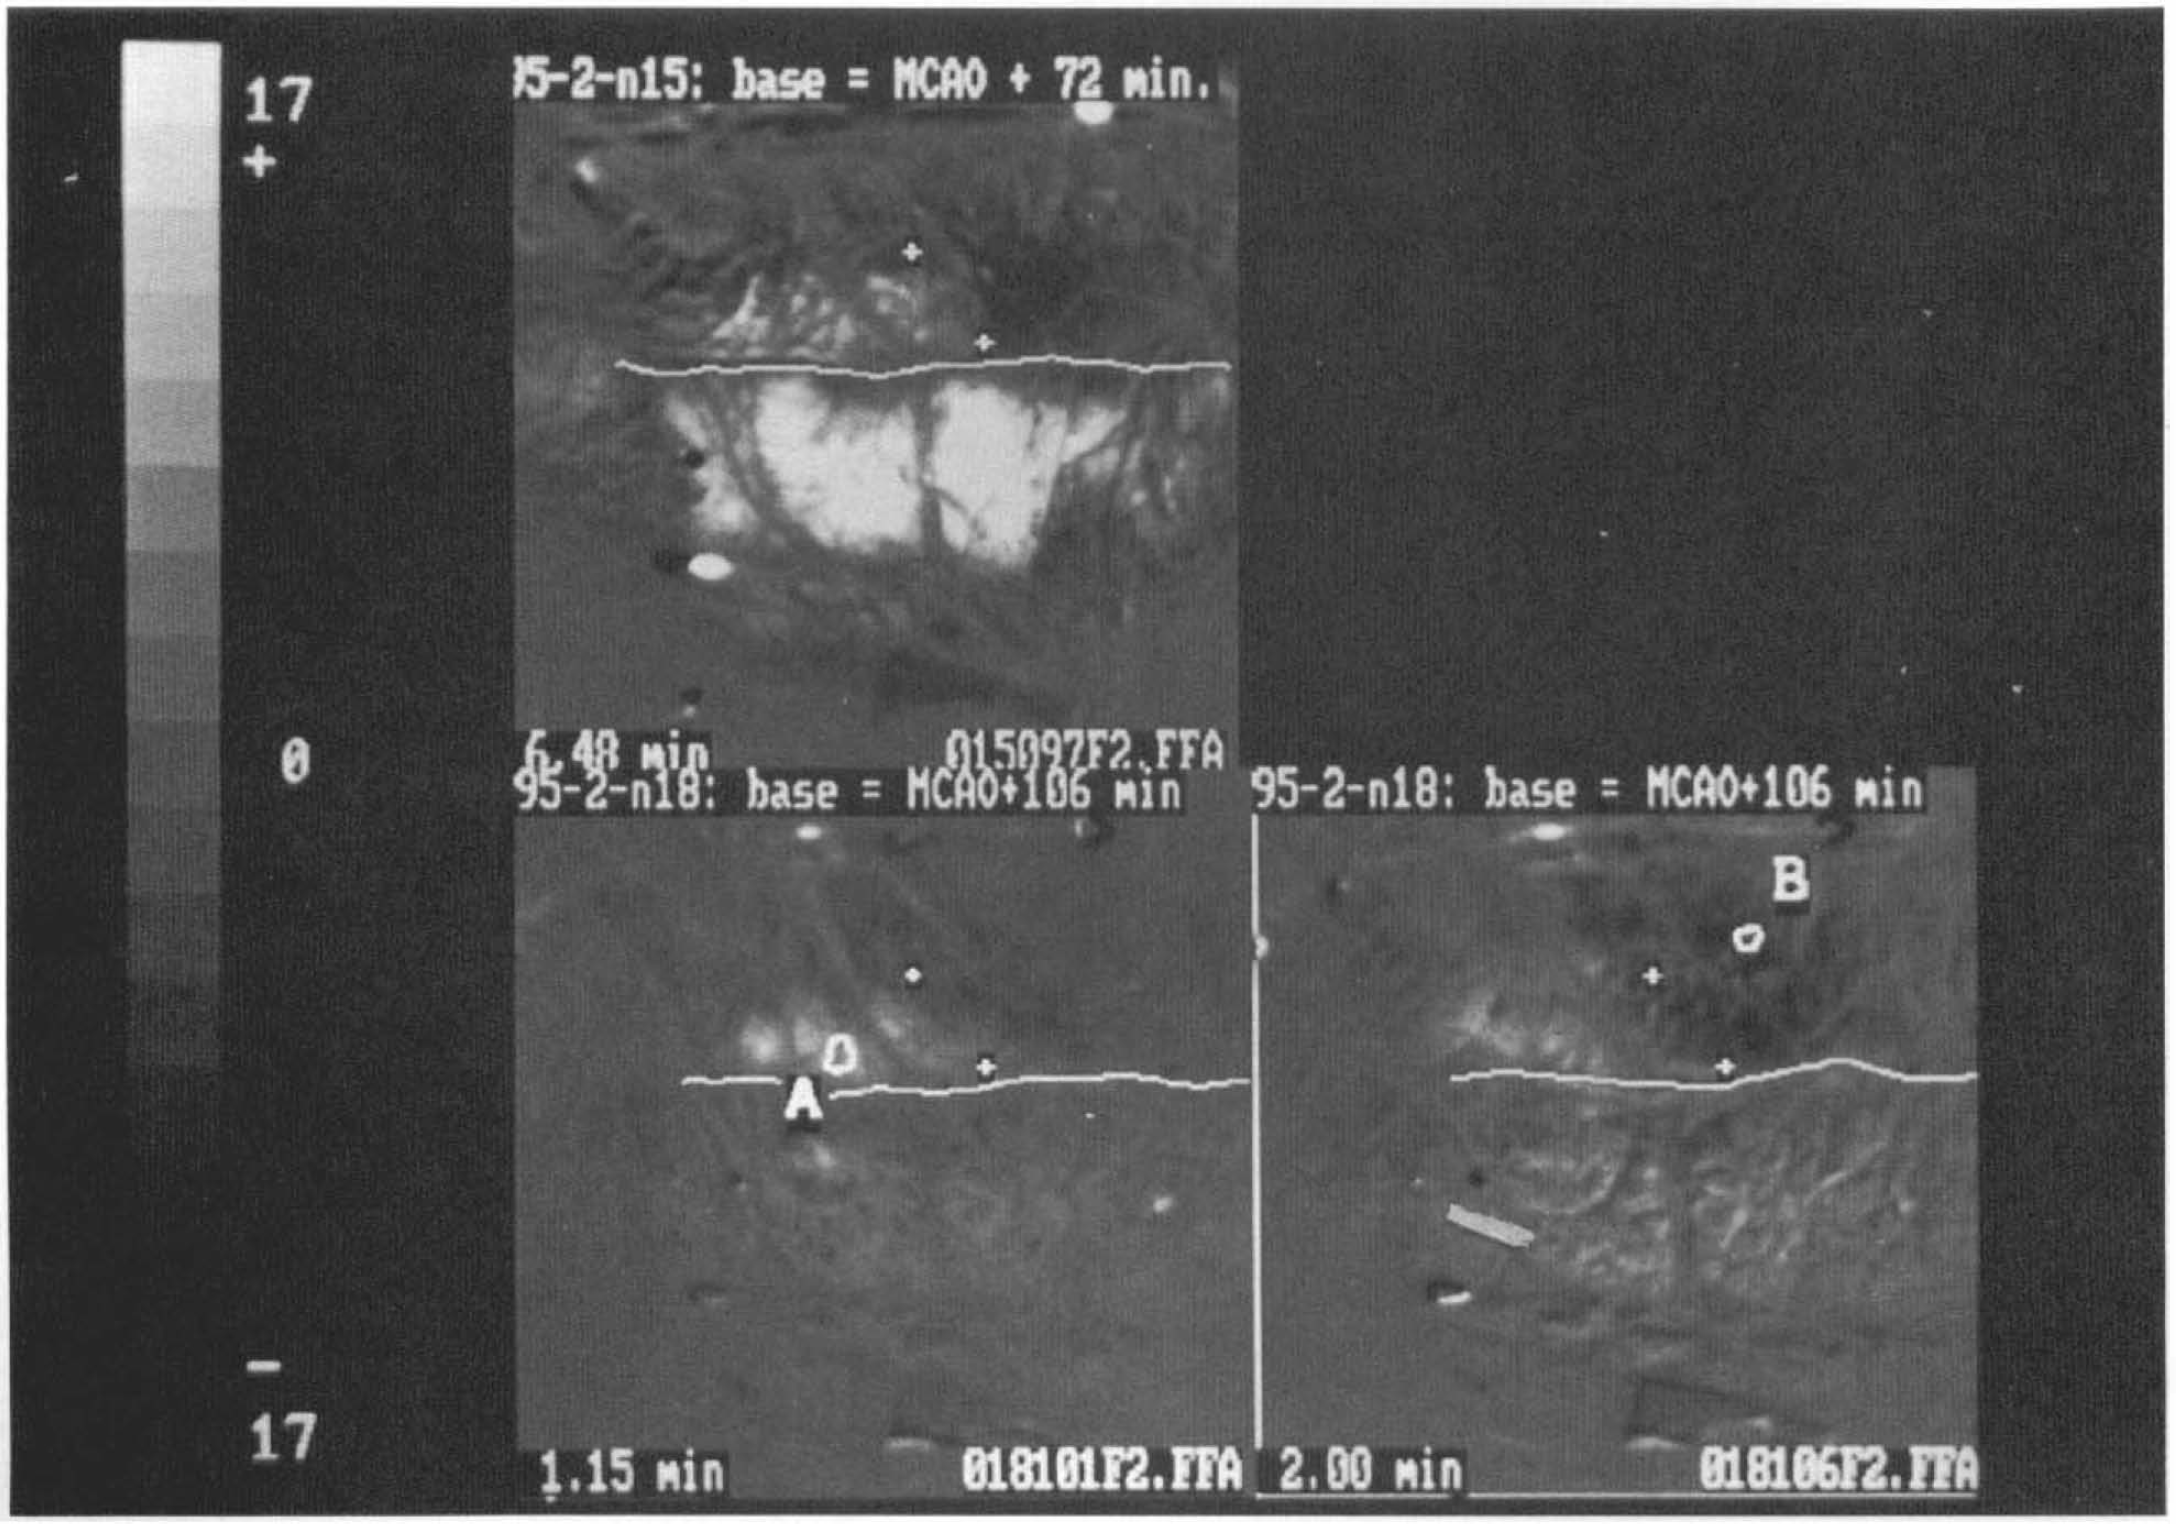
Three difference images from Experiment 4, illustrating stability with time of the interface between areas of fluorescence increase and decrease. In the upper left frame, a single difference image post—middle cerebral artery occlusion is shown (same sequence as Fig. 2). + symbols are placed at either end of an apparent interface between fluorescence increase posterolateral and fluorescence decrease anteromedially. A white line in each frame indicates the position of the marginal sulcus (marginal gyrus above, suprasylvian gyrus below). The lower two frames are from a second sequence in the same experiment 34 min later. A fluorescence transient originated on the lateral posterior marginal gyrus immediately posterior to region of interest A at 0.0 min and propagated medially and forward, converting to fluorescence depression as the front crossed the line between the two + markers. + markers are placed at the same coordinates in the three images and indicate that the site of transition between fluorescence increase and decrease did not change significantly between the two sequences.
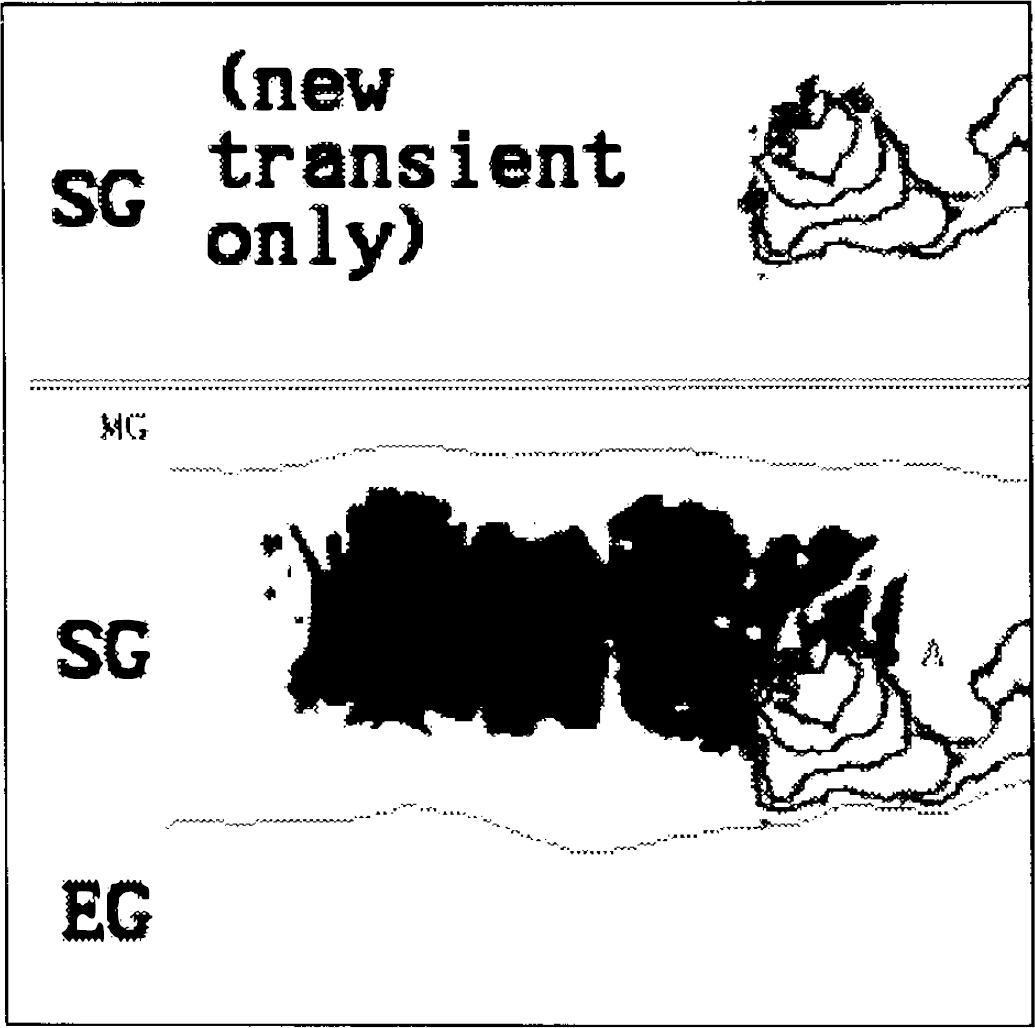
Illustration of the method for calculation of propagation rate, also showing initiation of a transient at the edge of probable core territory. A transient on suprasylvian gyrus failed to resolve (see Fig. 6); the territory affected is regarded as new core territory and is shown black (segmented from Fig. 2b). After 15 min, a new transient developed at the anterior edge of this area and propagated forward; area A, apparently not invaded by the transient, is a large vein. The areas of increased fluorescence in the new transient were thresholded at the same level and their perimeters contoured and overlaid. They are shown separately above the double line to demonstrate that propagation from the edge of core territory was not circumferential, as might be expected in normal cortex.
Results from Example 2.
RESULTS
Typical noise in small ROIs in difference images was ±800-1,200, or 1.2-1.8% of full difference scale. Examples of raw images are given in Fig. 1. TFDs occurred in four experiments; in the fifth a camera fault is suspected, resulting in loss of light sensitivity. The amplitudes of TFDs were 5–25% of full scale. Details for each TFD are shown in Table 1, and a narrative description of examples is given here and is illustrated in the figures.
Summary of incidence, location, timing, and propagation of fluorescence changes in four experiments
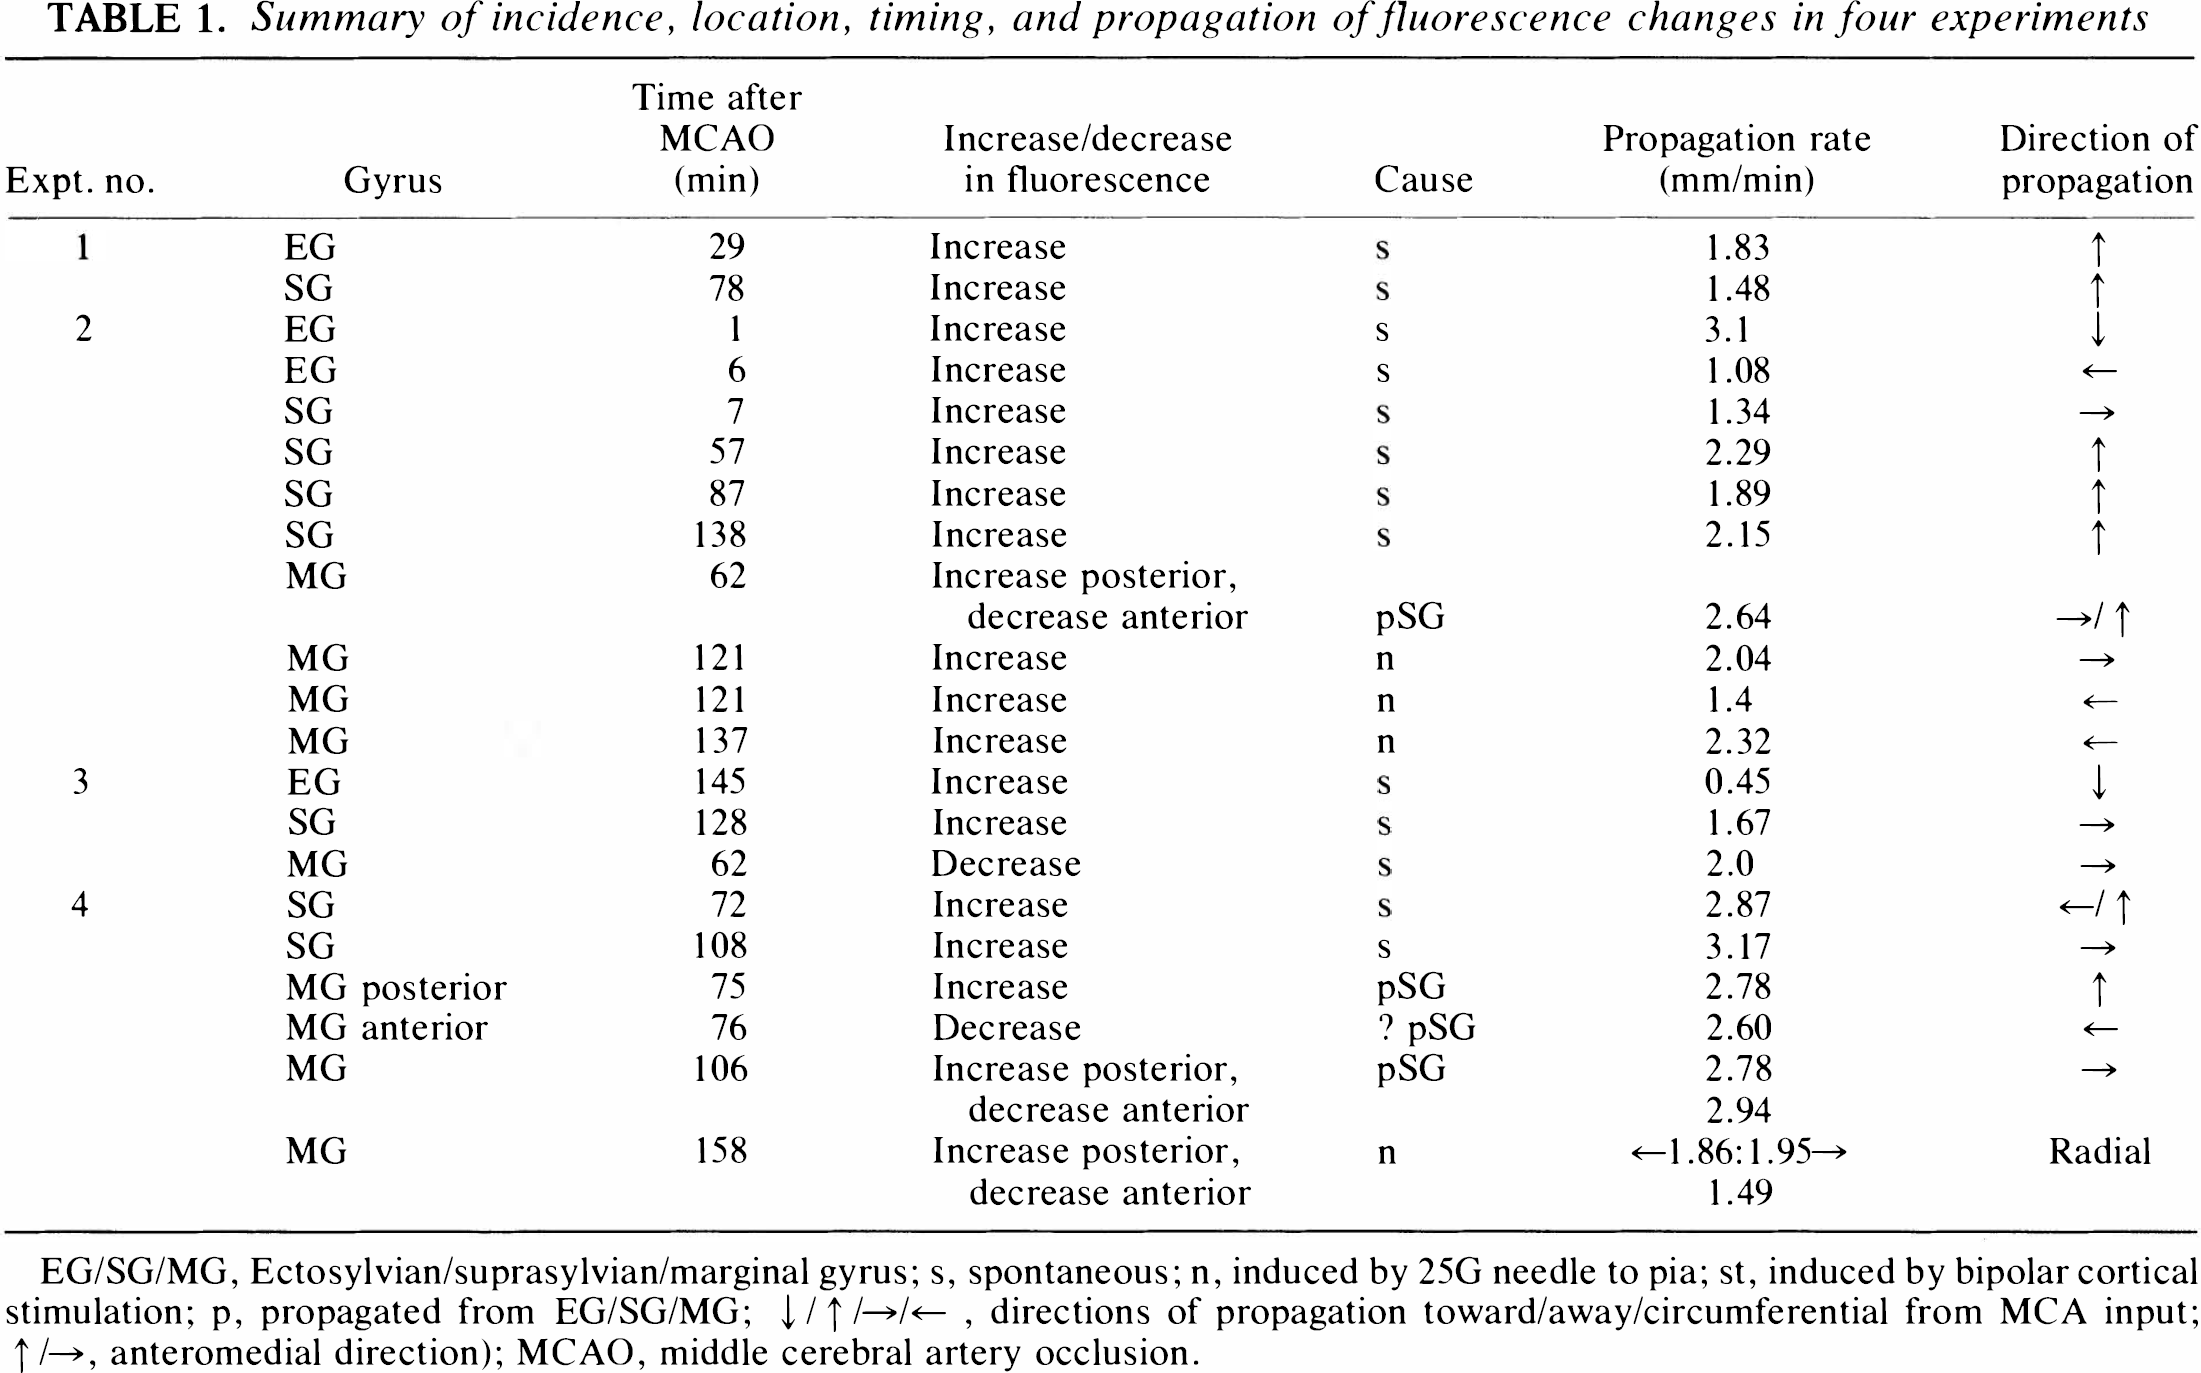
EG/SG/MG, Ectosylvian/suprasylvian/marginal gyrus; s, spontaneous; n, induced by 25G needle to pia; st, induced by bipolar cortical stimulation; p, propagated from EG/SG/MG; ↓/↑/→/←, directions of propagation toward/away/circumferential from MCA input; ↑/→, anteromedial direction); MCAO, middle cerebral artery occlusion.
Spontaneous transients
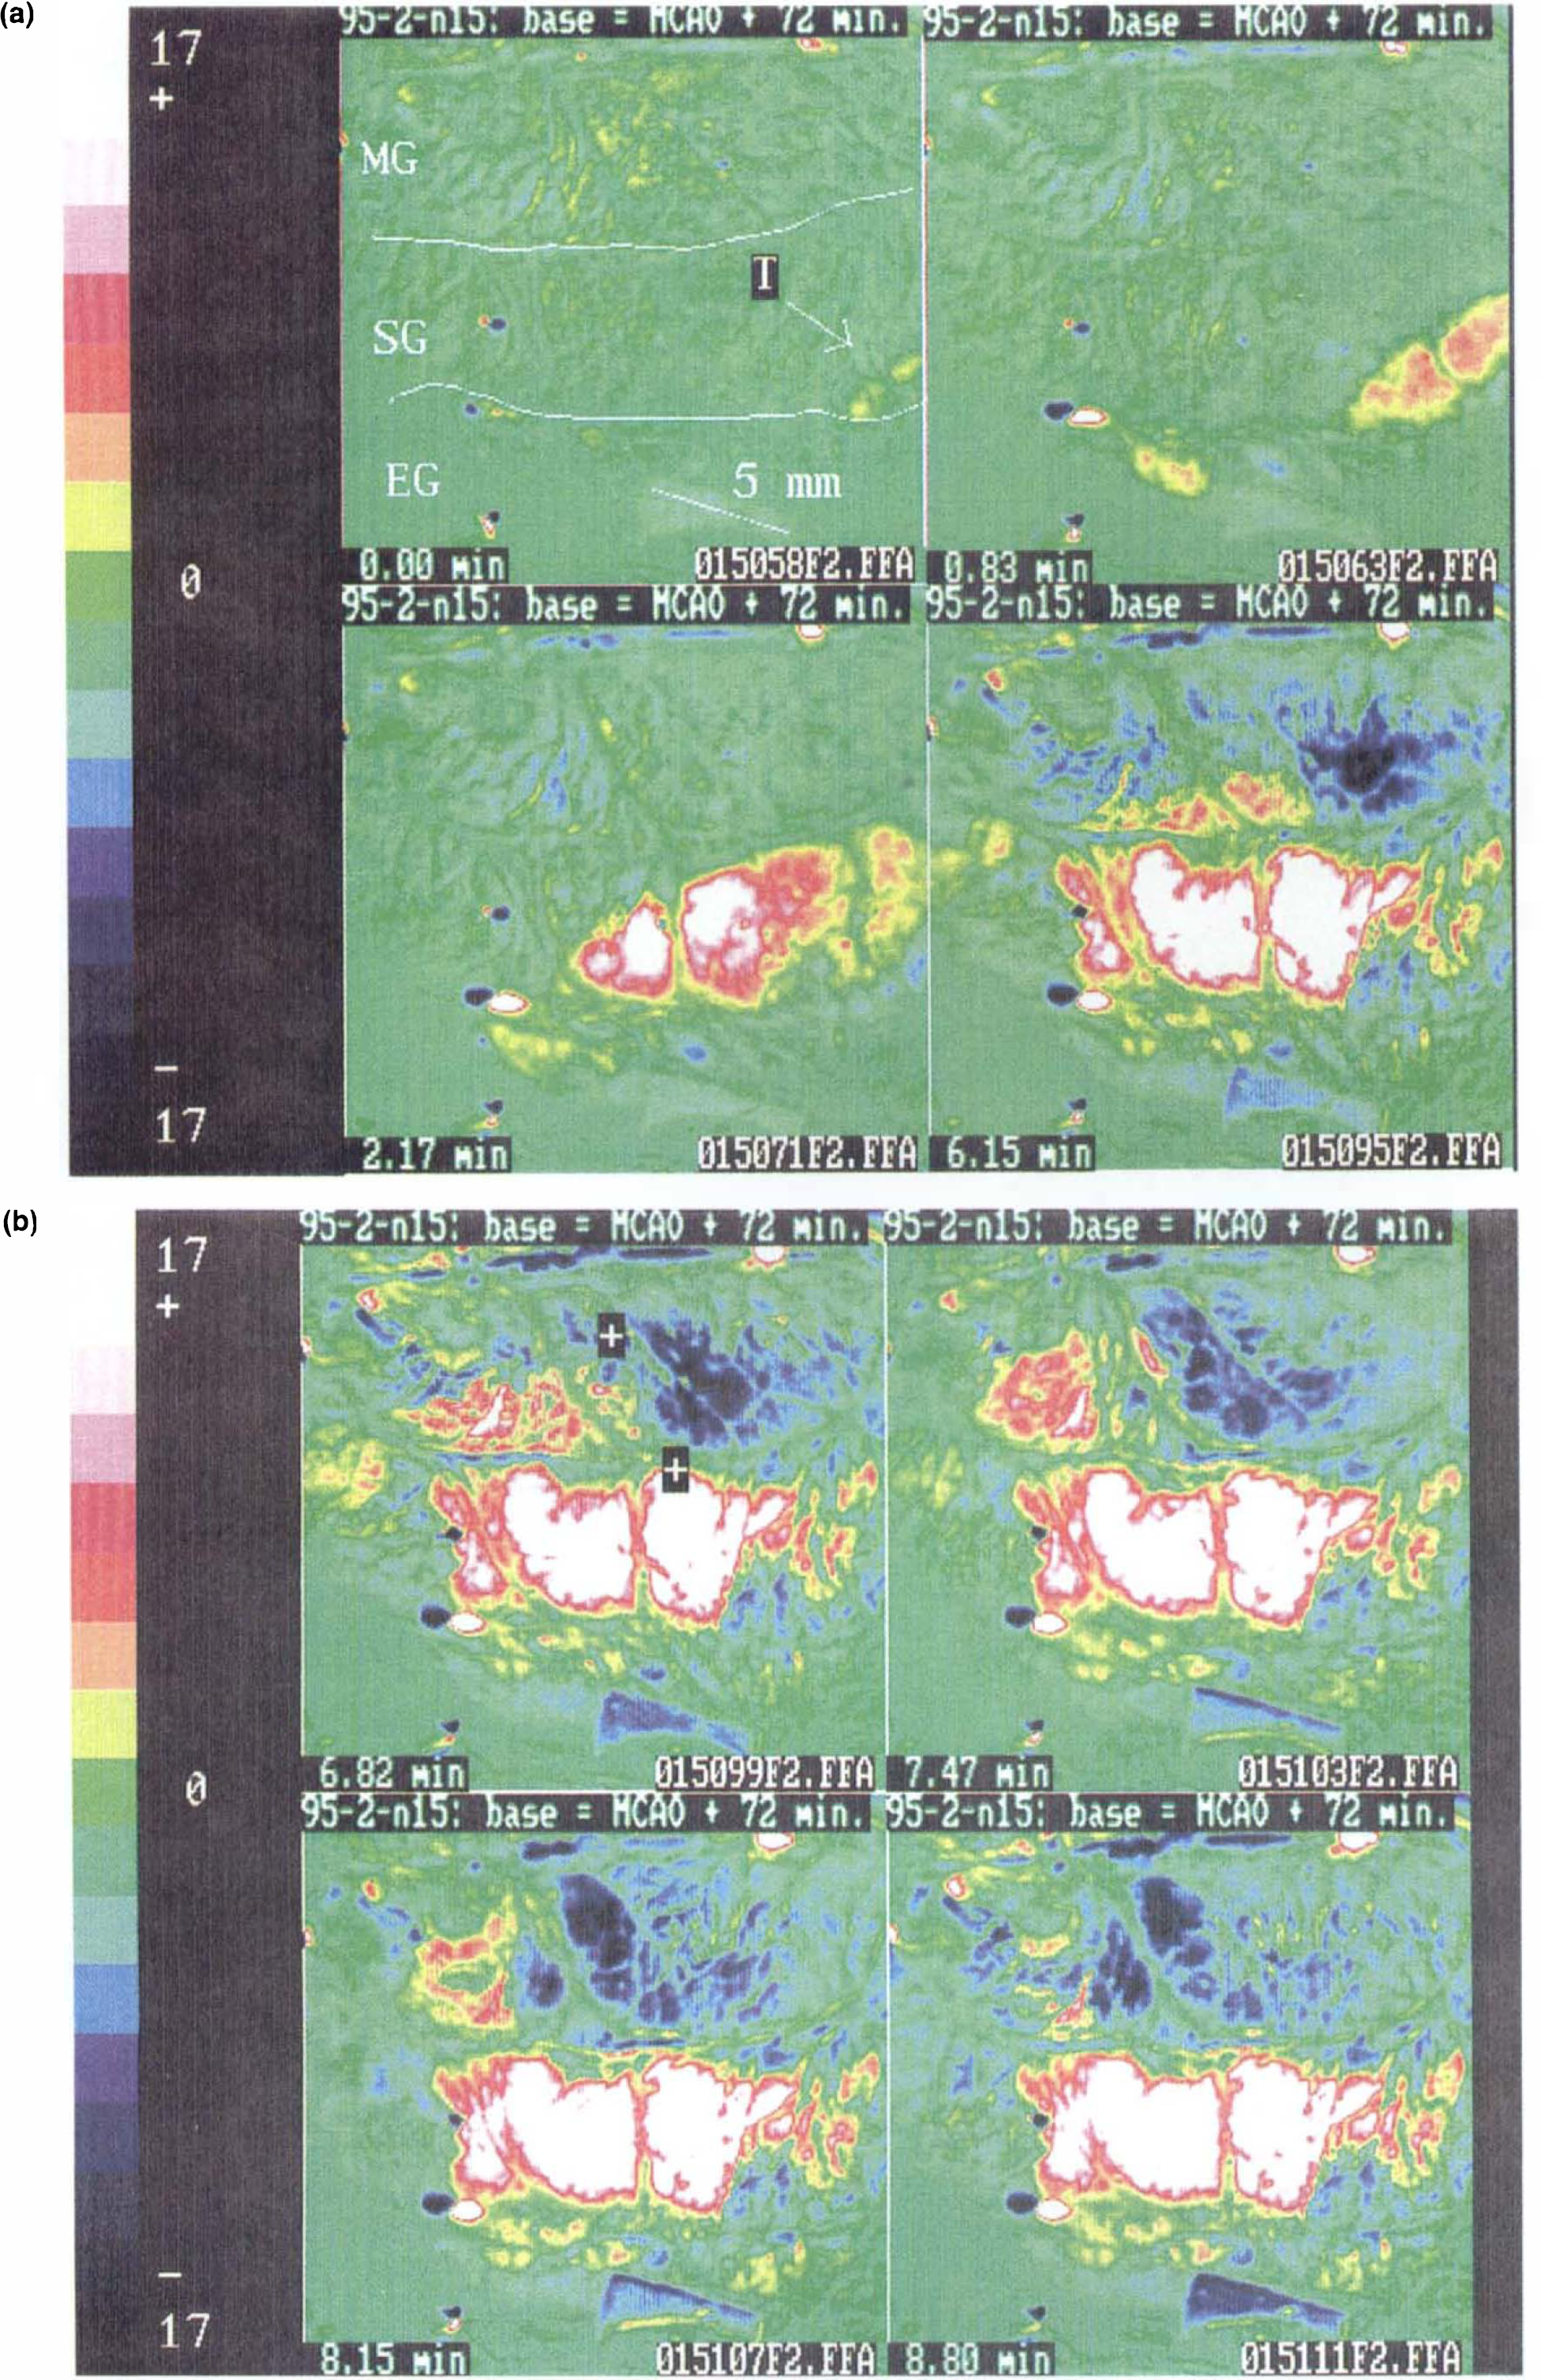
Example 1 (Experiment 4) (Fig. 2a and b). A moderate (see discussion on origin of TFDs) increase in fluorescence appeared at the anterolateral extremity of SG at the edge of the imaged field 72 min after MCAO and propagated posteromedially on the gyrus. After 4 min, a new fluorescence depression transient appeared at the front of MG and propagated posteriorly. A few seconds later, the original fluorescence increase reappeared on the cortical surface, more posteriorly and now on the lateral edge of MG (apparently having propagated around the walls of the marginal sulcus); it moved peripherally, converging with the backward-propagating fluorescence decrease. The fluorescence increase propagated posteromedially on MG and in peripheral MG became an initial decrease. In contrast, the fluorescence increase noted on SG persisted for the remainder of the sequence (Fig. 2b). The pattern observed on MG suggested an interface sited obliquely (posteromedial to anterolateral) between middle and anterior MG; this separated an anterior area, in which the primary polarity of the fluorescence transient indicated probable NADH oxidation, from a posterior area of NAD reduction. The interface did not move for 34 min between the two sequences (Fig. 3). Later, two transient increases in fluorescence occurred, both originating at the same site on the convexity of SG, on the anterior edge of the area of sustained fluorescence increase shown in Fig. 2b; one of these transients is illustrated in Fig. 4.
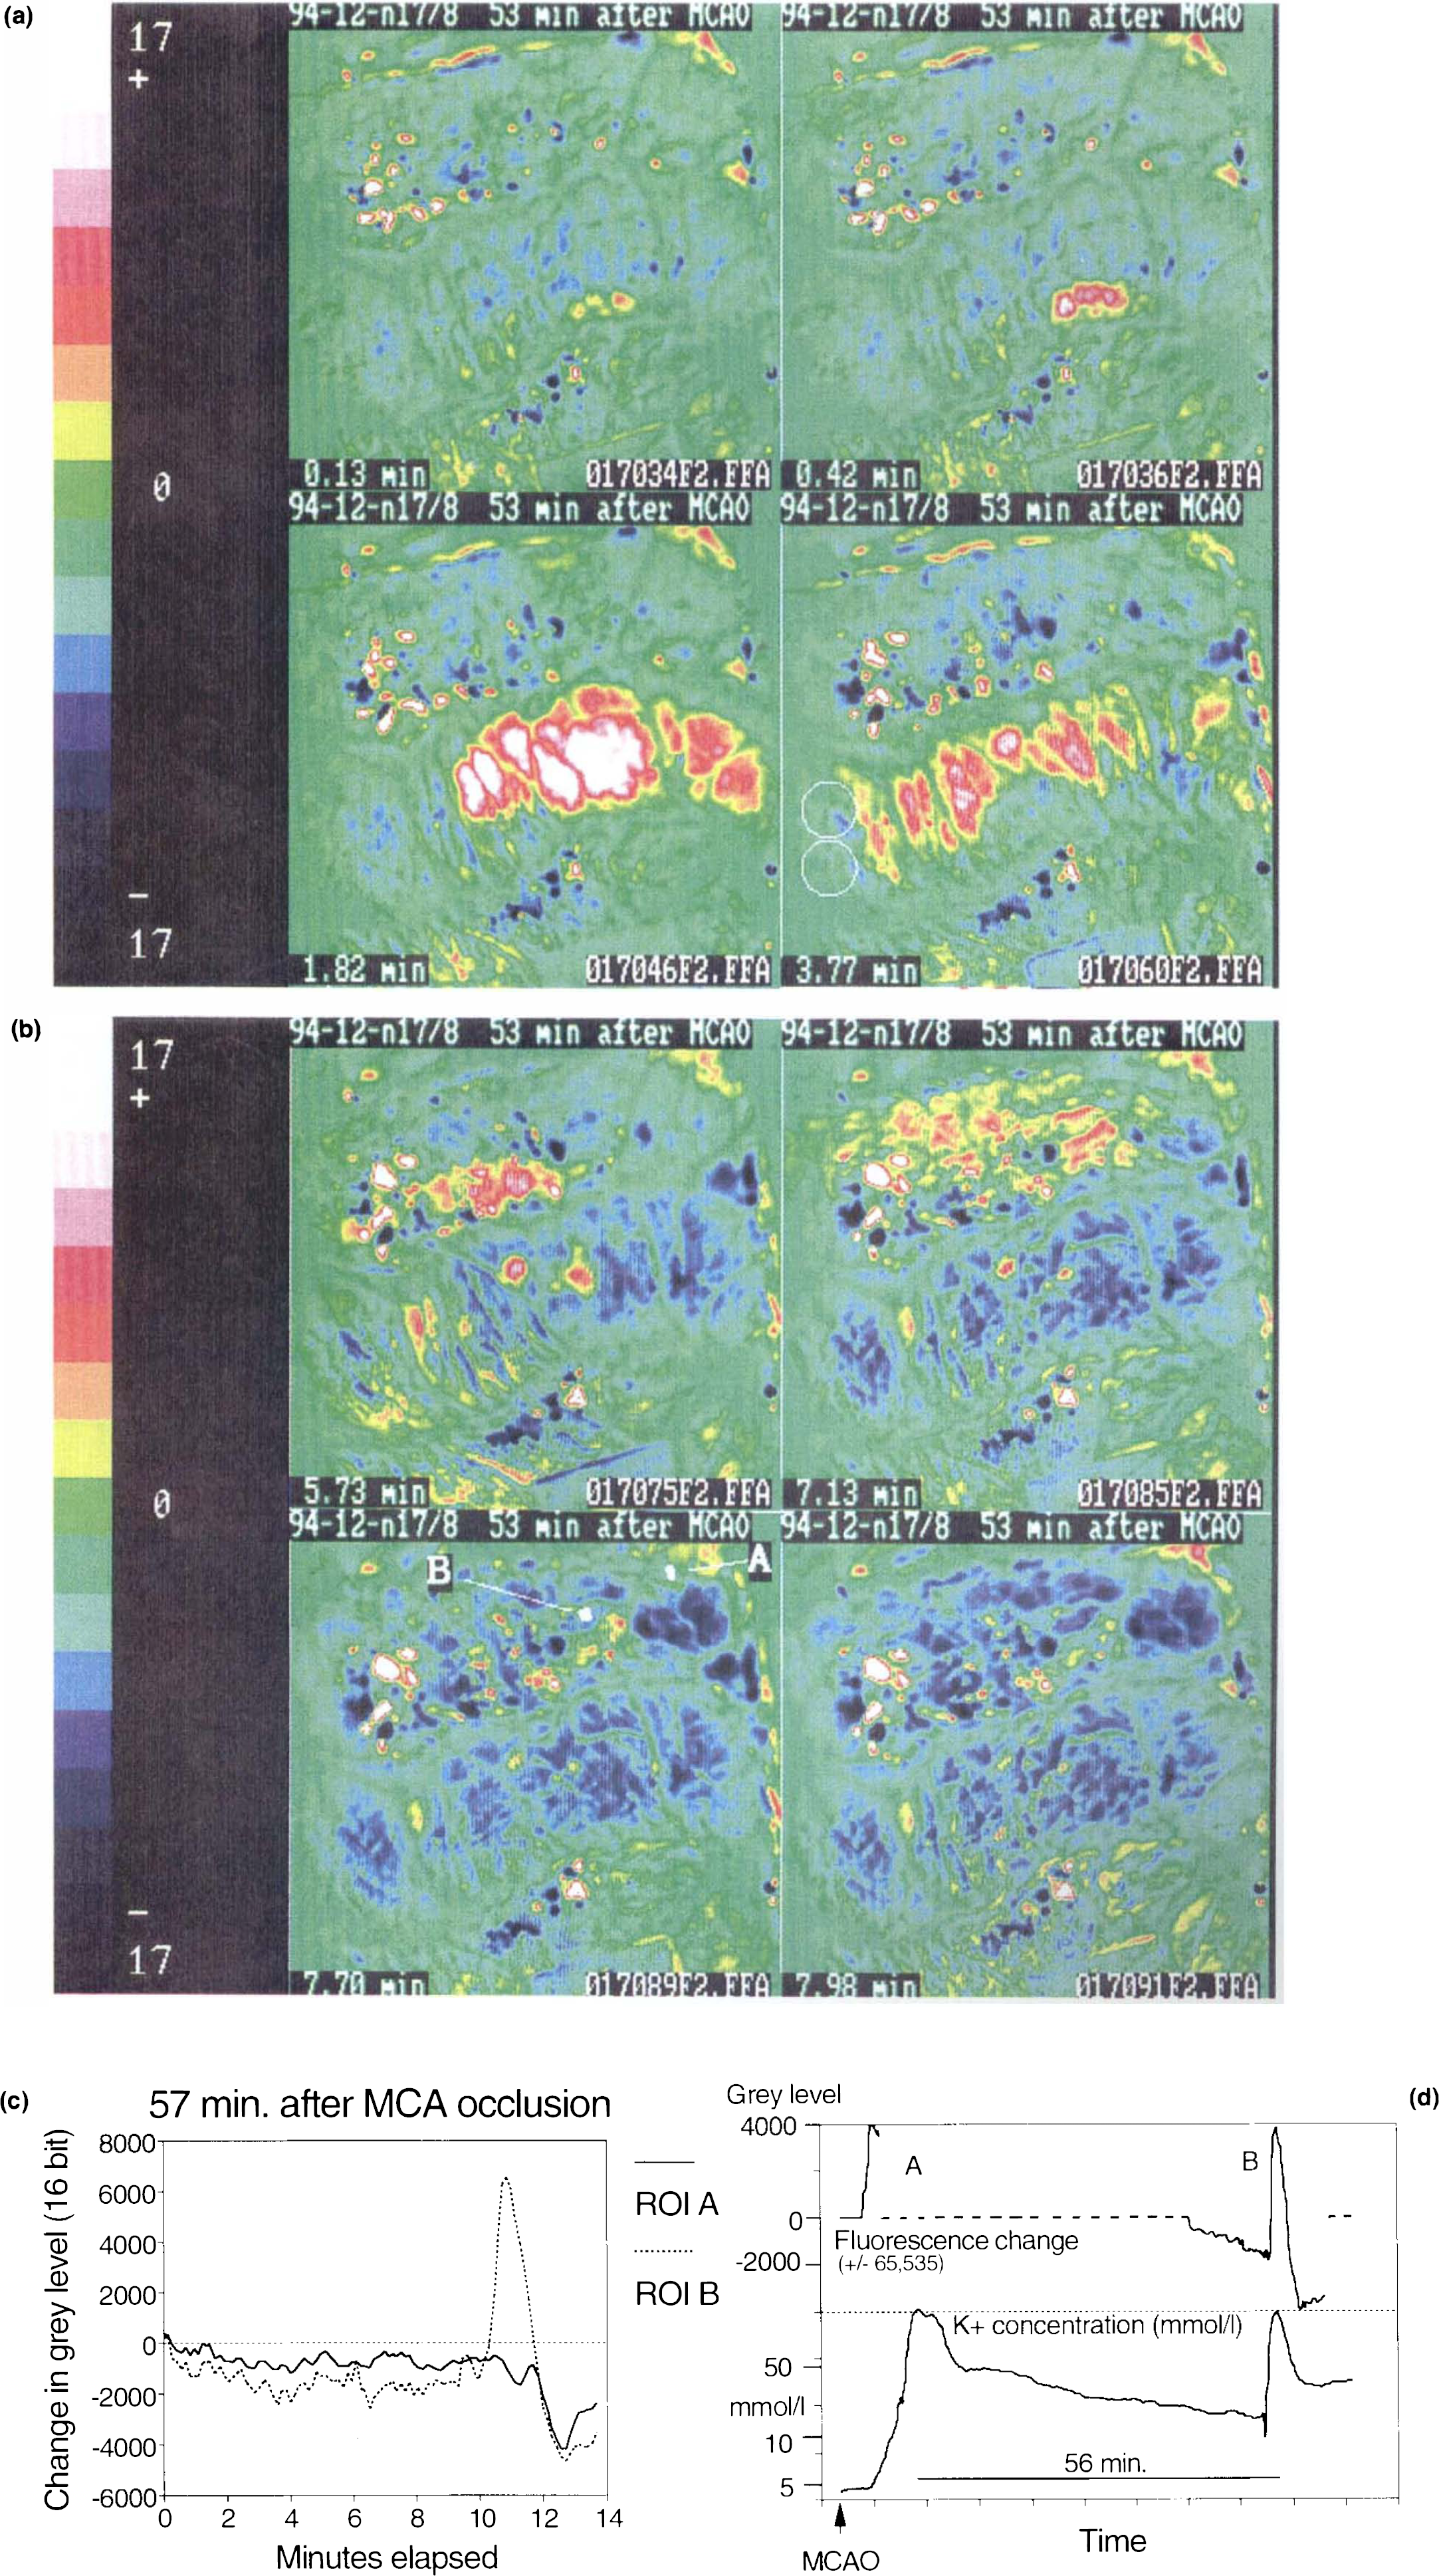
Example 2 (Experiment 2). Fluorescence increased abruptly at three closely adjacent points on the lateral SG 57 min after MCAO, immediately adjacent to the suprasylvian sulcus (Fig. 5a, panel 1). The increase spread from these foci into the peripheral SG and forward and backward in the gyrus in later images (Fig. 5a, panels 2–4). As the front of the transient reached the site of a potassium-selective electrode (surface, twin-barrel valinomycin, each barrel ∼2-mm diameter) at the posterior margin of SG, a typical potassium transient was recorded from the electrode (Fig. 5a, panel 4; Fig. 5d). The transient again apparently propagated around the depth of the marginal sulcus; its pattern on MG (Fig. 5b)—primary fluorescence increase on intermediate MG and fluorescence decrease on anterior MG—separated by a discernible boundary on the cortical surface (most evident in the video sequences), closely resembled Example 1.
Induced transients
The effects of cortical stimulation on the MG before and during MCAO were briefly assessed (Table 1) to verify that the pattern of results obtained resembled those previously observed using a fluorometer (Strong et al., 1988).
Before ischemia in Experiment 4, the cortex of posterior MG was stimulated with bipolar intracortical electrodes (50 Hz, 0.15 ms, 1.0-mA constant current) for three 5-s periods before MCAO, and localized, nonpropagating decreases in fluorescence were observed. After MCAO, bipolar stimulation failed to elicit any change in fluorescence in the same field; therefore, the cortex of MG 2–3 mm anterior to the stimulating electrodes was needled superficially (25G needle). An increase in fluorescence developed around the needle site and propagated posteriorly and laterally, reaching the marginal sulcus. Some 30 s later, a decrease in fluorescence developed anterior to the needle site and propagated forward on MG.
DISCUSSION
The use of in vivo fluorescence measurements from the exposed brain for experimental applications is not new, having been developed principally by Chance and Jöbsis and colleagues (Chance et al., 1962) —and the NADH imaging implementation by Schuette and colleagues (1974)—two decades ago. Application of this technology now to studies of focal cerebral ischemia has been facilitated by advances in image-processing methods. It has also been prompted by the growing body of evidence suggesting that TFDs (or the phenomena they represent) may be a cause—possibly the principal cause—of the progressive deterioration or maturation observed in cerebral cortical ischemic boundary zones. Important elements in the evidence for this concept were well summarized recently by Mies et al. (1994) in the introduction to their article and will therefore not be repeated here. The method we have adopted is clearly capable of detecting and tracking changes in cortical fluorescence, and an interpretation of the data obtained is needed, together with assessment of the potential uses and limitations of the method.
Interpretation of fluorescence change
To maximize light gathering, we used no emission filter [the emission spectrum of NADH extends from 425 to 475 nm, maximum 450 (Chance et al., 1962)], so that other fluorochromes might be imaged. However, in studies of cerebral cortical fluorescence in the 1970s, Jöbsis et al. (1972) argued convincingly that 450-nm cortical fluorescence (with 370-nm excitation) originates principally from mitochondrial NADH in the superficial 500 (μm of the cortex. A further issue is that hemoglobin in the microcirculation quenches fluorescence in this waveband; the extent to which this occurs has been estimated from the ultraviolet reflectance signal from the cortex (Jöbsis et al., 1972), but this correction method was not feasible here since our camera, like most charge-coupled device cameras, has little sensitivity below 420–440 nm. Fluorescence depression can thus indicate either an increase in local blood volume, suggesting vasodilation, or oxidation of NADH to NAD+, or a combination of both, and is the characteristic response of the normally perfused cortex to cortical spreading depression (CSD) (Rosenthal and Somjen, 1973; Mayevsky et al., 1974). Importantly, both the factors accounting for fluorescence depression thus represent normal responses to cortical activation. Conversely, an increase in fluorescence reflects either NAD+ reduction to NADH or a decrease in local blood volume or both; again, either mechanism is an inappropriate or pathological response to a TFD. Most transients recorded from SG failed to resolve, at least within the observation periods (Fig. 6); this pattern closely resembles that previously seen with fluorometry (Strong et al., 1988), and we interpret such changes as indicating conversion to core conditions. Histology at 2 h frequently indicates this, and the time courses of Ke-electrode traces from this gyrus are similar to those of fluorescence (Strong et al., 1983b, 1988). The polarity reversal of the initial fluorescence change observed in TFDs reaching the anterior cerebral artery territory (Figs. 2b, 3, 5b and c, and 6) and the difference in polarity seen in fluorescence changes induced in the posterior MG before as compared with during ischemia both support this line of reasoning. In summary, therefore, the signal being imaged most probably reflects predominantly a balance between oxygen availability and reducing-equivalent load within the mitochondrion, as in the photomultiplier-based systems.
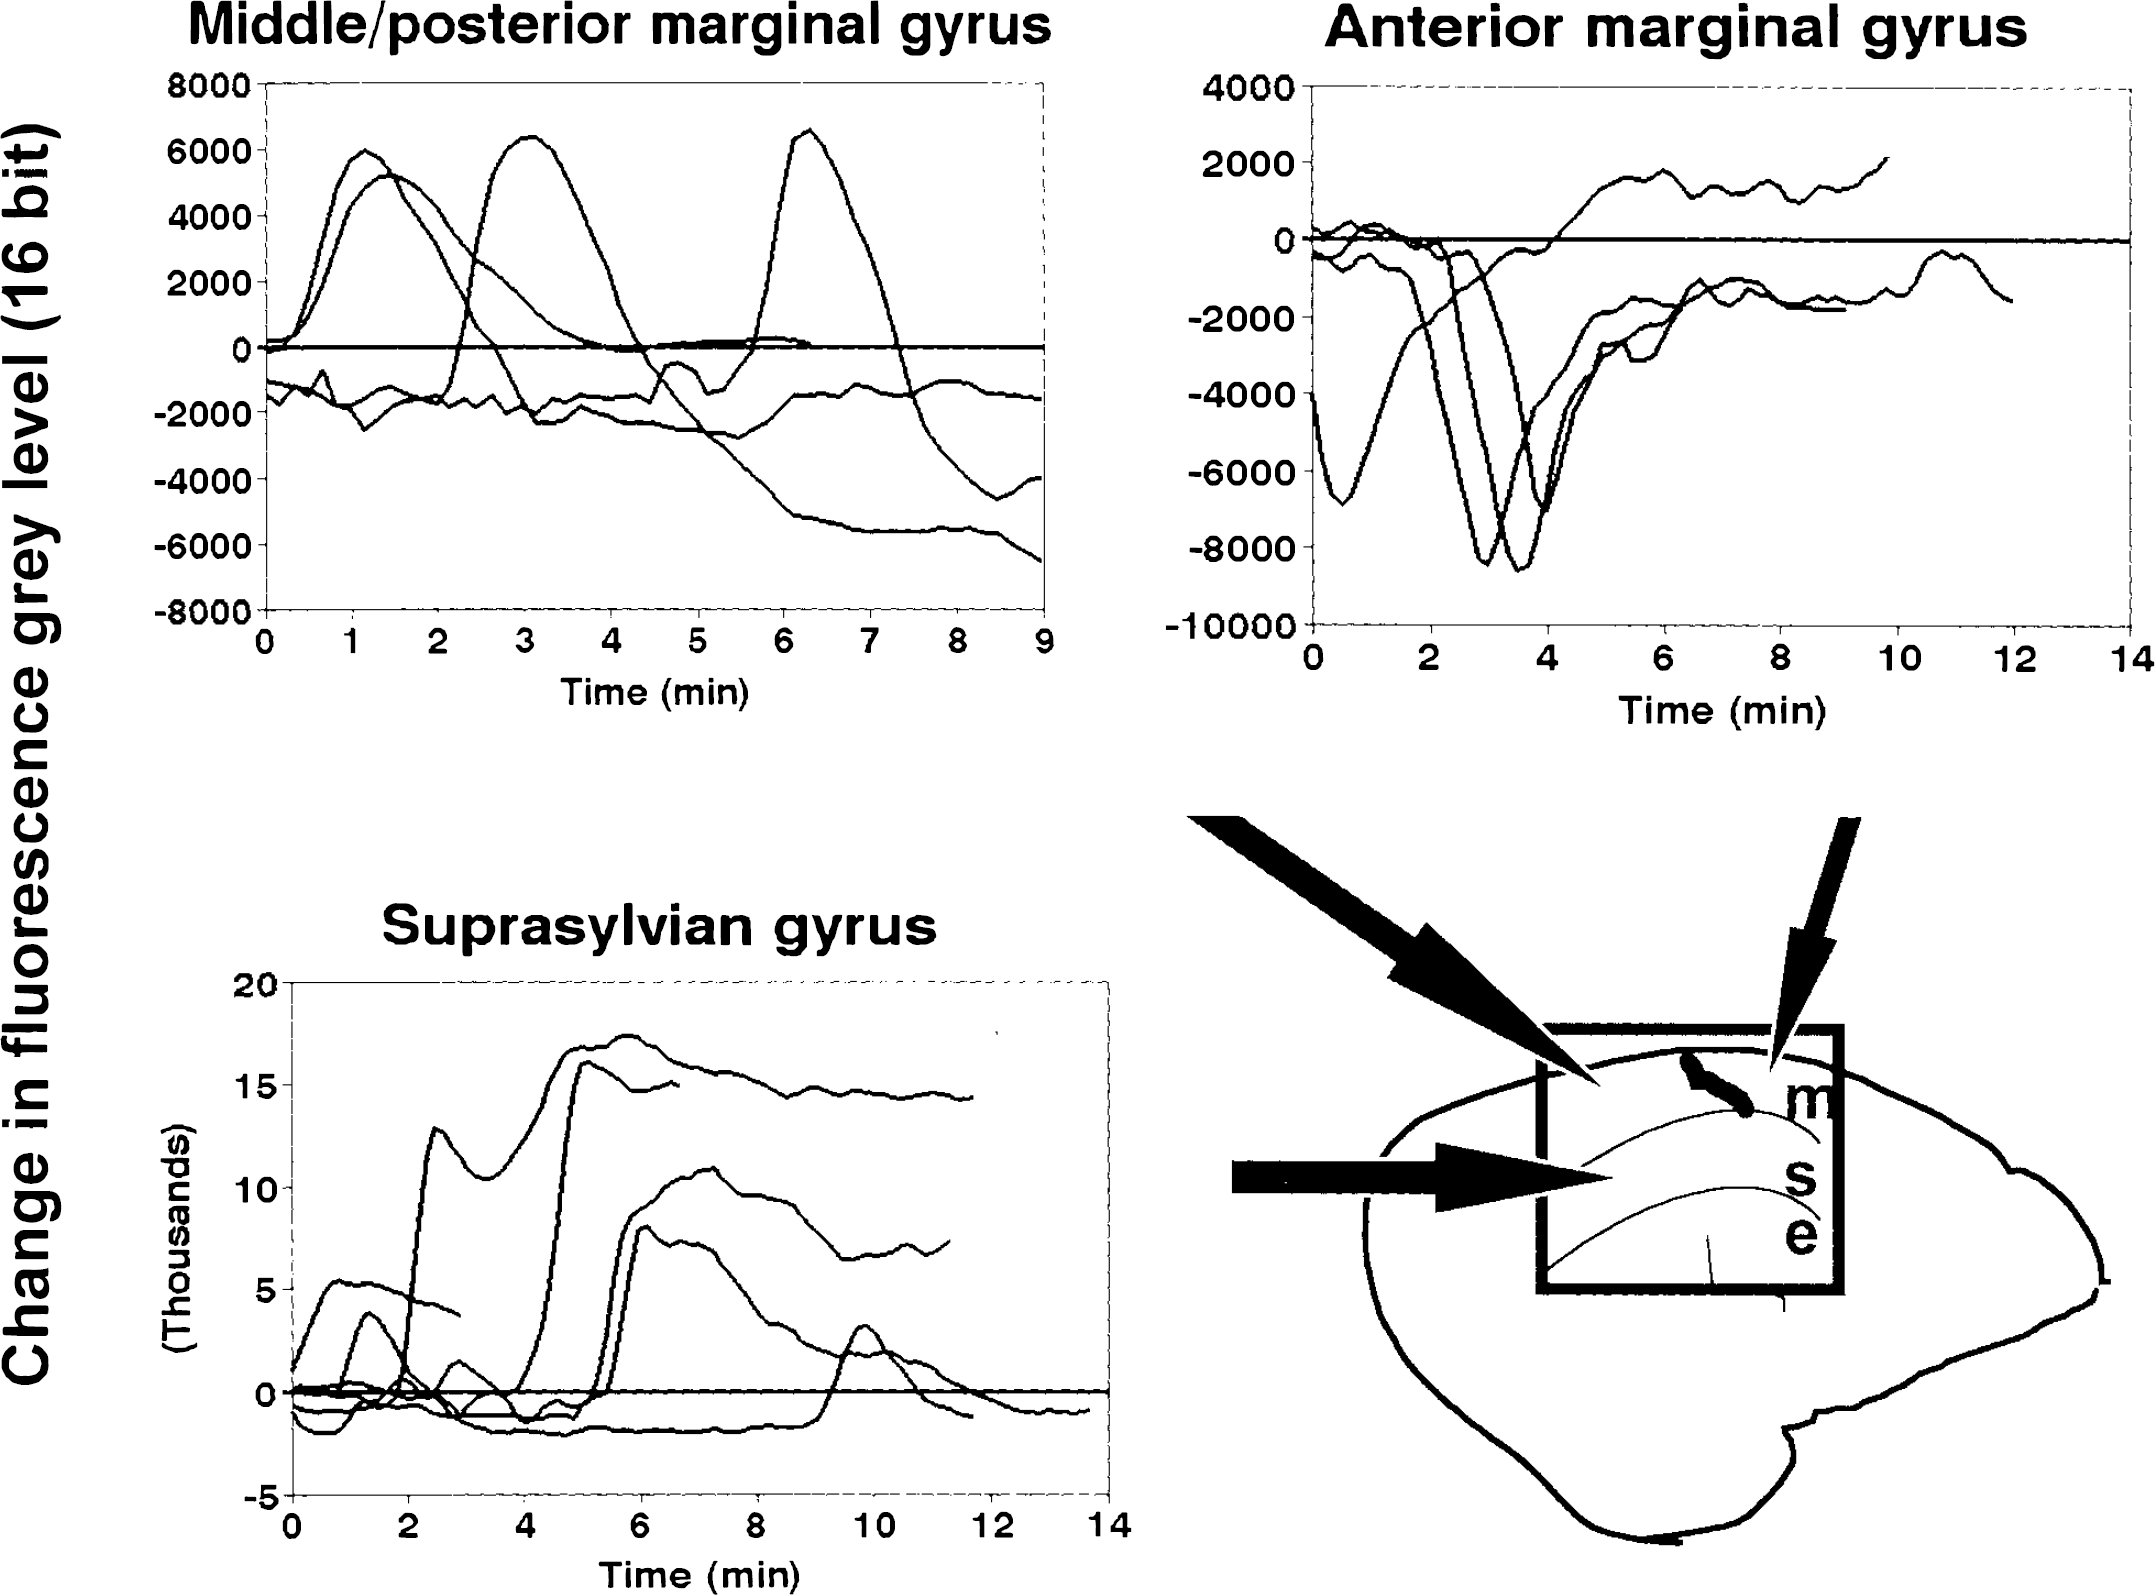
Graphical summary of the time courses of transient fluorescence changes, grouped by gyral location. Each tracing is the time course of fluorescence mean gray level in a small region of interest, defined as described in Methods and expressed as a difference from a baseline taken at the start of the sequence. On the suprasylvian gyrus, all transients were increases in fluorescence; sustained increase in fluorescence is interpreted as indicating probable conversion to core conditions. On the middle and posterior marginal gyrus, transients were also increased in fluorescence, but were reversible with varying time courses. On the anterior marginal gyrus, only fluorescence depression occurred.
Sensitivity and detection limits
Is the method sufficiently sensitive to detect all TFDs occurring in the territory being imaged? The induced fluorescence depressions we observed before MCAO occurred with cortical electrical stimulation variables known to cause fluorescence depressions of 2–4% full scale (Rosenthal and Somjen, 1973) and Ke transients of low (<10 mmol/L) amplitude (Branston et al., 1982). Responses of both these variables to CSD are almost always considerably greater. We therefore consider that our system has sufficient sensitivity to capture fluorescence transients associated with CSD-like phenomena. However, the curvature of the exposed cat hemisphere in conjunction with the single, obliquely located light source places some constraints on the extent of the field to be viewed, and the conditions were therefore optimized for the periinfarct zone (SG and MG) in the present experiments. Due to the oblique location of the light source, furthest from the anterior margin of the field, low illumination necessarily results in reduced absolute values for change in fluorescence near this margin, and early detection of transients and identification of sites of initiation may therefore be suboptimal in this area of the image (Figs. 1 and 2a). Further studies of the initial core area (ectosylvian gyrus) in the first 60 min after MCAO will be required.
Our use of separate baseline images at the start of each sequence obscures any regional differences in steady-state fluorescence that may be present at the start of a sequence. It is possible to overlay (image processor) regional changes that become established in one sequence onto subsequent sequences for purposes of demonstration (Fig. 4). Use of a single pre-MCAO baseline image for all later sequences tended to reduce dynamic range in post-MCAO difference images, possibly due to slow background changes in illumination level; artifact was also introduced.
Origin and propagation of fluorescence transients
The question was raised in 1983 as to the site of origin of the TFDs observed (with electrode methods), and we speculated that they might originate at the edge of core territory, where Ke was (by definition) elevated (Strong et al., 1983b). An alternative hypothesis envisages an origin for MCAO boundary zone TFDs within the periinfarct zone, as a reflection of transient microfocal flow reduction, probably coupled with local glycopenia (Nedergaard and Hansen, 1993). The initial data we present here suggest at present—but by no means establish definitively—that the edge of the core is a more probable site for initiation than the penumbra. Initiation of the transient in Fig. 5a at closely adjacent foci beside the suprasylvian sulcus suggests a possible primary origin at a single focus on the medial wall of the sulcus. The same may apply to Fig. 2a, hence explaining the diffuse appearance in the earliest available image of this transient. Initiation of a transient on the cortical surface at the edge of probable new core territory is illustrated in Fig. 4 and suggests that it may be possible to detect the origin of a TFD if this lies on the surface convexity of a gyrus, rather than in a sulcus. More detailed discussion of this issue will require further data.
The rates of propagation observed were variable, possibly reflecting variations in factors such as temperature, which we did not seek to control closely in these initial studies. However, the values obtained for propagation rate (Table 1) do not differ very substantially from the range of 2.0–3.0 mm/ min, which is generally stated for CSD (Marshall, 1959).
Topography of boundary zones in cat MCAO model
We have previously shown scattered ischemic cell change on the MG in the cat MCAO model, and on the basis of a combination of freedom from core K change and EEG suppression, we designated this area as penumbra (Strong et al., 1983b). Far medial parasagittal MG is regarded as anterior cerebral artery territory, and in progressively more anterior areas of the MG, an increasingly wide medial fraction of the gyrus must therefore lie primarily within this territory. An interface between anterior cerebral and MCA territories may therefore be envisaged, running anterolaterally/posteromedially on the MG surface. The interface with this orientation observed on the MG in Example 1, between areas of primary fluorescence increase and decrease (Figs. 2, 3, and 5a–c) appears to us likely to represent this boundary. This suggestion is supported (a) by the finding (Strong et al., 1988) of differing hydrogen clearance reactivities to cortical stimulation to either side of a similarly oriented apparent boundary on the MG in the cat MCAO model and (b) by frequent observation of a sharp interface between normal and acidotic pH on the convexity of MG [frozen coronal section imaging with umbelliferone fluorescence (Strong et al., 1985)]; acidosis is widely regarded as an early change in focal cortical ischemia (Astrup et al., 1977; Gibson et al., 1983; Harris and Symon, 1984; Hossmann et al., 1985; Kim et al., 1985).
Classification of TFDs: their relationship with ischemic brain damage
The restriction of primary decreases in fluorescence after MCAO to the anterior MG in these experiments supports the suggestion of a fundamental difference in the significance of increases versus decreases in fluorescence. Back et al. (1994) have shown small but significant transient increases in local cortical oxygen tension in association with KCl-induced CSD in normally perfused rats, with transient decreases in association with spontaneous TFDs following MCAO. It seems most likely that both methods detect the same phenomenon, with the substantial advantage for the imaging method of a spatial dimension.
Nedergaard and Hansen (1988) showed that CSD in the normally perfused rat brain is not associated with ischemic cell change, and several authors (Nedergaard and Astrup, 1986; Strong et al., 1988; Mies et al., 1993; Nedergaard and Hansen, 1993; Back et al., 1994; Gido et al., 1994) have considered mechanisms whereby CSDs/TFDs occurring during ischemia might cause ischemic cell changes. The use of fluorescence imaging may shed some further light on the TFD/ischemic cell change relationship, since the method distinguishes between TFDs associated with either increases or decreases in fluorescence. Recording of DC potential or changes in Ke cannot distinguish ischemic from “normal” TFDs (although ischemia may be suspected from a delay in clearance) in this way. Thus, we suggest that an increase in fluorescence at the onset of the transient may identify tissue at risk. This hypothesis can be tested by comparing the location of the interface on MG between primary increase and decrease in fluorescence in vivo with the outer border of the definitive histological infarct when evolution is largely complete (in the absence of any intervention or change in blood pressure).
CONCLUSION
The data on cat MCAO topography presented here are intended to illustrate the potential of the method rather than to be definitive, and some further work will be required to confirm the topography and to explore questions and hypotheses arising from these experiments. The fluorescence transients we have observed are capable of propagating across the cortex at a rate similar to that of CSD and show polarity changes that correspond with existing concepts of (a) the effects of cortical depolarization on NADH fluorescence and (b) the cortical pathophysiology of MCAO in the cat. We therefore conclude that the transients described are very likely to indicate the origins (unless in a sulcus) and propagation of transient focal depolarizations.
Footnotes
1
Nomenclature: ![]() have drawn attention to the existence of more than one pattern of time course of the onset of depolarization in the cortex, and cortical spreading depression is thus one specific example of TFD. For the present, we support the use of “transient focal depolarization” as a deliberately nonspecific term and will adhere to it here.
have drawn attention to the existence of more than one pattern of time course of the onset of depolarization in the cortex, and cortical spreading depression is thus one specific example of TFD. For the present, we support the use of “transient focal depolarization” as a deliberately nonspecific term and will adhere to it here.
2
We believe that the observer best assimilates the information from the “pseudomovie,” and we are willing to provide the reader with copy of the material (PAL format) on receipt of a blank VHS tape.
Acknowledgment:
We thank HeadFirst and the MRC (G93/20830N) for their support for this work.