
Abstract
Arterial spin labeling (ASL) sequences that incorporate multiple postlabeling delay (PLD) times allow estimation of when arterial blood signal arrives within a region of interest. Sequences that account for such variability may improve the reliability of ASL and therefore make the technique well suited for future clinical and experimental investigations of cerebral perfusion. This study assessed the within- and between-session reproducibility of an optimized pseudo-continuous ASL (pCASL) functional magnetic resonance imaging (FMRI) sequence that incorporates multiple postlabeling delays (multi-PLD pCASL). Healthy subjects underwent four identical scans separated by 30 minutes, 1 week, and 1 month using multi-PLD pCASL to image absolute perfusion (cerebral blood flow (CBF) and arterial arrival time (AAT)) during both rest and a visual-cued motor task. We show good test-retest reliability, with strong consistency across subjects and sessions during rest (inter-session within-subject coefficient of variation: gray matter (GM) CBF = 6.44%; GM AAT = 2.20%). We also report high sensitivity and reproducibility during the functional task, where we show robust task-related decreases in AAT corresponding with regions of increased CBF. Importantly, these results give insight into optimal PLD selection for future investigations using single-PLD ASL to image different brain regions, and highlight the necessity of multi-PLD ASL when imaging perfusion in the whole brain.
INTRODUCTION
An exciting experimental direction in the field of magnetic resonance imaging (MRI) is toward noninvasive quantification (in absolute units) of physiologic parameters such as cerebral blood flow (CBF), cerebral blood volume, and cerebral metabolic rate for oxygen. Magnetic resonance imaging-based techniques offer the advantage of comparatively high spatial resolution without the use of ionizing radiation or intravenous contrast agents.
Currently, measurements of cerebral blood volume and cerebral metabolic rate for oxygen are possible but are hindered by issues such as poor signal-to-noise ratio (SNR), low temporal resolution, and inadequate statistical modeling.1,2 However, recent advances in both scanner hardware and pulse-sequence design have greatly improved the utility of arterial spin labeling (ASL); a technique that uses the magnetization of arterial blood water as an endogenous contrast agent for the quantification of CBF.3,4 Arterial spin labeling techniques are attractive to both clinical and experimental studies as they offer the ability to investigate long acting cognitive and physiologic states (not possible with blood oxygen level dependent techniques), and to complete multiple repeat scans (e.g., follow-up investigations, longitudinal designs, and pharmacological trials) without cumulative risk to the subject. In particular, pseudo-continuous ASL (pCASL) provides high labeling efficiency and SNR without the need for custom hardware. 5
Arterial spin labeling has been shown in resting studies to be reproducible and in functional studies to reflect activation patterns similar to blood oxygen level dependent techniques, although with potentially better specificity and colocalization between subjects (due to less intersubject variability).6,7. In addition, CBF-based measurements are more localized to the relevant parenchyma than the blood oxygen level-dependent effect.6,8 While the exact dynamic relationship between neural function and CBF is not yet well known, considerable evidence suggests that imaging CBF alone offers a strong correlate of brain function.9–11
While it has been shown that ASL provides an effective tool for rapid and safe estimation of blood flow in resting, task-related, and pharmacological functional MRI (FMRI) studies;4,12,13 only a few studies have investigated how reliable these measures are and fewer still have looked at ways to improve this. For example, continuous ASL (CASL) techniques have been shown to be accurate and highly reproducible within 1-hour 14 and 7-week timeframes. 15 When compared with pulsed ASL (pASL) and CASL, pCASL is shown to be the least variable.16–18 Longitudinal repeatability of pCASL has also been validated for neuro-developmental studies in children. 19
Arterial spin labeling sequences that incorporate multiple postlabeling delay (PLD) times allow estimation of when blood signal arrives at the voxel of interest; 20 a feature that is known to vary spatially according to position within the vascular tree. Sequences that account for this variability in arterial arrival time (AAT) can be used to improve the reliability of ASL; thereby supporting its use to image more complex conditions where cerebral perfusion may be undermined by a particular pathology. 21 Recent work supports this by showing that: (1) it is possible to account for heterogeneity in AAT by incorporating multiple PLDs;22,23 (2) acquisition of multiple PLDs improves the accuracy of CBF quantification by facilitating the removal of the macrovascular component of the ASL signal. 24
At present, no study has assessed the within- and between-session reproducibility of multi-PLD pCASL. Given the potential relevance of this technique for longitudinal studies and assessment of drug efficacy or long acting cognitive and physiologic states, we suggest this is an important initial investigation of the method with a view toward improving its experimental and clinical utility.
The primary aim of this study was to assess whether a multi-PLD pCASL sequence is a reliable method for imaging absolute perfusion across a whole brain volume during rest versus a visual-cued motor task. The secondary aim of this study was to measure the across-subject and across-session variability in both whole brain gray matter (GM) and a number of key brain regions.
MATERIALS AND METHODS
Subjects
Variability of multi-PLD pCASL was assessed at three imaging sessions completed on eight healthy subjects (six male, two female age (mean ± s.e. m.) = 28.3 ± 2.5) at the FMRIB Centre, University of Oxford, John Radcliffe Hospital, Headington, UK. Subjects were asked to abstain from caffeine for 6 hours before each session. In addition to routine screening for MRI contraindications, subjects were also screened to exclude any cerebrovascular disease, neurologic/psychiatric disease, and use of medication that could interact with blood flow. All procedures described were performed under an agreed technical development protocol approved by the Oxford University Clinical Trials and Research Governance office, in accordance with International Electrotechnical Commission and United Kingdom Health Protection Agency guidelines.
Study Design
Subjects were scanned on three separate occasions, separated by 1 week and 1 month, respectively. Session 1 consisted of two repeat runs of the experimental protocol, separated by a 30-minute rest period; while sessions 2 and 3 had only a single run (Figure 1). The protocol consisted of a 6-minute resting CBF scan followed by a 6-minute OFF/ON visual-cued motor task (8 Hz flashing checkerboard with combined finger-tapping)—alternating 1-minute ON and 1-minute OFF. The majority of scans took place between 8 am and 12 pm to minimize diurnal variation, which can affect CBF values. 25
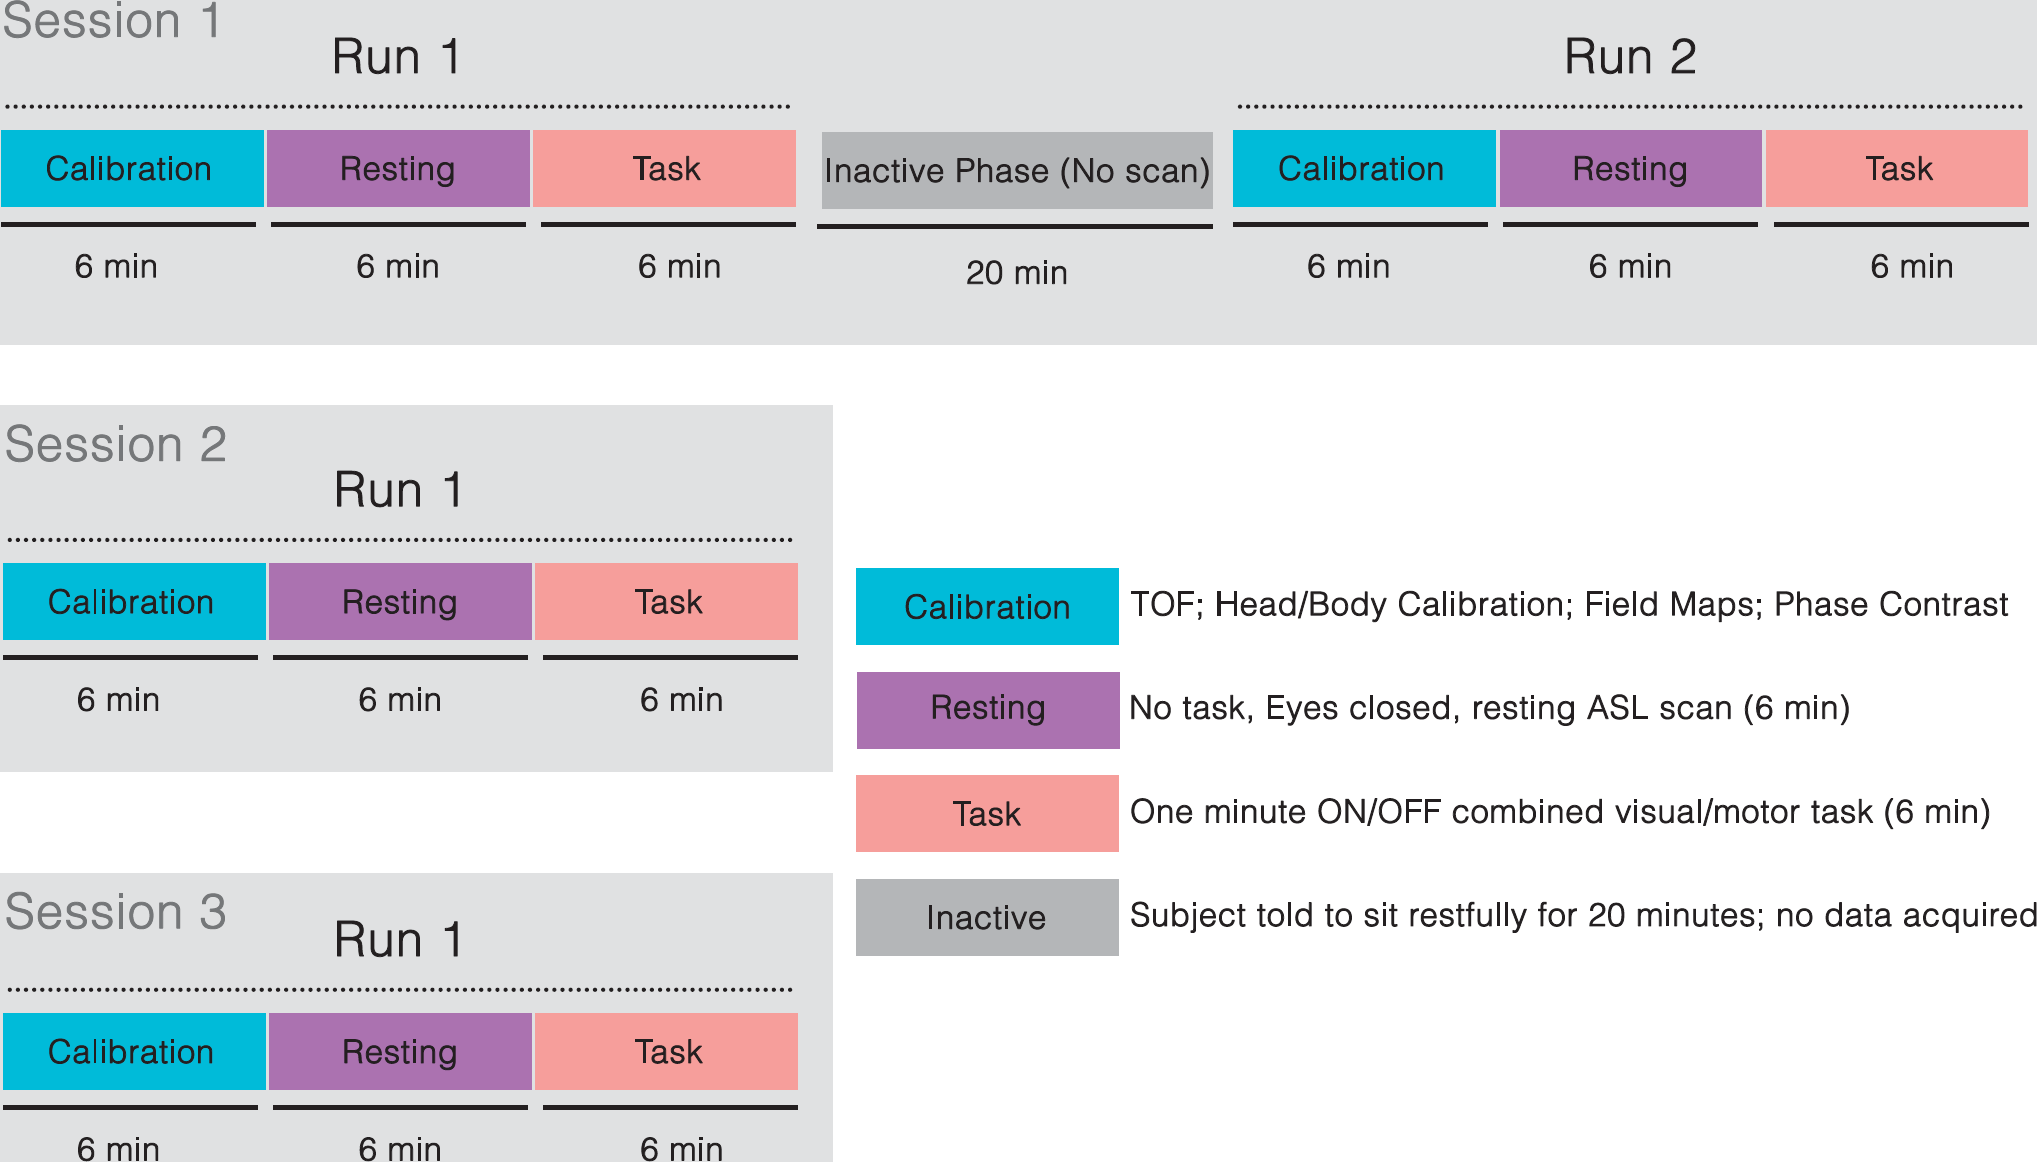
A schematic of the experimental design used. Session 1 consisted of two repeat runs of the experimental scans. Runs 1 and 2 were separated by an inactive rest block. Session 2 was completed 1 week later. Session 3 was completed 1 month later.
Magnetic Resonance Data Acquisition
All subjects were scanned using a Siemens 3T Verio whole-body MR scanner (Erlangen, Germany) equipped with a 32-channel head coil and a body coil. We used a pCASL pulse sequence 5 in a modified protocol for image acquisition. A time-of-flight MR angiography neck scan was acquired approximately 8 cm below the circle of Willis to visualize the brain's feeding arteries. The labeling plane was aligned perpendicular to the ascending carotid and vertebral arteries. The location of the plane was normalized to a point between the curvatures of the vertebral arteries, where all feeding arteries ran parallel in a transverse plane. B0 shimming 26 was performed over the imaging region and the labeling plane to minimize off-resonance effects.
We used a pCASL acquisition sequence with background suppression as described previously. 27 Images were acquired in separate consecutive blocks, each composing six different postlabeling delays: 0.25, 0.5, 0.75, 1, 1.25, and 1.5 (seconds). A labeling duration of 1.4 seconds was used. The selected range of PLDs encompasses those that are commonly used in the literature for both single and multi-PLD ASL approaches, as was recently validated for use in human subjects to adequately model kinetic curves for all voxels across a whole brain volume. 27 Other imaging parameters were single shot gradient-echo echo-planar imaging, repetition time = 4 seconds, echo time = 13 ms, Partial Fourier = 6/8ths field of view = 220 × 220, matrix = 64 × 64, 24 sequential ascending slices (no slice gap), slice thickness = 4.95 mm, slice acquisition time = 45.2 ms. For each scan, 96 volumes (control and tag) were acquired, corresponding to 6.4 minutes of scanning. Data were grouped for analysis in an epochwise manner. Each epoch consisted of 12 consecutive control/tag images from the full range of 6 different PLDs. Therefore, 8 epochs were generated from the 96 volumes acquired.
A reference calibration image (no labeling or background suppression, repetition time = 6 seconds, all other parameters identical to pCASL scan) was also collected to enable the estimation of the equilibrium magnetization of blood. A second calibration image of the same prescription was collected using the body coil for signal detection. This body coil calibration scan was used to correct the pCASL data for the uneven sensitivity profile of the 32-channel head coil. 18 A T1-weighted structural image was acquired for tissue segmentation and registration purposes. We additionally acquired a phase contrast angiography image (repetition time = 72.9 ms, echo time = 4.82 ms, field of view×240 × 240, matrix = 128 × 128, slice thickness = 5mm, flip angle = 15 degrees, velocity encoding = 100 cm/s) in the same position as the labeling plane to assess blood flow velocity and inversion efficiency, 28 and corresponding B0 field map images to correct for echo-planar imaging distortion effects.
Data Processing
FSL (FMRIB Software Library, Functional Magnetic Resonance Imaging of the Brain Centre, Department of Clinical Neurosciences, University of Oxford, Oxford, UK, http://www.fmrib.ox.ac.uk) and Matlab (Mathworks, Natick, MA, USA) were used for offline data processing.
Prequantification Processing
All raw ASL data collected from each subject were stripped of non-brain structures using BET; 29 and motion corrected using MCFLIRT. 30 Pairwise subtraction of ‘tag’ and ‘control’ images was performed on the data to generate perfusion-weighted images.
Quantification of Cerebral Blood Flow
All related data processing steps essential for quantification of CBF including tissue segmentation, estimation of equilibrium magnetization of blood (M0b) from the mean CSF (cerebrospinal fluid) magnetization (M0csf) images, and generation of absolute CBF in physiologic units (mL blood/100 g tissue/60 seconds) were completed using FSL tools. For a detailed explanation of the processing performed to obtain quantification of CBF, CBF uncertainty and AAT from the pCASL data please refer to (ref. 27).
Briefly, quantification of absolute blood flow requires estimation of the equilibrium magnetization of arterial blood. To do this, we divided the head and body coil images to generate a coil sensitivity map. This map was then used to correct the reference image and the pCASL data before CBF quantification to correct for the uneven sensitivity profile of the 32-channel head coil. Additionally, a pairwise control minus tag subtraction was performed on the pCASL data to generate a perfusion image at each PLD. The resultant voxelwise concentration-time curves were fitted to the general kinetic model 10 to estimate both CBF and AAT.
Perfusion parameters were quantified using multicomponent modeling with BASIL—a Bayesian inference tool developed for this purpose (http://fsl.fmrib.ox.ac.uk/fsl/fslwiki/BASIL).24,31 BASIL outputs voxelwise estimates of absolute CBF and AAT, as well as a corresponding voxelwise variance map for each parameter. Importantly, these parameters were estimated for each epoch of data (defined as a full set of PLDs), thus generating a time series of absolute CBF and AAT from each acquisition. Eight such epochs were generated from each scan. Please refer to (refs. 24,27,31) for a full description of the variational Bayes approach implemented by BASIL to incorporate prior information about known physiologic parameters (e.g., tissue and blood T1) and varying parameters (i.e., postlabel delays) to improve CBF estimation.
Postquantification Processing
Statistical Analysis
Within- and across-subject variation was calculated using IBM SPSS Statistics, version 18 (IBM, Armonk, NY, USA). This was assessed for GM, four major lobes (frontal, temporal, parietal, and occipital) and a selection of brain regions bilaterally (insula cortex (INS), thalamus (THA), caudate (CAU), and putamen (PUT)) using masks generated from FAST,
34
and the Montreal Neurological Institute Structural Atlas (thresholded at
Repeatability of Resting Measures
We assessed repeatability of resting physiologic variables using three separate methods: evaluating within-subject coefficients of variation (wsCV) and intraclass correlations (ICCs); analyses of variance (with pairwise

(where BMS is between targets mean square, EMS is error mean square, and
Intraclass correlation values range from 0 to 1: we designate ICC values <0.4 as poor, 0.4 to 0.59 as fair, 0.60 to 0.74 as good, and >0.75 as excellent. 37 These denotations do not account for confidence intervals so must be interpreted cautiously.
To investigate type I error inherent in the technique, we performed repeated-measures analyses of variance and paired comparisons (Student's paired
Repeatability of Task Measures
Type II error was assessed across all scan sessions by evaluating CBF percentage change between task and rest blocks in an
We assessed repeatability of task measures by performing analyses of variance and paired t-tests between run-wise and session-wise absolute CBF changes (ΔCBF) and AAT changes (ΔÁT) from each ROI. Anatomic ROIs were derived from the Harvard-Oxford Atlas in FSLTools (thresholded at
Optimization of Postlabeling Delay Selection
To assess the utility of our selection of PLDs in the context of single-PLD experiments, we calculated an optimization metric (γ) that reflects how well CBF measures are observed across the whole brain.
For single-PLD studies, in order for the measured signal to reflect CBF, the AAT must be shorter than the PLD—i.e., tagged blood must arrive at the ROI before imaging. Because a fixed calculation is used to fit the peak magnetization of arterial signal within a given voxel in multi-PLD analysis, we could assess the ability of a given PLD to accurately estimate CBF by comparing the estimated AAT with the delay time between tagging and imaging (PLD+slice acquisition time; slice dt):

(where AAT = arterial arrival time; PLD postlabeling delay; z = number of slice acquired in ascending order; slice dt = acquisition time per slice).
Regions where γ>0 indicate when slice acquisition begins before the AAT; while γ<0 reflects areas within which acquisition occurs after AAT. We assume that the most optimized setting for SNR would be when the time it takes for arterial signal to arrive at a voxel is equal to the PLD (i.e., γ = 0). For CBF signal, the most optimized setting is where γ≤0 as this ensures adequate blood arrival. Calculation of the optimization metric (γ) is useful as it informs selection of PLDs for whole-brain multi-PLD studies. It also can be used to select an appropriate PLD for use in single-PLD pCASL experiments to maximize signal in a given brain region. To illustrate this point, we plotted ROI-specific histograms of the percentage of voxels observed to have γ<0 for each PLD used in the paradigm (Supplementary Figure 3a and c). Regional masks were generated from the Juelich, Montreal Neurological Institute, and Harvard-Oxford Subcortical Atlases (
RESULTS
Before reporting the absolute perfusion data, we checked that the M0b values generated from the absolute quantification processing steps were reliable. Because the M0b is an essential variable from which the relative perfusion data are scaled into physiologic units, it is essential for this to be reliable for each subject at each scan session. We report that the wsCV for M0b during the week and month repeat scans was 3.45% and 2.42%, respectively. The wsCV for all scan sessions was 2.77%.
Repeatability of Resting Physiologic Measures
Average CBF and AAT values from all ROIs are shown in Supplementary Tables 1 and 2. We see heterogeneity in CBF and AAT between subjects and between regions. Bland Altman plots (with 95% confidence intervals) show mean CBF versus the difference in CBF values in selected ROIs (Figure 2). Intrasubject and intersubject repeatability measures (wsCV and ICC) are shown for CBF and for ATT in Tables 1 and 2, respectively. There is evidence of good to excellent reliability (ICC>0.6) and moderate to high reproducibility (wsCV<10%) for most measures.
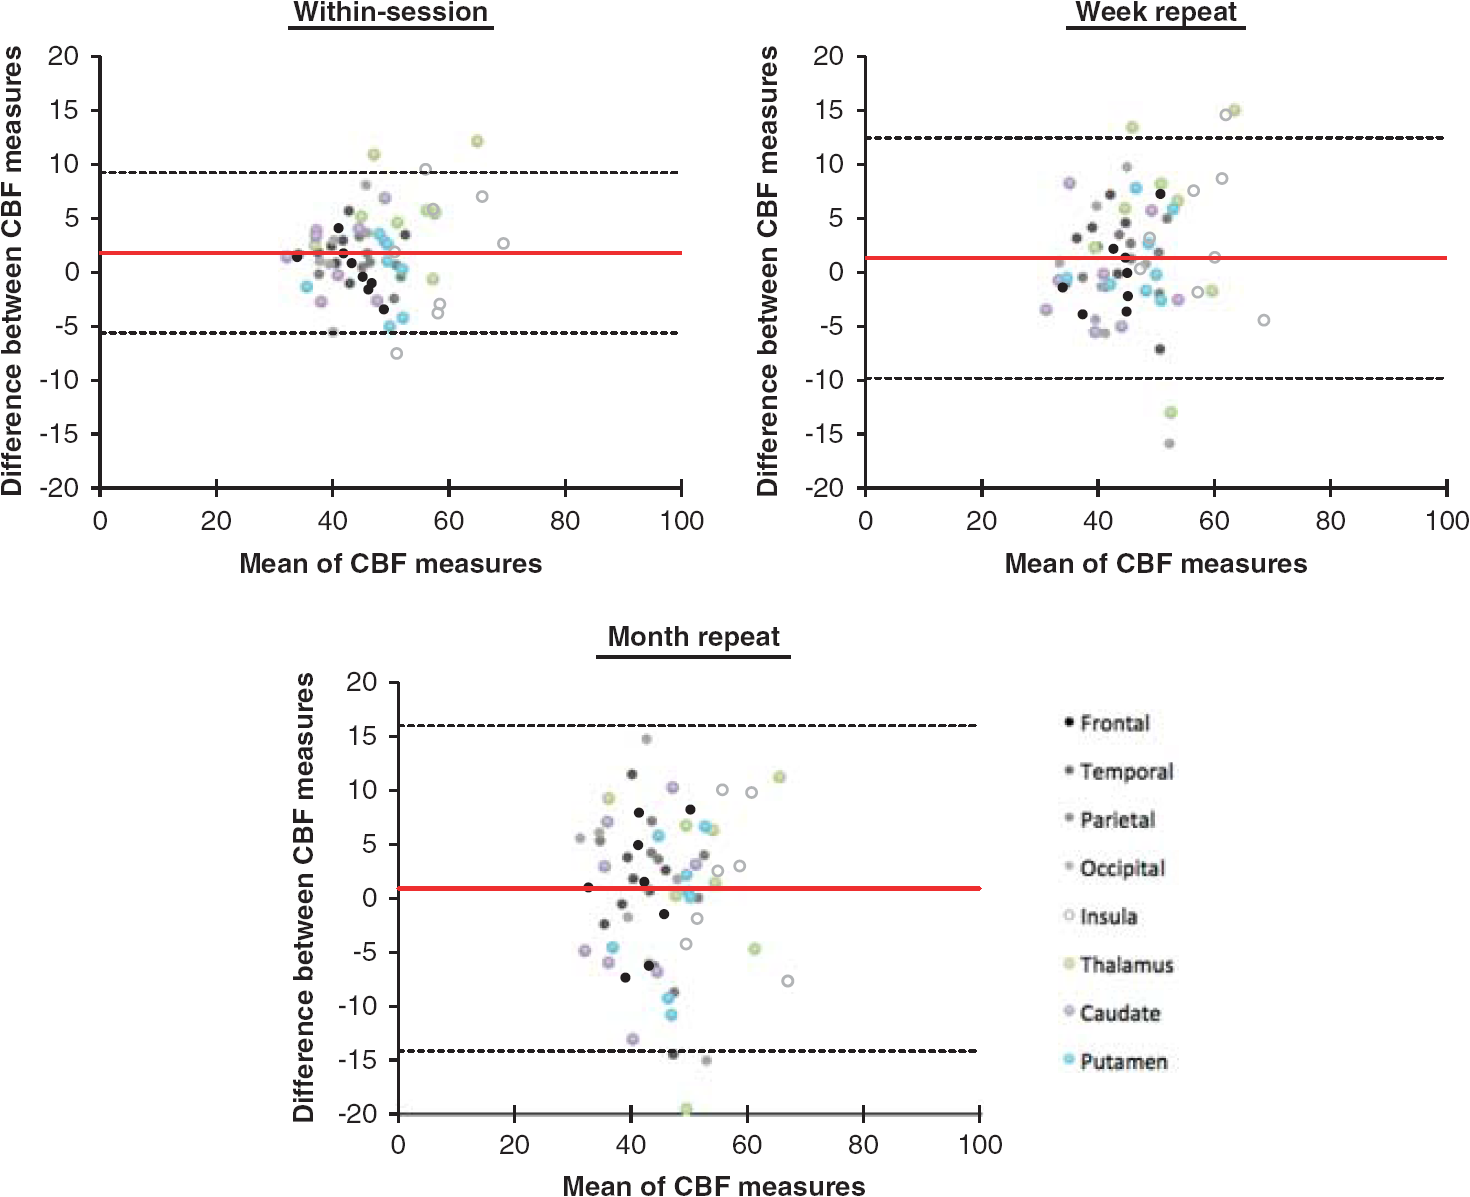
Bland-Altman plots showing repeatability of the absolute cerebral blood flow (CBF) measures (mL blood/100 g tissue/1 minute). The red line denotes the bias from 0, the top and bottom lines in black denote the 95% confidence intervals (bias ±1.96 × s.d.). The difference between measures is always the first session minus the second session. Data shown represent the absolute CBF values from eight representative brain regions for all eight subjects.
CBF reproducibility measures for key ROIs across repeat sessions
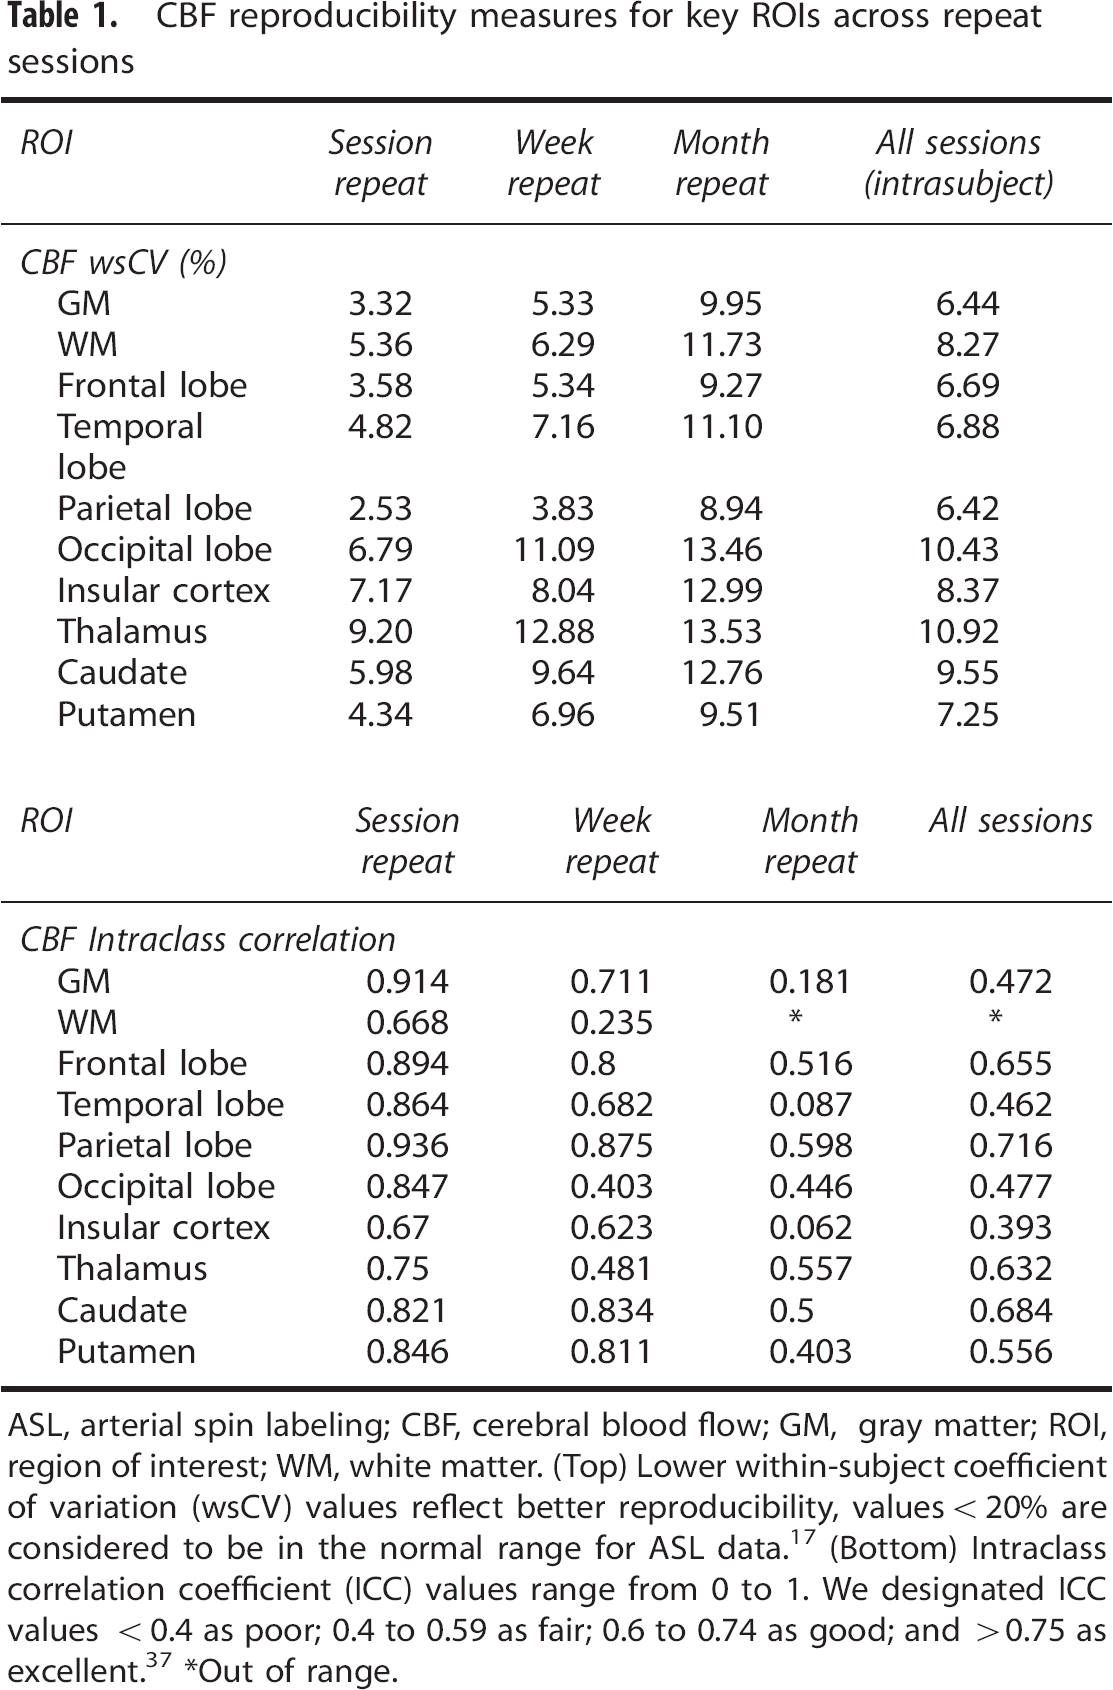
ASL, arterial spin labeling; CBF, cerebral blood flow; GM, gray matter; ROI, region of interest; WM, white matter. (Top) Lower within-subject coefficient of variation (wsCV) values reflect better reproducibility, values <20% are considered to be in the normal range for ASL data. 17 (Bottom) Intraclass correlation coefficient (ICC) values range from 0 to 1. We designated ICC values <0.4 as poor; 0.4 to 0.59 as fair; 0.6 to 0.74 as good; and >0.75 as excellent. 37 *Out of range.
AAT reproducibility measures for key ROIs across repeat sessions
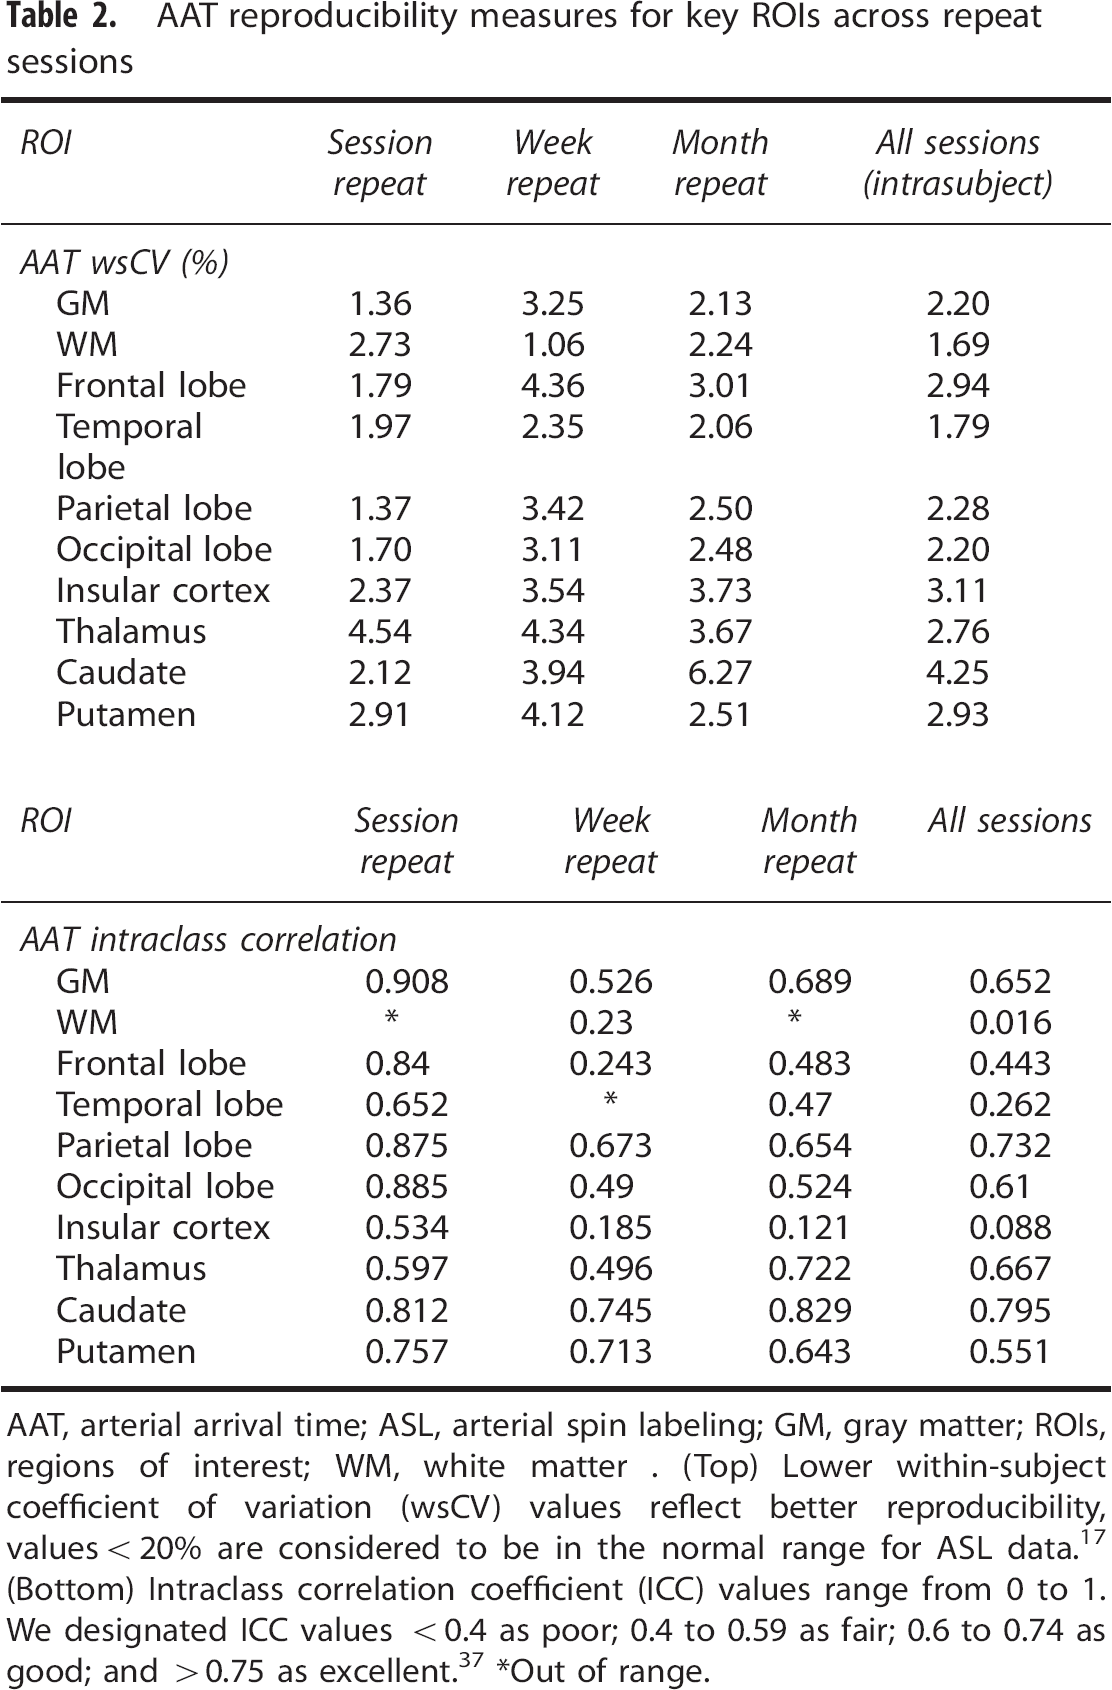
AAT, arterial arrival time; ASL, arterial spin labeling; GM, gray matter; ROIs, regions of interest; WM, white matter. (Top) Lower within-subject coefficient of variation (wsCV) values reflect better reproducibility, values <20% are considered to be in the normal range for ASL data. 17 (Bottom) Intraclass correlation coefficient (ICC) values range from 0 to 1. We designated ICC values <0.4 as poor; 0.4 to 0.59 as fair; 0.6 to 0.74 as good; and >0.75 as excellent. 37 *Out of range.
Repeatability measures are shown to be stronger with shorter interscan intervals. For example, wscV for GM CBF ranged from 3.37% within session to 9.95% for a month repeat scan while ICC ranged from 0.914 to 0.181, respectively. Cerebral blood flow and AAT reliability measures also showed heterogeneity between different ROIs: for CBF, white matter (ICC: 0 to 0.668) and the insula cortex (ICC: 0.06 to 0.67) showed the least reliability while the thalamus (wsCV 9.2% to 13.53%) and the occipital lobe (6.79% to 13.46%) showed the poorest reproducibility. Arterial arrival time repeatability analyses showed uniformly lower wsCV values (<5%) in comparison with CBF, indicating better reproducibility.
In 1 × 3 ANOVAs testing the effect of session on extracted CBF and AAT values, there was no significant difference between any of the tested regions (
In a voxelwise ANOVA comparison of sessions, there was no significant effect of session on voxelwise CBF across the whole brain (mixed effects, cluster corrected,
Repeatability of Cerebral Blood Flow Response to Active Task
Figure 3 shows brain regions that respond significantly (increased CBF) to the visual-cued motor task for all runs. For all task ON blocks, in all sessions, we report the power (1-β; ON versus OFF) for signal change in the anatomic V1 as greater than 0.9. For all functional masks, the power is approximately equal to 1. The mean task-induced % changes in CBF during ON versus OFF blocks for each run and session are shown in Table 3. We also report significant decreases (
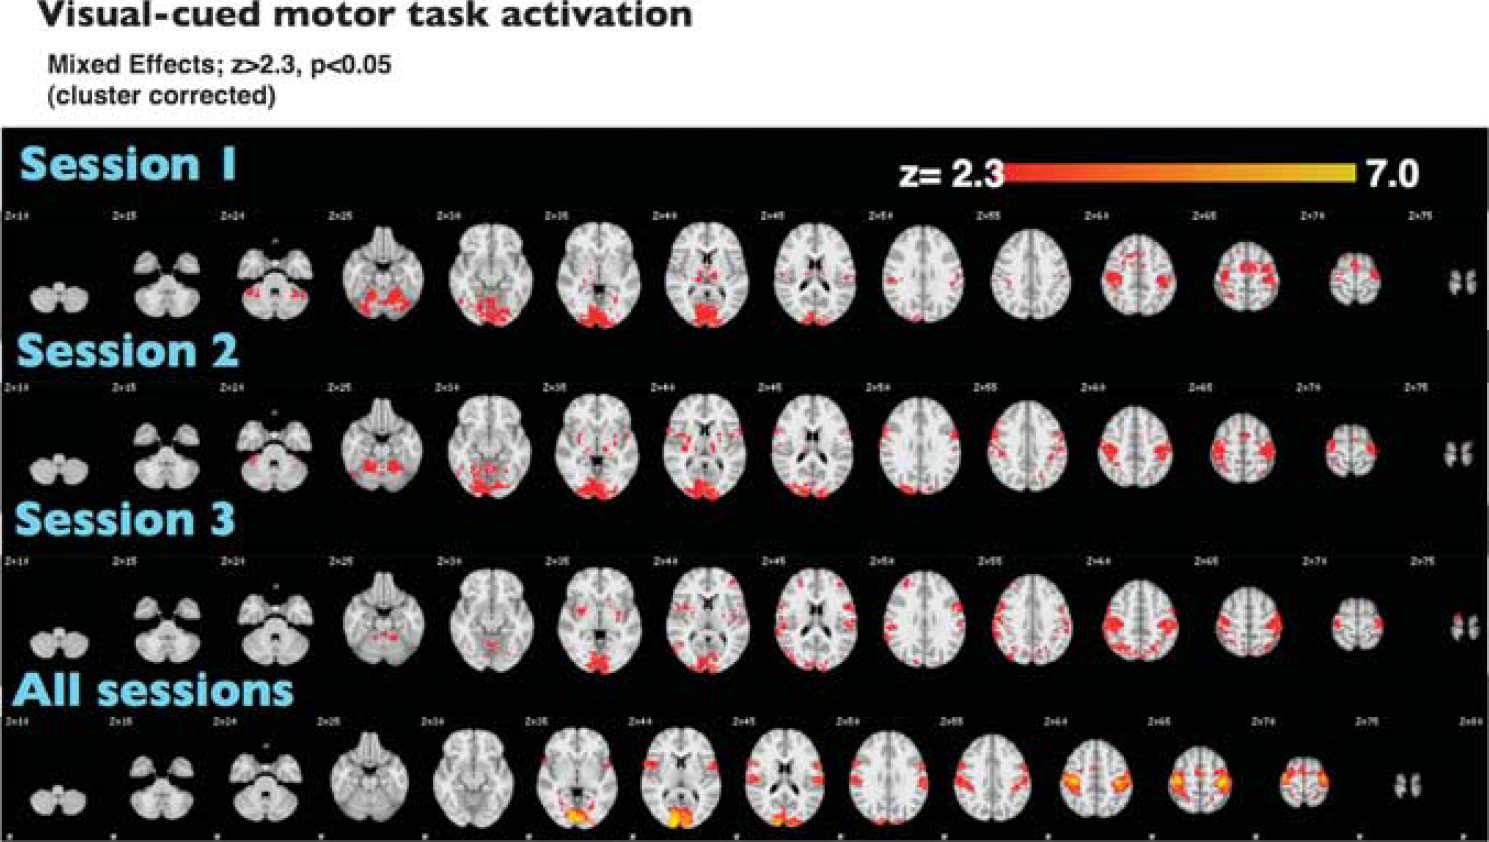
Hyperperfusion during visual-cued motor task. Statistical maps represent voxels with suprathreshold activation across the group during the task ON versus OFF blocks (mixed effects;
Reproducibility of activation within key ROIs during the visual-cued motor task paradigm
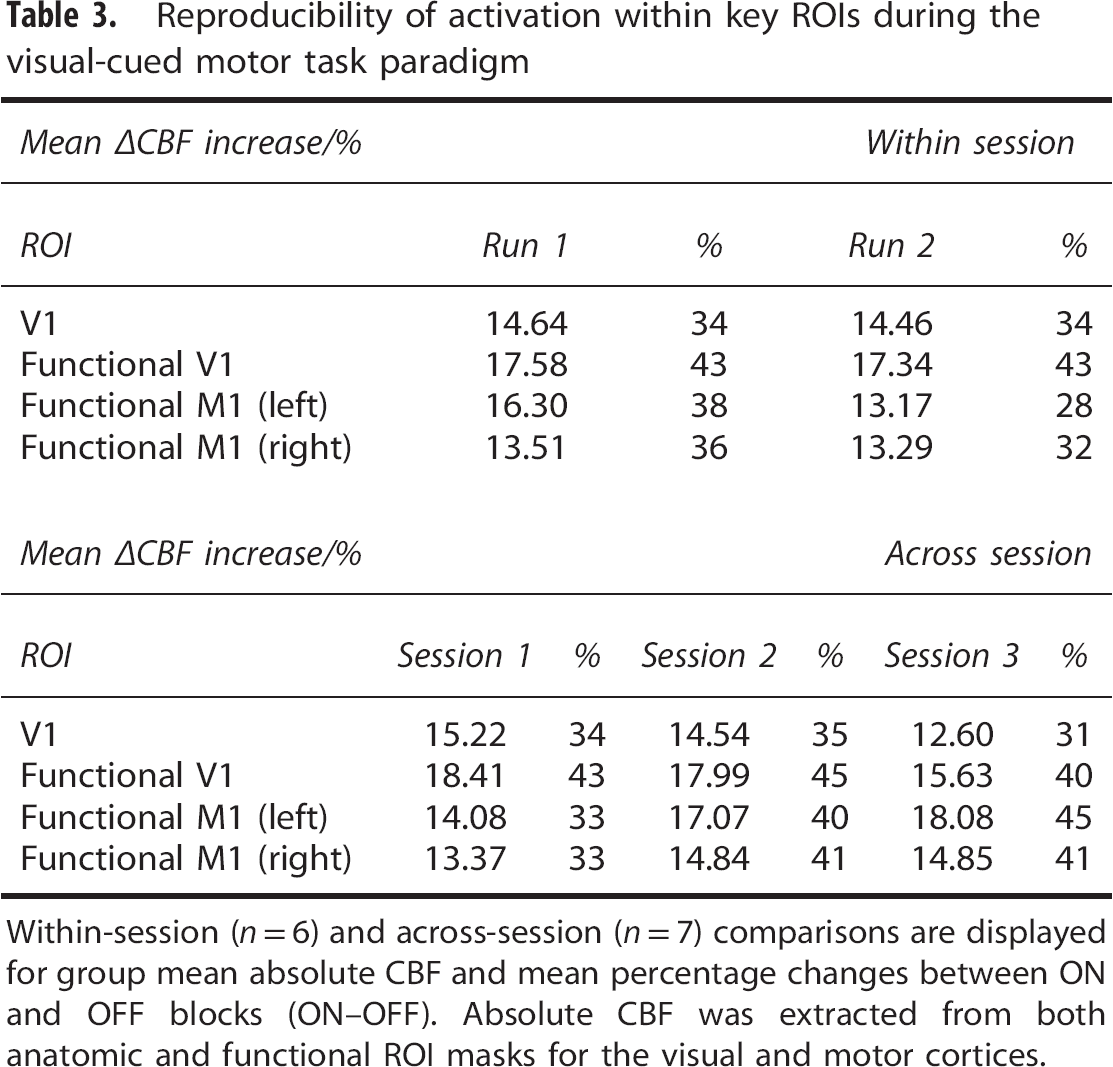
Within-session (
Comparisons of extracted ΔCBF and ΔÁT from both within and across sessions showed no significant differences in either the anatomic or the functional ROIs (CBF, within-session Student's
Optimization of Postlabeling Delay Selection
Figure 4 shows PLD benefit values (γ) mapped onto a standard brain for each individual PLD selected. Most cortical regions have been adequately perfused by labeled blood with a PLD of 1 second, although many inferior regions are maximally perfused subsequent to this. Regions where γ>0 indicate when slice acquisition begins before the AAT (red); while γ<0 reflects areas within which acquisition occurs after AAT (blue).
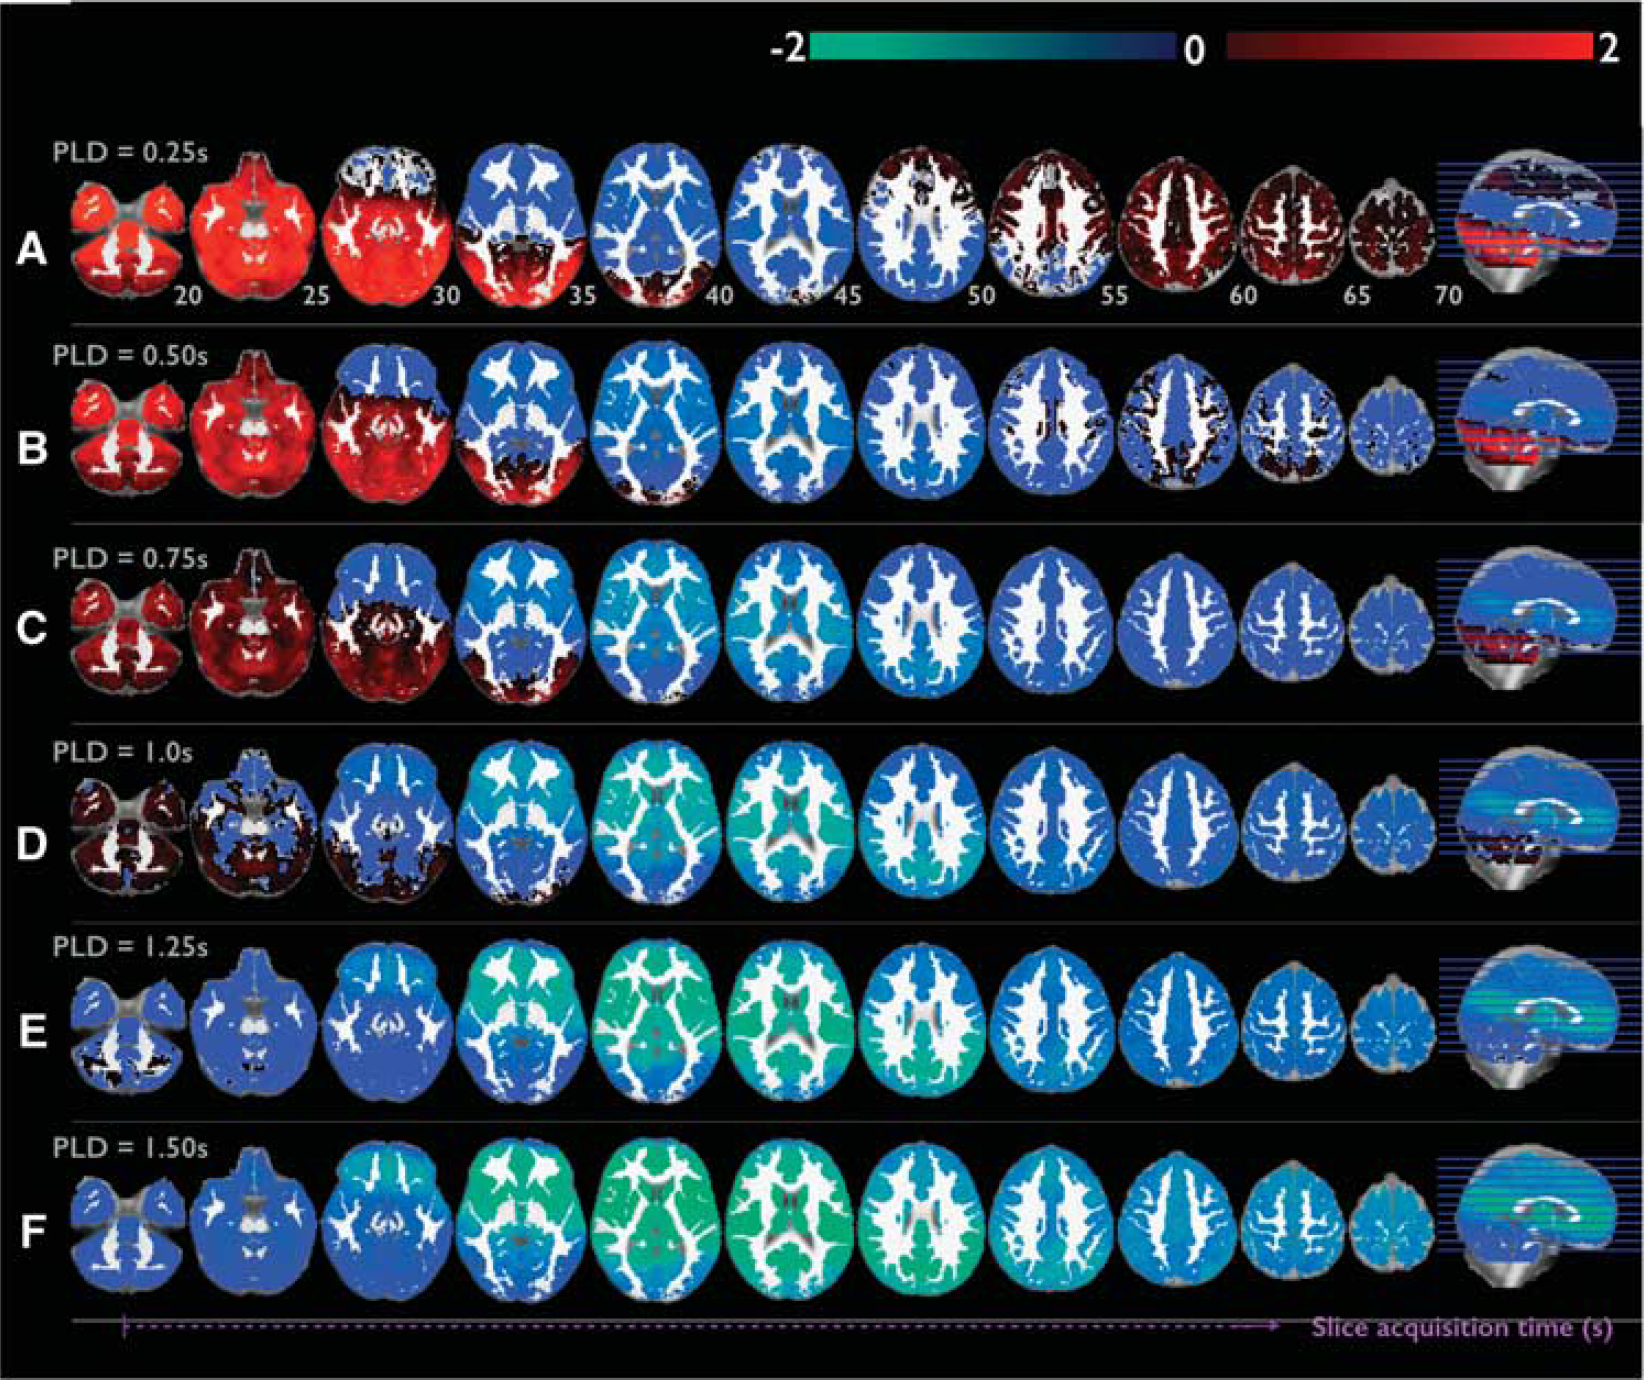
Optimization of postlabeling delay (PLD) selection based on the cortical region location. PLD values: A 0.25, B 0.5, C 0.75, D 1, E 1.25, and F 1.5. Here, extent of ASL signal optimization is assessed for each PLD. The optimization metric (γ) is generated by calculation of the relationship between AAT, PLD and the slice being imaged at a particular time (Equation 1). To note, a given PLD defines the time at which the first, most inferior lying slice is acquired. Subsequently, slices are acquired in sequential ascending order at a time
Histograms illustrating the optimal PLD (where most voxels have values close to zero, thereby optimizing both signal-to-noise ratio and contrast-to-noise ratio) for given ROIs are shown in Supplementary Figure 3. For single-PLD studies using such a protocol, we suggest the optimal PLD selection to be 0.5 for the motor cortex, 0.25 for the insula, and 1 for the amygdala. For multi-PLD experiments targeting these regions, the range of PLDs should therefore be clustered around these optimal values.
DISCUSSION
The results from this study show that the multi-PLD pCASL approach has high test-retest reliability as the data reveal strong consistency across subjects and sessions for key perfusion outcome measures (CBF and AAT). Specifically, we report low variation coefficients, high intraclass correlation coefficients, and good effect specificity in standard GLM-based analyses of the ASL data. Additionally, we successfully validated the reliability of this newly developed tool for assessment of functional tasks; a novel feature that has not been investigated for pCASL imaging to our knowledge. Importantly, the results of this study give insight into optimal PLD sampling schedules across different brain regions for healthy populations and suggest the importance of multi-PLD pCASL for whole brain acquisitions as the single-PLD approach will only be optimal for imaging select regions. Furthermore, in older subjects or patient groups where blood flow may be more variable, the flexibility of the multi-PLD approach will be desirable.
Resting Perfusion Measures Are Reliable and Reproducible
Assessment of CBF across the whole brain shows both the wsCV (%) and the ICC measures to be reliably consistent across session repeats on the same day, a week, and a month later. However, these measures show slight depreciation in exact reproducibility as the duration between scan sessions increases.
Specifically, the data show good to excellent longitudinal reproducibility across most brain regions for both CBF (wsCV = 5.33%, ICC = 0.711 for GM over 1 week) and AAT (wsCV = 3.25%, ICC = 0.526 for GM over 1 week). In general, within-subject repeatability measures less than 20% are suggested to be in the normal range for ASL studies. 17 Previous reports show moderate to good longitudinal reproducibility (ICC = 0.65, wsCV = 14% for GM) for pCASL over a 2- to 4-week period in a pediatric cohort; 19 while other studies of week-repeat comparisons report whole brain/regional wsCV to be between 8% and 14%.14,16 The data we report here are consistently within this range or show improved reliability (i.e., values are lower) when compared with previous investigations of the same session comparisons.
We find no differences in session-wise ANOVAs for extracted data and voxelwise GLM analyses. While this may be due to a lack of adequate sensitivity to any differences, it can also indicate sufficient specificity for the technique across 1-week and 1-month comparisons for analogous experimental designs. Interestingly, we show that in a within-session comparison where both runs are separated by 30 minutes, there is a significant decrease in thalamic CBF (Supplementary Figure 1). The thalamus is a key relay center and is an important shared anatomic substrate for both arousal and attentional processes. 38 Given that subjects were lying in the scanner without attending to any task in the intervening period, we suggest that this reduction in thalamic CBF may reflect decreased attentional processing between the early and late scans. This is supported by a lack of significant differences between corresponding CBF responses to the functional task, where attention/arousal is better matched.
These data support the conclusion that the mean variation intrinsic to the technique is lower than what is associated with general physiology for within- and between-session comparisons. Therefore, we conclude that the technique is reliable for use in longitudinal studies over similar timeframes; with the caveat that it is optimally suited for within session or more short-term crossover studies.
Reliability and Sensitivity to Functional Changes in Physiology
We find that the multi-PLD pCASL approach is highly sensitive (power consistently >0.9 in an a priori defined anatomic mask) to functional CBF changes in a salient visual-cued motor task (Figure 3). Importantly, an ANOVA comparing the extracted CBF values and voxelwise cluster corrected statistics maps generated in FEAT reveal no significant run-wise or session-wise differences between functional CBF responses to the task. This suggests that the sensitivity of the technique is reliable and that it can be used to test long (>1 minute) activation states in the context of multiple study visits. To our knowledge, this is the first report of ASL reproducibility of stimulus-induced functional activation. Additionally, we report a significant decrease in AAT within regions that show a significant increase in CBF during the visual-cued functional task (Supplementary Table 3). While the current study is not designed to interrogate the neurovascular dynamics linked to tonic stimulation, these data show for the first time that the multi-PLD pCASL approach is capable of reliably quantifying neurovascular-related signal changes fundamental to FMRI analysis and interpretation. This may facilitate future work in this direction that was previously limited by the nontrivial challenges associated with other commonly used imaging approaches.
Benefit of Multiple Postlabeling Delay Approach to Increase Reliability
A recent study 22 highlights the importance of multiple PLD acquisitions to help account for AAT heterogeneity between subjects and brain regions. Although the acquisition length of the paradigm used in the current study is comparable to similar ASL investigations using single-PLD pCASL sequences, the analysis of the multi-PLD data yields timecourses constituent of only eight epochs of absolute perfusion data (eight absolute CBF data points). Therefore, despite a lower temporal resolution, the multi-PLD approach is of comparable or improved reliability to single-PLD approaches, implying a necessity for less averaging of ASL data over time with the multi-PLD technique. Considering this in the context of the subject-wise and region-wise AAT variability data discussed above, the multi-PLD approach may improve the reliability and specificity of pCASL to estimate absolute perfusion by accounting for bolus arrival time variability across the whole brain volume. A comparison between single-PLD and multi-PLD acquisitions may further clarify these benefits.
Interestingly, we also show that both CBF and AAT reliability decrease as repeat interval time increases. As has been proposed previously, 15 this likely reflects physiologic variability over long time periods rather than increases in measurement error. Values of ICC also show more variability than wsCV in this respect. It should be noted that while wsCV normalizes to the mean and so is unbiased, ICC depends on the ratio of within- to between-subject variance; a feature that can vary significantly between sessions. Nonetheless, we report ICC values that are comparable or improved when considered in the context of previously published pCASL reproducibility studies.19,22
Optimizing Postlabeling Delay Selection for Regions of Interest
Interestingly, when interrogating ASL reproducibility at the level of specific ROIs, the result is slightly more complex. Specifically, both CBF and AAT are reliably reproducible across subjects and, like the whole brain volume data, are most reliably reproducible across runs of the experiment within the same scan session. As above, when the delay between repeat scans increases, the reliability decreases; though the extent of this depreciation is ROI dependent. The insula is shown to have reduced reliability at long intervals compared with other cortical regions, perhaps reflecting its proposed role in dynamic interoception, 40 which is difficult to control for across long time periods. In general, smaller, more subcortical regions appear to show considerably reduced reliability when viewing the month-repeat session comparisons (e.g., amygdala wsCV = 15.0). However, regions like the hippocampus are observed to be more reliably reproducible (e.g., wsCV = 10.1) and approximate what we see within more superior neocortical structures. The exact cause for this is likely to be due to physiologic variables such as CSF and related motion confounds associated with cardiac output and respiration; strong undermining sources of variance that are not easily accounted for with standard FMRI analysis tools currently available. Although regional signal bias correction is incorporated in our analysis pipeline to avoid bias in CBF values across brain regions, there may also be a contribution of intrinsic SNR variation between superficial and deep structures resulting from uneven array coil sensitivity profiles. Future studies looking at imaging these structures with ASL will likely benefit by increasing the population size being scanned while modeling individual subject's physiology (e.g., heart rate and breathing rate) to improve the overall quality of perfusion images collected. It may also be important to tailor the PLD selection to the brain region being investigated.
To explore this possibility, we analyzed the voxelwise PLD efficiency at each chosen PLD across a number of ROIs. A region is said to have an SNR-optimal PLD selection if its AAT corresponds closely with the time of imaging (γ = ∼ 0) (Figure 4 and Supplementary Figure 3). For single-PLD studies, γ<0 is needed to ensure adequate blood arrival before image acquisition. It should be noted that the optimization values we report are specific to our sequence and protocol as they depend on variable imaging parameters (e.g., slice timing). We show that there is regional heterogeneity in efficiency across the brain (particularly in the superior-inferior domain) for different PLDs. However, most regions of the brain reach peak ASL signal within a 1-second PLD —this corroborates similar findings in healthy subjects using an adaptive sequential design strategy that modifies the optimal sampling time regionally in real time. 39
These findings suggest that PLD selection for single-PLD studies should be optimized depending on the ROI. In the case of a whole-brain acquisition, a multi-PLD approach may be better suited to account for regional heterogeneity. In the context of a functional experiment in a healthy cohort, arrival time decreases during regional activation (Supplementary Table 3), making a single-PLD approach suboptimal. In such studies, it may also be appropriate to narrow and center the PLD range around 1 second, allowing better sampling of the kinetic curve or reduction in the number of PLDs to improve temporal resolution.
Limitations
As with any exploratory investigation of a novel imaging modality, there are a number of limitations we must address. First, we tested a small cohort that was scanned multiple times using the same MRI scanner. The next step will be to repeat this type of investigation with a larger cohort of subjects scanned on different 3T scanners as was done for single-PLD pCASL. 17 Also, we used healthy volunteers from a similar age group. However, it is known that cerebral perfusion measured by ASL is influenced by age alongside a number of physiologic variables. 25 It is important to optimize the multi-PLD analysis tools to appropriately model these sources of variance either by modifying the labeling efficiency assumptions or the range of PLDs used. Currently, modeling subject-specific physiologic variation into the calculation of absolute CBF remains difficult given the multi-PLD Bayesian inference approach used. However, tools able to account for intrasubject variability in CO2, blood pressure and cardiac cycle may account for variation in inversion efficiency (i.e., tagging of arterial blood) 28 to improve ASL reliability further. These enhancements may facilitate investigation of patient groups, especially those with cerebrovascular conditions and on medications likely to affect CBF and AAT as well as more complex experimental design paradigms currently outside the realm of the technique.
CONCLUSION
The results from this study show for the first time the utility of using a multi-PLD pCASL imaging approach to reliably image normal human brain function at rest and during a stimulus-evoked functional task. The key benefit of using a multi-PLD approach to ASL is that it allows noninvasive investigation of brain function beyond just relative changes in arterial signal. As the data described here show, the technique is able to reliably observe both AAT and CBF: outcome measures essential for improving our understanding of key features of brain physiology, function, and related pathology. In addition, we show how assessment of these variables across ROIs highlights a number of interesting perfusion features that vary with anatomic location. Preliminary analysis of some of these features suggests that future investigations able to further optimize PLD selection based on anatomy may improve the across-session reliability of the technique for imaging subcortical structures. The data presented here show that this technique is not only robust and reliable but is also a novel alternative to more commonly applied ASL approaches because of the added experimental flexibility the multi-PLD approach offers. We are confident this approach will provide a powerful tool for future functional studies of long activation states, clinical diagnostic approaches, and novel drug development.
Footnotes
References
Supplementary Material
Please find the following supplemental material available below.
For Open Access articles published under a Creative Commons License, all supplemental material carries the same license as the article it is associated with.
For non-Open Access articles published, all supplemental material carries a non-exclusive license, and permission requests for re-use of supplemental material or any part of supplemental material shall be sent directly to the copyright owner as specified in the copyright notice associated with the article.