
Abstract
Cirrhotic patients without overt hepatic encephalopathy (HE) have associated with widespread neuro-psychological impairment. Liver transplantation can restore metabolic abnormalities but the mechanisms are unclear. We investigate brain functional networks after transplantation using resting-state funtional magnetic resonance imaging (MRI). Twenty-six cirrhotic patients without overt HE completed neuro-psychological assessment before and 6 to 12 months after transplantation, and compared with 35 healthy controls. Five major functional brain networks, default mode (DMN), dorsal attention (DAN), executive control (ECN), salience (SN), and primary networks (PN), were assessed. Nodal efficiency and strength in different functional networks were weighed and their interaction metrics displayed. Granger causal analysis between pretransplantation and posttransplantation was performed. Before transplantation, the intrafunctional connectivity was decreased in DMN, DAN, ECN, and SN. After transplantation, cognitive functions improved with increased functional connectivity. The interaction metrics among large-scale networks in patients became similar to healthy controls. The increase in PN affected the decrease in SN, while the increase in DAN forced a decrease in DMN. There was a bidirectional balance between DMN and SN. Dynamic disruptions and reconstruction in intrinsic large-scale networks are associated with parallel patterns of cognitive information processing deficits and recovery. Remapping of SN, DMN, and DAN is essential for restoring cognition after transplantation.
INTRODUCTION
In end-stage liver disease, liver transplantation (LT) is an important strategy to prolong patient survival and improve the quality of life. Impaired cognitive function in hepatic encephalopathy (HE) that causes varying degrees of neurologic deficit 1 can also be greatly corrected after LT. 2 Neuro-imaging in diseases characterized by cognitive decline reveals morphologic changes at different levels, thereby providing a structural basis for the neuro-psychological impairments in HE. 3 , 4 In transplant recipients, the reversibility of several preLT abnormalities5–7 is associated with an improvement in cognitive function.
Although the metabolic component in HE can be corrected with improved liver failure, morphologic changes may be persistent regardless of the outcome of liver function. 8 Interestingly, instead of a full reversal, persistent minimal or subclinical HE can be found postLT. 9 , 10 Therefore, it is questionable whether the brain functional framework that control behavior can recover or be reorganized postLT. Recently, resting-state functional connectivity has been measured using task-independent functional magnetic resonance imaging (MRI) to examine changes in synchronized low frequency oscillations in blood-oxygen-level dependence signal during resting states. These identified functionally interconnected brain regions. 11 Several major networks, including default mode network (DMN), dorsal attention network (DAN), executive control network (ECN), salience network (SN), and primary sensori-motor, visual, and auditory networks network (PN), 12 have been identified. Using resting-state functional connectivity, investigators have also extensively studied the pathophysiology of HE using interregional functional connectivity to correlate the development of HE. 13 , 14 Aside from DMN, 15 widespread changes in cortical and subcortical network connectivity correlated with neuro-psychological impairment are found in patients with HE. 16 Hepatic encephalopathy also modifies the connectivity topologies and their efficiency regardless of local or global functional network, 17 suggesting that network neuro-plasticity may dynamically change established synchronized intranet-work and internetwork modulations.
For patient with liver cirrhosis, there are several important questions. First, how does resting-state functional connectivity extend beyond the DMN to other large-scale networks that constitute the clinical deficits (e.g., executive control and dorsal attention)? 18 Second, if LT fully or partially rebuilds functional cognition processes by rearranging resting-state network, then how is internetwork reorganization established? This study aimed (1) to show a randomization network topological pattern preLT and postLT by implementing a node-based analytical approach 19 that examined crosscorrelations between regions in five major resting-state networks (DMN, DAN, ECN, SN, and PN) and (2) to test the causality relationships among those major networks during recovery of liver function, based on the hypothesis that LT is associated with a reconnection of functional topology between multiple resting-state networks.
MATERIALS AND METHODS
Participants
The study was designed to evaluate manifestations of HE before, and at 6 to 12 months after LT. The diagnosis of cirrhosis was based on a consistent clinical history, radiologic studies, and liver biopsy when available. 4 Initially, 39 consecutive patients with cirrhosis who were evaluated for LT were included. Participants were excluded if they had overt HE. Those with a history of drug abuse, psychiatric or neurologic illness, or head injury, and poor image quality with severe artifacts that might compromise functional image analysis were also excluded.
In all, 26 adult cirrhotic patients without over HE (21 men and 5 women; mean age, 51.1 years; range, 26 to 61 years) were finally included after 13 patients were excluded (overt HE, n = 7 and poor image quality, n = 6). All of the patients underwent laboratory screening on the same day as the MRI scans and neuro-psychological tests.
For comparison, 35 healthy volunteers (25 men and 10 women; median age, 52.4 years; range, 26 to 68 years), without any medical history of neurologic disease, were recruited from the hospital and served as the control group. They received detailed clinical and neurologic examinations on the same day as the MRI scans.
The Chang Gung Memorial Hospital's institutional review board human research committee approved the study. Because the study reanalyzed MRI data from a previous research in which written consent was already given by the patients for their information to be stored and used for research, the ethics committee waived the need for informed consent. All data were analyzed anonymously.
Neuro-Psychological Tests
None of the patients showed signs of overt HE. They were perfectly alert, had no flapping tremor, and were oriented in space, person, and time. Results of the neurologic examination were considered as normal in all cases. The neuro-psychological battery of tests, which focused on attention, execution, speech and language, amnesic and visuo-construction function were assessed by using subtests of Wechsler Adult Intelligence scale-III, 20 Cognitive Ability Screening Instrument, 21 and Wisconsin Card Sorting Test, WCST-64 (Computer Version Scoring Program). 22
Magnetic Resonance Data Acquisition and Preprocessing
Data acquisition. Functional imaging data were acquired using a 3.0 T GE Signa MRI scanner (Milwaukee, WI, USA). Resting-state images from 300 contiguous echo planar imaging whole brain functional scans (repetition time: 2 seconds, echo time: 30 ms, field of view: 240 mm, flip angle 80°, matrix size 64 × 64, thickness 4 mm) were collected. During the resting experiment, the scanner room was darkened and the participants were instructed to relax, with their eyes closed, without falling asleep. A 3D high-resolution T1-weighted anatomic image was also acquired using an inversion recovery fast spoiled gradient-recalled echo pulse sequence (repetition time: 9.5 ms; echo time: 3.9 ms; inversion time: 450 ms; flip angle 20°; field of view 256 mm; matrix size 512 × 512).
Resting-state functional magnetic resonance imaging preprocessing and individual analyses. Before preprocessing, the first 10 volumes were discarded to reach a steady-state magnetization and allow the participants to adapt to the scanning noise. Resting-state functional MRI data preprocessing was then performed using the Statistical Parametric Mapping (SPM8, Wellcome Department of Cognitive Neurology, London, UK; http://www.fil.ion.ucl.ac.uk/spm/) and Data Processing Assistant for Resting-State functional MRI (DPARSF) 23 tools. Head motion of more than 2.0mm maximum displacement in any of the x, y, or z directions, or 2.0° of any angular motion throughout the course of the scan was excluded. Data were also visually inspected for movement-related artifacts. The standard Montreal Neurological Institute template provided by SPM was further used for normalization with resampling to 2mm cubic voxels and a Gaussian kernel of 6mm (full width at half maximum) for spatial smoothing. The waveform of each voxel was finally used for removal of the linear trends of time courses and for temporal band-pass filtering (0.01 to 0.08 Hz) to reduce low-frequency drift and high-frequency physiologic noise.
Network Construction
Nodes and edge definition. Brain networks were constructed at the large scale with nodes representing brain regions and edges representing interregional resting-state functional connectivity. To examine different functional networks interaction, 36 nodes of 5 major functional brain networks (DMN, DAN, ECN, SN, and PN, Figure 1) were selected. 12
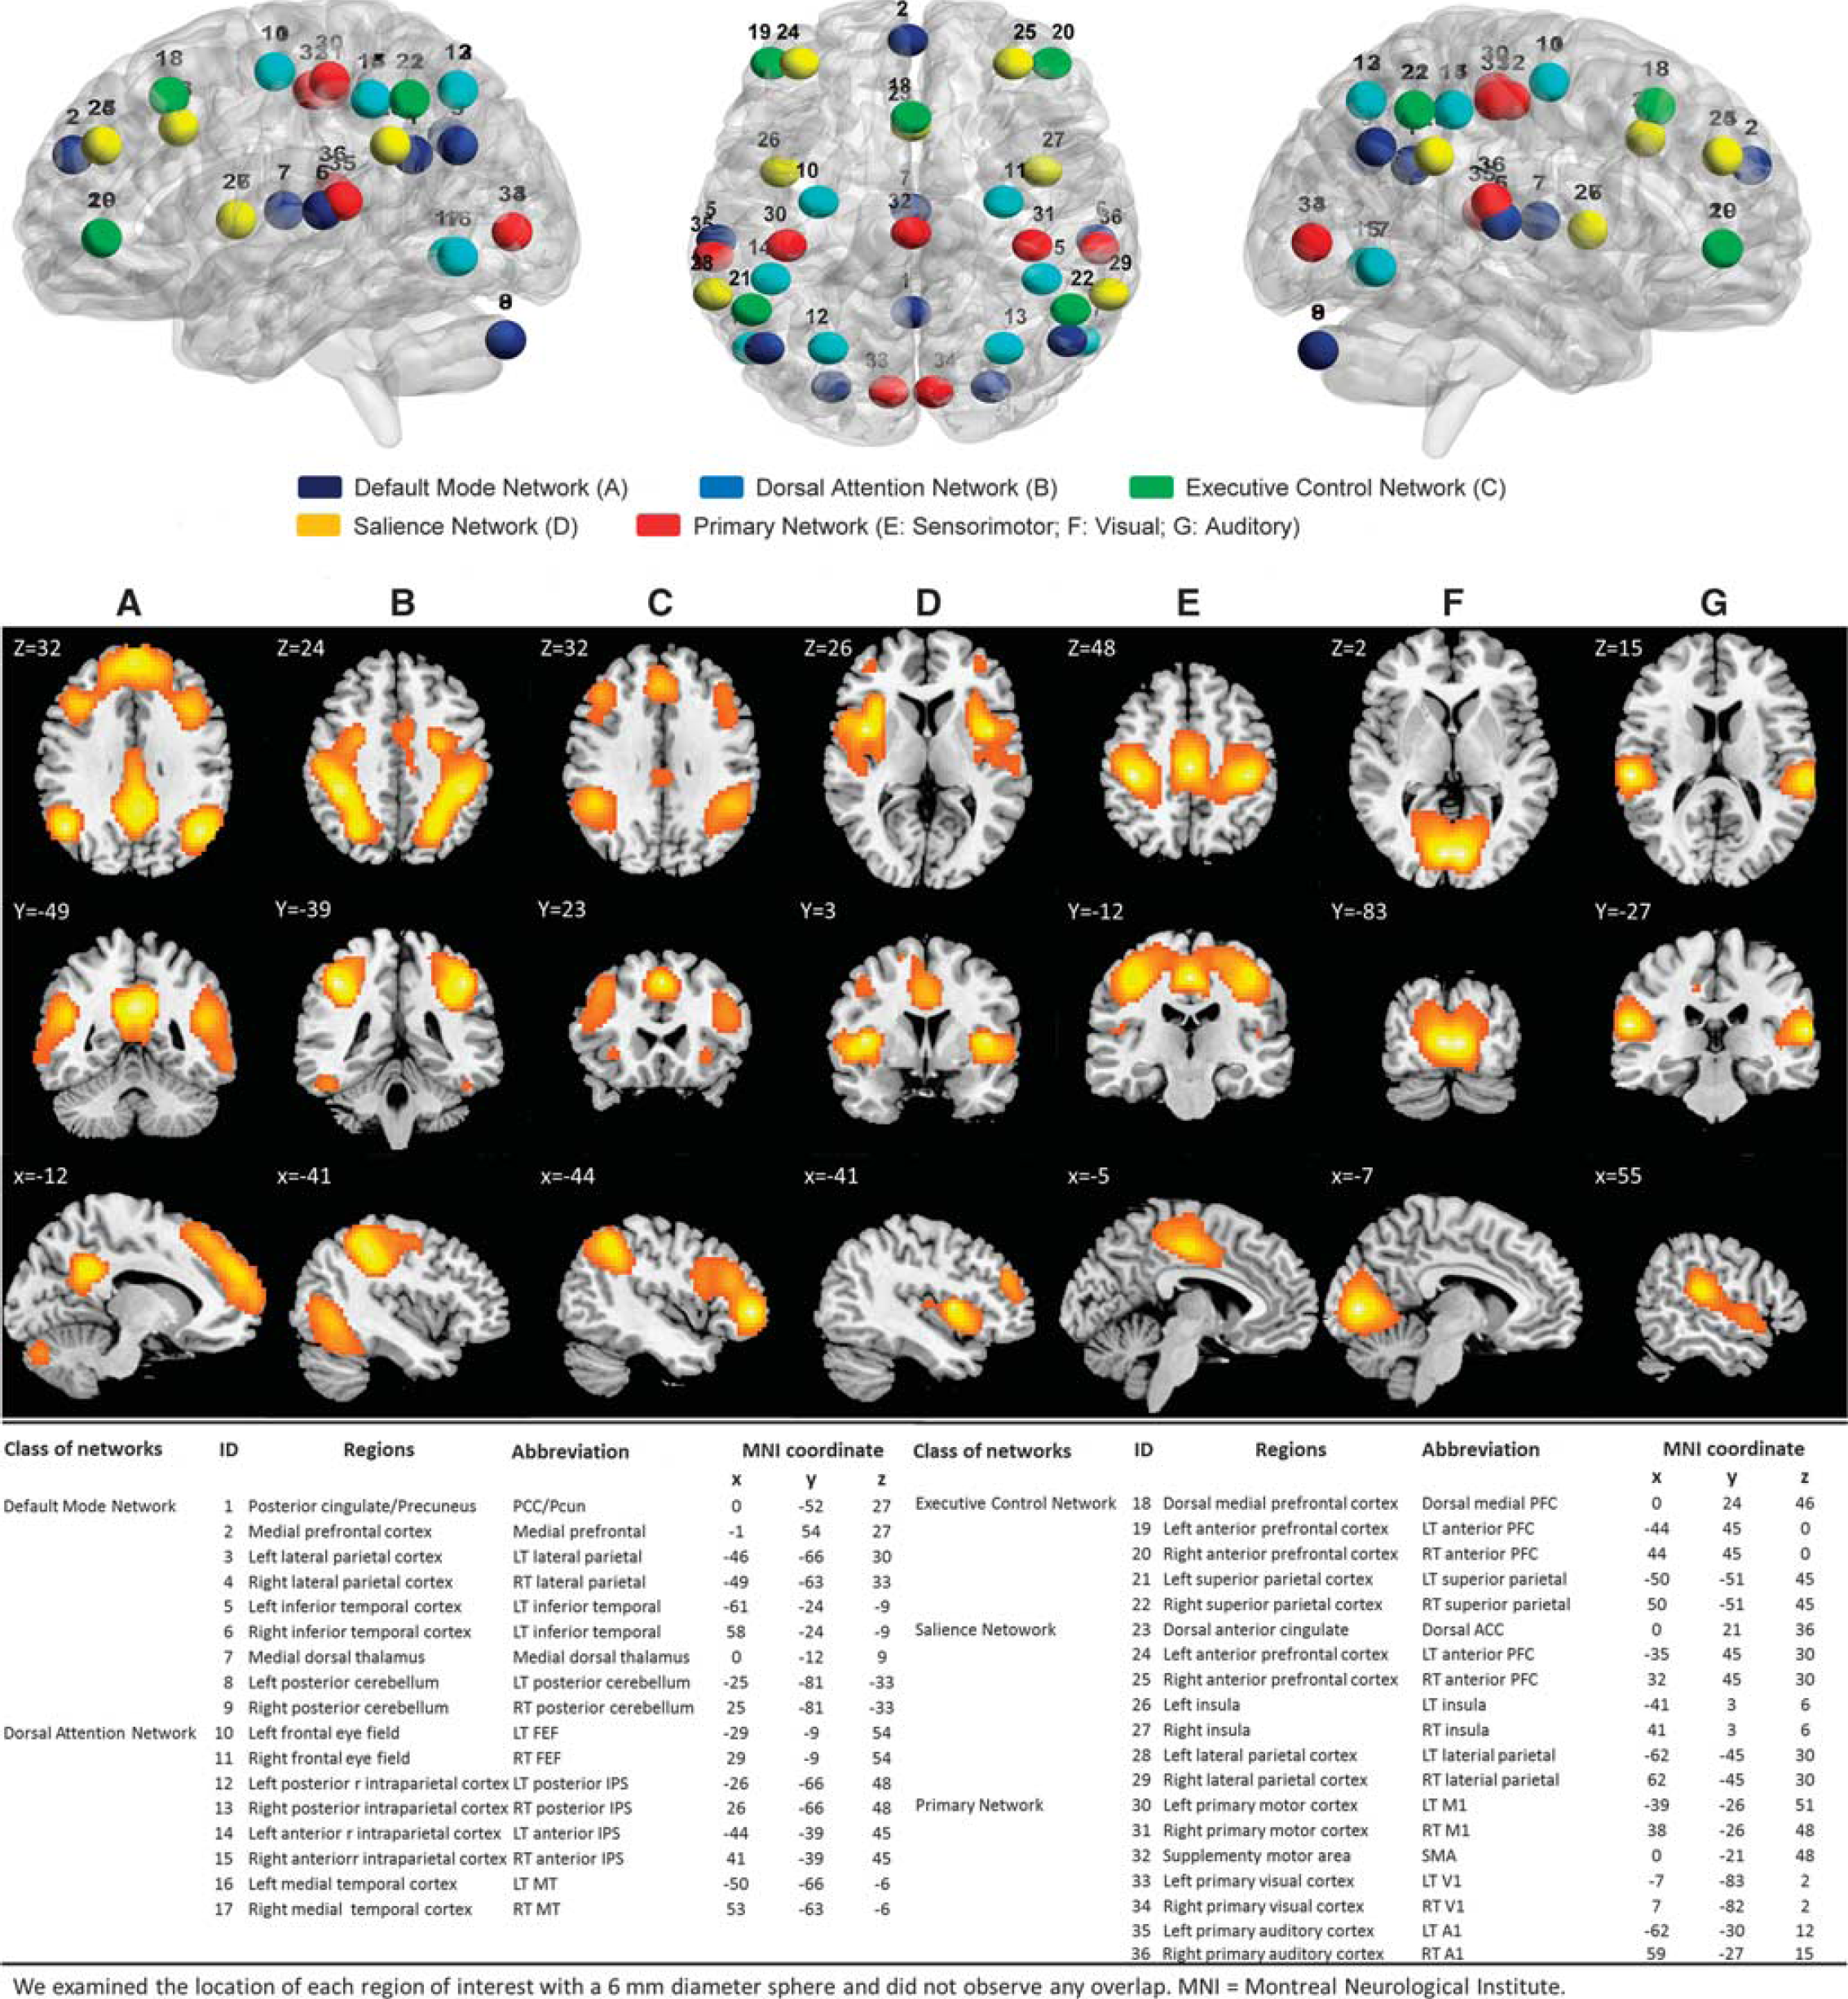
Multiple large-scale cerebral networks can be identified with resting-state functional connectivity magnetic resonance imaging (fcMRI) in healthy controls (n=35) during the normal wakeful resting state. Top row: each color dot represents a seed location; middle row: networks reflect ‘higher-order’ cognitive (i.e., default mode (
Threshold selection. To de-noise spurious interregional correlations, the matrix elements with corresponding P values that passed through a statistical threshold for each correlation matrix were retained, whereas elements were set to zero if their P values did not pass through the threshold. To correct for multiple comparisons, a Bonferroni method was used for P < 0.05.
Network Analysis
To characterize the topological organization of functional networks, both global and regional network measures were calculated. The global measures included several graph measures like global efficiency, local efficiency, shortest path length, clustering coefficient, and small worldness. Regional measures included network strength and regional efficiency. These network measures are described as follows:
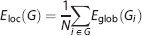
Small-world properties. The small-world network parameters are clustering coefficient (C p ) and characteristic path length (L p ). The clustering coefficient of a node was the ratio of the number of existing connections to the number of all possible connections in the subgraph G i :
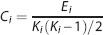
where E i is the number of edges in the subgraph G i . The clustering coefficient of a network was the average of the clustering coefficients of all nodes:

C p is a measure of the extent of the local density of the network.
The path length between any pair of nodes (e.g., node i and node j) was defined as the sum of the edge lengths along this path. The shortest path length, L ij , was defined as the length of the path for node i and node j with the shortest length. The shortest path length of a network (G) was computed as follows:
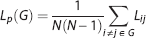
where N is the number of nodes in the network. The L p of a network quantified the ability for information to propagate in parallel.
To examine the small-world properties, the clustering coefficient, C p , and the shortest path length, L p , of the brain networks were compared with those of random networks. This study generated 100 matched random networks that had the same number of nodes, edges, and degree distribution as the real networks.
Furthermore, the normalized shortest path length (Λ) Λ = Lreal p /Lrand p and the normalized cluster coefficient (γ) γ = Creal p /Crand p were computed, where Lrand p and Crand p were the mean clustering coefficient and the mean shortest path length of 100 matched random networks. A real network was considered as small world if Λ>>1 and γ >1. These two measurements were summarized into a simple quantitative metric, small worldness,α = γ/Λ, which was typically α >1 for small-world networks.
Network efficiency. Global efficiency measured the ability of parallel information transmission over the network. For a graph (network) G, the global efficiency of G was calculated as:
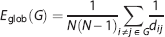
In this equation, d ij was the shortest path length between nodes i and j in G.
Local efficiency measured the fault tolerance of the network, indicating the capability of information exchange for each subgraph when the index node was eliminated. The local efficiency of G was measured as:
Here, Eglob(G i ) was the global efficiency of G i , the subgraph of the neighbors of node i.
Regional nodal characteristics. Two measures were quantified for nodal (regional) characteristics of functional networks: nodal correlation strength and regional efficiency. These measures provided a different viewpoint for discerning major features of the large-scale functional architecture. The regional strength of connectivity Snode(i) for a node i was considered as centers for information integration and defined as the mean of the correlations with N—1 other nodes:
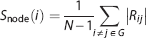
Where Rij was the correlation coefficient between nodes i and j in G.
The regional nodal efficiency of node i was defined as the inverse of the mean harmonic shortest path length between this node and all other nodes in the network.
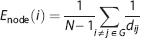
This measure quantified the importance of the nodes for communication within the network, and high regional efficiency indicated the relevant nodes for information flow.
Proportion of nodal efficiency and strength-weighted analysis. Within each group (healthy controls, preLT and postLT patients), the nodal efficiency and connectivity strength proportion weighted in each subject arranged were mapped in descending order of importance. Proportion weighted was defined as:

The proportion weighted of nodal efficiency and strength in different functional networks (DMN, DAN, ECN, SN, and PN) were measured in 25%, 50%, 75%, and 100% nodes of all nodes.
To investigate the extent of the observed proportion changes five largescale functional networks, the correlation coefficients of the interactionweighted correlation in these five large-scale functional networks were computed for each participant and each network. The Granger causal analysis toolbox 24 was used to find the relationship of the ‘target’-‘source’ pair and infer that one weighted change ‘caused’ or influenced the weighted change in on large-scale networks between preLT and postLT patients. In these analyses, significance was set at P < 0.05.
Statistical Analysis
Data analyses were conducted in two steps: demographic and main analyses. The demographic analyses compared demographic variables with clinical characteristics of the preLT and postLT patients and healthy controls to identify any potentially confounding relationships. The main analyses used the general linear model-based ANOVA and paired t-test to find differences between different groups of subjects and paired patients preLT and postLT. The participants' age and sex were applied as covariates. Network parameters, including strength, cluster coefficient, short path length, global efficiency, local efficiency, and small-worldness efficiency, were used to characterize monotonic changes. All analyses used the SPSS 13 software (SPSS Inc., Chicago, IL, USA), with statistical significance set at P < 0.05. The interaction of nodal efficiency and strength-weighted correlation matrix in five large-scale functional networks were analyzed via Pearson's correlation coefficient analysis, with statistical significance set at P < 0.05 corrected with the Bonferroni method.
RESULTS
Demographic and Clinical Characteristics
The clinical and biochemical characteristics of subgroups of preLT, postLT, and controls were summarized in Table 1. PreLT patients exhibited disturbances in neuro-psychological indexes, including attention, executive function, memory, and visuo-construction function (Table 1). After LT, significant visuo-construction function indexes improved, with mild improvement in executive function via increased global cognitive function score from 89.5 to 92.4 in Cognitive Ability Screening Instrument score. Although some of the neuro-psychological improvement did not reach significant changes in pair-wise analysis preLT and postLT, there is no significant difference between postLT group and controls, indicating the therapeutic effect of treatment on cognition deficits in LT. After transplantation, the abnormal alterations in prothrombin activity, international normalized ratio, aspartate aminotransferase, bilirubin, and venous ammonia were corrected.
Demographics, clinical characteristics, and cognitive tests of patients and healthy controls
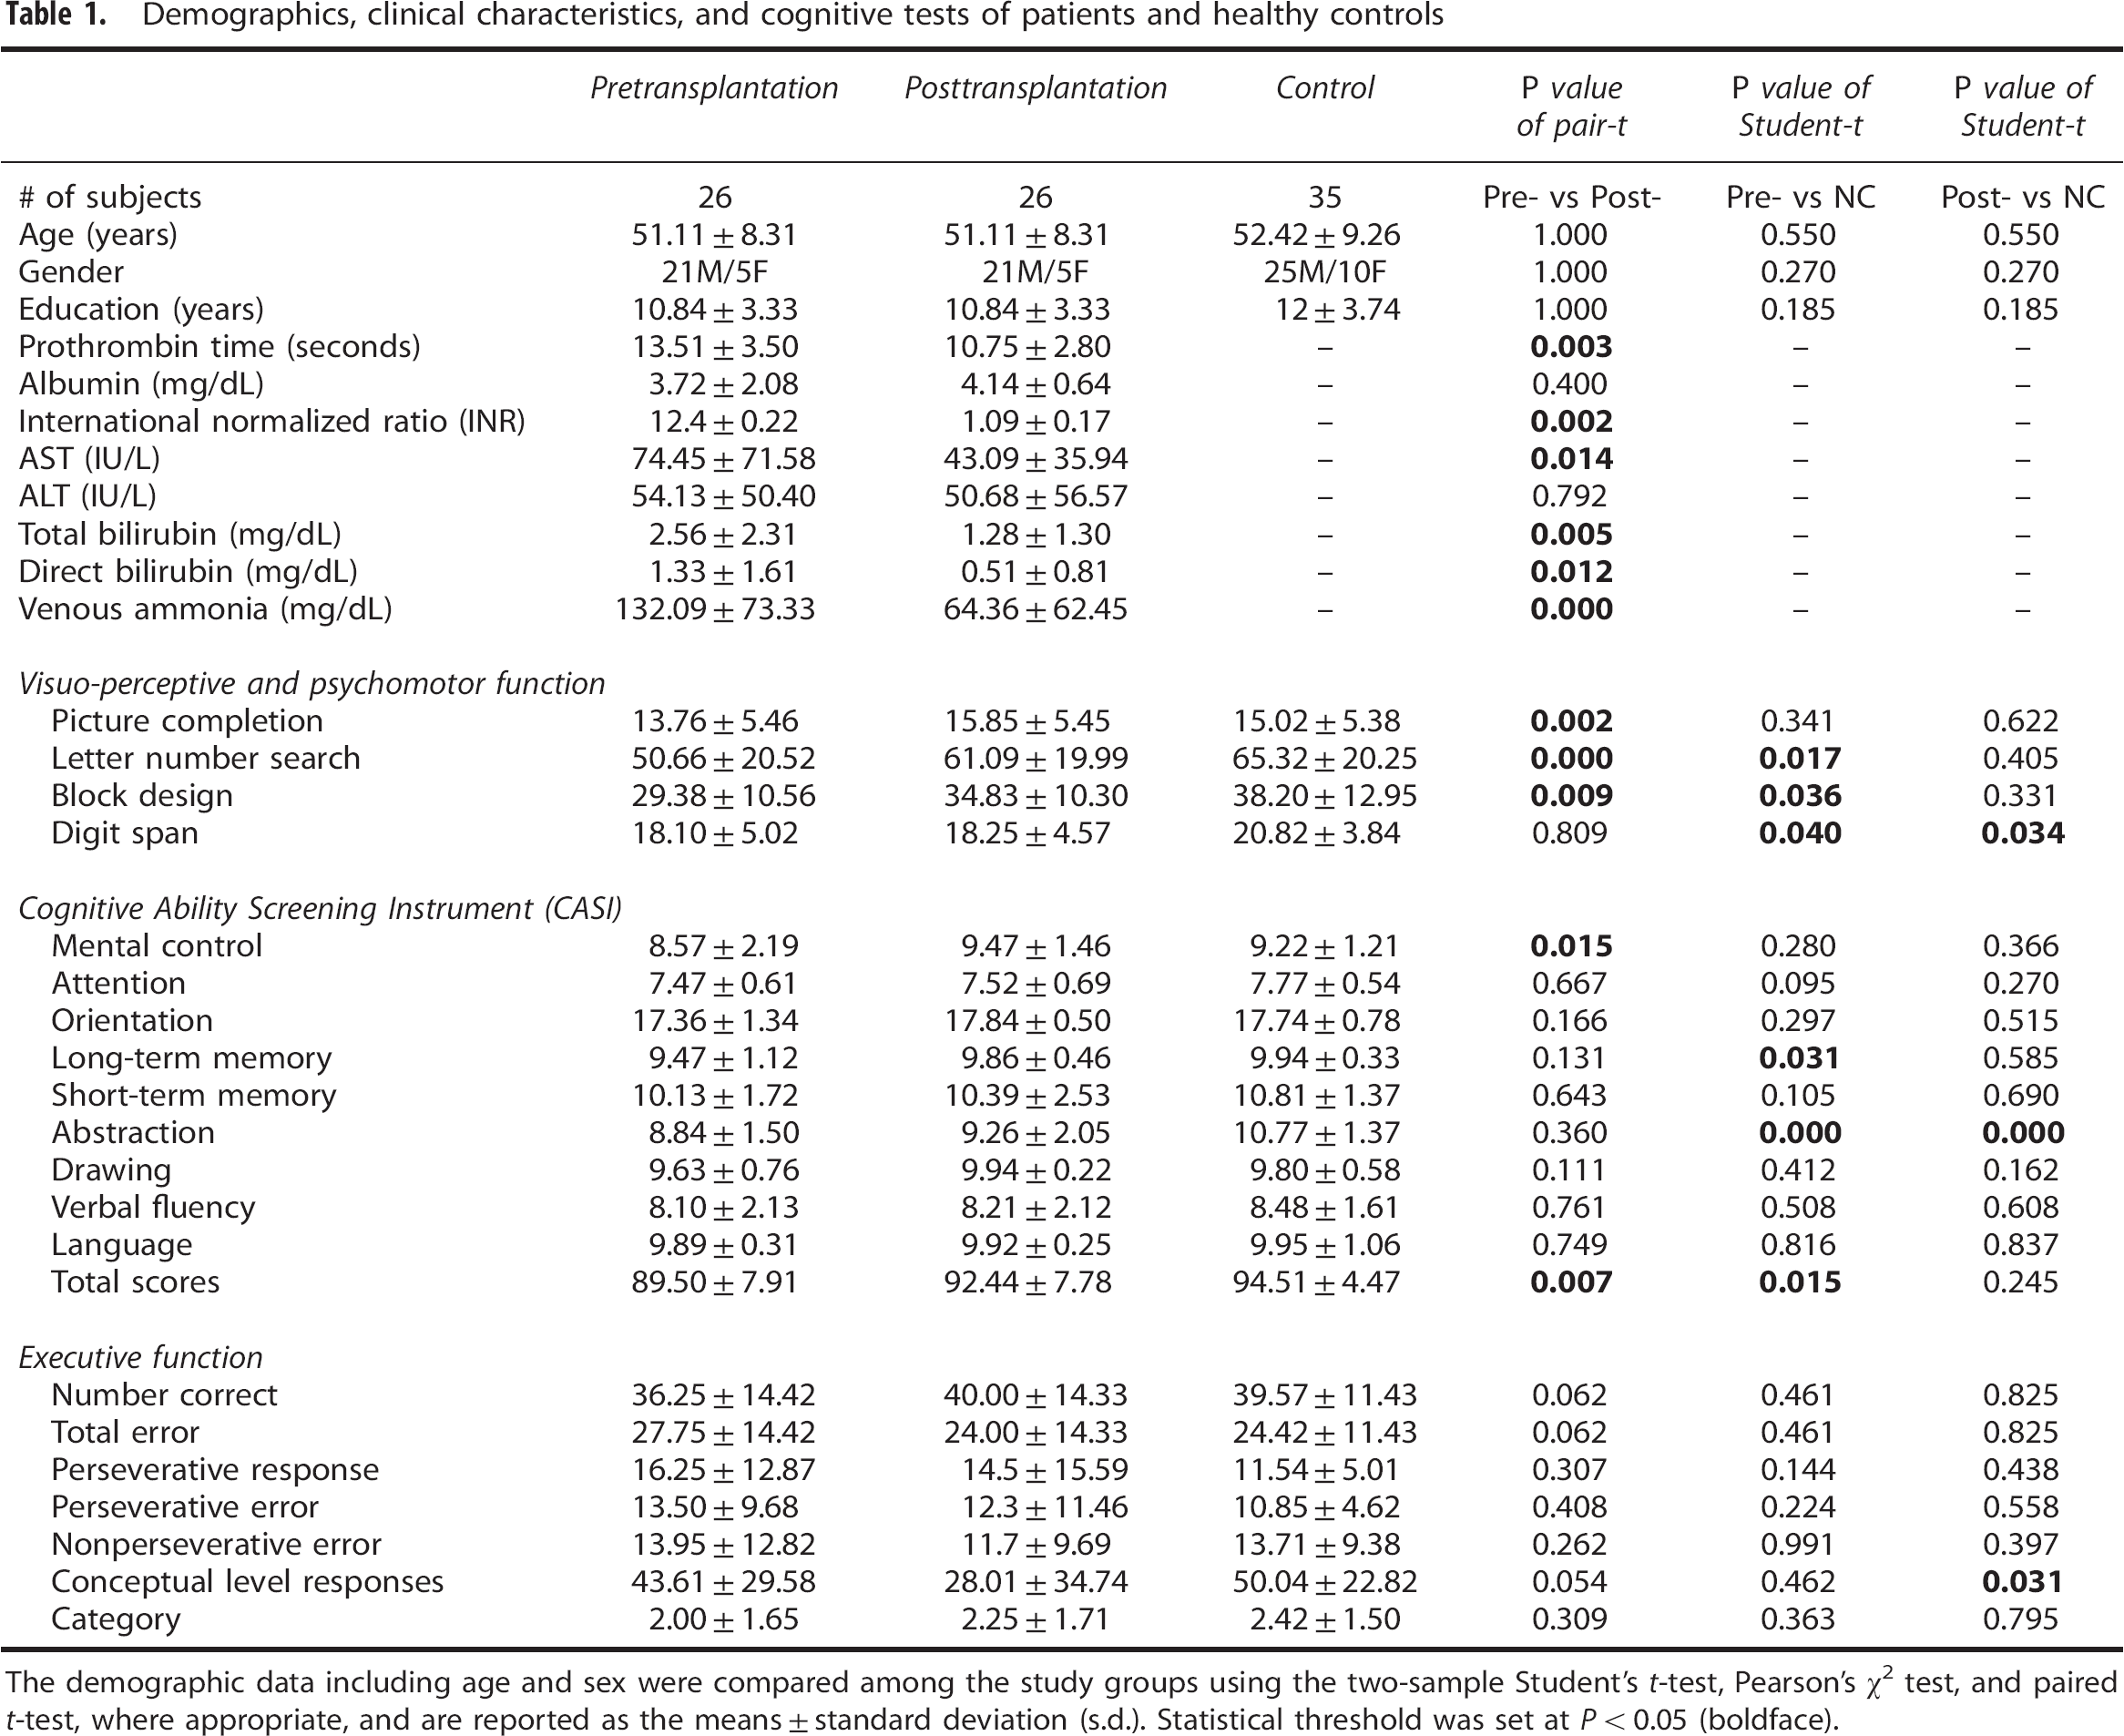
The demographic data including age and sex were compared among the study groups using the two-sample Student's t-test, Pearson's χ 2 test, and paired t-test, where appropriate, and are reported as the means±standard deviation (s.d.). Statistical threshold was set at P<0.05 (boldface).
Global Changes in the Functional Networks Topology
Both the patients and the healthy controls showed a small-world organization of the functional networks, as expressed by S (small worldness) >1 (Figure 2). Among the three groups, ANCOVAs on the network properties showed significant group effects in network small worldness, degree, global efficiency, local efficiency, cluster efficiency, and absolute shortest path length (Figure 2). In addition, post hoc comparison analysis showed significantly decreased small worldness, degree, global efficiency, local efficiency, cluster efficiency, and absolute shortest path length global efficiency in preLT patients compared with healthy controls. The parameters also revealed a trend of correction from random to small-worldness network postLT. However, there were no differences (all P>0.05) between preLT and postLT patients in these parameters.
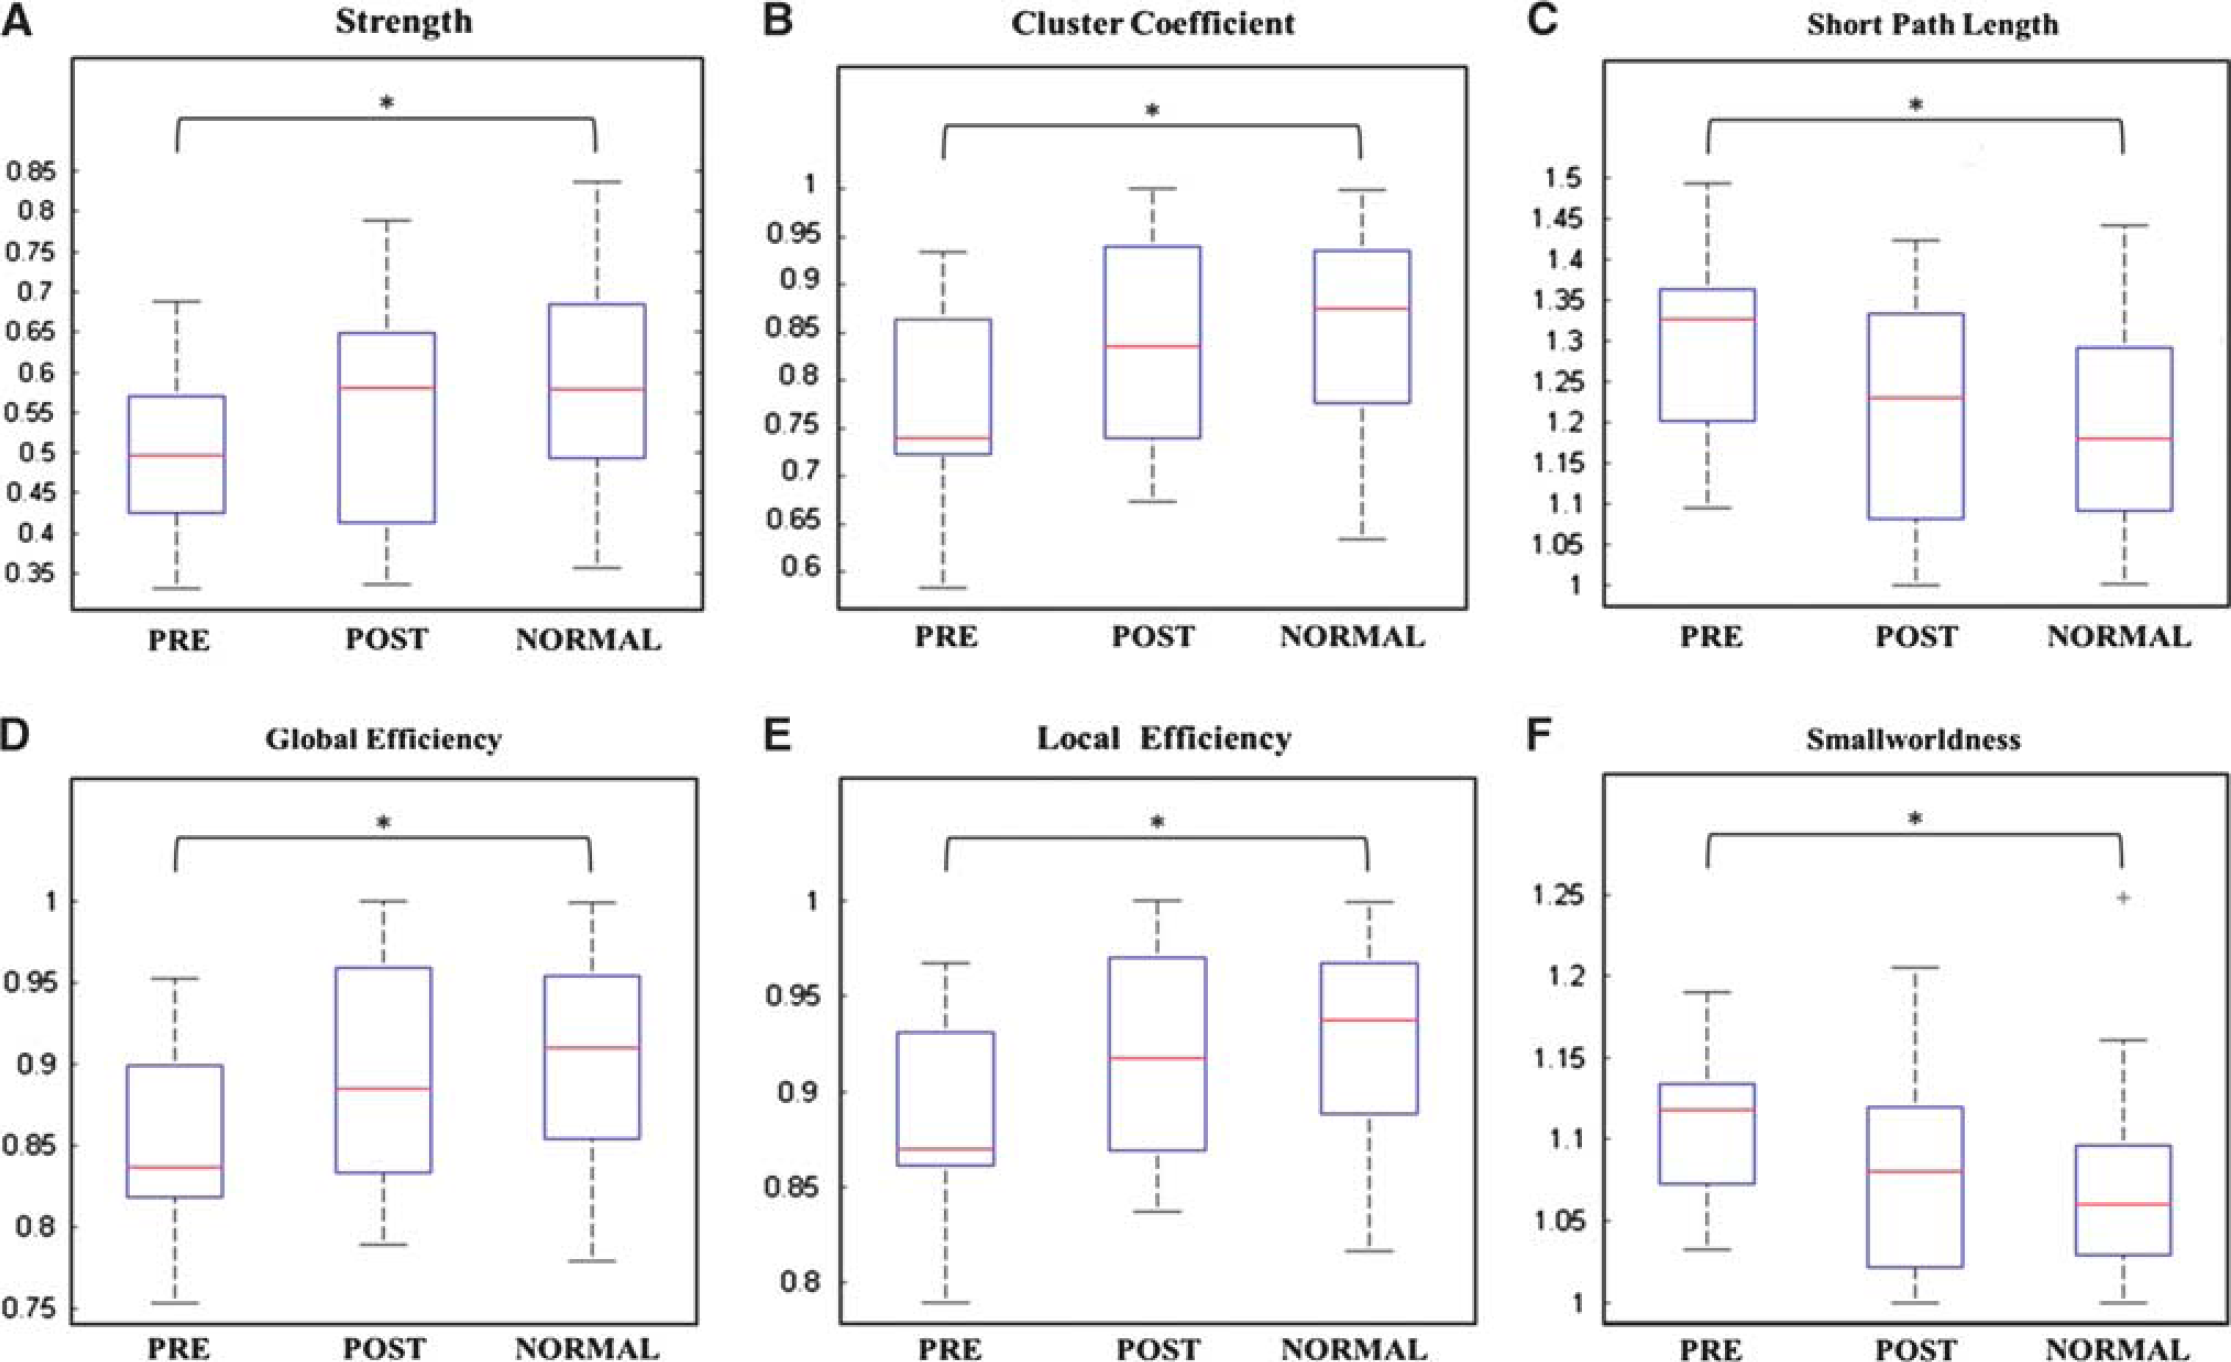
Global measures of functional networks were quantified in the healthy control and in preLT and postLT patients. (
Regional Changes in the Functional Networks Topology
After the discovery of disrupted global functional networks topology, vulnerable hubs that are crucial for integrating information from many other brain areas with altered nodal efficiency and strength were identified in preLT and postLT patients and healthy controls. The regional efficiency and strength of each node were displayed with results for 36 large-scale functional brain network nodes and sorted in order of descending regional efficiency and strength (Figures 3A and 3B). Among the three groups, regions with significant group effects were mainly distributed in DAN, DMN, ECN, and SN (Table 2). By post hoc comparison analysis, most of these networks had reduced efficiency and strength in preLT patient compared with healthy controls.
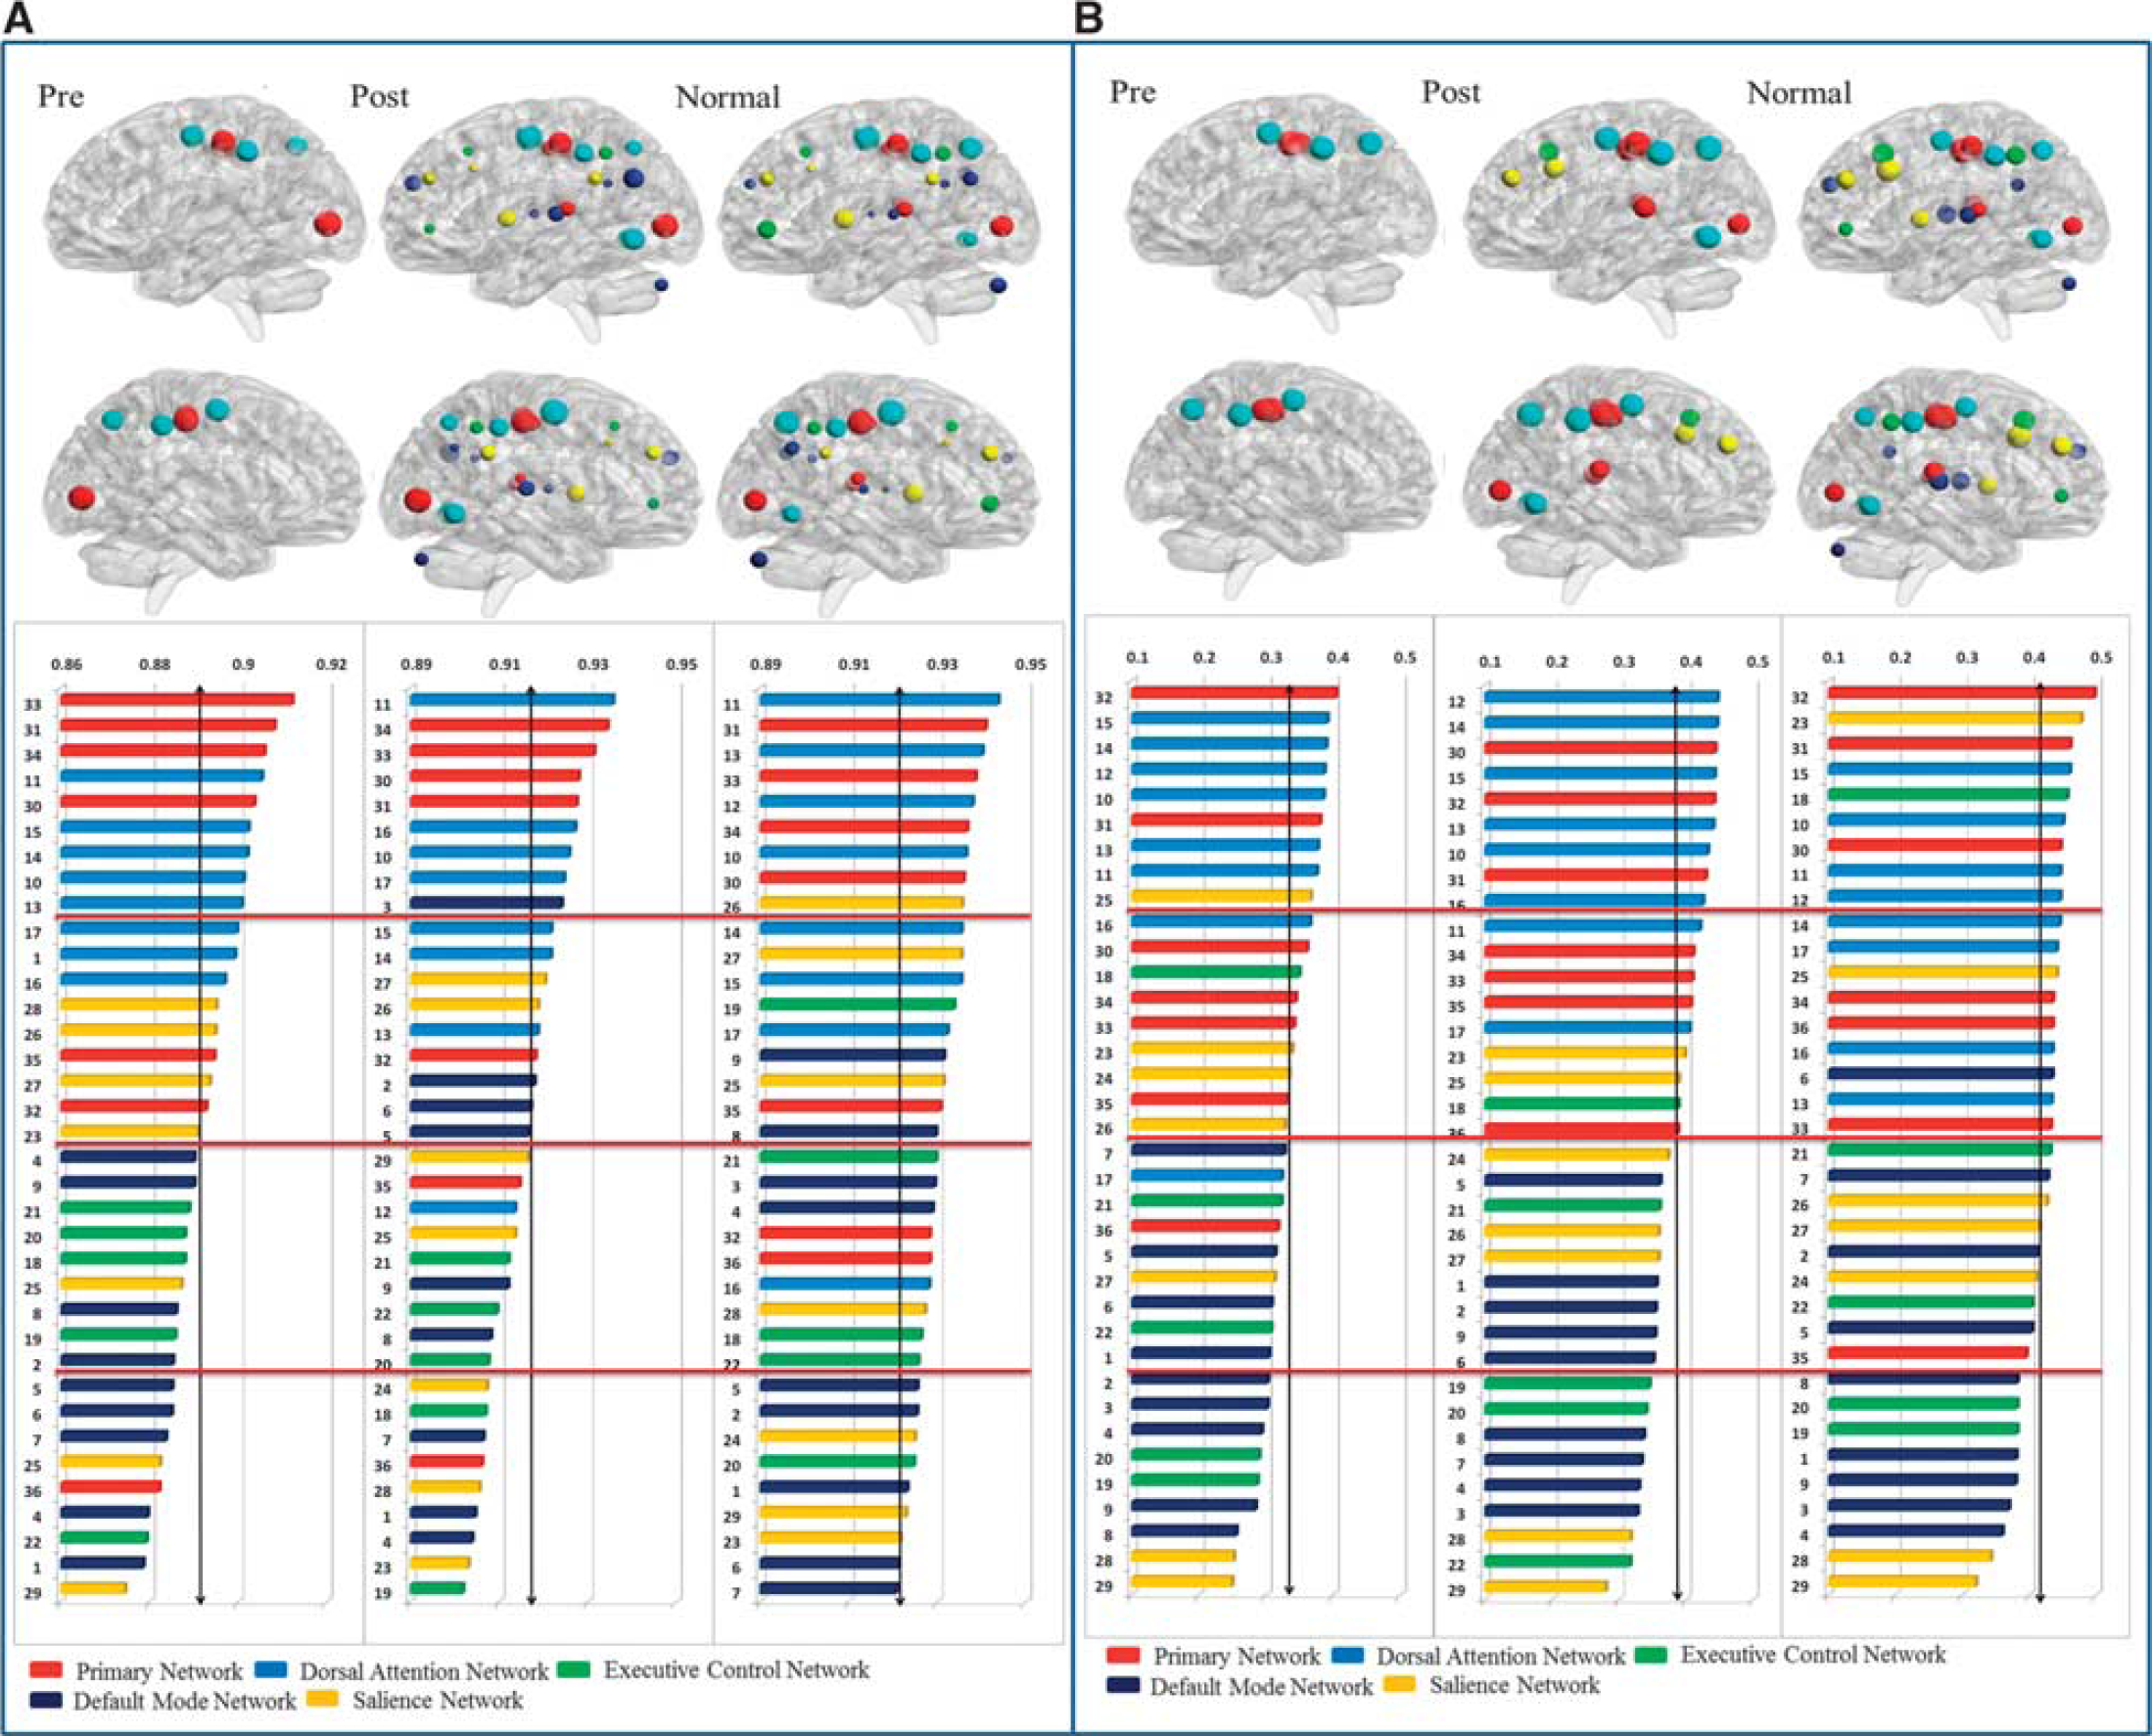
Regional efficiency (
Comparisons of nodal efficiency and nodal strength among preLT, postLT, and healthy control groups
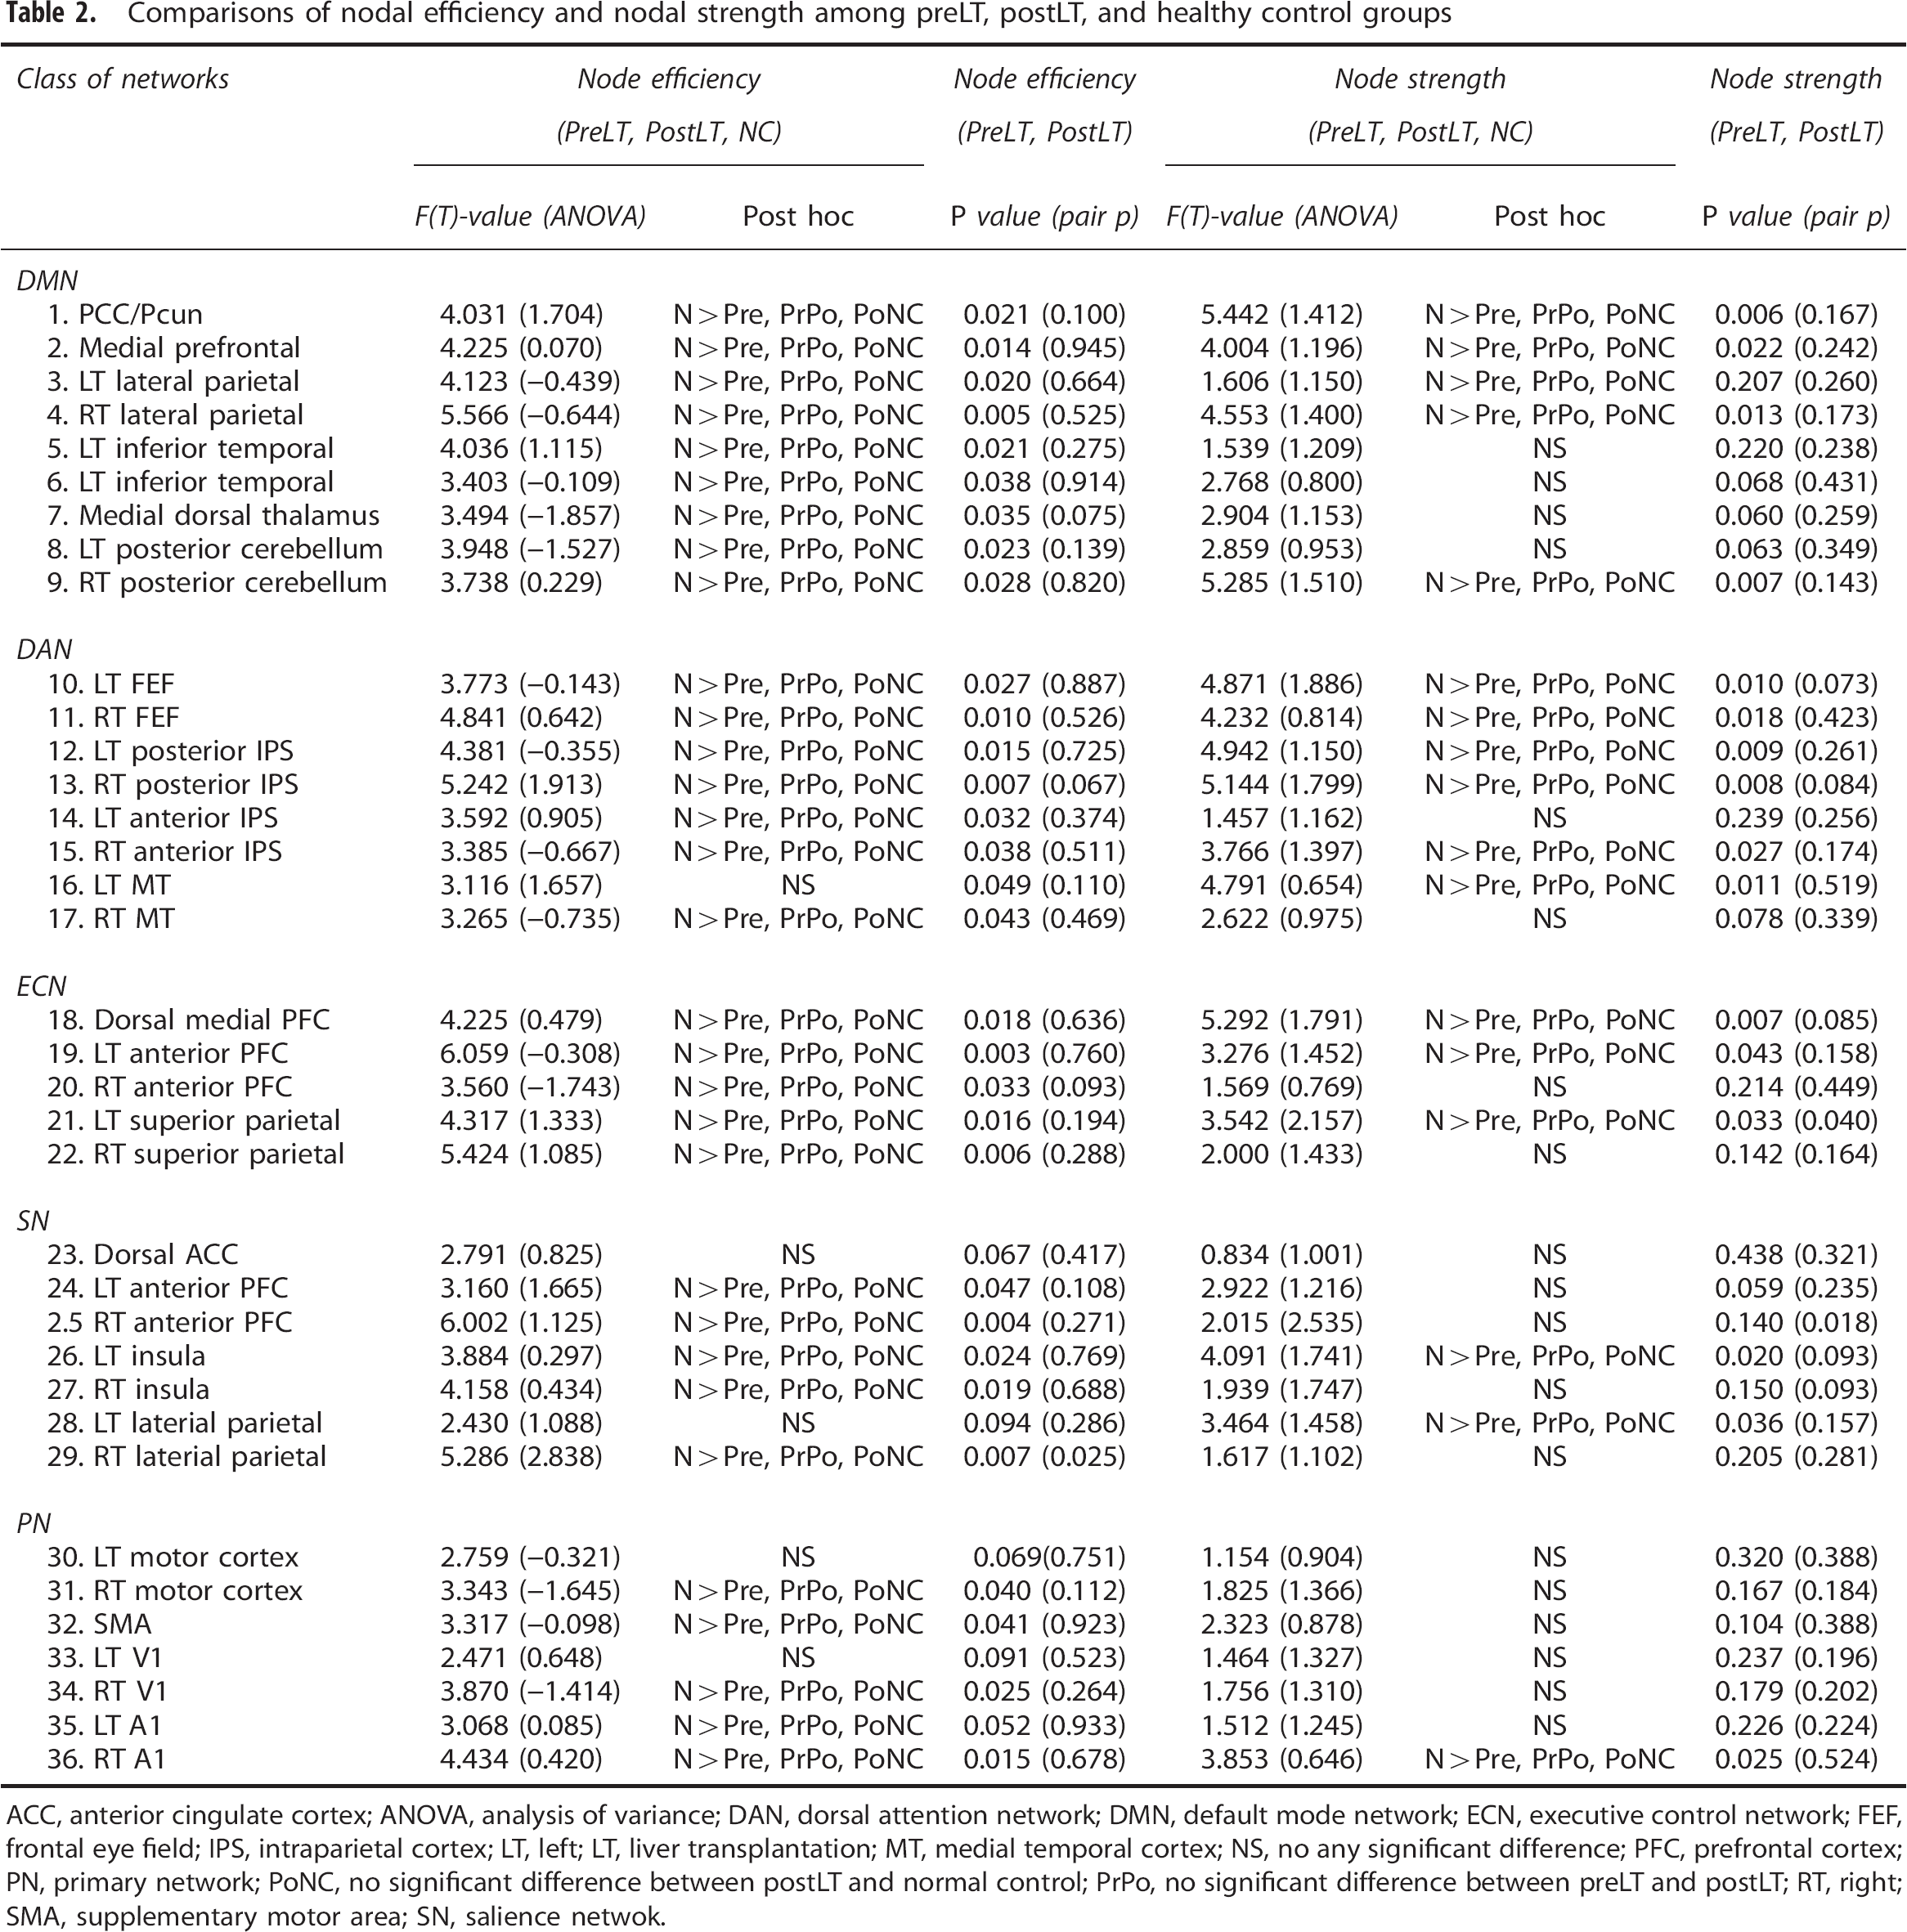
ACC, anterior cingulate cortex; ANOVA, analysis of variance; DAN, dorsal attention network; DMN, default mode network; ECN, executive control network; FEF, frontal eye field; IPS, intraparietal cortex; LT, left; LT, liver transplantation; MT, medial temporal cortex; NS, no any significant difference; PFC, prefrontal cortex; PN, primary network; PoNC, no significant difference between postLT and normal control; PrPo, no significant difference between preLT and postLT; RT, right; SMA, supplementary motor area; SN, salience netwok.
Progression of Regional Changes in the Functional Networks Topology
The proportion of nodal efficiency and strength-weighted analysis were used to identify the rearrangement of multiple functional networks in the three groups. To investigate the extent of the observed proportion changes in five large-scale functional networks, the weighted analysis in nodal efficiency and nodal strength of functional networks were shown by correlation matrix in 25%, 50%, 75%, and 100% nodes of all nodes (Figure 4). The functional network patterns were reorganized with increasing percentages of the nodes. In the 100% nodal efficiency-weighted matrix, the functional network interaction pattern among five networks in postLT patients was similar to that in healthy controls. In 75% and 100% nodal strength weighted correlation matrix, the functional network interaction pattern of postLT patients exhibited same relationship pattern as healthy controls.
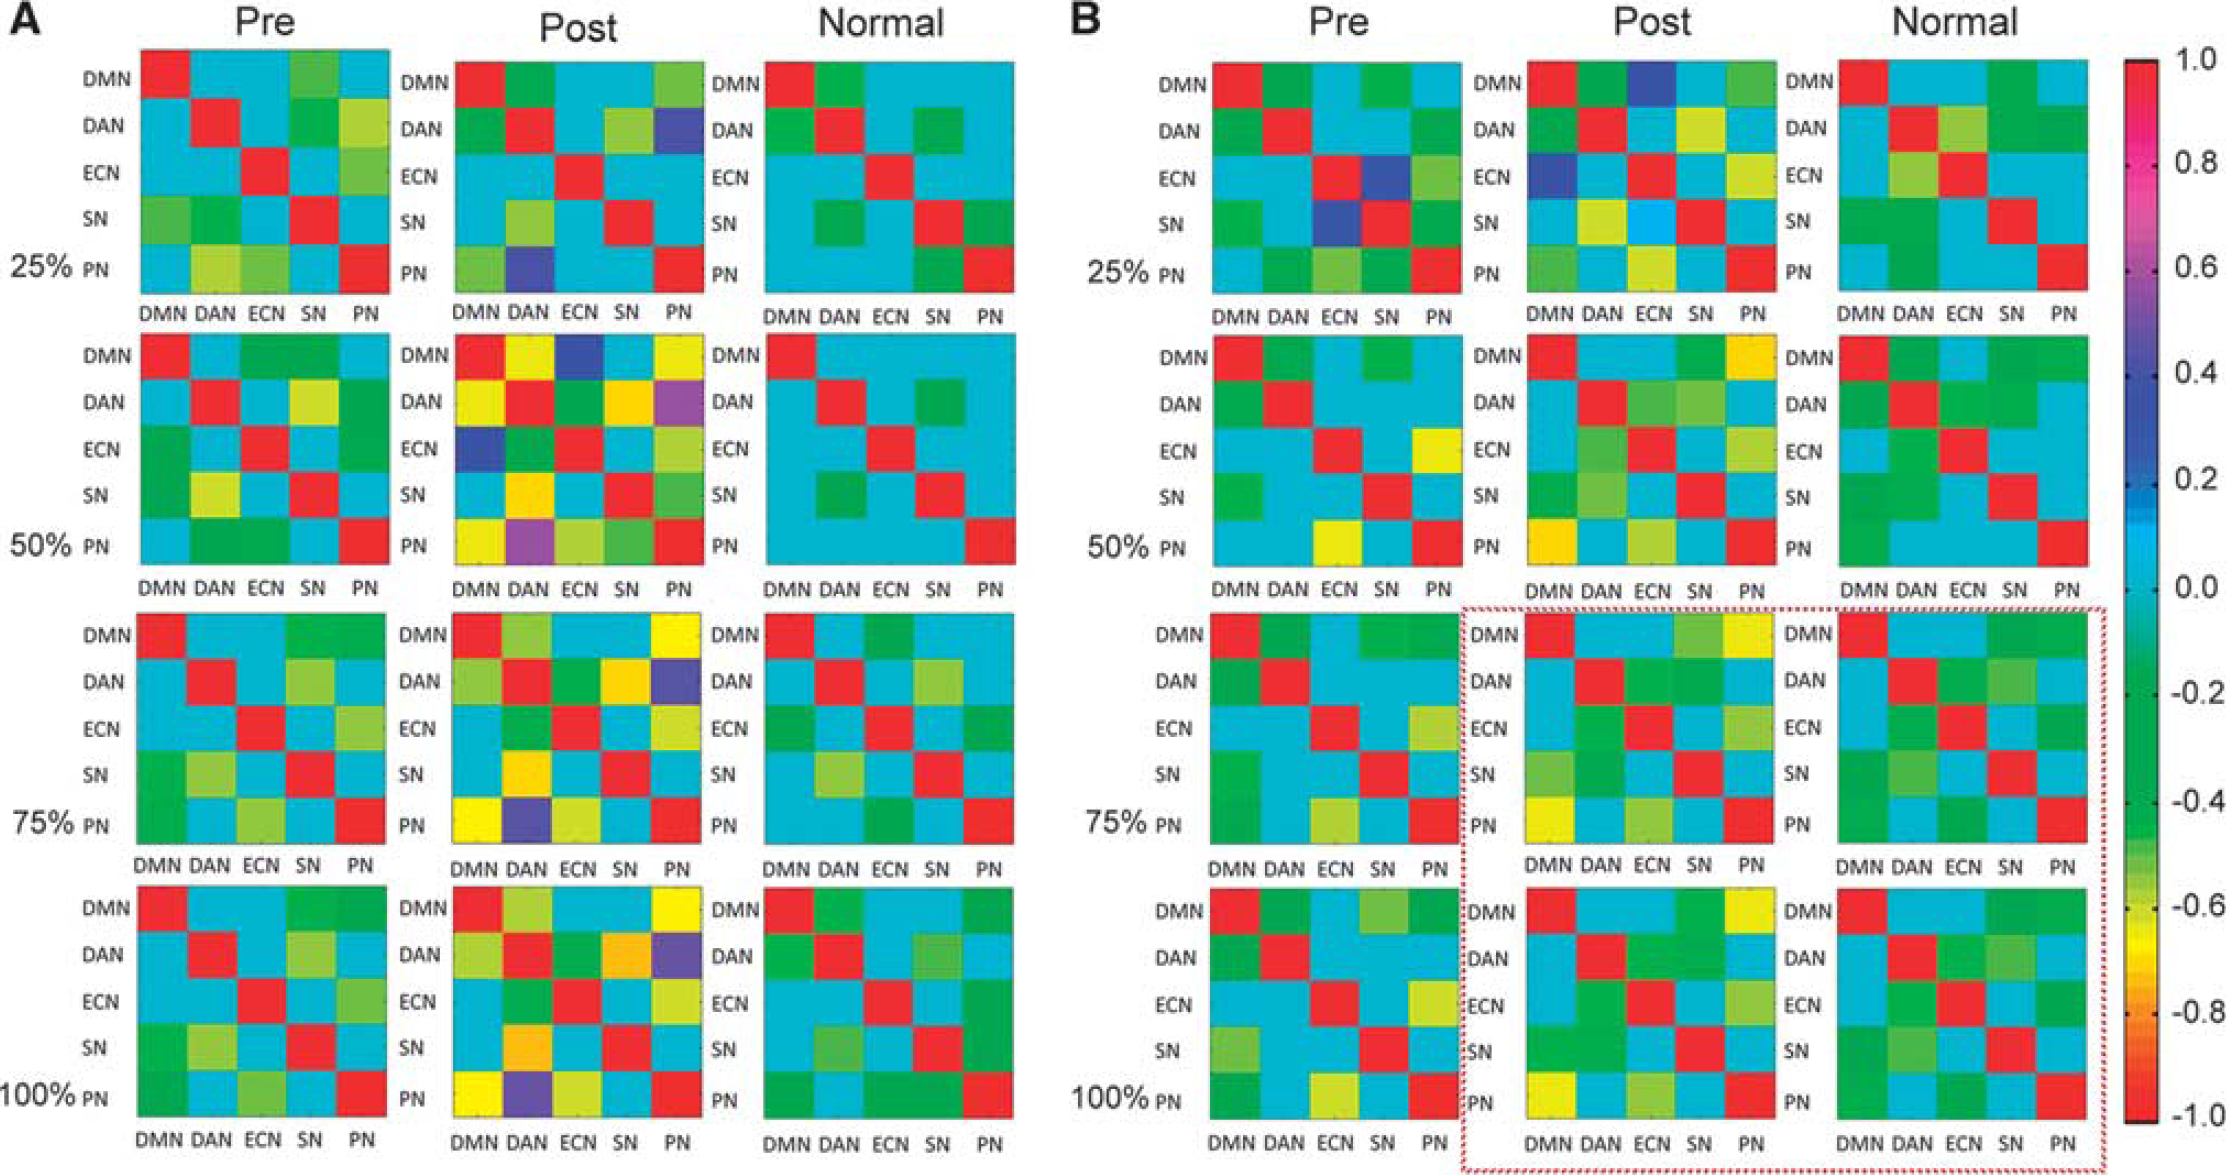
Efficiency- and strength-weighted correlation matrix in three groups. (
Finally, Granger causality analysis was applied to elucidate the weighted change interactions among the five large-scale networks preLT and postLT. The Granger causal analyses detected causal interactions between brain regions by assessing the extent to which weighted changes in one brain region could predict weighted changes in another brain region. 25 A causal relation graph was constructed, with the arrow-headed black lines indicating the direction of the causal influences (Figure 5) and red lines showing the bidirectional influence. These links were significant at the group level (P < 0.05). After LT, recovery of normal cognition function started from changes in PN, which affected changes in SN, while changes in DAN forced changes in DMN. There was a bidirectional balance between DMN and SN.
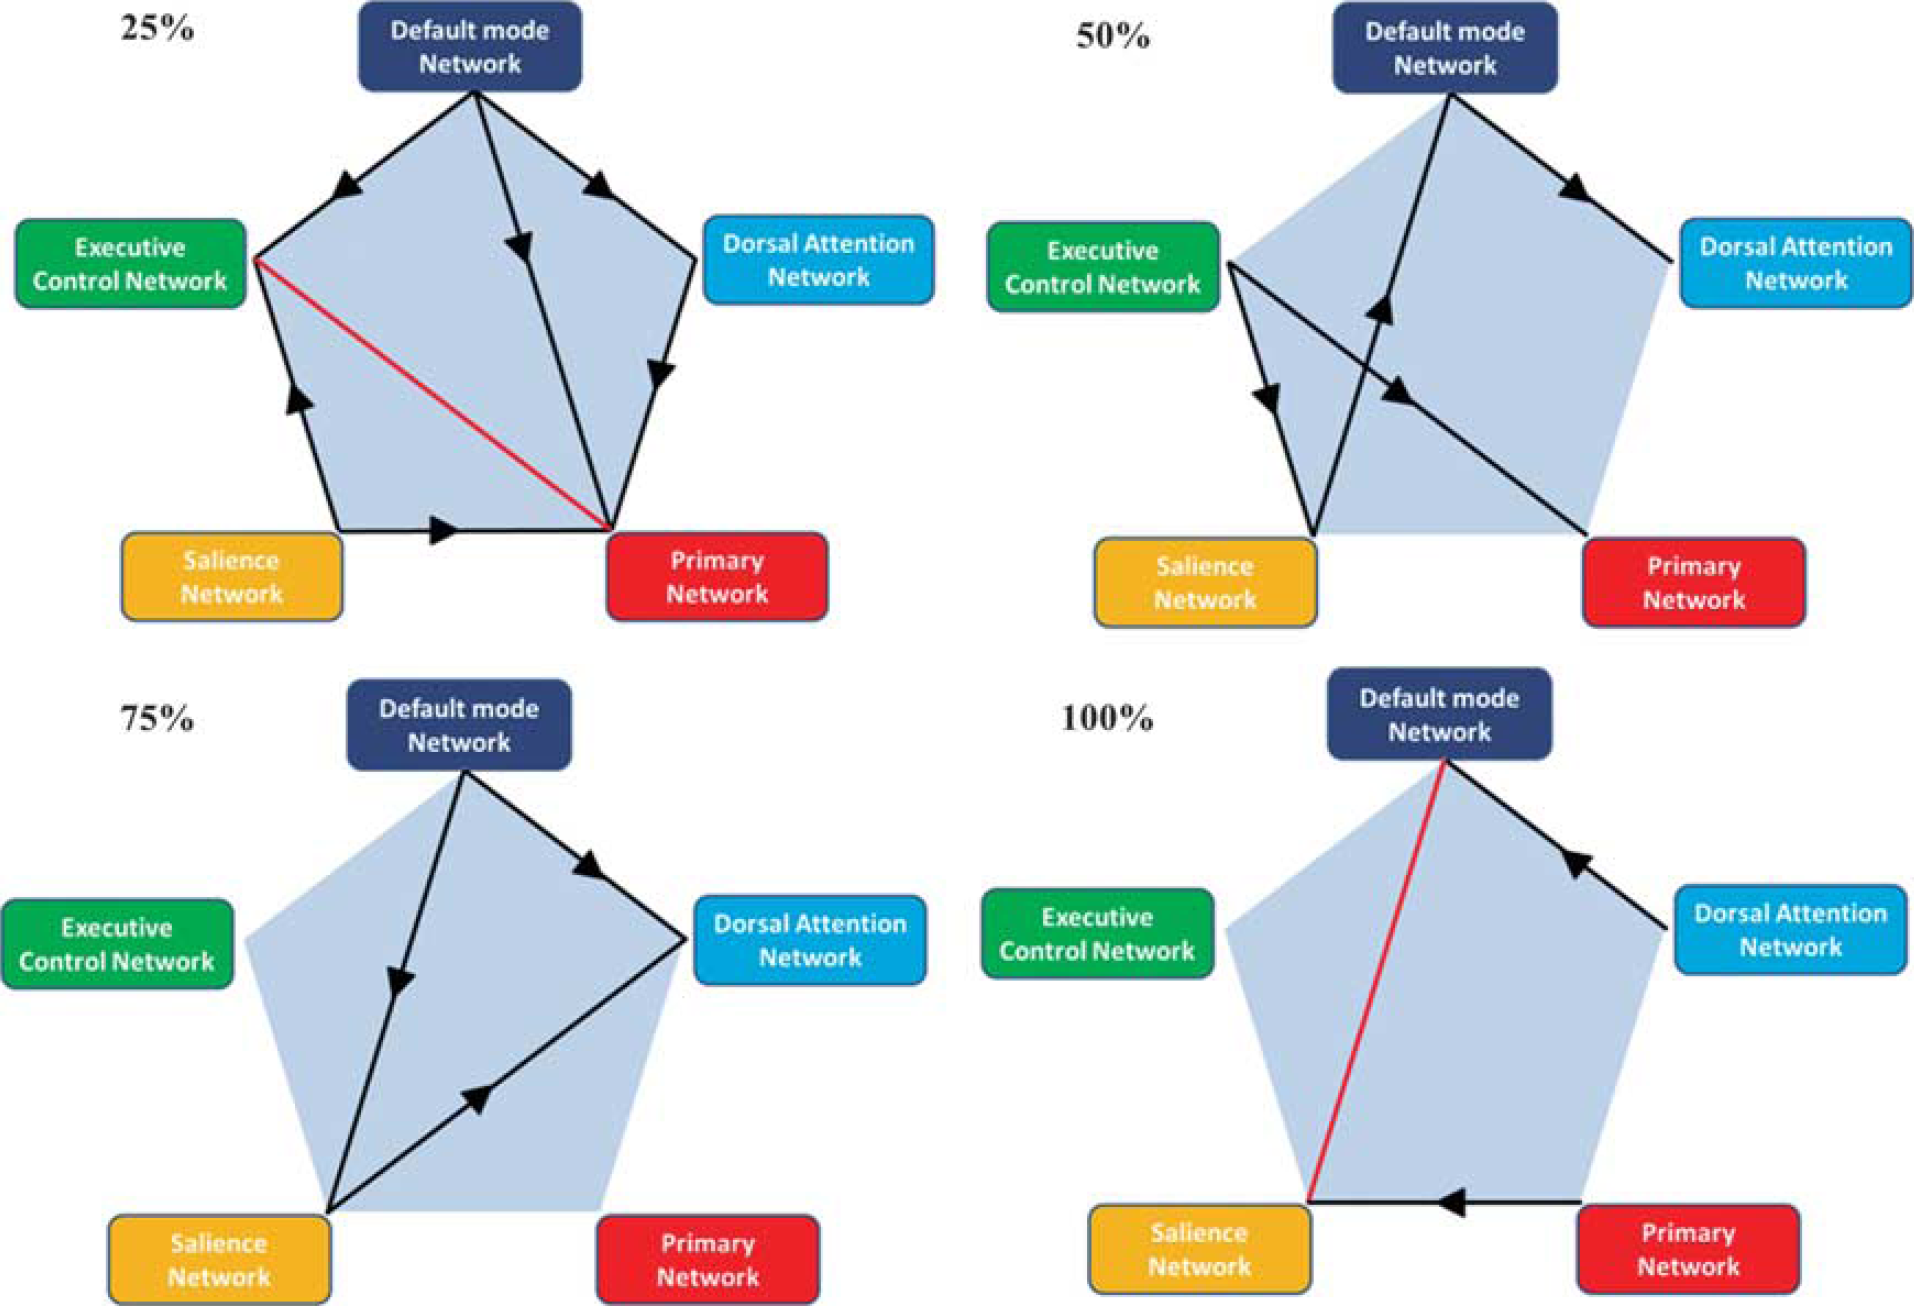
Granger causality of the five large-scale networks in strength-weighted changes between preLT and postLT patients in 25%, 50%, 75%, and 100% of nodes. Arrow-headed black lines indicate the direction of causal influences and red lines show the bidirectional influence. Those links show significance at the group level (P < 0.05).
DISCUSSION
The present study applied for the first time graph theoretical analyses on functional MRI data to define and compare functional network topology in patients before and after LT. Our investigation reveals three main findings. First, at the overall topological level, patients with liver cirrhosis have altered small-worldness functional connectivity networks both preLT and postLT, suggesting a more random organization in large-scale brain networks, especially before LT. Second, in individual large-scale network levels, DMN and other functional connectivity networks show extensively altered nodal efficiency and strength. Our findings bridge gaps between clinical cognitive impairment and their patho-physiologic support. Third, after LT, the coupling of different functional connectivity networks evolves dynamically with the trend to reestablish a balance between different large-scale networks. This last finding may have clinical implications, as the index of coupling among large-scale functional brain networks may be a potential biomarker for observing treatment effects in numerous psychiatric and neurologic disorders of HE.
Small-World Properties in Patients Before and After Liver Transplantation
A suitable balance between local specialization and global integration of brain functional activity is required for optimal information processing.26,27 Global efficiency reflects the information transfer between remote regions and is mainly associated with long-range connections. Decreased global efficiencies reflect a disrupted global integration of the functional connectivity networks in these patients. 17
In present study, although the characteristics of small worldness are not completely restored after LT, it is a novel finding that the potentially neuro-plasticity effect of the human brain can reset the most efficiently working function. ‘Reversible’ HE is usually mentioned after LT or medical treatment. However, brain cellular injury from previous dysmetabolisms or even from resulting structural changes may only be partially repaired. Garcia-Martinez et al 8 report that postLT neurologic outcome is associated with previous HE before LT. They also report increased experience of progressive accumulation of focal T2 brain lesions and show that smaller brain volume than controls after LT may be related to previous cirrhosis. Thus, the present results of small worldness also support previous findings.
Regional Hubs and Large-Scale Functional Networks Topology
The regional character is a measure of functional importance of a node by acting as a critical station for information processing. 28 Nodes with high connection weights usually have high efficiency and strength. Alterations in regional hubs occur more prominently and selectively within DMN, SN, and ECN in patient before LT. This finding is consistent with previous studies that intranetwork functional connectivity of DMN and other major networks decrease.15,29 After LT, regional nodal efficiency is similar to that of healthy controls. However, decreased nodal strength can still be observed to be predominately located in the DMN. The decrease in nodal efficiency and strength of DMN preLT and postLT suggests functional uncoupling and may impair the brain's ability to integrate information. 30
Liver cirrhosis is also accompanied by a shift toward a nonoptimal SN configuration. Decreased SN efficiency reflects an weakening in attentional capture of biologically and cognitively relevant events and in the subsequent engagement of the frontoparietal systems for working memory and higher-order cognitive control. 31 The SN is anchored in the anterior insular and dorsal anterior cingulate cortices, and features extensive connectivity with subcortical and limbic structures involved in reward and motivation. 32 The illness sensation and dysmetabolism toxicity can suppress the ability of SN to receive and organized information from sensation, emotion, and selfreferential input and the following output to guide behavior. 32 The efficiency and strength of SN is regained earlier than DMN (Figures 3A and 3B), suggesting that SN may have an important centricity to correct cognitive impairment by assisting target brain regions in the generation of appropriate behavioral responses to salient stimuli. 31
The ECN is critical for the active maintenance and manipulation of information in working memory, and for judgment and decision-making in the context of goal-directed behavior. 33 In particular, ECN nodes that show strong intrinsic functional coupling also show strong co-activation during cognitively challenging tasks. Liver cirrhosis altering the small worldness of ECN disconnects its intranetwork coactivation. This phenomenon corresponds to clinical performances in patients with liver cirrhosis who usually exhibit impaired executive function. 8 In addition, we also observed an improvement in executive function tests and small worldness after LT, further supporting the fundamental findings of graph therapy analysis in HE.
Dynamic Evolution of Large-Scale Functional Networks Topology
Instead of simplistic mapping of cognitive constructs onto individual brain areas, conjoint function of brain areas is working together as large-scale networks. From the network-weighted analysis in normal subjects (100%), the efficiency of DMN correlates negatively with DAN and PN, the DAN correlates negatively with SN, and PN correlates negatively with ECN and SN. These interesting features are consistent with prior reports. 34
In liver cirrhosis, the normal workflow between different large networks also change with the loss of negative correlation between DMN and DAN in network efficiency but increase the correlation in network strength (100%). The increase weighted of network strength may be explained to compensate for the decrease weighted of network efficiency. The DAN network consists of regions routinely exhibit task-related activations and the DMN of regions routinely exhibits task-related deactivations. The absence of anticorrelation between DMN and DAN in liver cirrhosis suggests weakened dynamic, ongoing function organization of the brain. This phenotype has the worse attention and cognition function in liver cirrhosis.
Liver cirrhosis also exhibits less negative correlation between SN and PN in network efficiency (100%) (Figure 4A) and a loss of negative correlation between DAN and SN in network strength (100%) (Figure 4B). The SN is responsible for the orientation of attention to the most homeostatically relevant (salient) ongoing intra and extrapersonal events.35,36 Lesser SN and PN interaction may come from PN alterations, including sensori-motor, visual, and auditory sensory aberrant stimulus mapping resulting from dysmetabolism in liver cirrhosis.37,38 Subsequently, SN may fail to map such events and initiate control signals appropriately, displayed as weakened correlation between SN and DAN. Since SN is crucial for initiating appropriate control signals that facilitate access to attention and working memory resources needed for cognitively demanding tasks, diminished outflow from the SN results in psychomotor poverty and impoverished goal-directed action in liver cirrhosis. 32
The Granger causal analyses further simplify interactions among large-scale networks. Our findings support the research findings summarized in Vinod's triple network model, 32 which suggests that aberrant organization and functioning of the DAN, SN, and DMN are prominent features of several major psychiatric and neurologic disorders and may interact with each other by any intervention since they are intrinsically coupled functional networks and are usually systematically engaged during cognition. 39
Our results suggest that physiologic changes (PN) from liver cirrhosis alter the awareness ability of SN that is a crucial node for the initiating network switching between DMN and DAN. 40 It is further supported by exploring the bidirectional interaction between SN and DMN in the present study. Instead of observing causality between SN and DAN, we found an interaction between DAN and DMN. Thus, in addition to alterations in PN, symptom-specific deficits in DAN and DMN connectivity in liver cirrhosis are also associated with attention and consciousness deficits.13–15
In conclusion, dynamic disruptions and reconstruction in intrinsic large-scale networks are associated with parallel patterns of cognitive information processing deficits and recovery preLT and postLT. The study of large-scale networks and their links to brain function in liver cirrhosis before and after LT promises to uncover core aspects of brain disturbance in liver cirrhosis. Perhaps, most exciting is the demonstration of the possibility of rebalance among DMN, SN, and DAN after LT in patients without overt HE. In the future, network models may have implications in the management of LT candidates, such as the prevention of HE and therapeutic interventions before LT, and in evaluating postoperative cognitive status that may influence policies on LT prioritization.
Footnotes
The authors declare no conflict of interest.
Acknowledgments
This study was supported by funds from National Science Council (NSC 100-2628-E-010-002-MY3).