
Abstract
Excessive accumulation of reactive oxygen species (ROS) underlies oxidative damage. We find that in hippocampal slices, decreased activity of glucose-based antioxidant system induces a massive, abrupt, and detrimental change in cellular functions. We call this phenomenon metabolic collapse (MC). This collapse manifested in long-lasting silencing of synaptic transmission, abnormal oxidation of NAD(P)H and FADH2 associated with immense oxygen consumption, and massive neuronal depolarization. MC occurred without any preceding deficiency in neuronal energy supply or disturbances of ionic homeostasis and spread throughout the hippocampus. It was associated with a preceding accumulation of ROS and was largely prevented by application of an efficient antioxidant Tempol (4-hydroxy-2,2,6,6-tetramethylpiperidine-1-oxyl). The consequences of MC resemble cortical spreading depression (CSD), a wave of neuronal depolarization that occurs in migraine, brain trauma, and stroke, the cellular initiation mechanisms of which are poorly understood. We suggest that ROS accumulation might also be the primary trigger of CSD. Indeed, we found that Tempol strongly reduced occurrence of CSD in vivo, suggesting that ROS accumulation may be a key mechanism of CSD initiation.
INTRODUCTION
Glucose is the main energy substrate delivered by blood into the brain. During network activity, both neurons and astrocytes use glucose for covering their energy demands, although alternative energy substrates such as lactate and ketone bodies can also be consumed. Apart from the energy production, glucose processing is crucial for the cytosolic antioxidant defense system implemented via pentose phosphate pathway. During neuronal activity, a large amount of reactive oxygen species (ROS) is generated by mitochondria 1 as well as in the cytoplasm, 2 and need to be rapidly detoxified to avoid cellular damage. Pentose phosphate pathway generates NADPH, a necessary cofactor for the reduction of glutathione disulfide, the reduced version of which is the main cytosolic antioxidant. 3 Abnormal accumulation of ROS has been implicated in pathogenesis of many neurological diseases 4 and the potential importance of pentose phosphate pathway's protective role has recently emerged. 5 However, on the cellular level, the extent of functional damage induced by the acute ROS accumulation has not been yet clarified.
Metabolic disturbances in patients suffering from migraine, stroke, epilepsy, subarachnoid hemorrhage, and traumatic brain injury may result in a spontaneous induction of deleterious changes in multiple neuronal parameters that cause a self-propagating wave of cellular depolarization in the cerebral cortex—cortical spreading depression (CSD).6–9 As CSD is a pathological phenomena of great importance for clinical neuroscience, it has been intensively studied since its discovery in 1944.6,8,9 In experimental models, CSD-like events can be induced by a plethora of noxious challenges, including mechanical damage, vigorous electrical stimulation, hypoosmolarity, hyperthermia, chemical agents such as potassium, neurotransmitters glutamate and acetylcholine, acute hyperexcitability (in particular status epilepticus), sodium pump inhibitors, hypoglycemia, hypoxia, and ischemia.9–12 CSD consists of two phases, namely its focal initiation and the following wave propagation throughout the cortical tissue. Although the detrimental consequences of CSD propagation, including massive increases in both extracellular K+ and glutamate, as well as rises in intracellular Na+ and Ca2+, are thoroughly investigated, the primary molecular causes for the initiation of spontaneous CSD are yet unclear,9,12–14 seriously complicating the development of treatments aimed at preventing CSD. Notably, although there exists a plethora of induction methods affecting various cellular functions, all lead to a similar outcome—the CSD wave, suggesting that the primary trigger for the phenomenon may be shared across all of them.
Oxidative stress that results in detrimental accumulation of ROS is a common attribute of all diseases where CSD is observed.15,16 Similarly, the experimental interventions that induce CSD are also associated with oxidative stress. However, although oxidative stress was noted as a consequence of CSD in a few experimental studies,17–20 it did not attract significant attention as a potential cause of CSD.
In this study, we set out to elucidate the link between ROS accumulation, changes in cellular functioning and their potential role in the ignition of CSD.
MATERIALS AND METHODS
Tissue Slice Preparation
Brain slices were prepared from P21-P56 adult Swiss male mice. All animal protocols conformed the INSERM guidelines on the use of laboratory animals and are approved by the Ethics Committee for Animal Experimentation of Marseille (30-03102012). A mouse anesthetized with isoflurane was decapitated, the brain was rapidly removed from the skull and placed in ice-cold ACSF. The ACSF solution consisted of (in mmol/L): NaCl 124, KCl 3.50, NaH2PO4 1.25, NaHCO3 25, CaCl2 2.00, MgCl2 1.30, and dextrose 10, pH 7.4. ACSF was aerated with 95% O2/5% CO2 gas mixture. Saggital slices (350 μm) were cut using a tissue slicer (Leica VT 1200s, Leica Microsystem, Wetzlar, Germany). During cutting, slices were submerged in an ice-cold (<6°C) solution consisting of (in mmol/l): K-gluconate 140, HEPES 10, Na-gluconate 15, EGTA 0.2, NaCl 4, pH adjusted to 7.2 with KOH. Slices were immediately transferred to a multi-section, dual-side perfusion holding chamber with constantly circulating ACSF and allowed to recover for 2 hours at room temperature (22 °C-24 °C). Slices were then transferred to a recording chamber continuously superfused (15 ml/min) with ACSF (33 °C-34 °C) containing either 5 mmol/l glucose (glucose-ACSF) or 10 mmol/l pyruvate (pyruvate-ACSF) with access to both slice sides.
Synaptic Stimulation and Field Potential Recordings
Schaffer collateral/commissures or perforant path was stimulated using the DS2A isolated stimulator (Digitimer, Letchworth Garden City, UK) with a bipolar metal electrode. Stimulus current was adjusted using single pulses (40-170 μA, 200 μs, 0.15 Hz) to induce a local field potential (LFP) of nearly 50% of maximal amplitude. LFPs were recorded using glass microelectrodes filled with ACSF, placed in stratum pyramidale or granular cell layer, and connected to the ISO DAM-8A amplifier (WPI, Sarasota, FL, USA). Synaptic stimulation consisting of a stimulus train (200 μs pulses) at 10 Hz lasting 10, 30, and 50 seconds, and at 100 Hz lasting 1, 3, and 5 seconds was used to induce metabolic response. The second stimulation approach used a glutamate (10 mmol/l) application consisting of 1- or 5-second trains (10 Hz) of short (10 ms) puffs from the glass pipette (˜30 μm diameter) connected to the Toohey Spritzer pressure system (Toohey, Fairfield, NJ, USA). The pressure and pipette tip position were adjusted to produce no tissue motion during glutamate application.
Oxygen Measurements
A Clark-style oxygen microelectrode (tip diameter 10 μm; Unisense, Aarhus N, Denmark) was used to measure slice tissue pO2. The electrode was connected to a picoammeter (PA2000, Unisense). A two-point calibration was performed by inserting the electrode in normal saline solution (at 33 °C) equilibrated with either 95% O2 or ambient air. Calibrations were repeated after each experiment to determine the pO2 values. Electrode tip penetration depth was controlled via LinLab software (Scientifica, West Sussex, UK). In analysis, oxygen consumption was estimated as an integral of pO2 transient below the baseline
NAD(P)H and FAD Fluorescence Imaging
NADPH and NADH have similar optical properties; therefore it is expected that NADPH may contribute to the total autofluorescence signal. Changes in NAD(P)H fluorescence in hippocampal slices were monitored using a 290-to 370-nm excitation filter and a 420-nm long-pass filter for the emission (Omega Optical, Brattleboro, VT, USA). In the case of FAD imaging, 500–570 nm emission was excited with 400–490 nm light. The light source was the Intensiligh C-HGFI illuminator (Nikon Instruments Europe B.V., Amsterdam, The Netherlands) equipped with a mercury arc lamp. Excitation light intensity was sufficient to excite fluorophores across entire slice depth. Slices were epi-illuminated and imaged through a Nikon upright microscope (FN1, Eclipse) with × 4/0.10 Nikon Plan objective. Images were acquired using a linear, cooled 12-bit charge-coupled device camera (Sensicam, PCO AG, Kelheim, Germany) with a 640 × 480 digital spatial resolution. Because of a low level of fluorescence emission, NAD(P)H or FAD images were acquired every 600–800 ms as 8 × 8 binned images (effective spatial resolution of 80 × 60 pixels). The exposure time was adjusted to obtain a baseline fluorescence intensity between 2,000 and 3,000 optical intensity levels (50% of dynamic range). Fluorescence intensity changes in stratum radiatum near sites of LFP and O2 recordings were measured in three to five regions of interest using ImageJ software (NIH, Bethesda, MD, USA). Data were expressed as the percentage changes in fluorescence over a baseline [(ΔF/F) · 100]. Signal analysis was performed using IgorPro software (WaveMetrics, Portland, OR, USA).
[K+]o Measurements
Ion-selective microelectrodes were prepared using the method described by Heinemann and Arens. 21 In brief, electrodes were pulled from double-barrel theta glass (TG150-4, Warner Instruments, Hamden, CT, USA). The reference barrel was filled with 154 mmol/L NaCl solution. The silanized ion-sensitive barrel tip (5% trimethyl-1-chlorosilane in dichloromethane) was filled with a potassium ionophore I cocktail A (60031 Fluka distributed by Sigma-Aldrich, Lyon, France) and back filled with 100 mmol/L KCl. Measurements of K+-dependent potentials were performed using a high-impedance differential DC amplifier (kindly provided by Dr U Heinemann) equipped with negative capacitance feedback control, which permitted recordings of relatively rapid changes in [K+]o (time constants 50-200 ms). The electrodes were calibrated before each experiment and had a sensitivity of > 2 mV/mmol/L.
[Ca2+]i Imaging
Slices were transferred into a microchamber with 2 mL ACSF containing 10 μmol/L of ratiometric Ca2+ -sensitive fluorescent dye Fura-2 AM (Life Technologies, SAS Saint Aubin, France) and 0.05% of pluronic acid. Slices were incubated at room temperature with oxygenation for 45 minutes. For fluorescence monitoring, slices were placed in the submerged recording chamber and superfused (15 mL/minutes) with oxygenated ACSF at 32°C. Excitation was achieved using a 1-nm-bandwidth polychromatic light selector equipped with a 100 W (Polychrome II) xenon lamp (FEI Munich, Gräfelfing, Germany). Light intensity was attenuated using neutral density filters. Fluorescent signals were recorded using a dichroic mirror 495 nm (Omega Optical, USA) and emission filter 500 nm LP (Chroma Technology Corporation, Rockingham, VT, USA). Fluorescence was visualized using the upright microscope (Axioskop, Carl Zeiss, Jena, Germany) equipped with a × 40 water-immersion objective (n.a. 0.9; LumPlanFL, Olympus Corporation, Tokyo, Japan). Fluorescent emitted light passed to a 16-bit electron multiplying charge-coupled device digital camera system equipped with an image intensifier (Andor iXon EM +; Andor Technology PLC, Belfast, UK). All peripheral hardware control, image acquisition, and image processing were achieved using iQ software (Andor Technology PLC). The average fluorescence intensities of a dye-loaded CA1 or CA3 pyramidal cells were measured. Parameters of recording: exposure time 10–20 ms, acquisition rate 1 frame per 500 ms, binning 1 × 1. Fura-2 AM was excited using 340 and 380 nm wavelengths, the emitted fluorescence signals were recorded and ratio values F340/F380 were calculated for each frame.
ROS Fluorescence Imaging
Slices were transferred into a microchamber with 2 mL ACSF containing 5 μmol/L of ROS-sensitive fluorescent probe CellRox Orange (Molecular Probes, Life Technologies) and 0.05% of pluronic acid. Slices were incubated at room temperature with oxygenation for 45 minutes. For fluorescence monitoring, slices were placed in the submerged recording chamber and superfused (15 mL/minutes) with oxygenated ACSF at 32 °C. Excitation was achieved using a 1-nm-bandwidth polychromatic light selector equipped with a 100 W (Polychrome II) xenon lamp (Till Photonics). Light intensity was attenuated using neutral density filters. Fluorescent signals (CellRox was excited at 548 nm) were recorded using a dichroic mirror 560 nm (Omega Optical) and emission filter 632 nm LP (Chroma Technology Corporation). Fluorescence was visualized using the upright microscope (Axioskop, Carl Zeiss) equipped with a × 40 water-immersion objective (n.a. 0.9; LumPlanFL, Olympus Corporation). Fluorescent emitted light passed to a 16-bit electron multiplying charge-coupled device digital camera system equipped with an image intensifier (Andor iXon EM +; Andor Technology PLC). All peripheral hardware control, image acquisition, and image processing were achieved using iQ software (Andor Technology PLC). The average fluorescence intensity of each region of interest was measured. Parameters of recording: exposure time 30–80 ms, acquisition rate 1 frame per 2 seconds, × 40 water immersion objective, binning 1 × 1.
In Vivo Experiments
A total of 5 mature (>P50, 29 to 32 g) Swiss male mice were used for in vivo experiments. Animals were anesthetized with ketamine/xylazine narcosis (ketamine:xylazine:phosphate buffer = 6:1:20, 10 mL/kg). Body temperature was kept at 37 °C using a heating pad. Mice were placed in a stereotaxic frame (Stoelting, Wood Dale, IL, USA) and four burr holes were drilled at the following coordinates (mm from the bregma): (1) posterior 3.8, lateral 2 (parieto-occipital cortex) for topical KCl application (2 mm diameter); (2) anterior 1, lateral 1 (frontal cortex) for registration of LFP; (3) posterior 0.7, lateral 1 for intracerebroventricular injection of Tempol (4-hydroxy-2,2,6,6-tetramethylpiperidine-1-oxyl); (4) posterior 4.5, lateral 2 for implantation of indifferent Ag/AgCl electrode. The needle of Hamilton syringe filled with 1 mol/L Tempol solution was lowered (1.7 mm under skull) directly to ventricles. Dura was gently removed at the KCl site, and care was taken to avoid bleeding. To prevent KCl leaking, fenced bath from dental cement (volume of 200 μL) was made around application site. After surgical preparation, the cortex was kept under saline to prevent drying. The extracellular steady (DC) LFPs were recorded using glass microelectrodes filled with ACSF, deepen 0.5 mm under the skull on frontal cortex, and connected to the ISO DAM-8A amplifier (WPI). A cotton ball (2 mm diameter) generously soaked with 3 mol/L KCl (≈50 μL) was placed on the pial surface and replaced every 30 minutes. During Tempol application, 0.4 μL of 1 mol/L Tempol was injected into ventricles as well as 5 μL of the antioxidant solution was added under the cotton ball with KCl every 30 minutes. The number of KCl-induced SDs was counted for 1 hour. KCl-induced SD frequency was measured.
Pharmacology
Drugs used were purchased from Sigma (glutamate sodium salt, pyruvate sodium salt, Tempol, IOA, Cyclosporin A, and carbenoxolone).
Statistical Analysis
Group measures were expressed as means ± s.e.m. Statistical significance was assessed using Student's paired t-test. Otherwise, the Wilcoxon's signed paired test was applied. The level of significance was set at P < 0.05.
RESULTS
Replacement of Glucose with Mitochondrial Energy Substrates Results in Metabolic Collapse
In glucose-ACSF, a 100 Hz, 1 second stimulation of Schaffer collaterals induced transient changes in tissue oxygen, NAD(P)H and [K+]o (red traces in Figure 1A, left). A sequence of imaging frames in Figure 1A, right panel, illustrates the NAD(P)H fluorescence change after the high-frequency stimulation. For better visualization, in each frame the decrease in fluorescence (set with a threshold and shown in black) corresponding to the NAD(P)H oxidation is overlapped with a background bright-field image. Note that a ‘spotted’ NAD(P)H imaging is the artifact of all-or-none ‘thresholding’ procedure that reflects NAD(P)H fluorescence with the intensity below the initial level (threshold);the real fluorescence under ultraviolet light is homogeneous.
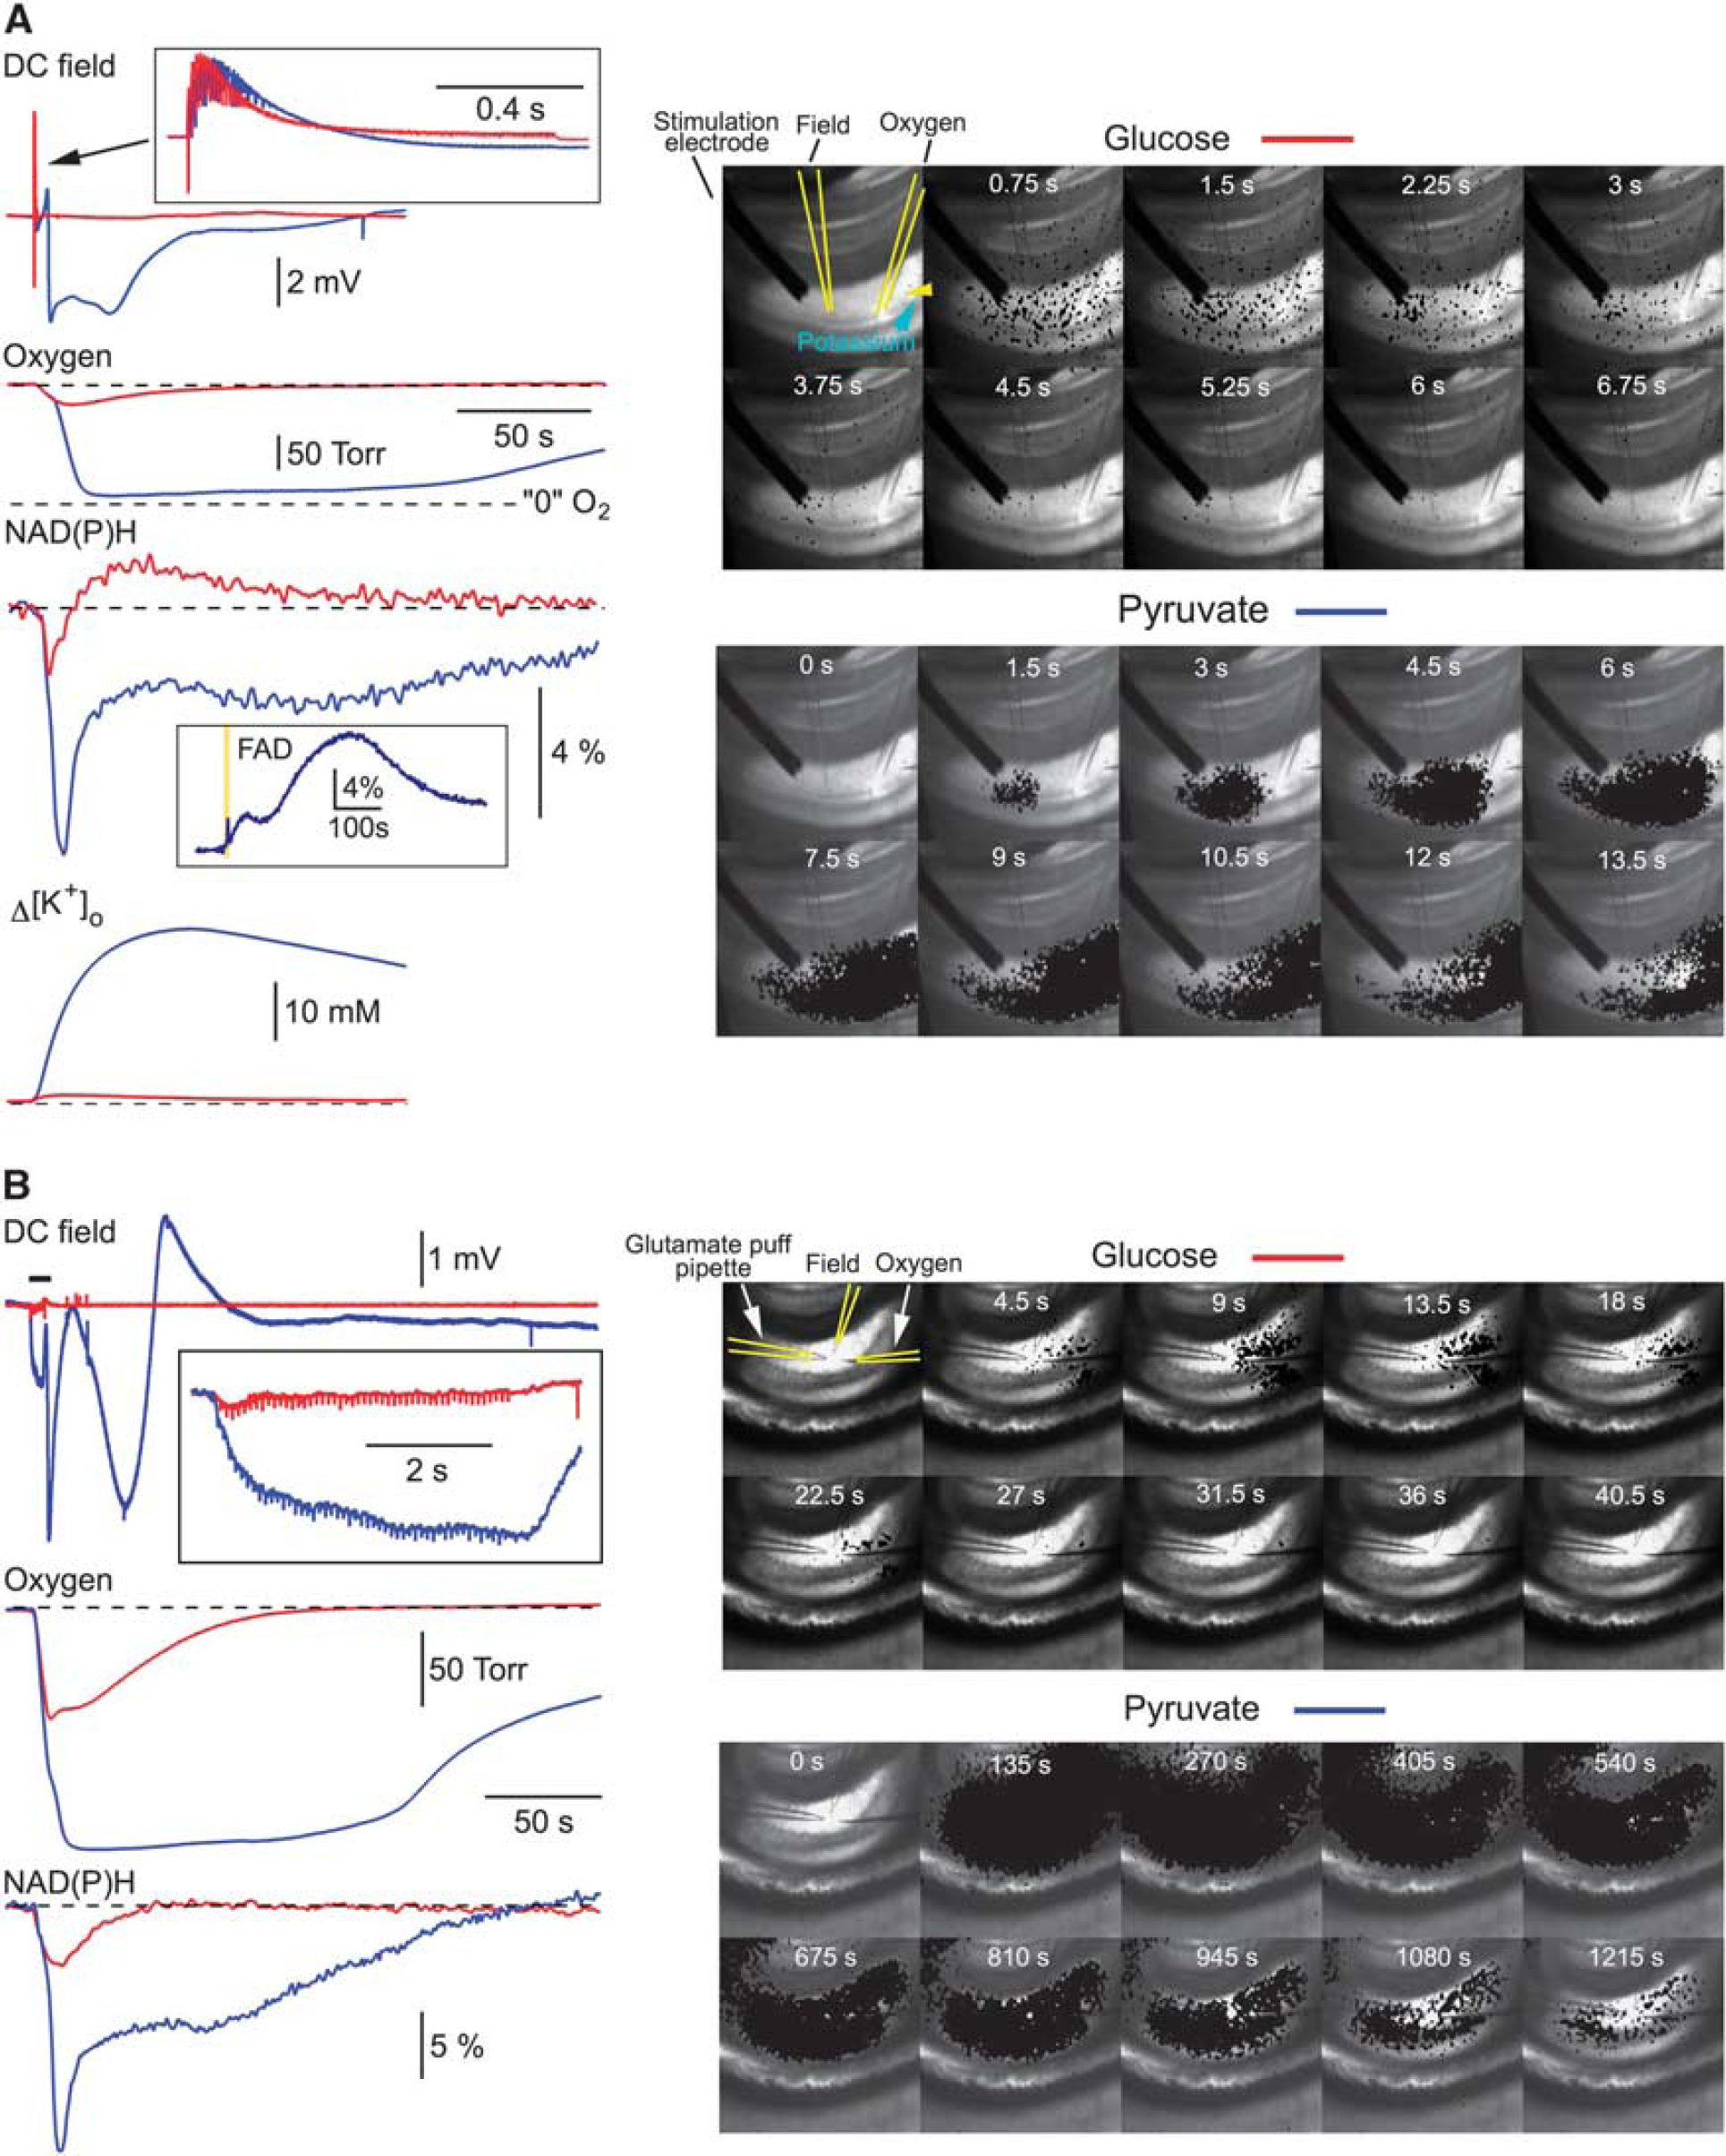
Metabolie collapse in pyruvate-ACSF. (
In pyruvate-only ACSF, in 14 out of 40 experiments (35%), the 100 Hz, 1 second stimulation induced a strong long-lasting deflection of DC field potential, drop of the O2 tension almost to zero for several minutes, an enormous decrease in NAD(P)H fluorescence, a large increase in [K+]o (blue traces in Figure 1A, left) and a long-lasting absence of postsynaptic electrical activity. Note also the inset with FAD fluorescence recorded in another experiment; a large increase in FAD fluorescence versus a transient decrease in NAD(P)H verifies the metabolic origin of signals and rules out the involvement of artifactual fluorescence variations induced by, e.g., cell swelling. Such drastic changes in both electrical and metabolic functions of cells we named ‘metabolic collapse’ (MC). Indeed, these recordings indicate that the cellular energy metabolism is overloaded to the point that the cells fail to efficiently manage ionic gradients. NAD(P)H autofluorescence imaging (Figure 1A, right bottom panel) shows that stimulation evokes a local NAD(P)H drop (NAD(P)H oxidation) in the vicinity of stimulation site, which is then followed by a massive ‘black’ wave spreading throughout hippocampus. In a half of slices, the electrical and metabolic parameters recovered to the pre-stimulation levels in ˜20–30 minutes and MC could be reproduced by a similar stimulation thereafter. In other experiments (7 out of 14), the MC was irreversible. Interestingly, in the same experiments where we observed the MC after the 100 Hz, 1 second stimulation, it could not be induced by the repeatedly applied 10 Hz, 10 second stimulations, although the number of stimuli was equal at both frequencies. We also recorded the MC in three out of seven experiments where a glutamate puff train stimulation 22 was employed (10 mmol/L, 10 ms puffs, 10 Hz, 5 seconds) in pyruvate-ACSF (Figure 1B). In contrast, we never observed the MC in glucose-ACSF (n = 43) even while using more intense stimulations (e.g., 100 Hz, 5 seconds) or long-lasting (up to 30 seconds) glutamate puff trains. In all experiments, the 100 Hz stimulation was initially applied in glucose-ACSF before the exchange for pyruvate-ACSF, excluding any contribution of LTP synaptic changes to the MC initiation.
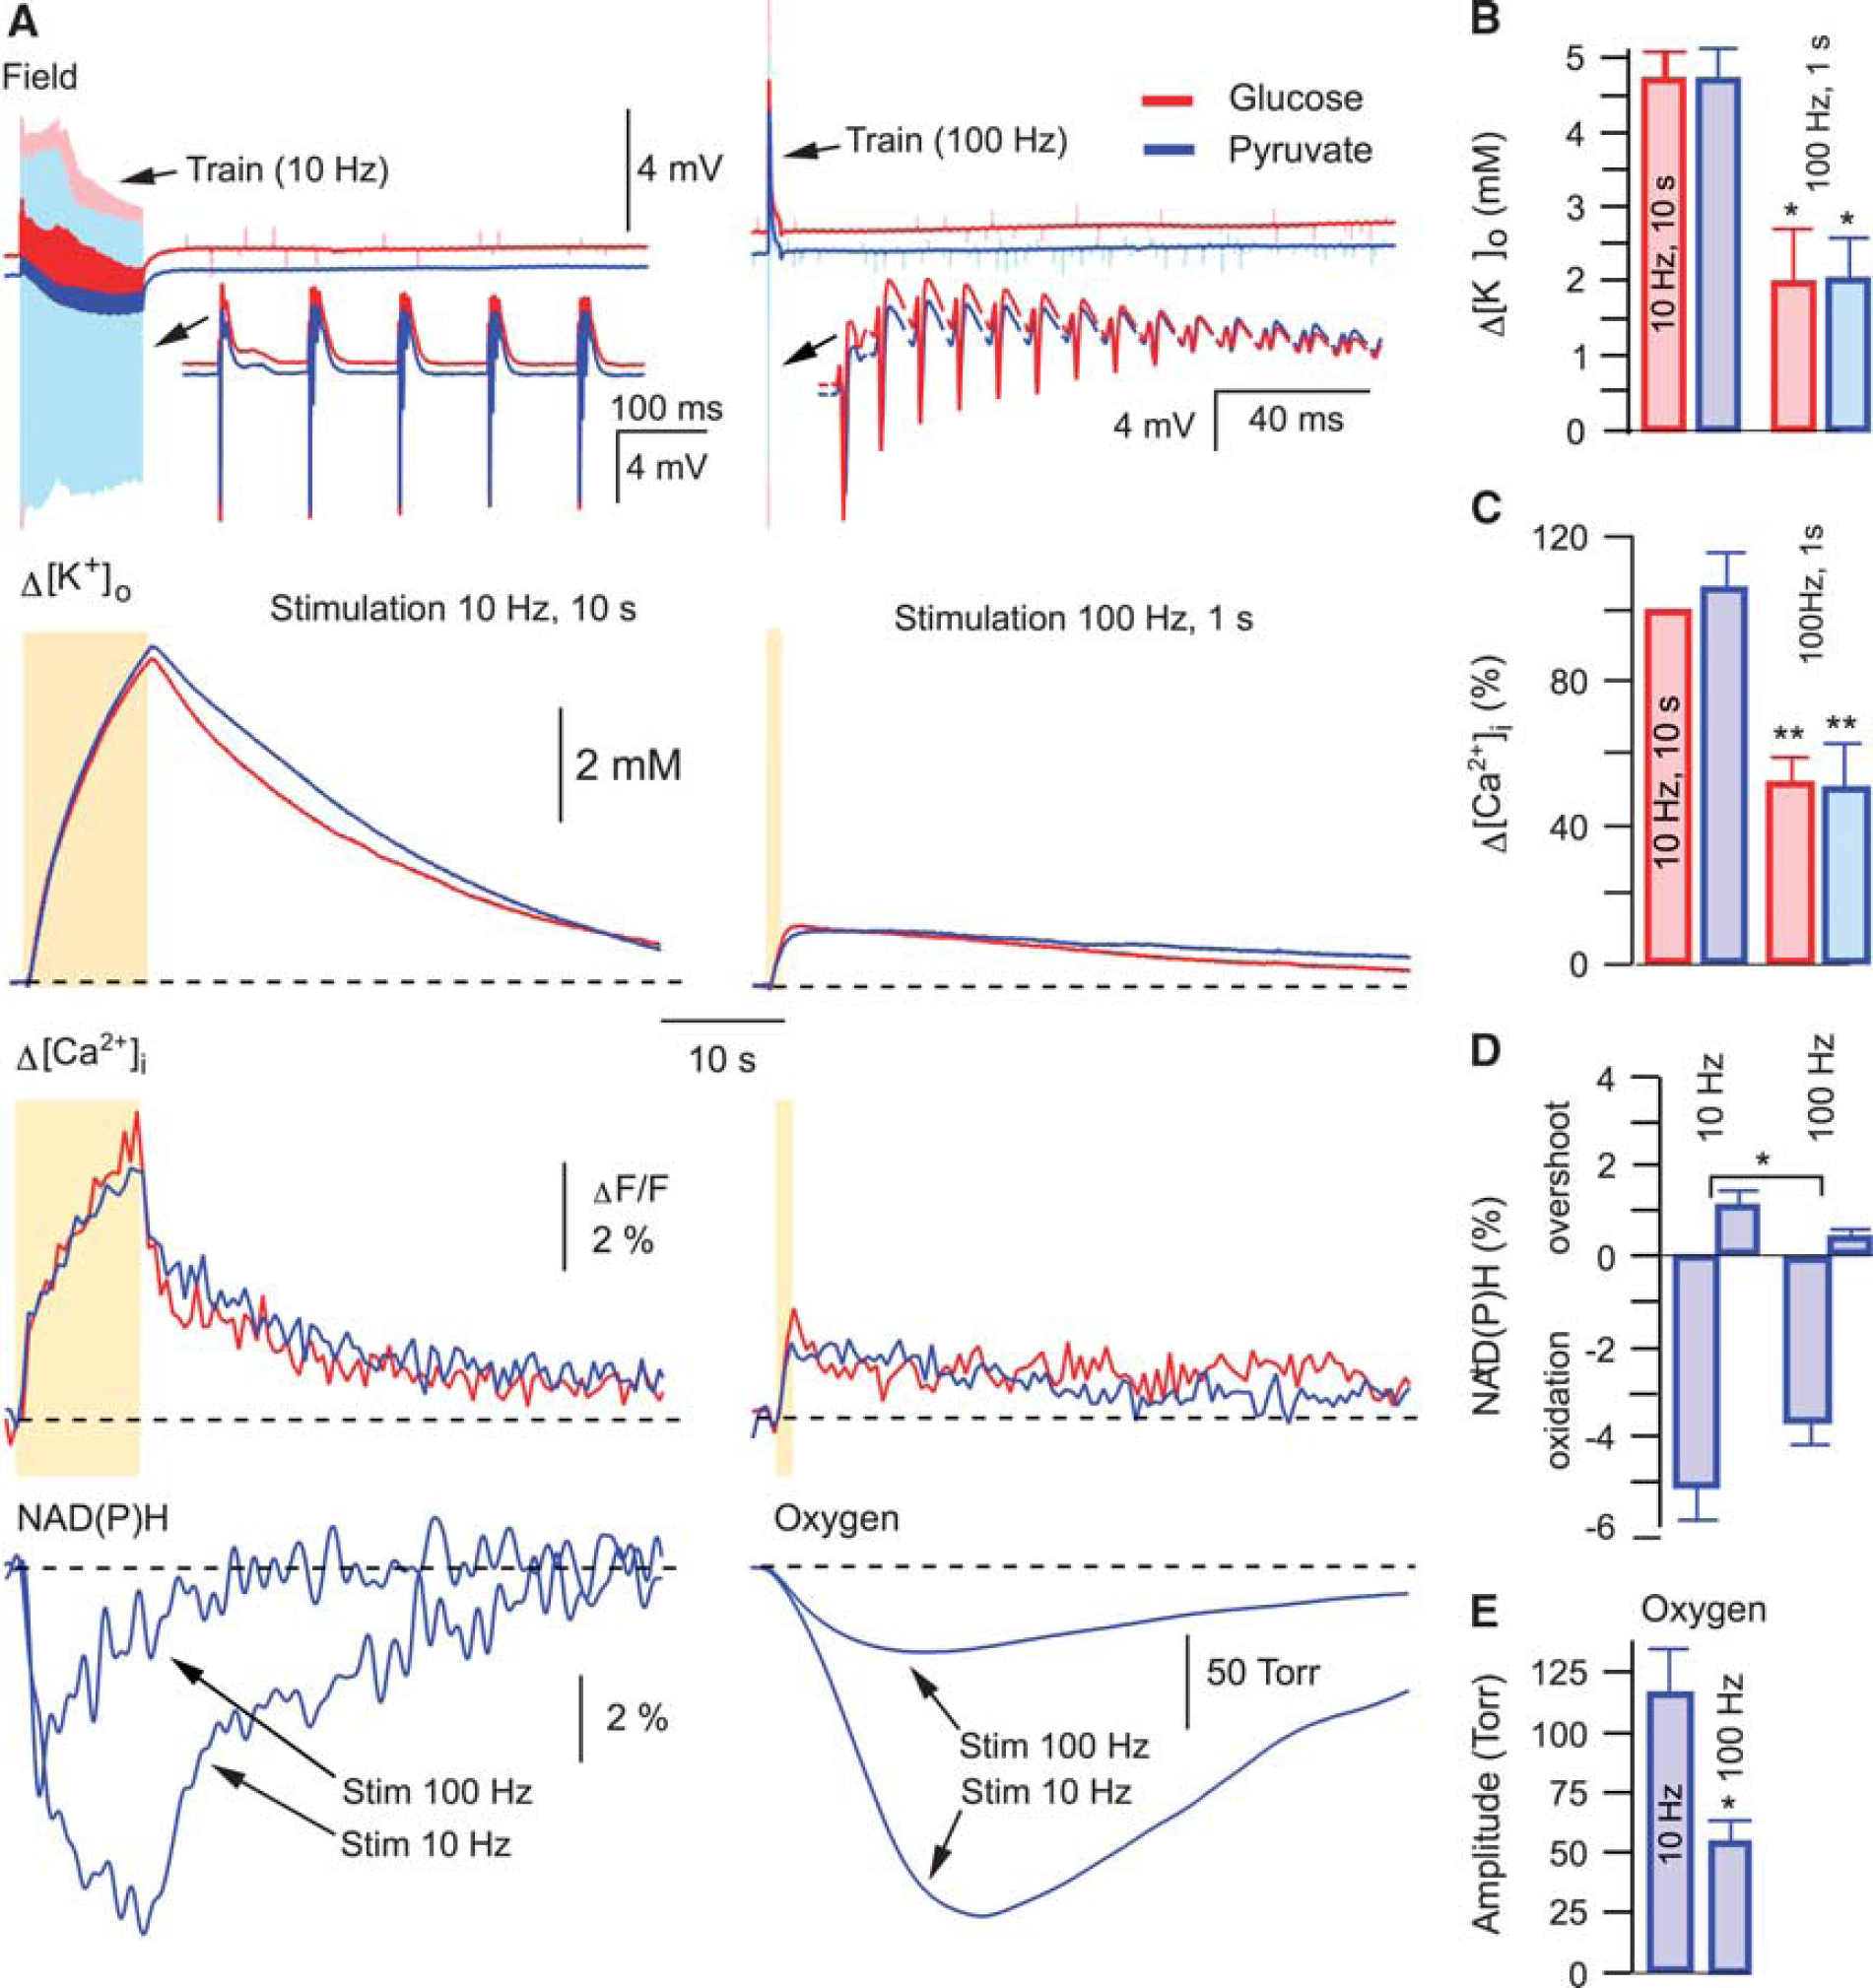
Our results show that the exchange of glucose for alternative mitochondrial energy substrates in ACSF is a precondition for the induction of MC. This suggests that some critical parameters affecting cellular functioning had been modified by the exchange, thus enabling the induction of the phenomenon. It has been reported that mitochondrial energy substrates such as lactate and pyruvate, supplied exogenously in exchange for glucose, can efficiently support synaptic function and network activity in brain slices.22,23 We have also shown previously that neither pyruvate nor lactate induce significant intracellular acidification 22 and that the substitution of glucose in ACSF for pyruvate did not result in any changes in ATP content in slices. 22 Using different stimulation paradigms, we now examined several parameters that relate to a cellular metabolic state (Figure 2) and which could be responsible for MC initiation. At both 10 Hz (10 seconds) and 100 Hz (1 seconds) stimulations, field potentials (DC mode) were similar in glucose- and pyruvate-ACSF, indicating the absence of excessive depolarizing shift under pyruvate (Figure 2A, top). The extracellular K+ rise was much smaller at the 100 Hz stimulation compared with the 10 Hz protocol and similar across both ACSF solutions, ruling out the possibility of over-accumulation of extracellular K+ in pyruvate (Figures 2A and 2B). Likewise, the induced Ca2+ transients were similar in both solutions as well as being smaller at the 100 Hz stimulation, suggesting the absence of intracellular Ca2+ overload in pyruvate-ACSF (Figures 2A and 2C). In addition, at both 100 Hz and 10 Hz stimulations, 22 the oxygen consumption was always higher in pyruvate-ACSF, indicating more intense mitochondrial energy metabolism. To delineate why the 100 Hz but not the 10 Hz stimulation with the same number of stimuli could induce the MC in pyruvate-ACSF, we also measured the oxygen and NAD(P)H transients: both transients were much larger at 10 Hz stimulation (Figure 2A, bottom), indicating that it is not an enhanced energy consumption at 100 Hz stimulation that triggers the MC.
In the absence of collapse, synaptic stimulation induces similar responses in glucose- and pyruvate-ACSF. (
It can be argued, however, that the parameter changes at 100 Hz stimulation are too fast to be detected reliably by our sensors and therefore we do not measure rapid energydependent changes occurring under high-frequency stimulation. To demonstrate that this is not the case, Figure 3A shows superimposed field trace recordings at 10 Hz and 100 Hz stimulations in the same experiment. It is obvious that at 100 Hz, high neuronal activity lasts for only about initial 200 ms while for the remaining 80% of stimulation time it rapidly decays to a negligible value due to inactivation/desensitization of time-dependent synaptic parameters. At 10 Hz, however, the neuronal activity remains high throughout the stimulation. We also measured NAD(P)H and FAD fluorescence induced by 10 Hz and 100 Hz trains using high (25–30 ms sample time) temporal resolution (Figures 3B and 3C). Interestingly, at the same stimulation frequency, the upstroke of FAD signal was faster than the decay of NAD(P)H one (see Figure 3C), indicating significant glycolytic NAD(P)H production during synaptic stimulation, in agreement with the results we reported recently. 22 Meanwhile, both FAD upstroke and NAD(P)H decay were faster at 100 Hz (Figure 3B), but the corresponding amplitudes and time of oxidation were significantly smaller than those at 10 Hz (Figures 3B and 3C), indicating smaller mitochondrial NADH/FADH2 oxidation at 100 Hz. Altogether, our results demonstrate that energy demands at 100 Hz, 1 second synaptic stimulation are smaller than those at 10 Hz, 10 seconds. Therefore, the occurrence of MC cannot be explained as a consequence of energy deficiency.
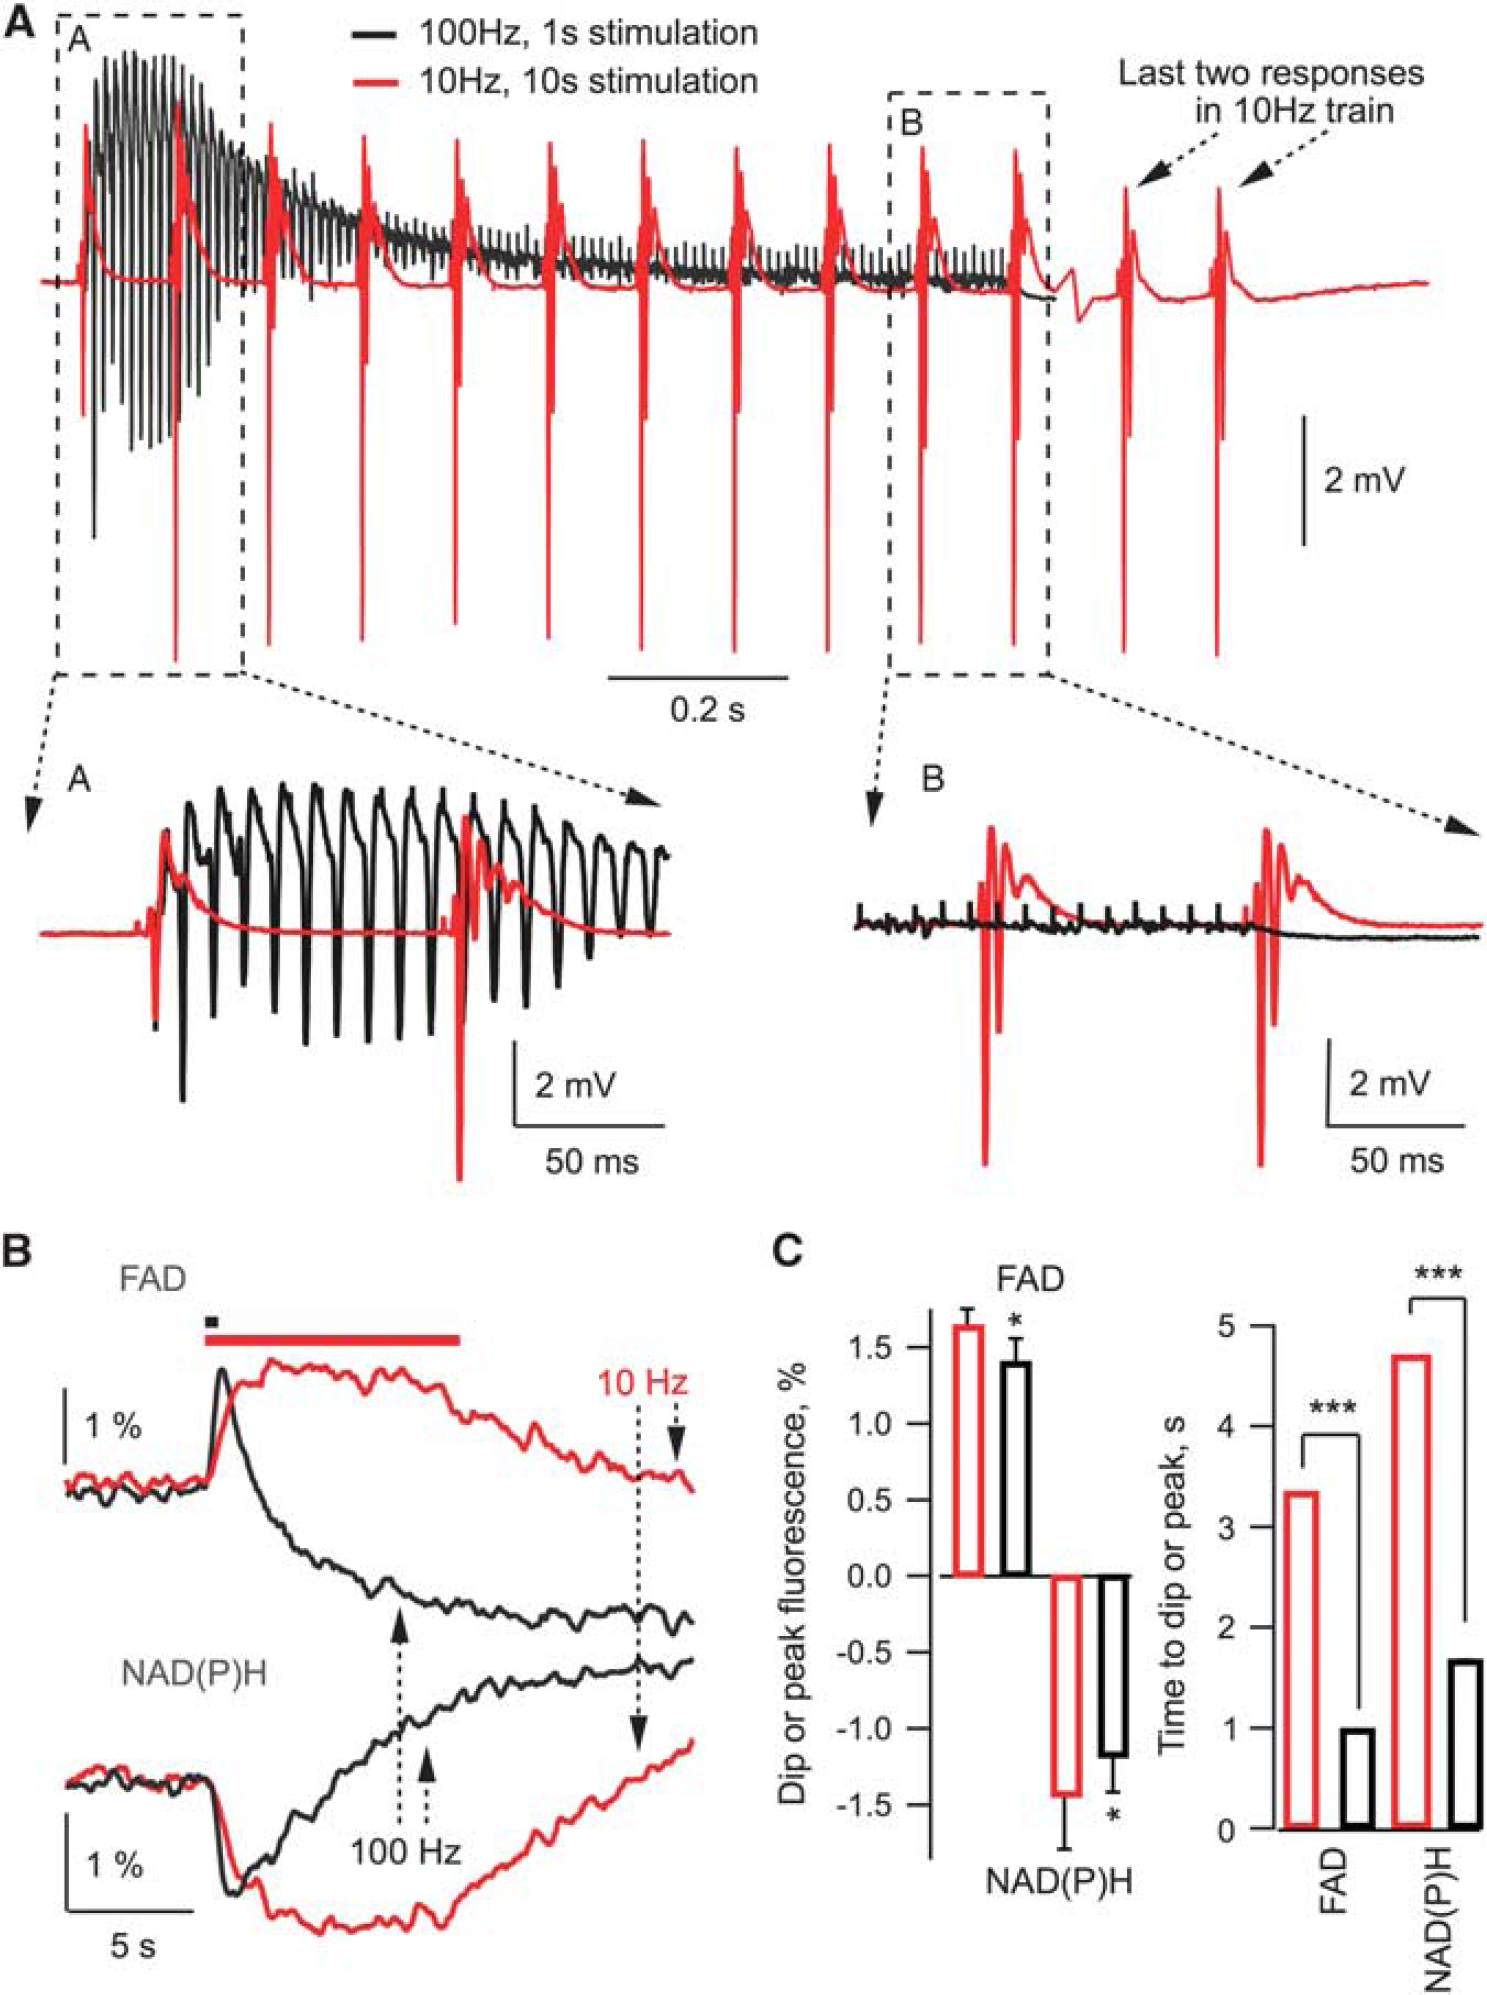
Field potentials and NAD(P)H/FAD responses at 10 Hz and 100 Hz stimulation. (
Searching for other candidates potentially capable of promoting the MC, we also explored the means of inducing a fast decay in the intracellular ATP levels, namely by opening of the mitochondrial permeability transition pore, or Pannexin 1 channels. The mitochondrial permeability transition pore is the protein that can be expressed in the inner mitochondrial membrane, shunting its potential and preventing ATP production. 24 Pannexin 1 forms large transmembrane channels connecting the intracellular and extracellular space, and allowing the ATP passage. 25 Thus, activation of the above mentioned proteins could rapidly induce energy deficiency and thus stimulate the MC induction. However, in all trials, blockade of neither mitochondrial permeability transition pore (by 10 μmol/L cyclosporine A; n = 3) nor Pannexin 1 channels (by 20 μmol/L carbenoxolone; n = 3) prevented the occurrence of MC in pyruvate-ACSF.
Altogether, we did not find any significant modifications in electrophysiological characteristics, ionic concentrations, or energy supply, the conditions that could underlie the ignition of MC when glucose was substituted for pyruvate. However, as the MC still could not be induced in a number of slices superfused with pyruvate-ACSF, we performed similar experiments with addition of IOA, an inhibitor of glyceraldehyde-3-phosphatedehydrogenase, effectively blocking glycolysis. Indeed, in this solution, the irreversible MC occurred in 100% of cases either following electrical stimulation (n = 9) or spontaneously (n = 8).
By its effect (e.g., propagating depolarization, extreme energy demands) the MC resembles spreading depression or anoxic depolarization waves previously observed in slices.25–31 These events were induced either by local applications of very high K+ concentration (1 mol/L) at normoxic conditions27,29 or hypoxia/hypoglycemia,25,26,28,31 and were generally attributed to strong disruption in energy metabolism, although the direct involvement of ATP production in the wave ignition was debated. 28 In our experiments, however, the MC was readily induced without the extreme stimulation or deficiency in energy supply.
We conclude from our results that the absence of some glucose-mediated processes not related to the energy production triggers the MC. One of the presumed molecular pathways was the pentose phosphate shunt, which underlies the cytosolic antioxidant system.32–34
Reactive Oxygen Species Induce the Metabolic Collapse
Mitochondrial respiration, especially during increased synaptic activity, inevitably results in the production of a large amount of ROS. A portion of ROS is normally degraded in mitochondria but some fraction (e.g., H2O2) can diffuse to cytoplasm where it needs to be rapidly deactivated by endogenous antioxidants (e.g., glutathione and thioredoxin). ROS strongly interact with a large number of molecules, and ROS accumulation may lead to the impairment of multiple cellular functions. This may occur in case of the inhibition of the cytosolic antioxidant system. Importantly, in addition to the glycolysis blockade, IOA depletes cellular glutathione, compromising the cytosolic antioxidant system and also directly inhibits glutathione peroxidase—the enzyme responsible for glutathione-dependent peroxides elimination.35,36
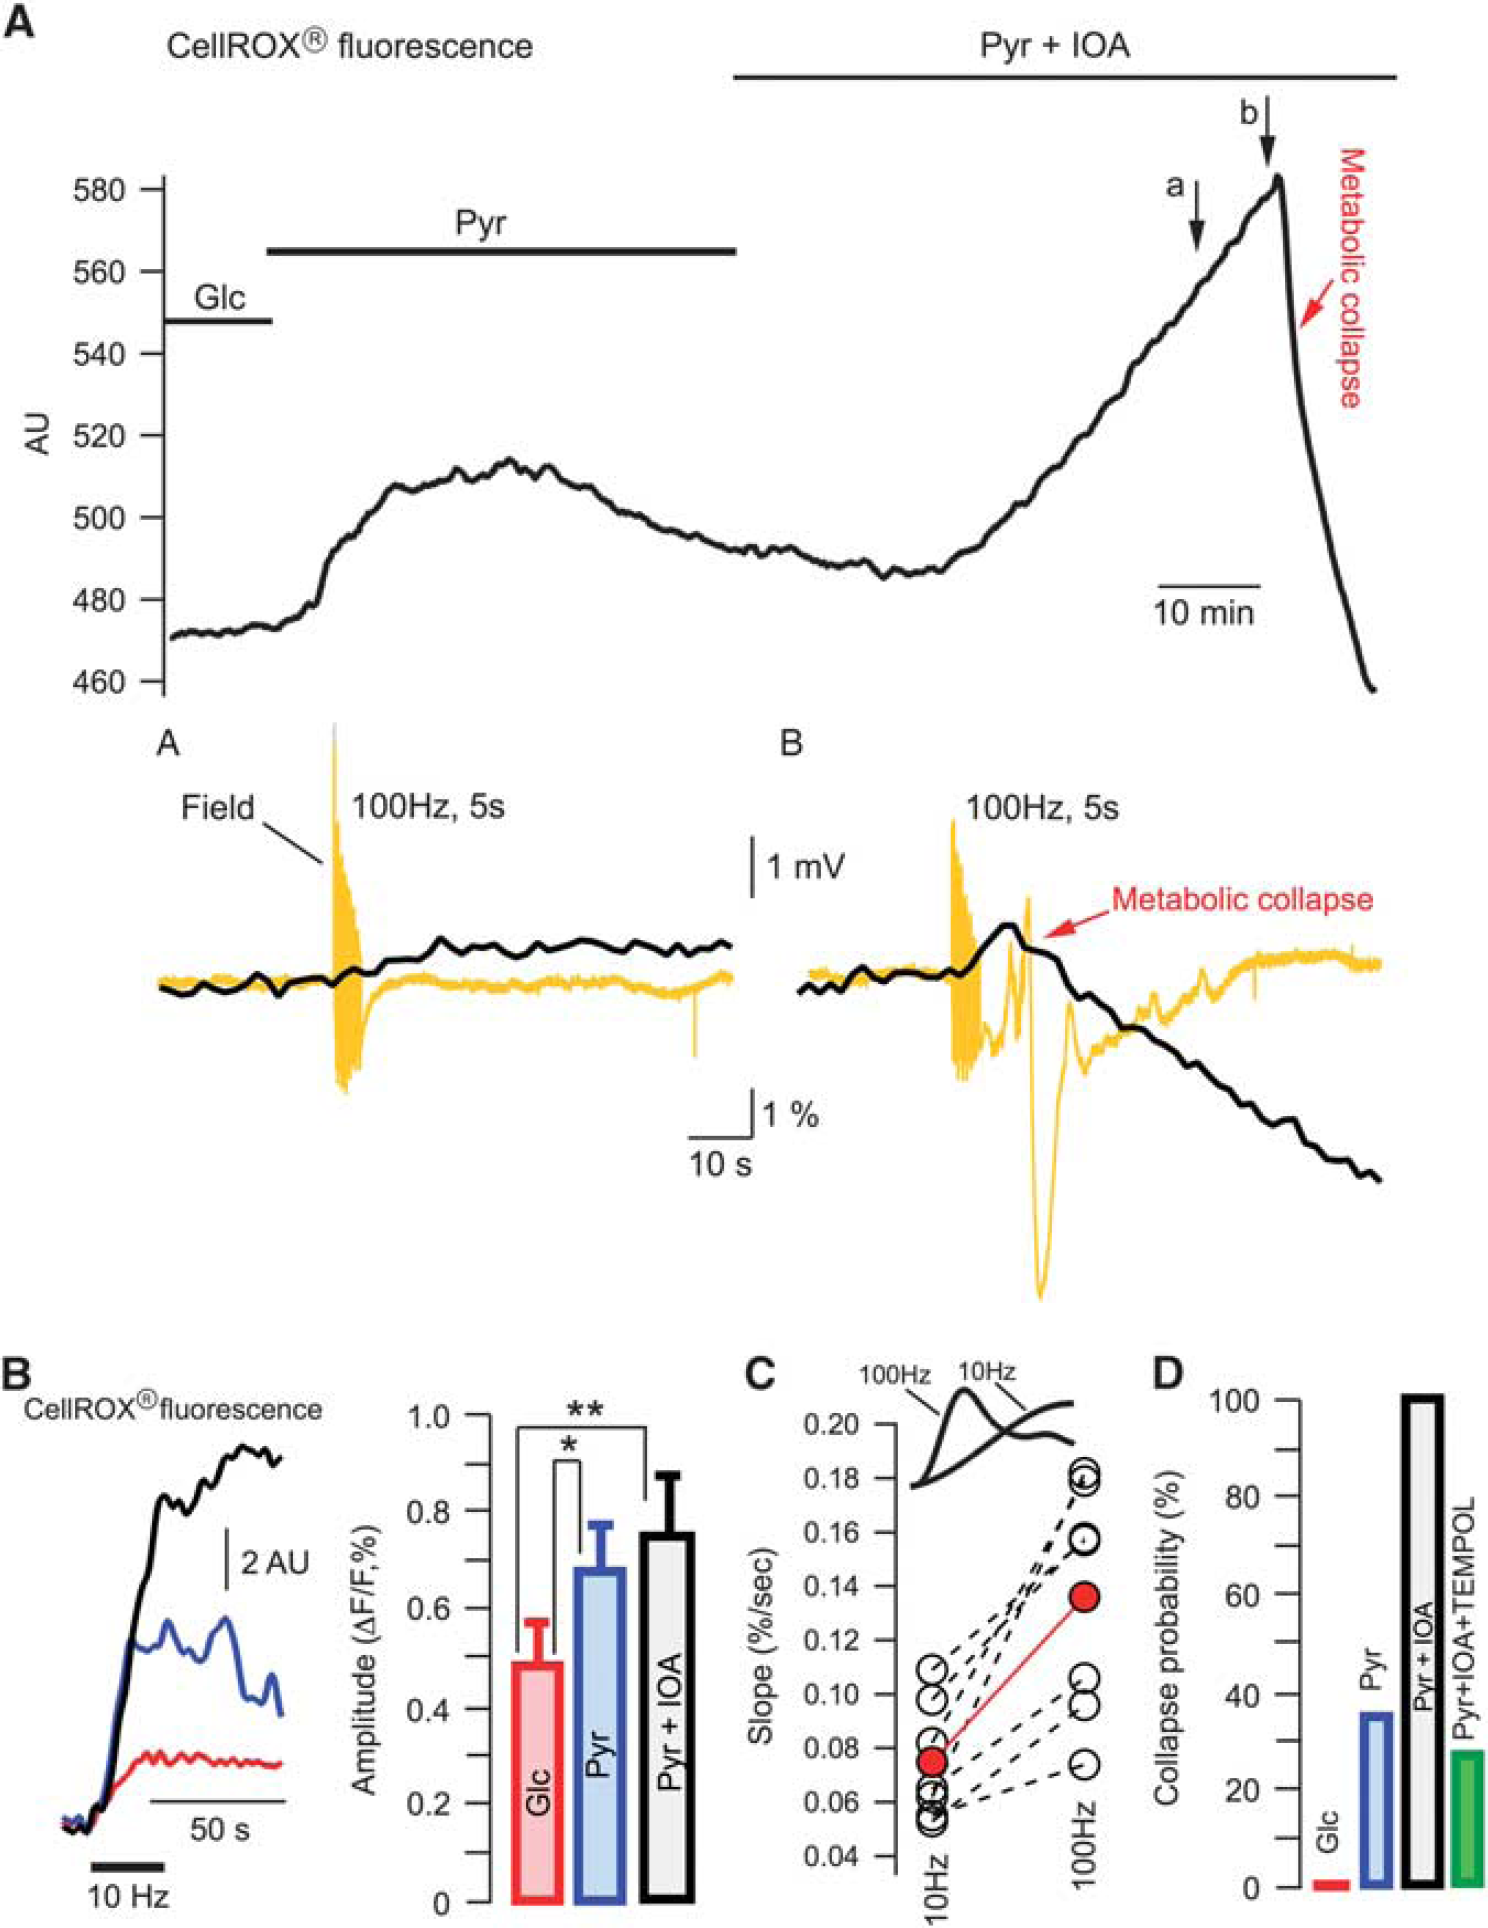
To explore this further, we measured the fluorescence of ROS probe, CellROX (see Supplementary Figure S1A), in seven experiments either in glucose- or pyruvate-ACSF (Figure 4A). The baseline fluorescence increased gradually after the exchange of glucose for pyruvate, indicating a rise in ROS concentration. The later decline of fluorescence in pyruvate-ACSF is most likely explained by washout of the oxidized dye because of a high ACSF superfusion rate (15 mL/minute; Supplementary Figure S1B). However, after the addition of IOA to pyruvate-ACSF, the fluorescence rose robustly until the occurrence of MC. Importantly, the transient response to a 100 Hz, stimulation was enhanced considerably during the last stimulation preceding the MC (Figure 4A, compare insets (a) and (b)). The MC was associated with swelling of the cells (importantly, the cell swelling was never observed before the collapse initiation) that shifted them out of focus because of a high optical magnification (× 40 objective) used in these experiments. This explains a drop of fluorescence subsequent to the collapse initiation.
Reactive oxygen species triggers the metabolic collapse. (
To explore the ROS level changes during evoked synaptic activity in glucose- or pyruvate-ACSF we used the 10 Hz, 30 seconds stimulations to avoid the MC initiation. The increase of ROS induced by the stimulation was significantly larger in pyruvate-ACSF compared with glucose-ACSF (Figure 4B). Importantly, the fluorescence transients disappeared after the blockade of synaptic activation by tetrodotoxin (data not shown) ruling out a possibility of any tissue movement artifacts during stimulation.
To clarify the reason why in pyruvate-ACSF the induction of MC appeared to be facilitated by high-frequency stimulation, we measured the slope of fluorescent transients¿ upstroke (Figure 4C). Indeed, the production of ROS is proportional to cell activity and the initial ‘activity integral’ at 100 Hz is considerably larger, as more postsynaptic activity occurs within the first 100 ms compared with the only 1–2 stimuli that take place with 10 Hz during this time (see Figure 2A). In all slices (n = 7), the rise of fluorescence during stimulation was significantly faster at 100 Hz compared with that at 10 Hz. Meanwhile, the transients did not differ significantly in their peak amplitudes (0.8 ± 0.19% and 0.72 ± 0.14%, respectively; P > 0.3). Rapid accumulation of ROS during 100 Hz stimulation may be one explanation for the collapse initiation at this frequency. Note, however, that in the presence of IOA, the MC could be induced by any kind of stimulation or even appeared spontaneously in all 17 experiments. This is in line with a much higher level of basal ROS at these conditions (see Figure 4A).
For mimicking the conditions of deficiency in endogenous antioxidants, we attempted to block the pentose phosphate pathway in slices by applying its regular antagonists, 6-aminonicotinamide or dehydroepiandrosterone. 37 These inhibitors, however, have a low efficacy (IC50 > 0.4 and 3 mmol/L, respectively) and limited solubility in ACSF, factors that made the use of 6-aminonicotinamide impossible in our experiments. Conversely, dehydroepiandrosterone at 0.3 mmol/L concentration induced strong hyperexcitability manifested by drastic increase in field responses and emergence of interictal spontaneous activity (Supplementary Figure S2), effects that may be explained by its multi-faceted and unspecific activity (e.g., inhibition of GABAA receptors 38 or increase in spontaneous glutamate release 39 ).
To verify the role of ROS in MC induction we superfused slices with pyruvate-ACSF containing IOA as well as an efficient antioxidant, Tempol (2 mmol/L). Tempol is a member of family of nitroxide compounds that has been studied extensively in animal models of increased ROS. 40 It has been demonstrated that Tempol is significantly more effective than many other frequently used antioxidants and far more effective than vitamins. 40 In glucose-ACSF, Tempol induced no changes in parameters recorded in our experiments. At the same time, despite intense stimulation, MC occurred in only 3 out of 11 experiments in the presence of Tempol, while it occurred in all identical experiments in its absence (n = 17, see Figure 4D).
Therefore, the occurrence of MC in cortical slices is not caused by deficiency in energy metabolism or inadequate ionic homeostasis, but is strongly associated with the acute increase in ROS accumulation because of downregulated mechanisms of cytosolic glucose metabolism. This points to the vital importance of glucose during neuronal network activity.
Elimination of ROS Strongly Inhibits Initiation of Spreading Depression In Vivo
The phenomenon of MC resembles in some respects the well-documented events of CSD.6,10 In spite of a variety of approaches used for triggering CSD, they are all associated with a profound oxidative stress.17–20 In particular, a gradual increase in the basal H2O2 level has been directly demonstrated in vivo during 1 hour of CSD induction by KCl applications. 18 Consequently, we suggested that if the MC we observed in slices is related to the CSD, the accumulation of ROS might contribute to the CSD initiation as well.
To verify this hypothesis, we induced CSD in anesthetized mice by continuous focal application of 3 mol/L KCl to the cortical surface. KCl readily evoked recurrent CSD transients (Figure 5A). Thereafter, 0.4 μL of 1 mol/L Tempol was repeatedly injected into ventricles every 30 minutes. Tempol caused a strong reduction in occurrence of CSD, in some cases the complete blockade of event appearance (e.g., mouse 2 in Figure 5A). The consequent local washout with ACSF followed by application of KCl resulted in the recovery of CSD generation. One possibility was that Tempol inhibited not the CSD generation but rather its propagation throughout brain tissue. This, however, is unlikely as we found that individual CSD events propagate well despite their lower occurrence rate (see Supplementary Figure S3). Figure 5b demonstrates a summary of CSD induction rate in five analogous experiments. Thus, in the presence of exogenous antioxidant, the efficacy of KCl in inducing CSD is significantly diminished, suggesting that ROS strongly contribute to CSD initiation.
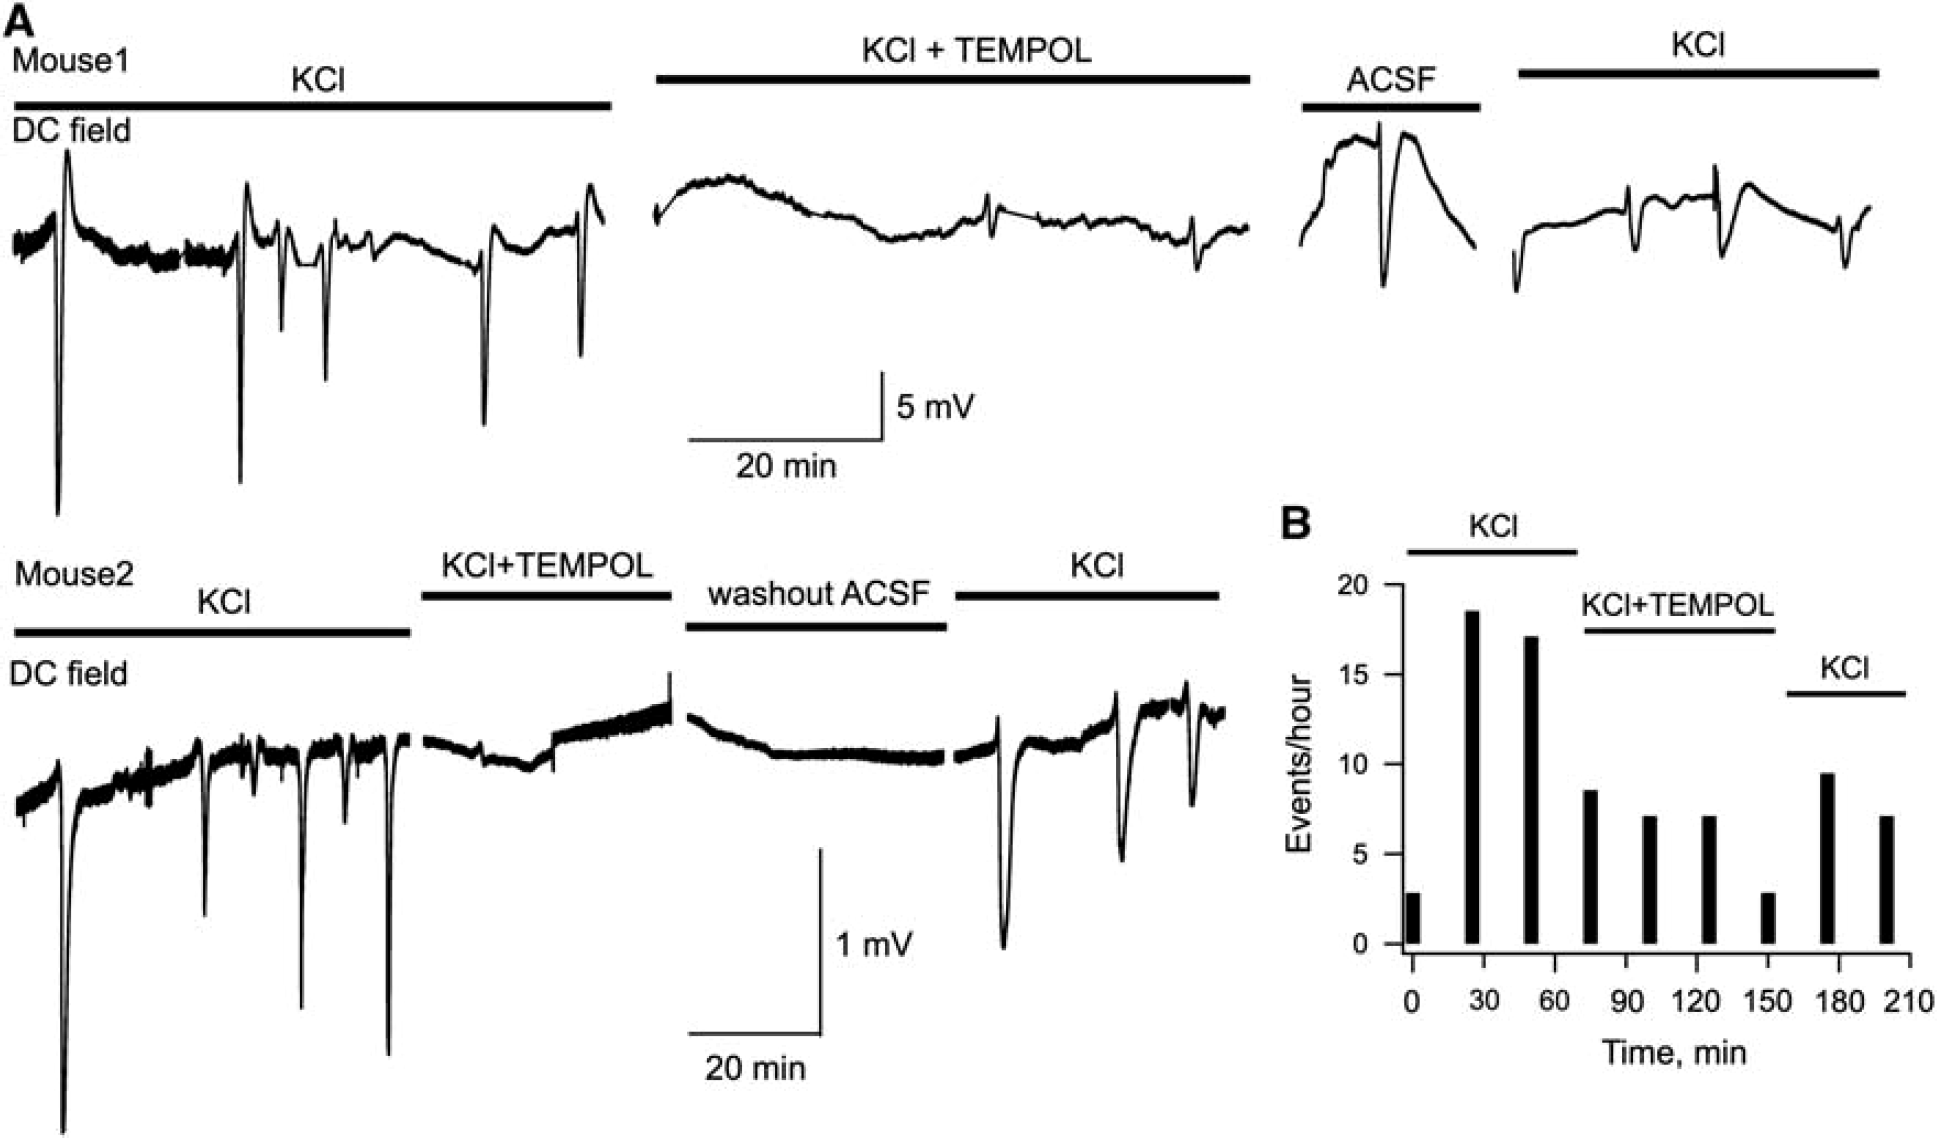
Initiation of cortical spreading depression in vivo is strongly inhibited by eradicating ROS with an exogenous antioxidant. (
DISCUSSION
In this study we show that cytoplasmic accumulation of ROS can induce massive and abrupt changes in cellular functions spreading throughout the neuronal network. The ROS buildup was induced by downregulation of cytoplasmic glucose-mediated antioxidant system and was not associated with noticeable changes in parameters of neuronal activity before the MC event. The fact that the MC could be induced by only high-frequency stimulation in the nominal absence of glucose (pyruvate-ACSF) suggests the requirement of fast ROS accumulation at these conditions (see Figure 4C). Under the blockade of the antioxidant system (pyruvate-ACSF + IOA), the MC often occurred spontaneously, presumably because of a much higher basal level of ROS (Figure 4A). At present, it is very problematic to define the primary molecular targets of ROS action, as they can affect multiple cellular components. It is obvious, however, that glucose utilization has a vital role in protecting normal neuronal function, especially during events of intense network activity when ROS production is amplified.
A pathology likely demonstrating the occurrence of MC is spreading depression. In the experimental in vivo and in vitro models, the propagating wave of neuronal depolarization associated with CSD could be induced with or without preceding deficiencies in energy supply (such as ischemia, anoxia, hyperglycemia, and energy metabolism antagonists), by modulation of ionic gradients (high K+, blockade of K+/Na+ ATPase), or by application of neurotransmitters.6,9,10 These multifunctional approaches underlie different hypotheses on a primary trigger for the CSD onset. 9 We show that ROS accumulation, characteristic for all approaches mentioned above, is capable of triggering an abrupt MC that reproduces most features of CSD. This suggests that oxidative stress may be the primary cause of CSD and not just its consequence.17–20 In pathological conditions, the failure to neutralize ROS during the excessive ROS surge and/or deficiency of the neuronal antioxidant system may result in the MC and subsequent ignition of CSD. Indeed, our in vivo results show that when the oxidative stress-induced ROS accumulation is suppressed by an exogenous antioxidant, CSD occurrence is strongly reduced.
Footnotes
References
Supplementary Material
Please find the following supplemental material available below.
For Open Access articles published under a Creative Commons License, all supplemental material carries the same license as the article it is associated with.
For non-Open Access articles published, all supplemental material carries a non-exclusive license, and permission requests for re-use of supplemental material or any part of supplemental material shall be sent directly to the copyright owner as specified in the copyright notice associated with the article.