
Abstract
While ischemic stroke reflects focal damage determined by the affected vascular territory, clinical symptoms are often more complex and may be better explained by additional indirect effects of the focal lesion. Assumed to be structurally underpinned by anatomical connections, supporting evidence has been found using alterations in the functional connectivity of resting-state functional magnetic resonance imaging (fMRI) data in both sensorimotor and attention networks. To assess the generalizability of this phenomenon in a stroke population with heterogeneous lesions, we investigated the distal effects of lesions on a global level. Longitudinal resting-state fMRI scans were acquired at three consecutive time points, beginning during the acute phase (days 1, 7, and 90 post-stroke) in 12 patients after ischemic stroke. We found a preferential functional change in affected networks (i.e., networks containing lesions changed more during recovery when compared with unaffected networks). This change in connectivity was significantly correlated with clinical changes assessed with the National Institute of Health Stroke Scale. Our results provide evidence that the functional architecture of large-scale networks is critical to understanding the clinical effect and trajectory of post-stroke recovery.
Keywords
INTRODUCTION
The brain is a complex network of interacting functionally and structurally connected regions. As brain functions emerge from interacting regions that are part of a network topology,1–4 so too can alterations across networks coincide with various pathological states such as disorders of consciousness,5,6 Alzheimer's disease, 7 neuropsychiatric disorders, 8 and stroke.9–13 Stroke lesions provide a unique model of how local damage can result in long-distance alterations. Similar structural damage has been shown to result in different levels of impairment to functionality, and patients can present multiple deficits in the acute phase that are not easily attributed to the direct effect of the focal lesion.10,14 The complex symptoms not explained by damage to the infarct core are partially explained by hypoperfusion in penumbral areas surrounding the lesion,15,16 as well as effects on distal regions connected to the damaged tissue. 17
Using functional connectivity measures based on temporal correlation of spontaneous blood oxygenation level-dependent (BOLD) signal fluctuations (resting-state fMRI), it has previously been shown that localized brain lesions can cause connectivity-based changes in regions that are structurally intact and far from the lesion site. This phenomenon has been demonstrated in the motor13,18,19 and attention networks,9,20 and has also been shown to correlate with behavioral improvement in the post-stroke recovery phase.9,13,18-20
Heterogeneity of lesions in terms of location and size is one of the notorious challenges in stroke research. A generalizable analytic method could enable investigators to explore changes within several networks to address a single question. In a recent study by Nomura
Here, we present a novel, network-based approach to study the longitudinal effects of heterogeneous lesions on functional networks. We apply whole-brain spatial concordance as a measure of change in the connectivity over time (as initially described in Lohmann
MATERIALS AND METHODS
Subjects
Thirty-one patients diagnosed with ischemic stroke were initially recruited for the study as part of the
Functional Imaging
Functional magnetic resonance imaging (fMRI) data were obtained during a 5.75-minutes (150 volumes) resting-state scan (i.e., spontaneous blood oxygenation level-dependent fluctuations) using a Siemens Tim Trio 3T scanner (Siemens Ag, Erlangen, Germany) at the Center for Stroke Research at the Charité University Hospital in Berlin. Patients were scanned at three consecutive time points after the stroke: day 1 post-stroke (1 day±0, mean ± std), day 7 post-stroke (8.25 ± 6.34 days), and day 90 post-stroke (90.12 ±5.0 days). Day 1 was defined as the interval between 24 and 48 hours post-symptoms onset. The early acquisition was facilitated by the proximity of the scanner to the stroke unit. Two-dimensional functional images using blood oxygenation level-dependent contrast were obtained with an EPI sequence (TR = 2300 milliseconds, TE = 30 milliseconds, 30 slices, voxel size: 3.125 mm × 3.125 mm × 4 mm, flip angle 90°). T1-weighted anatomical images were acquired using a 3D MPRAGE sequence (TR = 1900 milliseconds, TE = 2.52 milliseconds, TI = 900 milliseconds, 192 slices, voxel size: 1 mm × 1 mm × 1 mm, flip angle 9°). Diffusion weighted images (DWI) and fluid attenuated inversion recovery (FLAIR) images acquired at day 1 post-stroke were used for lesion localization (in one patient, for which this data were not available for day 1 post-stroke, data from day 7 post-stroke were used). For further details on patients and scanning time points, see Supplementary Table S1.
fMRI Preprocessing
fMRI data were preprocessed using FSL (FMRIB Software Library, http://www.fmrib.ox.ac.uk) and AFNI (Analysis of Functional NeuroImages, http://afni.nimh.nih.gov/afni) software, based on the 1000 Functional Connectomes scripts (http://fcon_1000.projects.nitrc.org/). The first two images of each functional scan were discarded to avoid T1 saturation effects. Preprocessing of functional scans included: slice-time correction, 3D motion correction, spatial smoothing with a 6 mm full-width-at-half-maximum Gaussian kernel, band-pass filtering (0.009 to 0.1 Hz), removal of linear and quadratic trends and mean-based intensity normalization of all volumes by the same factor (10,000). Several sources of spurious variance were removed from the signal time-course of each voxel using the general linear model: global signal (average signal over the whole-brain mask), white matter signal, signal from the ventricles, and the six motion parameters. Mean motion displacement and rotation were computed for each patient and for each scan as described in Van Dijk
Lesion Definition
Lesions were defined based on the FLAIR/DWI image acquired at day 1 post-stroke. Lesions were localized individually based on hyperintensity in the image, in addition to an independent radiologist report. Lesions were manually drawn on the image in native space using drawing tools available in FSLview. Registration of each FLAIR/DWI image to the high-resolution structural image was carried out using a linear transformation with 6 degrees-of-freedom. Each high-resolution structural image was registered to the MNI152 template by computing a 12 degree-of-freedom linear affine transformation. The structural-to-standard nonlinear transformation matrices were then applied, using the nearest neighbor interpolation (to avoid ‘expansion’ of the lesion area), to obtain a registered lesion mask in MNI152 standard space. These standard-space lesion masks were used for further computation of affected and unaffected networks based on a template set of networks. Normally, in the acute phase, DWI images are the most sensitive images for lesion delineation.
29
In our study, images were acquired 24 to 48 hours post-symptoms onset and in most cases, lesions were fully visible in the FLAIR images as well. DWI images were used for first inspection of hyperintensity localization. In the case of a complete match between the hyperintensity evident in the DWI image and the FLAIR image, the FLAIR was used for drawing the mask. In cases where lesions were not fully visible in the FLAIR image (
Eight-Network Template
The eight-network template was taken from Beckmann
To verify that results were not dependent on the choice of network templates, we repeated the analysis using a set of 20 networks from Smith
Defining Networks Affected by Lesions
To classify the eight-networks into affected/unaffected individually, an overlap between the binarized eight-networks thresholded template and the individual lesion masks was computed through multiplication. An overlap (minimum of one voxel) resulted in assigning that network as affected; no overlap resulted in assigning that network as unaffected. This yielded a vector of eight networks for each patient. In this vector, values of 0 reflect unaffected network by the individual lesion, and values of 1 reflect affected networks. For a description of lesion sites, see Supplementary Table S1.
Analysis of Functional Connectivity
Functional connectivity maps for each individual functional scan were computed using dual-regression.35,36 Spatial maps based on a group-ICA of the eight-network template were first used as a set of general linear model regressors on the individual-level. This resulted in a time-course describing the similarity of each volume to the independent component template. These time-courses were then used as general linear model regressors in a second multiple regression analysis, resulting in individual-level spatial maps for each original component. For an example of representative individualized spatial maps see Supplementary Material M3 and Supplementary Figure S4.
To quantify the spatial similarity over time points, we computed the spatial concordance for each patient across time points, such that each component resulted in a single value representing spatial similarity of the network over time. Concordance was computed using concordance correlation coefficient
37
in MATLAB R2011a (The MathWorks Inc., Natick, MA, USA). Concordance values range from 1 (no difference) to −1 (maximal difference). Concordance was computed on thresholded spatial maps using a
To exclude the lesion area from spatial concordance computation, the individual lesion masks were smoothed (using fslmaths -dilM) and excluded from concordance computation (by means of subtraction from the individual patients maps). This was done to verify that changes in the spatial pattern of functional connectivity maps could not be attributed to changes in the lesion area itself.
To test whether concordance values statistically differed in affected versus unaffected networks, we computed Δ-concordance for each patient: averaging the concordance values for the affected and unaffected networks separately, and then subtracting the averages: ((μunaffected) − (μaffected)). A one-sample
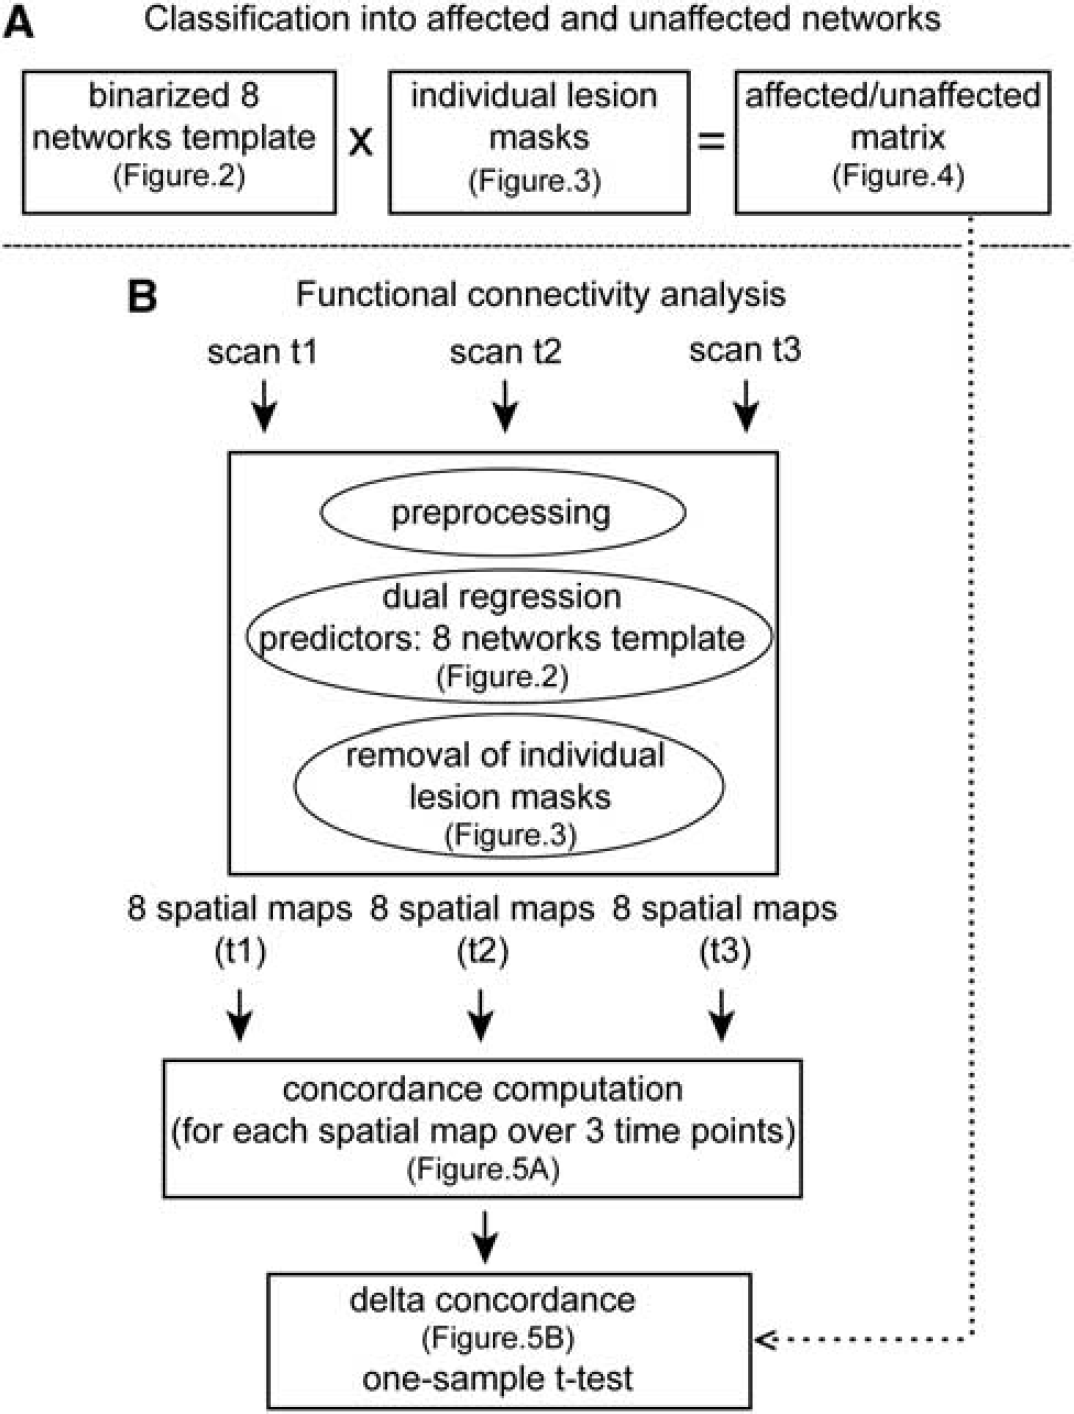
A flow chart of analysis steps. (
Analysis of Clinical Data
In order to investigate the link between changes in functional connectivity as measured by concordance and behavioral change over time, we have used clinical data from day 1 and day 90, as measured by the National Institute of Health Stroke Scale (NIHSS). A measure of Δ-NIHSS was computed and correlated with Δ-concordance by means of Spearman's correlation coefficient. Δ-NIHSS was computed as the ranked absolute difference between the NIHSS obtained at day 1, and the NIHSS obtained at day 90. Higher values thus reflect larger clinical change over time.
RESULTS
Lesion Mapping: The Network Approach
To map heterogeneous lesions across our sample of patients, we computed the overlap between the eight independent networks (Figure 2) and individual lesions (Figure 3). The overlap result, shown in Figure 4, represents the affected and unaffected networks for each patient's lesion. For example, the lesion for patient 1 was located in the left putamen and left insular cortex. According to the network approach applied here, the networks affected by the lesion were c, d, and f. For patient 2, the lesion was larger in size and was located in the left postcentral gyrus and the left parietal operculum extending into the supramarginal gyrus. The affected networks were networks b-h. For patient 3, the lesion was located in the left pallidum extending to some parts of the left amygdala. Only network c was affected.
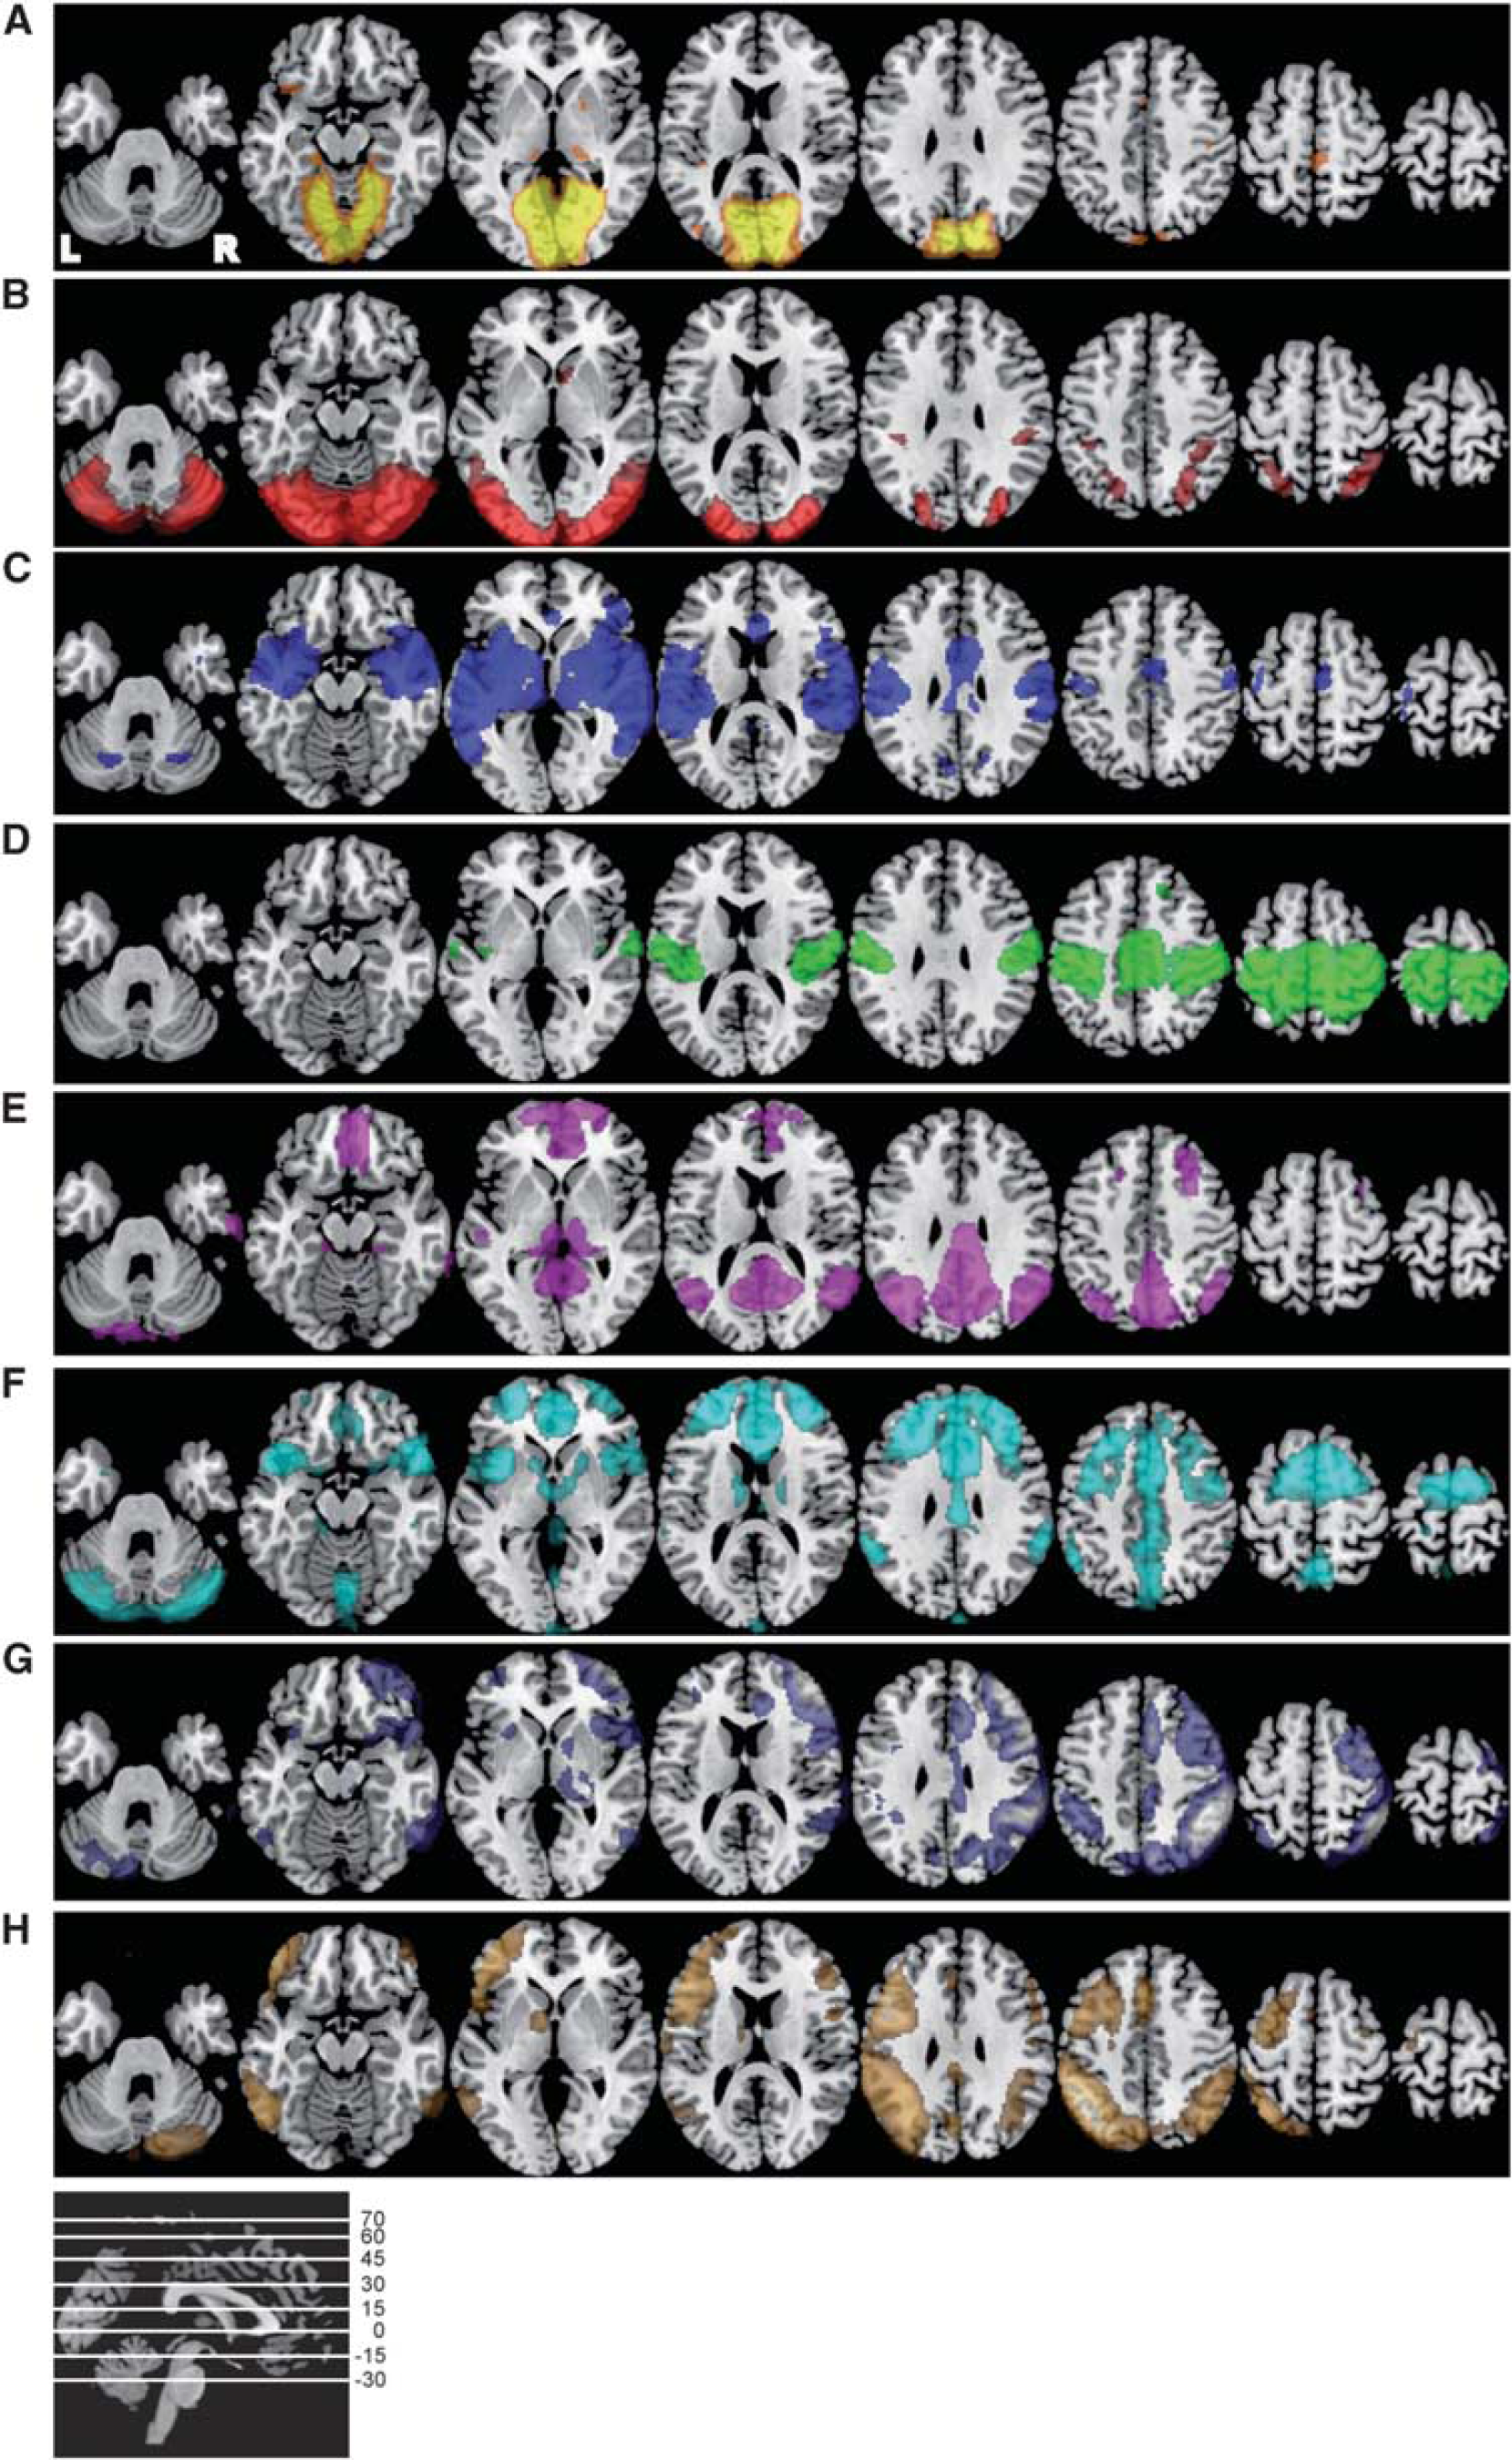
The eight-network template. Axial slices of the eight independent components based on probabilistic independent component analysis in healthy controls (
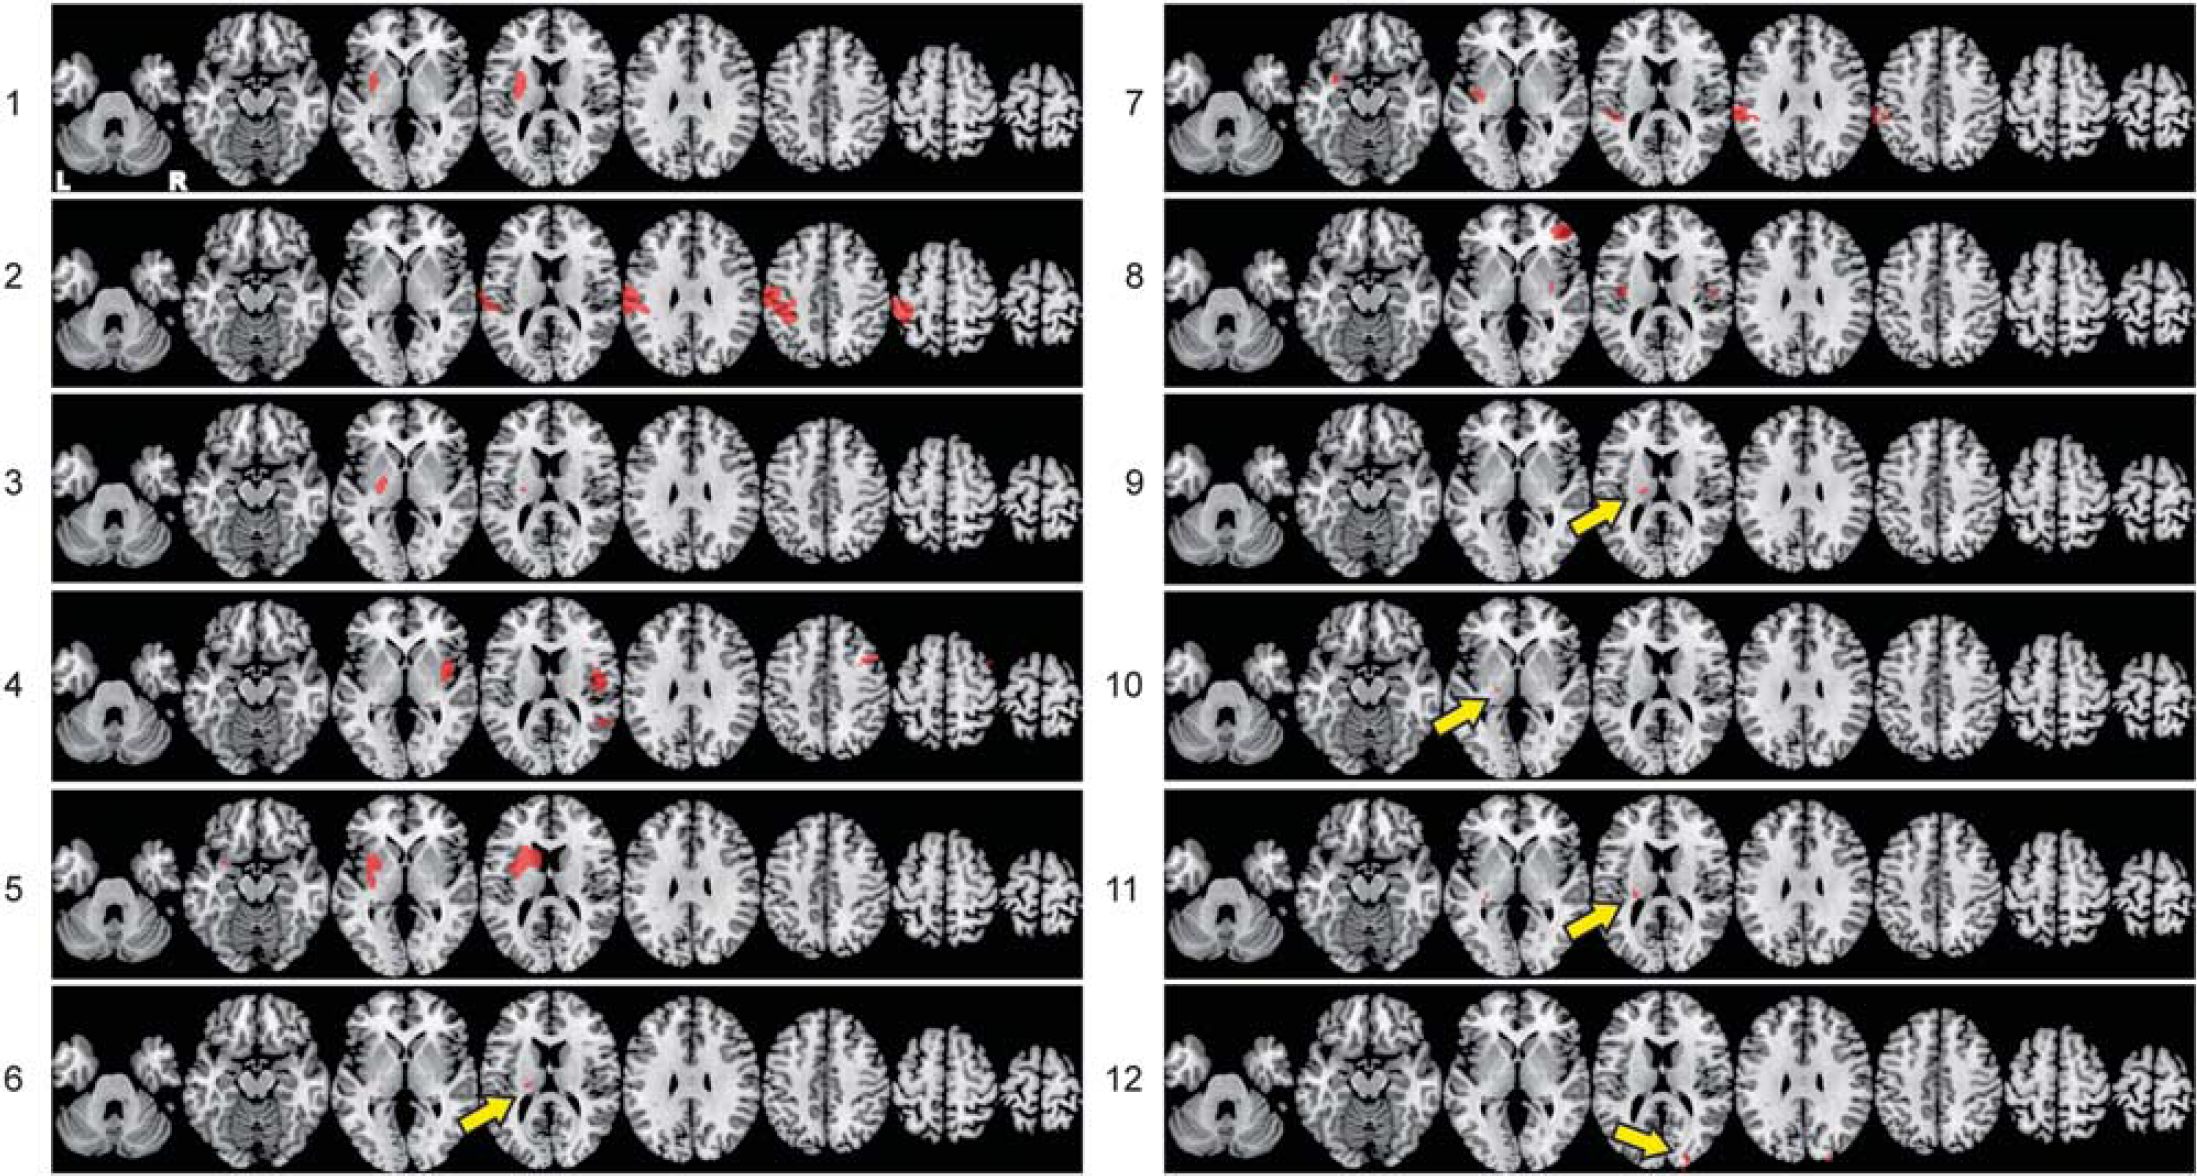
Individualized lesion masks. Axial slices of the individual lesions based on DWI/FLAIR images registered to standard MNI152 space.
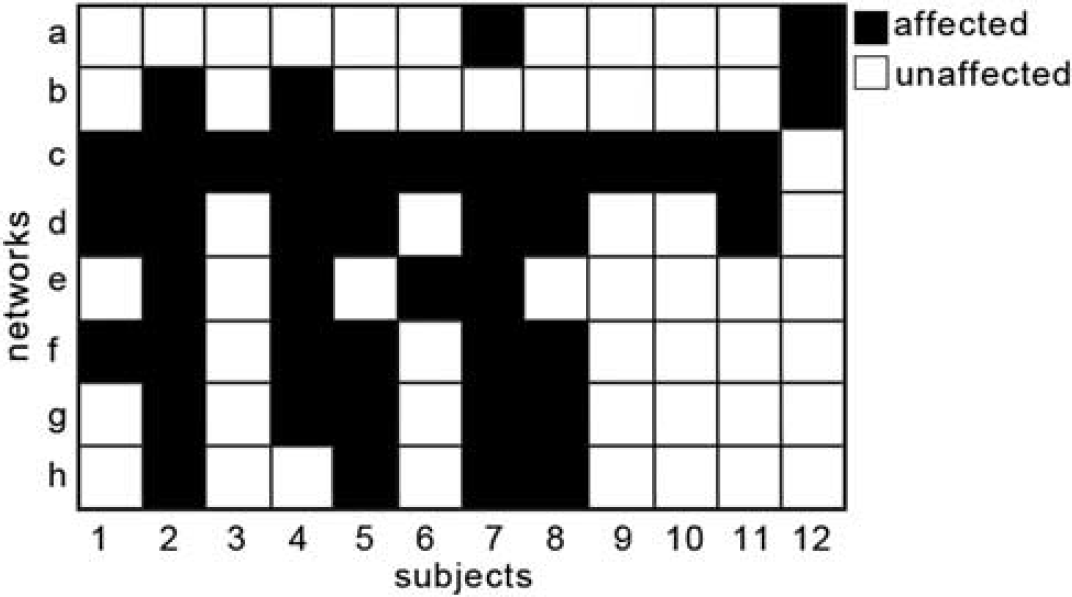
Affected and unaffected networks. Based on the overlap between the eight-network template and the individualized lesion masks, networks were assigned into affected (black) or unaffected (white) for each patient (x-axis). The y-axis depicts individual networks as presented in Figure 2.
The Impact of a Lesion on Functional Connectivity
To explore the influence of a lesion on functional connectivity over time, we computed a measure of spatial concordance of each network, for each patient, across all time points. Figure 5A depicts individual concordance values for each network of each patient. Networks with high concordance values reflect little change over time in the spatial pattern of the functional connectivity maps. After concordance computation, networks were assigned into affected and unaffected as described earlier (see Figure 4). Figure 5B displays the individual Δ-concordance values for each patient. Positive values reflect higher average concordance in unaffected networks, as compared with affected networks. Using a one-sample
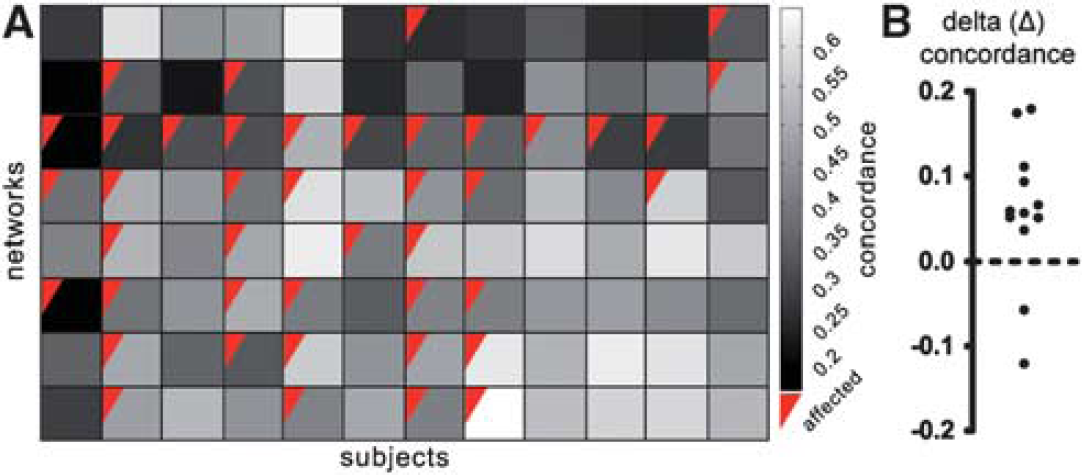
Spatial concordance in affected and unaffected networks. (
The Relationship Between Concordance and Clinical Change
To explore the clinical significance of our findings, a correlation between Δ-NIHSS and Δ-concordance was computed using Spearman's correlation coefficient. As alterations in functional connectivity after stroke have been previously shown to correlate with behavior,9,13,18-20 we hypothesized a positive correlation between the two measures, such that the larger the difference between unaffected and affected networks, the larger the clinical change. As can be seen in Figure 6, a significant (
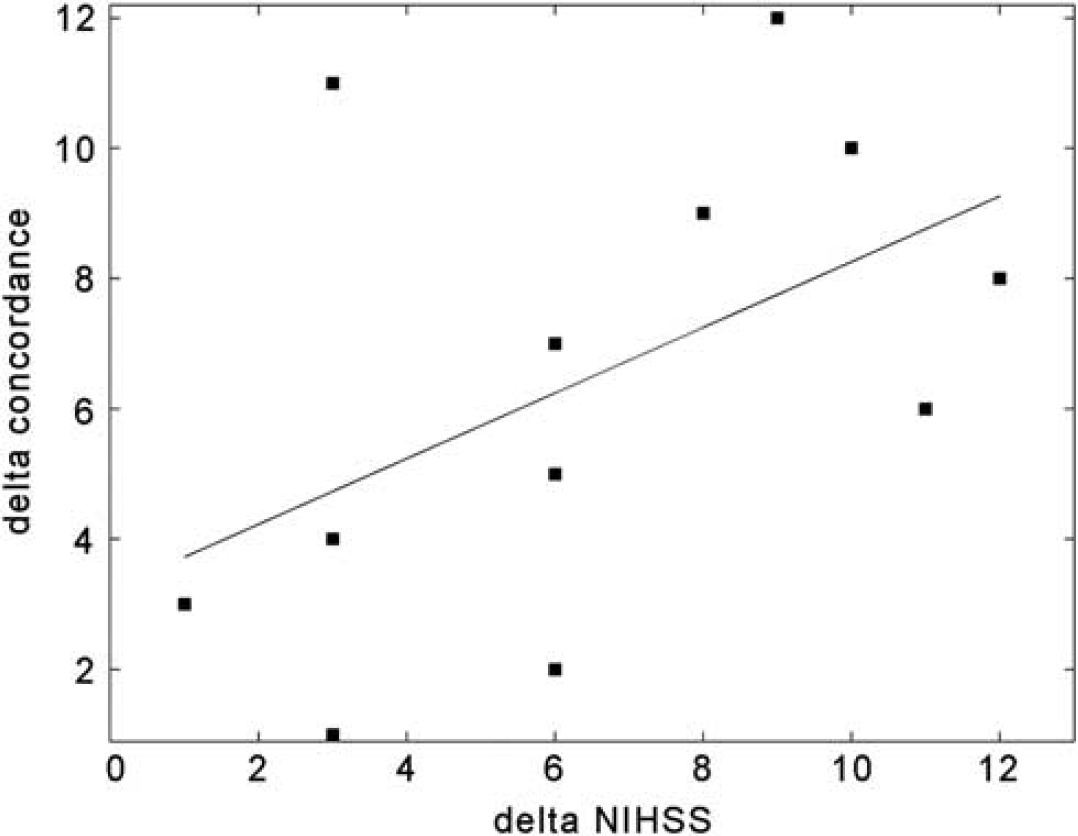
Relationship between Δ-concordance and clinical change. Positive correlation between changes in clinical scores over time as measured by Δ-NIHSS (x-axis) and changes in functional connectivity as measured by Δ-concordance (y-axis). Both axes depict the ranked values (as Spearman's correlation was applied to statistically test the relationship). Black line depicts the fitted regression line.
DISCUSSION
We found that the changes induced by lesions preferentially impact its functional networks. In order to address this question, we developed a novel analytic approach capable of assessing network-based changes in a heterogeneous stroke population. A generalizable analysis was necessary to investigate whether the effects of localized stroke are relevant to distributed, but inter-connected areas, irrespective of the lesion location or implicated network. Beginning with data acquired 1 day post-stroke onset, we found that networks containing lesions decreased significantly in their concordance over time compared with the unaffected networks. In addition, a significant positive correlation was found between the clinical change over time and alteration in functional connectivity, as measured by Δ-concordance.
This correlation provides support for the clinical significance of our findings
Our results are in line with previous work demonstrating that alterations in functional connectivity after stroke extend beyond the lesion area. For example, He
Alterations of functional connectivity in heterogeneous lesions have been previously explored by Nomura
Owing to the challenge of acquiring longitudinal data in a stroke population, only three studies have addressed the dynamics of functional connectivity during rest after stroke in humans,13,18,19 all addressing recovery within the motor network. Park and colleagues 18 explored dynamics within the ipsilesional primary motor area and found decreased interhemispheric connectivity, which was most prominent 1-month post-stroke onset. Wang and colleagues 13 used graph theory to describe a gradual shift towards a random graph structure, suggesting a less-effective network state. They explored changes starting at 1-week post-stroke onset. Recently, Golestani and colleagues 19 have addressed the longitudinal recovery after stroke starting the acute phase (< 24 hours). They demonstrated decreased interhemispheric connectivity within the motor network at the acute phase, which recovered 7 days post-stroke in recovered patients. Their work is the first longitudinal stroke study beginning in the acute phase. Their results demonstrate the importance of acute resting-state data to capture early changes in functional connectivity and behavioral outcome after stroke.
Experimental stroke research in rats has also demonstrated similar results to those reported in humans.45–47 Van Meer et al 45 explored the longitudinal effect of unilateral stroke on the sensorimotor system in rats and found decreased interhemispheric and increased intrahemispheric synchronization. Over the course of recovery, reorganization and relative normalization of functional connectivity correlated with behavior.
The measure of concordance presented here reflects a change in functional connectivity and cannot explain directionality or the source of change within a network. One of the potential limitations of concordance is that certain networks are generally more stable over time than others.23,48 For example, Lohmann
The relationship between alterations in functional connectivity after stroke and behavioral outcome/performance has been previously reported for specific networks.9,13,18-20 In our study, although the clinical significance of our findings should be further explored by examining the link between specific clinical outcome in the different networks (with their respective domains) and concordance, our results support the theoretical framework concerning the influence of a lesion on a complex network of interconnected brain regions. This view is supported as well by the well-known phenomenon of diaschisis 49 in which, after stroke, regions far from the lesion site can show altered metabolic and neural activity. Changes in functional connectivity in general and our suggested approach in particular can be used to shed light on this phenomenon.
The study of longitudinal effects of stroke on functional networks in heterogeneous stroke populations can contribute to our understanding of intrinsic networks organization in the human brain. By providing insight into the recovery process after stroke, future research into large-scale networks may prove valuable for rehabilitation and prognosis.
DISCLOSURE/CONFLICT OF INTEREST
The authors declare no conflict of interest.
Footnotes
References
Supplementary Material
Please find the following supplemental material available below.
For Open Access articles published under a Creative Commons License, all supplemental material carries the same license as the article it is associated with.
For non-Open Access articles published, all supplemental material carries a non-exclusive license, and permission requests for re-use of supplemental material or any part of supplemental material shall be sent directly to the copyright owner as specified in the copyright notice associated with the article.