
Abstract
Glutathione depletion and 12-lipoxygenase-dependent metabolism of arachidonic acid are known to be implicated in neurodegeneration associated with acute ischemic stroke. The objective of this study was to investigate the significance of miR-29 in neurodegeneration associated with acute ischemic stroke. Neural cell death caused by arachidonic acid insult of glutathione-deficient cells was preceded by a 12-lipoxygenase-dependent loss of miR-29b. Delivery of miR-29b mimic to blunt such loss was neuroprotective. miR-29b inhibition potentiated such neural cell death. 12-Lipoxygenase knockdown and inhibitors attenuated the loss of miR-29b in challenged cells. In vivo, stroke caused by middle-cerebral artery occlusion was followed by higher 12-lipoxygenase activity and loss of miR-29b as detected in laser-captured infarct site tissue. 12-Lipoxygenase knockout mice demonstrated protection against such miR loss. miR-29b gene delivery markedly attenuated stroke-induced brain lesion. Oral supplementation of α-tocotrienol, a vitamin E 12-lipoxygenase inhibitor, rescued stroke-induced loss of miR-29b and minimized lesion size. This work provides the first evidence demonstrating that loss of miR-29b at the infarct site is a key contributor to stroke lesion. Such loss is contributed by activity of the 12-lipoxygenase pathway providing maiden evidence linking arachidonic acid metabolism to miR-dependent mechanisms in stroke.
INTRODUCTION
The human genome encodes four closely related transcripts hsa-miR-29a, hsa-miR-29b-1, hsa-miR-29b-2, and hsa-miR-29c, which form the miR-29 family. Human miR-29a and miR-29b-1 are processed from an intron of a long noncoding transcript from chromosome 7. miR-29b-2 and miR-29c are co-transcribed from chromosome 1. miR-29-b-1 and miR-29b-2 share identical mature sequences and are collectively referred to as miR-29b. The mature forms of miR-29 family members are highly conserved in human, mouse and rat. Members of the miR-29 family share sequence homology at nucleotide positions 2-7, the seed region responsible for determination of which coding genes would be targeted. Thus, there is significant overlap of target genes that each miR-29 family member is computationally predicted to silence. 1 Earlier studies implicate loss of miR-29a/b-1 in sporadic Alzheimer's disease and provide evidence for a potential causal relationship between miR-29a/b-1 expression and Abeta generation. 2 More recently, miR-29b has been recognized as a survival factor in neuronal cells, an effect that is accomplished by silencing of pro-apoptotic BH3-only family. 3
Acute ischemic stroke is known to be associated with glutathione depletion and metabolism of membrane-bound arachidonic acid.4–6 Under these conditions, 12-lipoxygenase has been recognized as a key pathway of arachidonic acid metabolism, which has been directly implicated in middle-cerebral artery occlusion (MCAO)-induced injury of the brain.7,8 In this work, we report the loss of miR-29b at the infarct site after stroke by a 12-lipoxygenase-dependent mechanism. Utilizing cell biology and in vivo approaches, we develop the functional significance of such a finding in the context of neural cell toxicity and stroke outcomes.
MATERIALS AND METHODS
All animal protocols were approved by the Institutional Animal Care and Use Committee (IACUC) of the Ohio State University, Columbus, Ohio. Mice were maintained under standard conditions at 22 + 2 °C with 12 hour:12 hour dark: light cycles with access to food and water ad libitum.
Materials
The following materials were obtained from the source indicated. L-Buthionine-sulfoximine (BSO), dimethyl sulfoxide, (Sigma, St Louis, MO, USA); baicalein; 5,6,7,-Trihydroxyflavone (BL15; Biomol Research Laboratories, Plymouth, PA, USA); Arachidonic acid (Nu-Chek Prep, Elysian, MN, USA); α-tocotrienol (Carotech, Chemor, Malaysia); for cell culture, Dulbecco's modified Eagle medium, minimum essential medium, fetal calf serum and antibiotics (100 μg/mL streptomycin, 100 units/mL penicillin, and 0.25 μg/mL amphotericin) were purchased from Life technologiesTM, Grand Island, NY, USA. Culture dishes were obtained from Nunc, Roskilde, Denmark.
Cell Culture
Mouse hippocampal HT4 neural cells were grown in Dulbecco's modified Eagle medium supplemented with 10% fetal calf serum, 100 μg/mL streptomycin, 100 units/mL penicillin, and 0.25 μg/mL amphotericin at 37 °C in a humidified atmosphere of 95% air and 5% CO2 as described previously.7,9–16 Treatment with neurotoxic agents. Immediately before experiments, the culture medium was replaced with fresh medium supplemented with serum and antibiotics. L-Buthionine-sulfoximine (BSO, 50 μmol/L) and arachidonic acid (AA, 50 μmol/L) was added to the medium as described previously.7,12
Primary Cortical Neurons
Neurons were isolated from the cerebral cortex of rat feti (Sprague-Dawley, day 17 of gestation; Harlan, Indianapolis, IN, USA) as described previously.7,11,17 After isolation from the brain, cells were grown in minimum essential medium supplemented with 10% heat-inactivated fetal bovine serum, 40 μmol/L cystine, and antibiotics (100 μg/mL streptomycin, 100 units/mL penicillin, and 0.25 μg/mL amphotericin). Cultures were maintained at 37 °C in 5% CO2 and 95% air in a humidified incubator. All experiments were carried out 24 hours after plating.
Determination of Cell Viability
Cell viability was measured by leakage of lactate dehydrogenase from cells to media following BSO and AA treatment using the in vitro toxicology assay kit from Sigma Chemical (St Louis, MO, USA) as described.7,9-14,18 Cell viability was also measured by Calcein-AM and Propidium Iodide solutions, which stain viable and dead cells, respectively, using Calcein/Propidium Iodide assay. Calcein-AM is converted to green fluorescence by intracellular esterase, green staining indicated metabolically active cells. Propidium iodide is an indicator of membrane damage and reveals dead cells. Cells were incubated with Calcein-AM (3 μmol/L) and propidium iodide (2.5 μmol/L) in phosphate-buffered saline for 15 minutes in cell culture incubators. After incubation, digital images were collected using Zeiss Axiovert 200M microscope suited for imaging cells growing in regular culture plates as describe previously.7,12,13
In vitro Transfection of miR mimic, miR Inhibitors or siRNA
HT4 neural cells (0.1 × 10⁶ cells/well in 12-well plate) or primary cortical neurons (1.0 × 10⁶ cells/well in 12-well plate) were seeded in antibiotic-free medium for 18–24 hours before transfection. DharmaFECT 1 transfection reagent was used to transfect cells with miRIDIAN mmu-miR-29b mimic/mmu-miR-29b hairpin inhibitor or 12-Lox siRNA (Thermo Scientific Dharmacon RNA Technologies, Lafayette, CO, USA) as per the manufacturer's instructions and described.17,19–21 miRIDIAN miR mimic, inhibitor negative controls or siControl nontargeting siRNA pool (Thermo Scientific Dharmacon RNA Technologies, Lafayette, CO, USA) were used for control transfections. Samples were collected after 72 hours of miR mimic/inhibitor or siRNA transfection for quantification of miR, mRNA or protein expressions or challenged with BSO + AA for indicated time points as described in the respective figure legends.
RNA Isolation and Quantitative Real-Time PCR for mRNA and miRNA
Total RNA was extracted using the miRVana miRNA Isolation Kit according to the manufacturer's protocol (Ambion/Life technologies, Grand Island, NY, USA). For determination of miR expression, specific TaqMan assays for miRs and the TaqMan Micro-RNA Reverse Transcription Kit were employed, followed by real-time PCR using the Universal PCR Master Mix (Applied Biosystems/Life tcehnologies, Grand Island, NY, USA).17,19,21 Levels of miRNA were quantified with the relative quantification method using miR-16 as the housekeeping miRNA. For gene expression studies, total complementary DNA synthesis was achieved using the SuperScript III First Strand Synthesis System (Invitrogen/Life technologies, Grand Island, NY, USA). The abundance of mRNA for 12-Lox and housekeeping control GAPDH was quantified using real-time PCR. The double-stranded DNA-binding dye SYBR green-I was used. Relative quantification method 2 (− ΔΔct) was employed for miRNA and mRNA expression levels.
The following primer sets were used:m_GAPDH forward (F): 5'-ATGAC CACAGTCCATGCCATCACT-3', m_GAPDH reverse (R): 5'-TGTTGAAGTCGC AGGAGACAACCT-3', m_12-LOX F: 5'-ACCCCTACTACATCCAGGCTTCCA-3', m_12-LOX R: 5'-TGACATCCGCCCTATATGCTGAA-3'.
Western Blot Analysis
After protein extraction, protein concentrations were determined using BCA protein assay. Samples (20-30 μg of protein/lane) were separated on a 10% SDS-polyacrylamide gel electrophoresis, and probed with anti-12-Lox (Cayman Chemical, Ann Arbor, MI, USA). To evaluate the loading efficiency, membranes were probed with anti-GAPDH antibody.9,11,19,20
Glutathione Assay
Glutathione (GSH) concentrations were measured in cells and brain tissue (injured and contralateral brain tissue, n = 5, 8-10 weeks, C57BL/6, male, Harlan) using a GSH-Glo Glutathione assay kit (Promega, Madison, WI, USA) per manufacturer's instruction.22,23 The luminescence-based assay is based on the conversion of a luciferin derivative into luciferin in the presence of glutathione, catalyzed by glutathione S-transferase. The signal generated in a coupled reaction with firefly luciferase is proportional to the amount of glutathione present in the sample. HT4 neural cells (0.025 × 10⁶ cells/well) or primary cortical neurons (0.25 × 10⁶ cells/well) were seeded in Corning 96 Well Flat Clear Bottom White Polystyrene TC-Treated Microplates. For brain extract preparation, mouse brains were dissected out and grounded in liquid nitrogen. Samples were homogenized in phosphate-buffered saline containing 2 mM EDTA. After homogenization, extracts were centrifuged, and 50 μL supernatant was used to detect glutathione levels. The assay result is normalized using GSH standard solution provided with the kit.
Measurement of Mitochondrial Membrane Potential
Mitochondral membrane potential changes were assessed using the lipophilic cationic dye JC-1 (MitoProbe JC-1 Assay Kit for Flow Cytometry, Life technologies) per manufacturer's instruction by flow cytometer as reported previously.24,25 After 72 hours of miR-29b mimic/mmu-miR-29b hairpin inhibitor transfection, cells were harvested and seeded (0.25 × 10⁶ cells/well in 12-well plates) for 12 hours. After 12 hours of seeding, cells were treated with BSO + AA as described in the figure legends.
In vivo miR-29b Mimic Delivery in the Mouse Brain
To overexpress mir-29b, pLenti-III-miR-GFP (con-miR, n = 6, 8 weeks, C57BL/6 male mice, Harlan) or pLenti-III-mmu-miR-29b (miR-29b mimic, n = 7, 8 weeks, C57BL/6 male mice, Harlan) lentiviral vector was delivered to cortex using stereotaxic injection as described previously.13,17,26 Lentiviral particles were delivered to somatosensory cortex (S1) of the anticipated stroke hemisphere using the following coordinates: − 0.5 mm posterior, + 3.5 mm lateral, and − 1.0mm ventral to bregma. A 10-μL Hamilton syringe connected to a motorized nano-injector (KD Scientific, Holliston, MA, USA) was used to deliver 5 μl of control miR or miR-29 mimic lentiviral particles (1.0 × 10⁸ IU/mL, Applied Biological Materials, Richmond, British Columbia) at a rate of 0.2 μl/minute. After 72 hours of delivery, MCAO was performed in mice.
α-Tocotrienol Supplementation
C57BL/6 (5 weeks, male, Harlan) mice were randomly divided into two groups, control (n = 6) and supplemented (n = 6) group. The control group (vitamin-E-stripped corn oil) or test group (α-TCT, 50 mg/kg body weight, Carotech) was orally gavaged for 10 weeks as describe previously. 17 Mice suffering from surgical complications (e.g., hemorrhage or death) during MCAO were excluded.
Mouse Stroke Model
Transient (90 minutes) focal cerebral ischemia was induced in 8- to 10-week-old C57BL/6 or 12-Lox knockout (B6.129S2-Alox15tm1Fun/J) mice by the intraluminal suture method of MCAO as previously described.7,17,26,27 Laser Doppler flowmetry (DRT4, Moor Instruments, Wilmington, DE, USA) was used to confirm successful MCAO (70 ± 10% drop in MCA territory cerebral blood flow).
Sensorimotor Assessment
At 24 hours before MCAO (baseline) and 48 hours after stroke, mice were placed in the center of a 1-m × 1-m open field and allowed to freely move for 5 minutes while being recorded overhead using AnyMaze video tracking software (Stoelting, v. 4.5, Wood Dale, IL, USA). Software calculated distance, mean speed and time mobile for baseline and 48 hours poststroke open-field tests.
Magnetic Resonance Imaging and Infarct Volume Determination
For infract volume determination, T2-weighted imaging was performed on stroke-affected mice using a 11.7T (500 MHz) MR system comprised of a vertical bore magnet (Bruker Biospin, Ettlingen, Germany) as described previously.7,17,26,27 For stroke-volume calculations, raw magnetic resonance imaging (MRI) images were converted to digital imaging and communications in medicine (DICOM) format and read into ImageJ software (NIH). After matched contrast enhancement of images in Image J, digital planimetry was performed by a masked observer to delineate the infarct area in each coronal brain slice. Infarct areas from brain slices were summed, multiplied by slice thickness, and corrected for edema-induced swelling as previously described, to determine infarct volume. 28
MicroRNA Expression Assay from Laser-Captured Microdissected Somatosensory Cortex of Brain Tissue
Laser microdissection and pressure catapulting was performed using the microlaser system from PALM Microlaser Technologies AG (Bernreid, Germany) as described.17,21,26,27,29,30 Briefly, mice were euthanized immediately after MRI imaging and coronal slices of brain tissue were collected using a mouse brain matrix. OCT embedded in slices were subsequently cut in 12-μm-thick sections on a Leica CM 3050S cryostat (Leica Microsystems, Wetzlar, Germany). Settings used for laser cutting were UV-Energy of 70–80 and UV-Focus of 70. Matched area (1 × 106 μm2) of contralateral or stroke-affected somatosensory cortex was captured into 25 μl of cell direct lysis extraction buffer (Life technologies).
Histology and Immunofluorescence
After 48 hours MRI, mouse brain tissue was coronal sliced using a brain matrix (Ted Pella, Redding, CA, USA) and embedded in OCT. OCT-embedded frozen brain was sectioned (12 μm) and mounted onto slides. Brain sections were stained with 0.0001% Fluoro-Jade C (Millipore, Billerica, MA, USA). Coronal slices of cortical sections were analyzed by fluorescence microscopy (Axiovert 200 M, Zeiss, Gottingen, Germany) and images were captured using Axiovert v4.8 software (Zeiss) as described previously.7,17,27
Quantitative Analysis of Select Eicosanoids Using High-Performance Liquid Chromatography Electrospray Ionization Tandem Mass Spectrometry
Eicosanoids were analyzed from C57BL/6 mouse brain (n = 10, 8 weeks, male, Harlan) or culture media. Frozen brain tissues were thawed on ice and homogenized using an Omni (Kennesaw, GA, USA) TH tissue homogenizer to obtain a 10% (w/v) solution in phosphate-buffered saline. Tissue homogenate (200 μL) was diluted with 1 mL of LCMS-grade ethanol containing 0.05% BHT and spiked with 10 ng of each internal standard. The samples were mixed using a bath sonicator followed by incubation for 5 hours in the dark at 4 °C with periodic mixing via bath sonication.
Following incubation, the insoluble fraction was precipitated by centrifuging at 6,000 g for 20 minutes and the supernatant was transferred into a new glass tube. For cell culture media, 400 μL of methanol and 20 μL of glacial acetic acid were added together with 10 ng of each internal standard to 4 mL of the tissue culture media. For lipid extraction, Strata-X SPE columns (Phenomenex, Torrance, CA, USA) were first conditioned by eluting 2 mL methanol and then 2 mL of dH2O. The spiked culture media were then applied to the columns. The columns were washed with 5% methanol and the lipid fraction-containing eicosanoids eluted with 2 mL of isopropanol. The internal standards used were, (d8) 5-hydroxyeicosatetranoic acid (5HETE), (d8) 12-hydroxyeicosatetranoic acid (12HETE), (d8) 15-hydroxyeicosatetranoic acid (15HETE), (d8) arachidonic acid (AA), and (d5) docosahexaenoic acid (DHA). The extract from the brain homogenate and the eluent from SPE extraction were dried under vacuum and reconstituted in 100 μL of 50:50 EtOH:dH2O for eicosanoid quantitation via UPLC ESI-MS/MS. A 30-minute reversed-phase LC method utilizing a Kinetex C18 column (Torrance, CA, USA; 100 × 2.1 mm, 2.6 μm) and a Shimadzu (Pleasanton, CA, USA) UPLC was used to separate the eicosanoids at a flow rate of 200 μL/minute at 50 °C. The column was first equilibrated with 100% Solvent A (acetonitrile:water:formic acid (10:90:0.02, v/v/v)) for 5 minutes and then 10 μL of sample was injected. 100% Solvent A was used for the first minute of elution. Solvent B (acetonitrile:isopropanol (50:50, v/v)) was increased in a linear gradient to 25% Solvent B to 3 minutes, to 45% until 11 minutes, to 60% until 13 minutes, to 75% until 18 minutes, and to 100% until 20 minutes. 100% Solvent B was held until 25 minutes, then was decreased to 0% in a linear gradient until 26 minutes, and then held until 30 minutes. The eicosanoids were quantified using an inline hybrid triple quadrapole linear ion trap mass spectrometer (ABSciex 4000 QTRAP, Foster City, CA, USA) via multiple-reaction monitoring in negativeion mode. Eicosanoids were monitored using the following precursor → product MRM pairs; 5HETE (319 → 115), d8-5HETE (327 → 116), 12HETE (319 → 179), d8-12HETE (327 → 184), 15HETE (319 → 219), d8-15HETE (327 → 226), AA (303 → 259), d8-AA (311 → 267), DHA (327 → 283) and d5-DHA (332 → 288). The mass spectrometer parameters used were: curtain gas: 30; CAD: High; ion spray voltage: − 3500 V; temperature: 500 °C; Gas 1: 40; Gas 2: 60; declustering potential, collision energy, and cell exit potential vary per transition.
Statistical Analyses
Data are reported as mean ± s.d. of at least three experiments. Difference in means was tested using Student's t-test or one-way ANOVA followed by Scheffe's post hoc test. P < 0.05 was considered statistically significant.
RESULTS
Role of miR-29b/c in Arachidonic Acid-Induced Loss of Cell Function and Survival
Arachidonic acid insult caused death of glutathione-deficient HT4 neural (Supplementary Figure 1A) as well as primary cortical neurons (Supplementary Figure 1C). Consistent with previous reports31,32 and across cell types studied, the cell death process was slow where loss of viability was not noted at 12 hours after challenge but peaked at 24 hours (Figures 1A and 1C). Cell death was preceded by specific loss of miR-29b in both primary as well as HT4 cells (Figures 1B and 1D). Such effect was observed after 12 hours of arachidonic acid treatment. Across the two neural cell types studied, the effect was specific for miR-29b, as miR29a was not affected. In HT4 cells, arachidonic acid insult did deplete miR-29c. However, this effect was not reproduced in primary neural cells (Figure 1D) directing emphasis on the significance of miR-29b. To test the significance of arachidonic acid-induced loss of miR-29b on cell death, we sought to compensate for such loss using delivery of miR-29b mimic. Delivery of such mimic was effective in substantially bolstering miR-29b levels in HT4 cells (Figure 2A) as well as in primary cortical neurons (Supplementary Figure 2A). Enrichment of cells with miR-29b resulted in significant protection against arachidonic acid-induced loss of mitochondrial membrane potential (Figure 2B) as well as against cell death (Figure 2C; Supplementary Figures 2B and 2C). Visualization of HT4 cells and primary cortical neurons using calcein-AM and propidium iodide demonstrated that miR-29b mimic successfully rescued cells from arachidonic acid insult. Cells transfected with miR-29b mimic attenuated propidium iodide staining and stained for calcein supporting data on lactate dehydrogenase leakage (Figures 2C and 2D; Supplementary Figures 2B and 2C). Do miR-29b and miR-29c, co-transcribed from chromosome 1, share functional homology? To test the significance of arachidonic acid-induced loss of miR-29c on cell death in HT4 cells, we sought to compensate for such loss using delivery of miR-29c mimic.
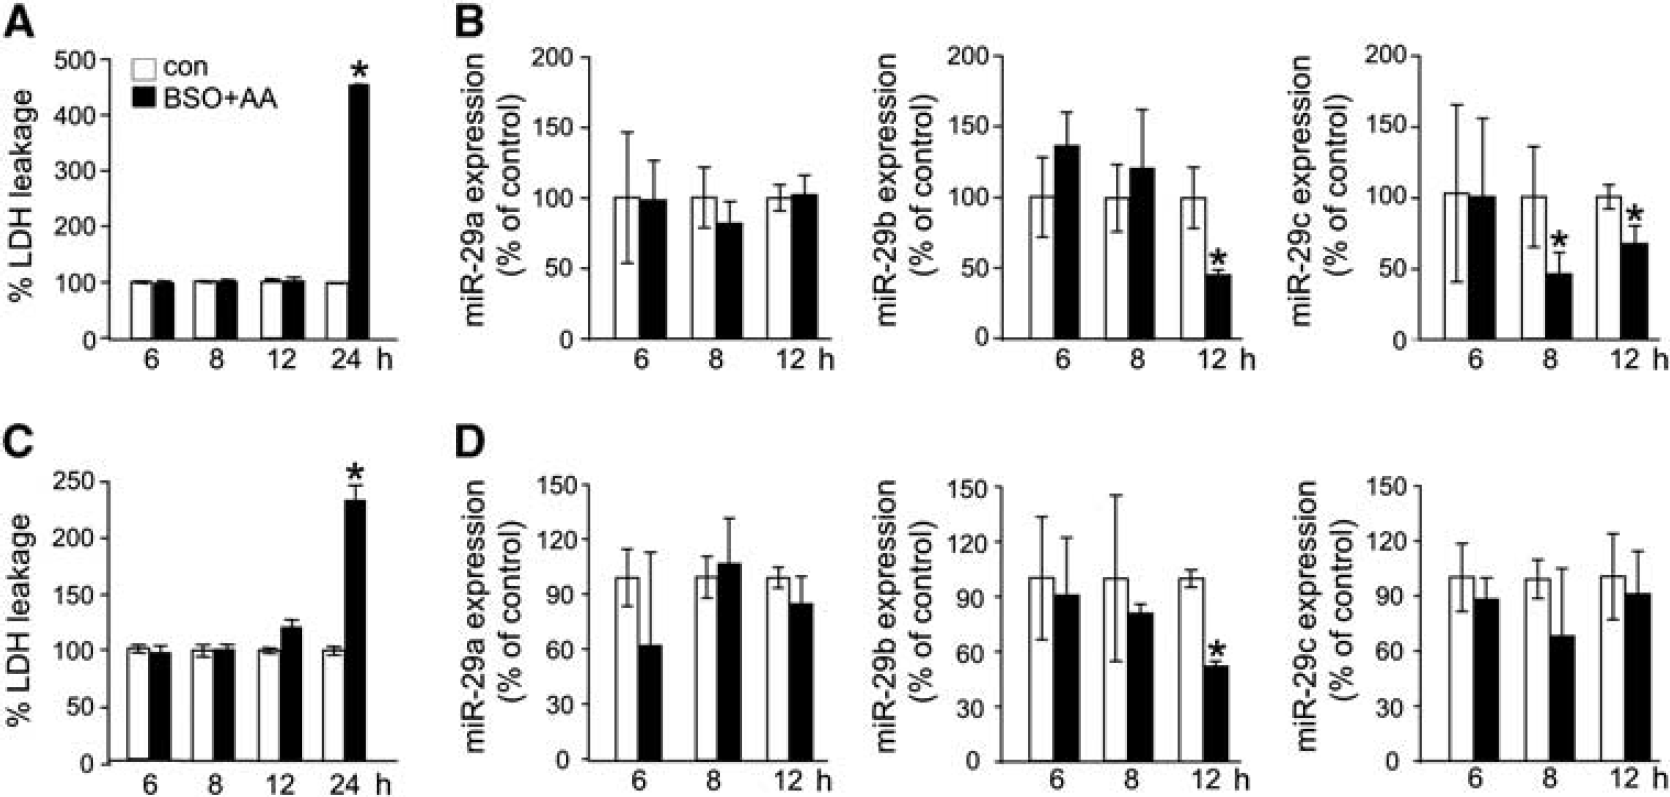
Arachidonic acid-induced death of glutathione-deficient neural cells is associated with loss of miR-29b. Arachidonic acid-induced cell death in glutathione-depleted HT4 neural cells (
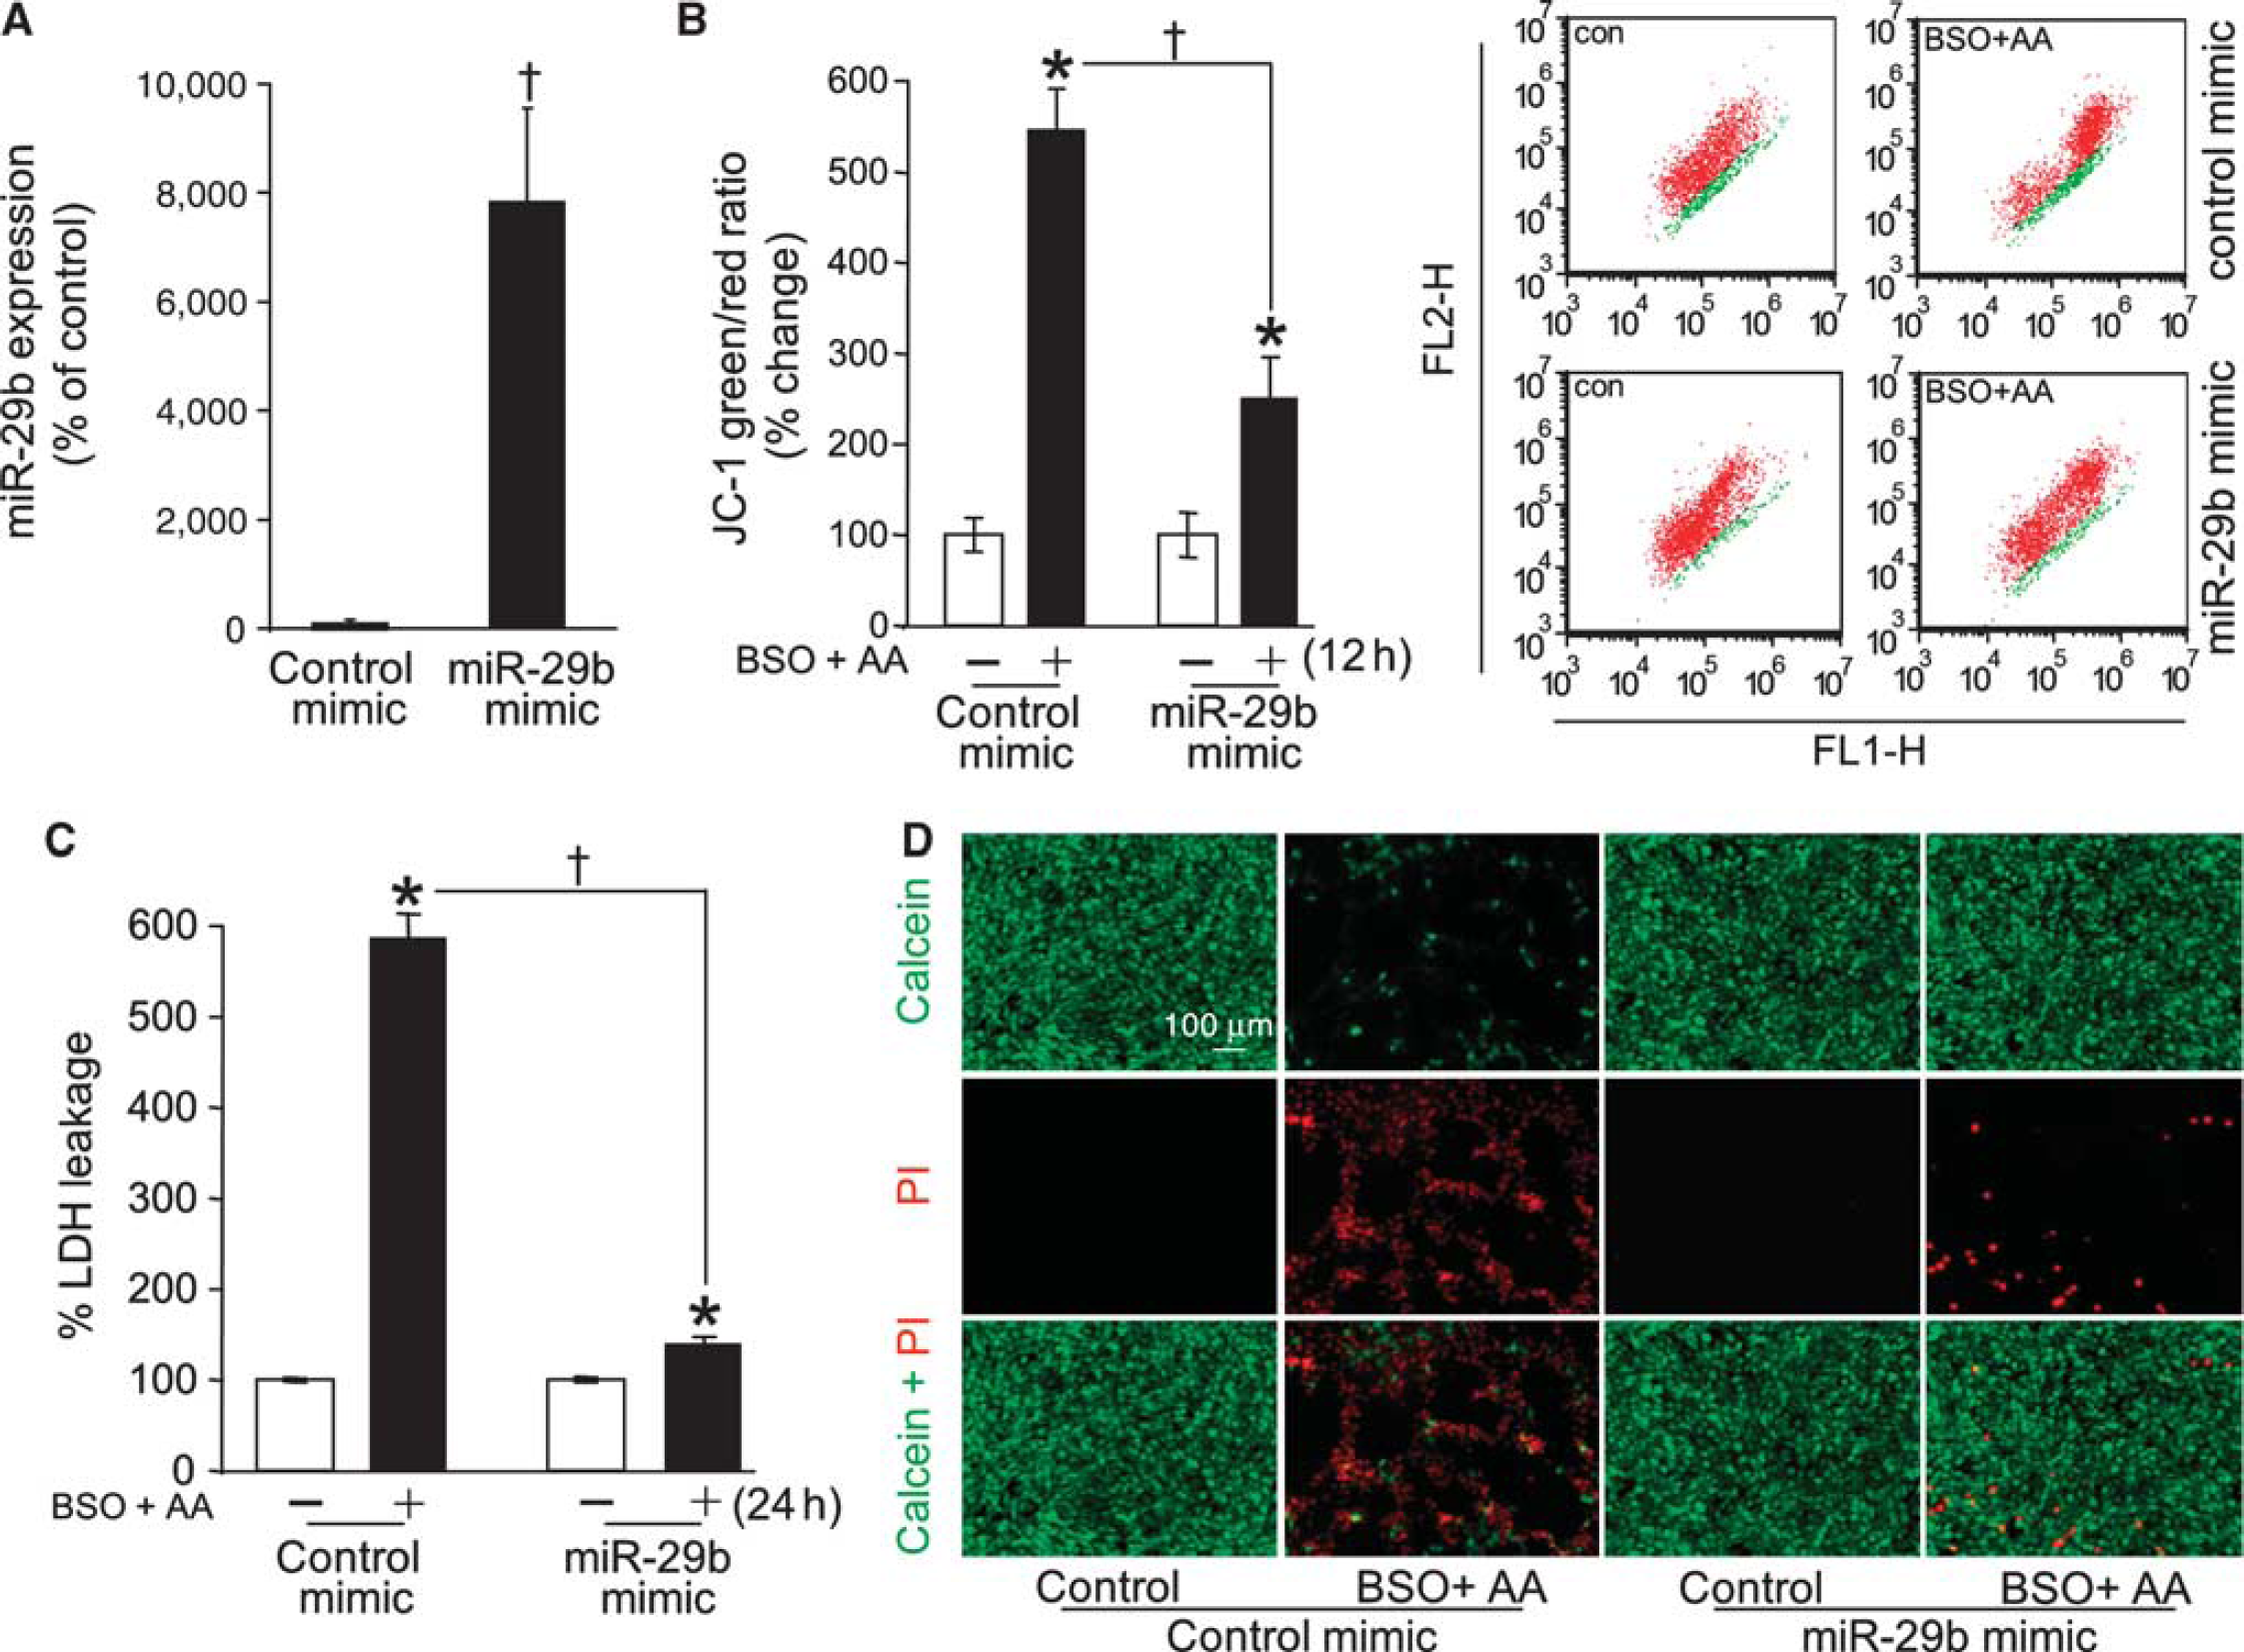
Mimic delivery aimed at compensating for loss of miR-29b after arachidonic acid insult protected against loss of mitochondrial membrane potential and cell death. (
Delivery of such mimic was effective in substantially increasing miR-29c levels in cells (Supplementary Figure 3A). Enrichment of miR-29c in cells resulted in significant protection against arachidonic acid-induced loss of mitochondrial membrane potential (Supplementary Figure 3B) as well as against cell death (Supplementary Figures 3C and 3D). To further examine the significance of the loss of miR-29b and −29c, we adopted the approach of miR-29b and 29c inhibition. Delivery of inhibitors significantly lowered miR-29b (Figure 3A) and miR-29c (Supplementary Figure 4 A) levels in HT4 neural cells. Inhibition of miR-29b and miR-29c alone did not affect cell viability (not shown). However, miR-29b and miR-29c inhibition significantly exacerbated the toxic effects of arachidonic acid as measured by loss of mitochondrial membrane potential (Figure 3B; Supplementary Figure 4B) and loss of cell viability (Figures 3C and 3D; Supplementary Figures 4C and 4D). These observations point toward loss of miR-29b/c as a critical contributor to arachidonic acid-induced loss of cell function and survival. Because miR-29 levels are known to be very low in immature neurons, 3 embryonic (E17) primary neuronal cells do not lend themselves to studies involving miR-29b inhibition. Thus, the significance of miR-29b/c in the context of neurodegeneration has been addressed in vivo in a later part of this study.
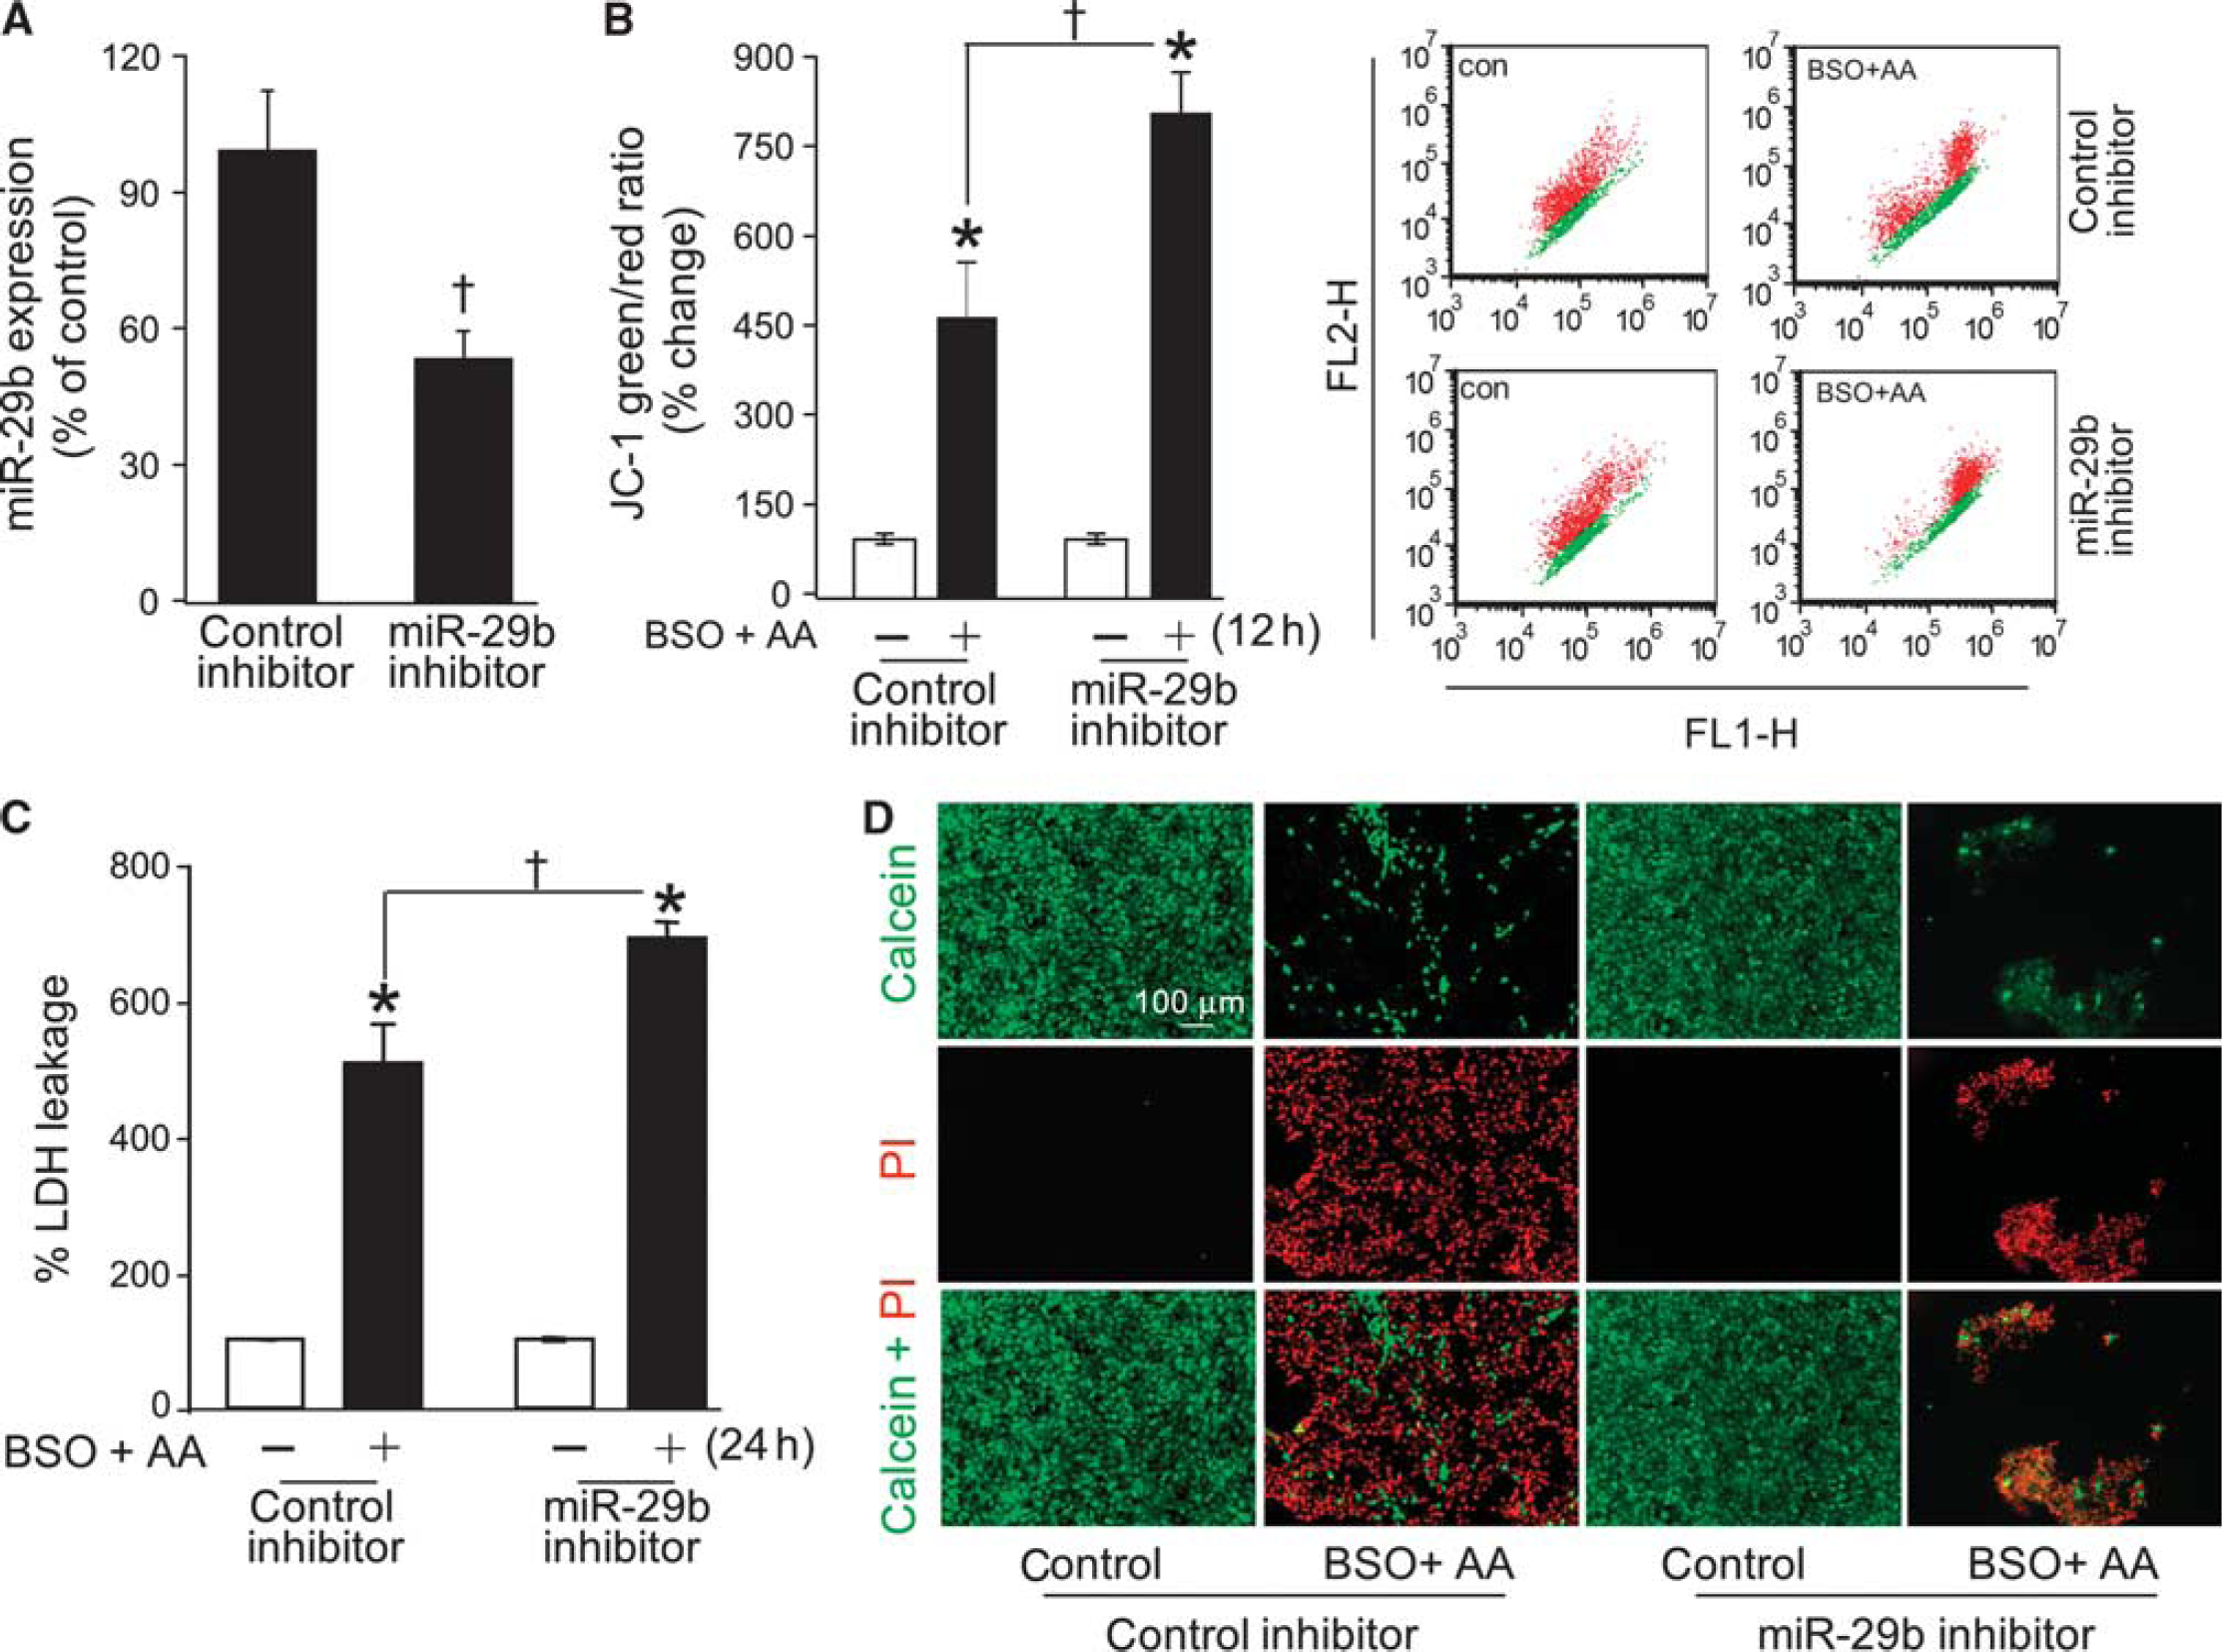
Inhibition of miR-29b exacerbated arachidonic acid-induced loss of mitochondrial membrane potential and cell death. (
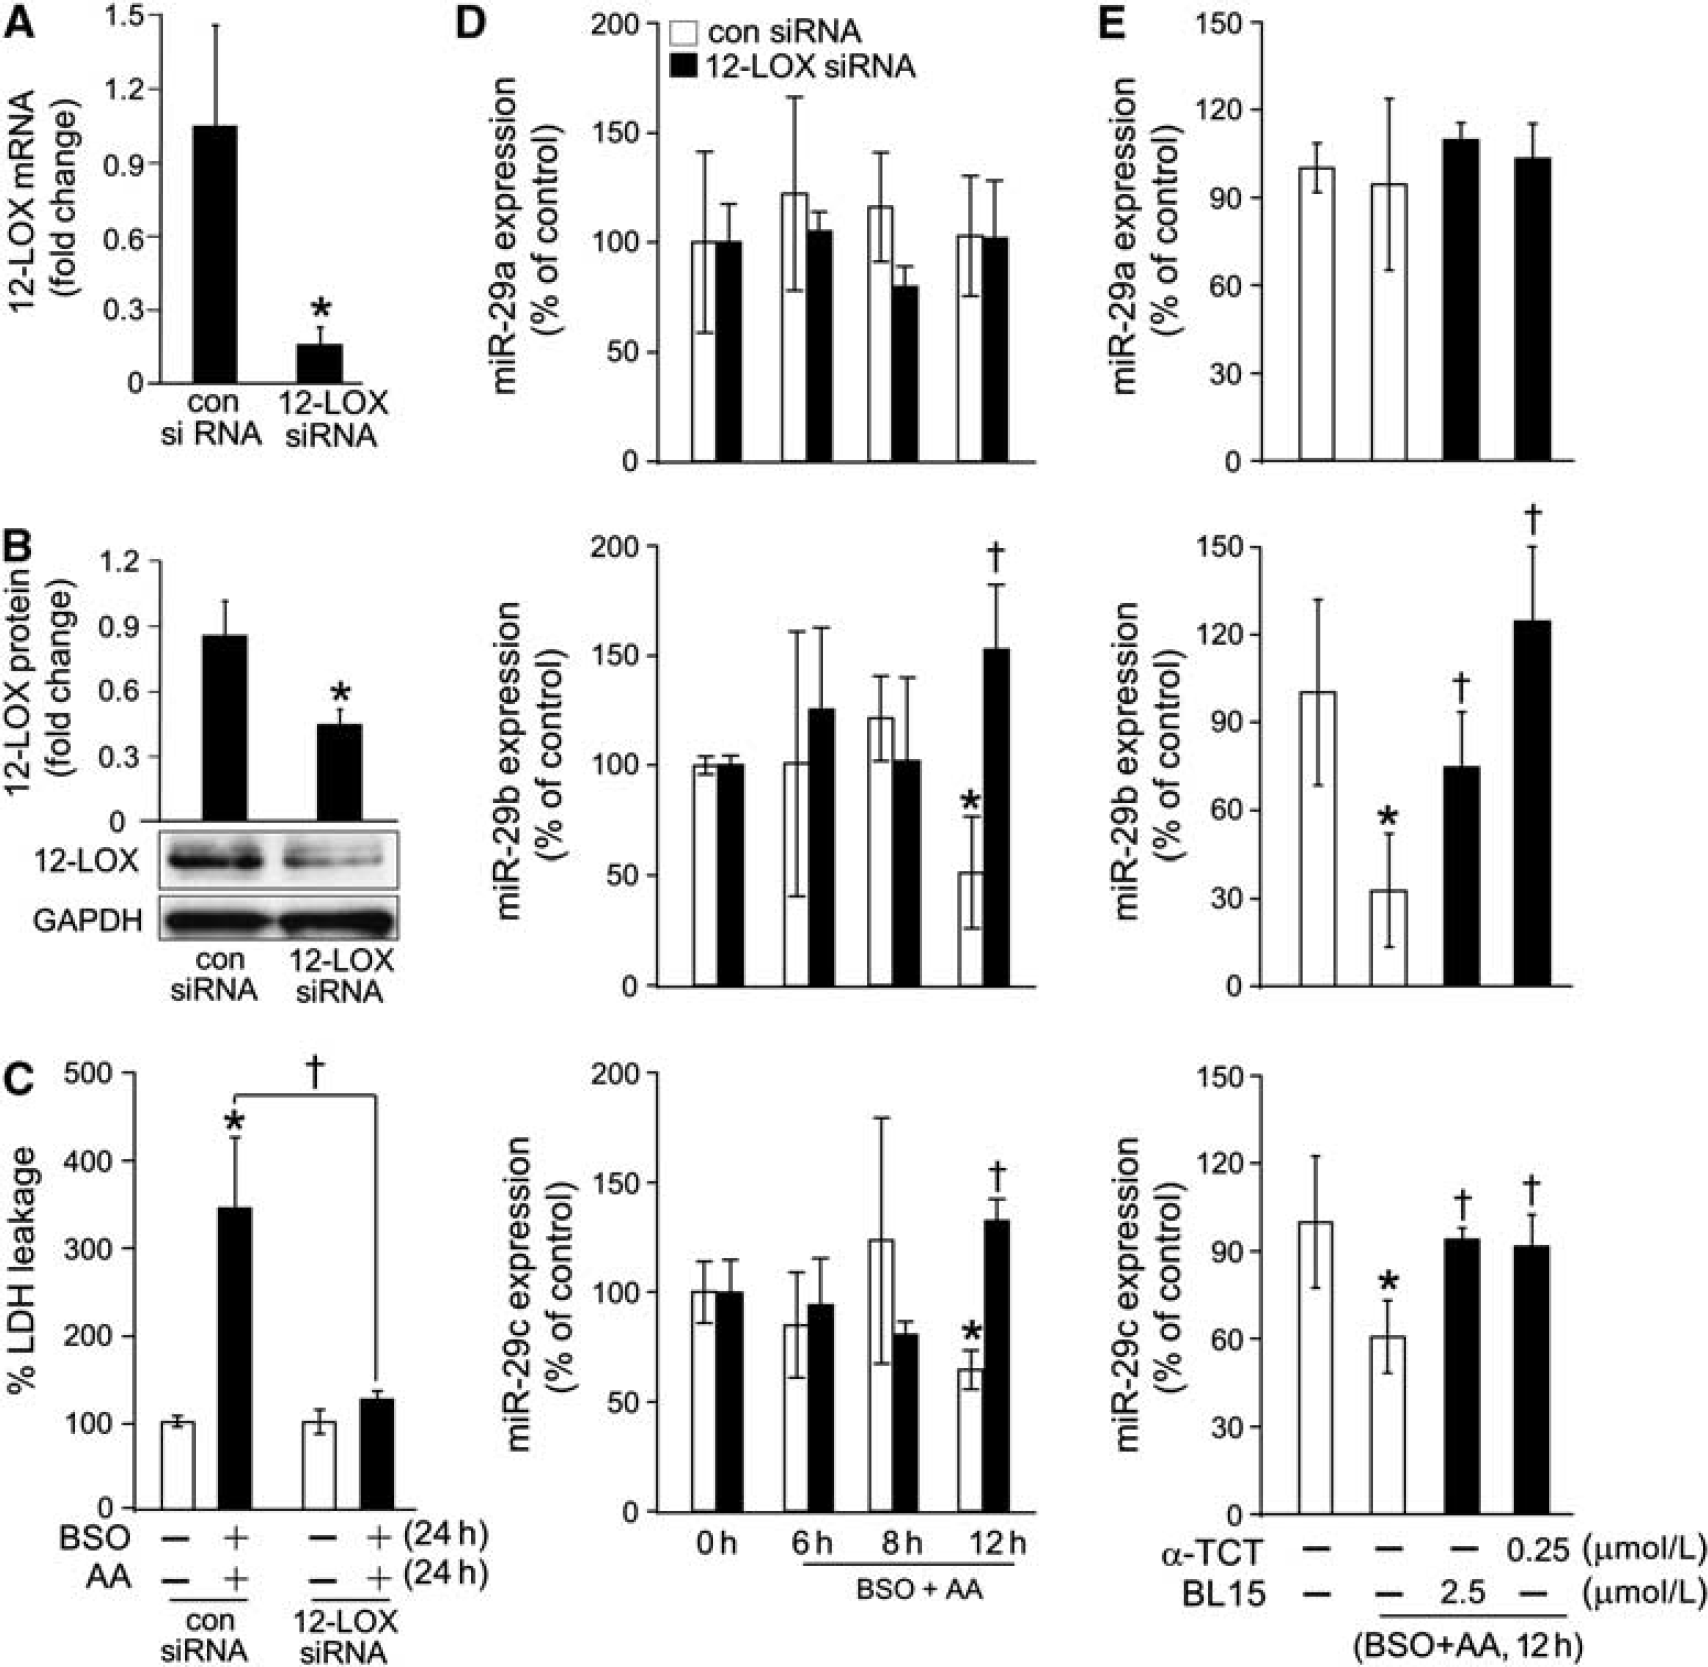
12-lipoxygenase (12-LOX) inhibition protected cells against L-buthionine-sulfoximine (BSO) and arachidonic acid (AA)-induced loss of miR-29b, miR-29c and cell death. (
Significance of 12-lipoxygenase in Loss of Neural Cell miR-29b/c
In neural cells, the pathway of arachidonic acid toxicity is primarily dependent on 12-lipoxygenase activity. High levels of 12-lipoxygenase product 12HETE were noted in HT4 cells (Supplementary Figure 1B) as well as primary cortical neurons (Supplementary Figure 1D). We were therefore led to question the significance of the 12-lipoxygenase pathway in the loss of miR-29b caused by arachidonic acid. The use of siRNA successfully knocked down 12-lipoxygenase expression (Figures 4A and 4B). Such knockdown clearly protected cells against arachidonic acid insult (Figure 4C). Interestingly, knockdown of 12-lipoxygenase completely abolished arachidonic acid-induced loss of cellular miR-29b/c (Figure 4D). Further data supporting the involvement of 12-lipoxygenase in arachidonic acid-induced loss of cellular miR-29b/c was obtained using inhibitors of 12-lipoxygenase catalytic function. At nanomolar concentration, α-tocotrienol completely abrogated arachidonic acid-induced loss of miR-29b/c (Figure 4E). Comparable data was obtained using another 12-lipoxygenase inhibitor, baicalein (Figure 4E). Both inhibitors also protected against cell death (Supplementary Figure 5). These observation provide first evidence demonstrating that the loss of miR-29b/c in arachidonic acid-treated neural cells is dependent on the enzymatic activity of 12-lipoxygenase.
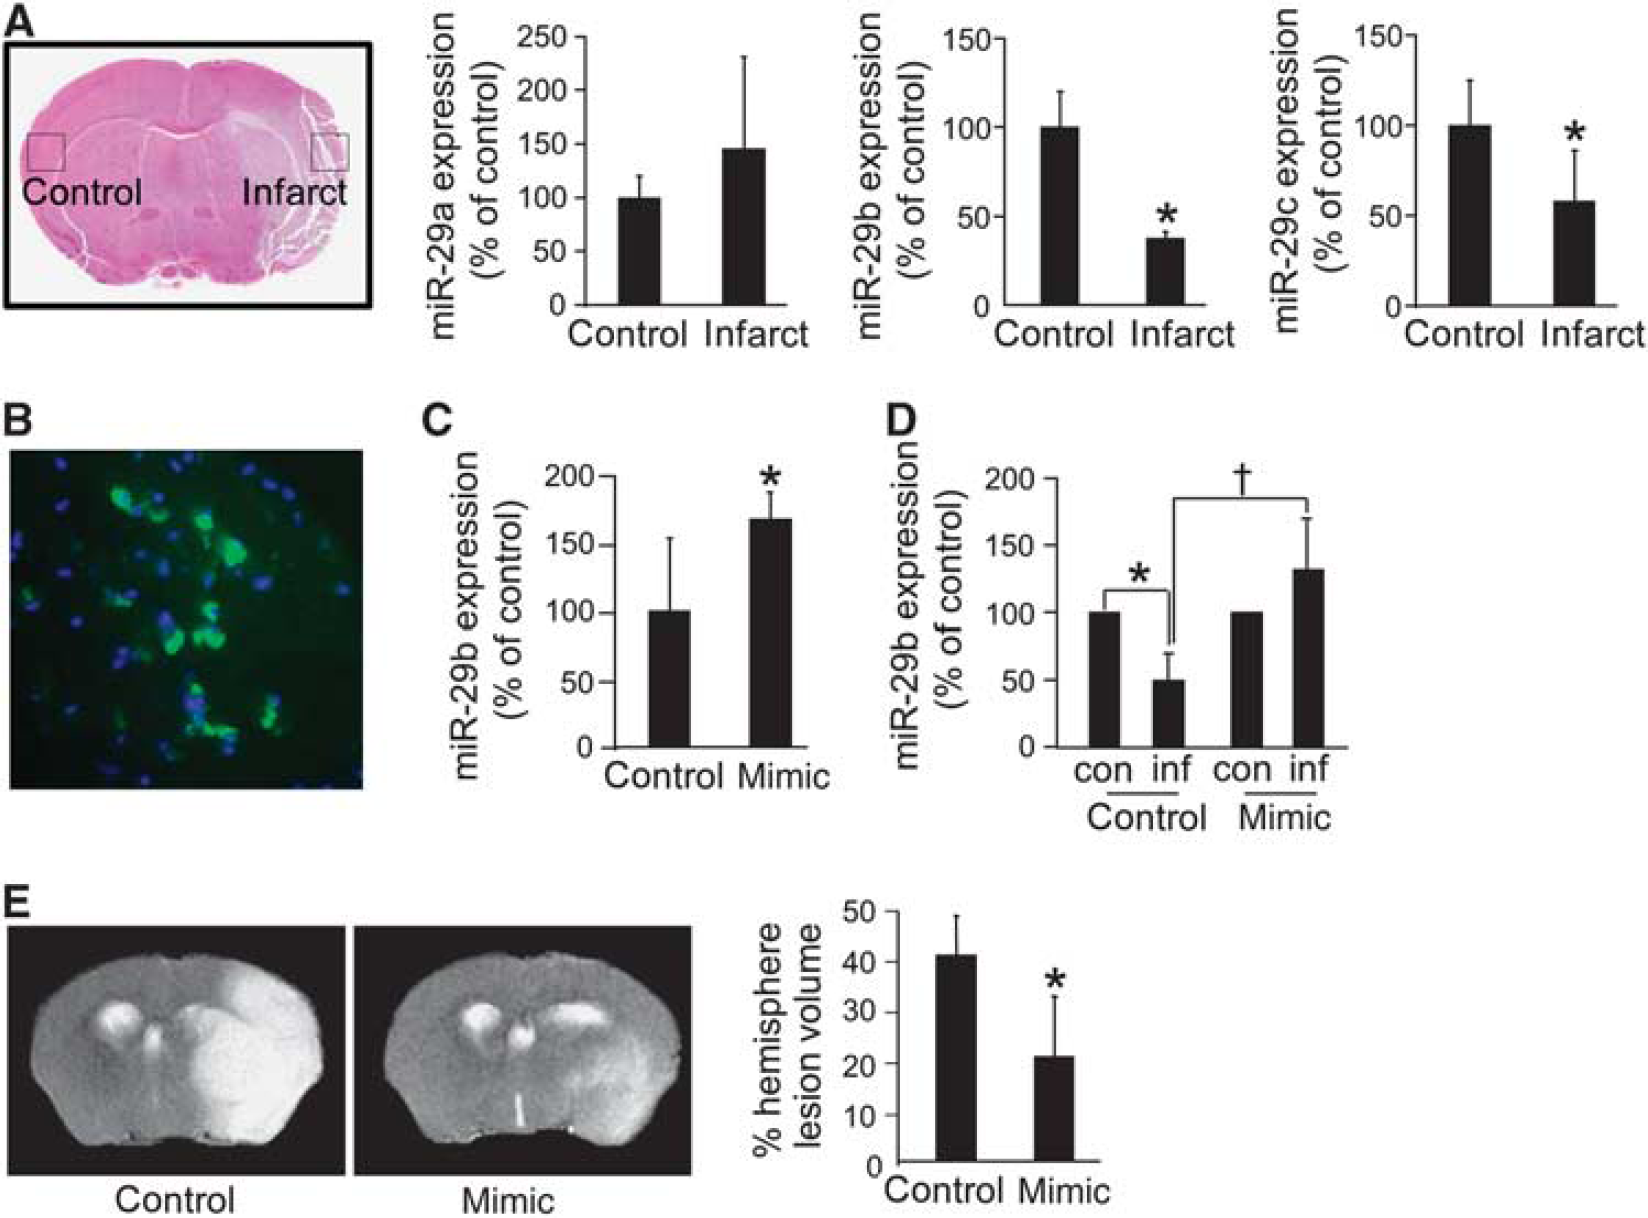
Acute ischemic stroke-induced brain lesion was attenuated by delivery of miR-29b mimic to the brain. Stroke was induced in C57BL/6 mice (
Functional Significance of miR-29b/c in Stroke in Vivo
In mice subjected to temporary MCAO, brain tissue was laser-capture microdissected specifically from the infarcted and contralateral primary somatosensory cortex as shown (Figure 5A). Real-time PCR analyses of the laser-captured brain tissue elements demonstrated specific loss of miR-29b and miR-29c 48 hours after stroke. Under these conditions, the tissue levels of miR-29a remained unaffected (Figure 5A). To draw a parallel between our in vitro experimental conditions, it is important to note that following stroke, brain tissue glutathione was depleted (Supplementary Figure 6A). In addition, stroke induced the hydrolysis of esterified arachidonic acid, causing the loss of membrane-bound arachidonic acid in brain tissue (Supplementary Figure 6B). Furthermore, stroke induced 12-lipoxygenase function as evidenced by selective increase in tissue 12HETE (Supplementary Figure 6C). The hypothesis that 12-lipoxgenase is directly implicated in stroke-induced loss of miR-29b/c is directly supported by the observation that 12-lipoxygenase knockout mice demonstrate protection against such loss (Supplementary Figure 7).
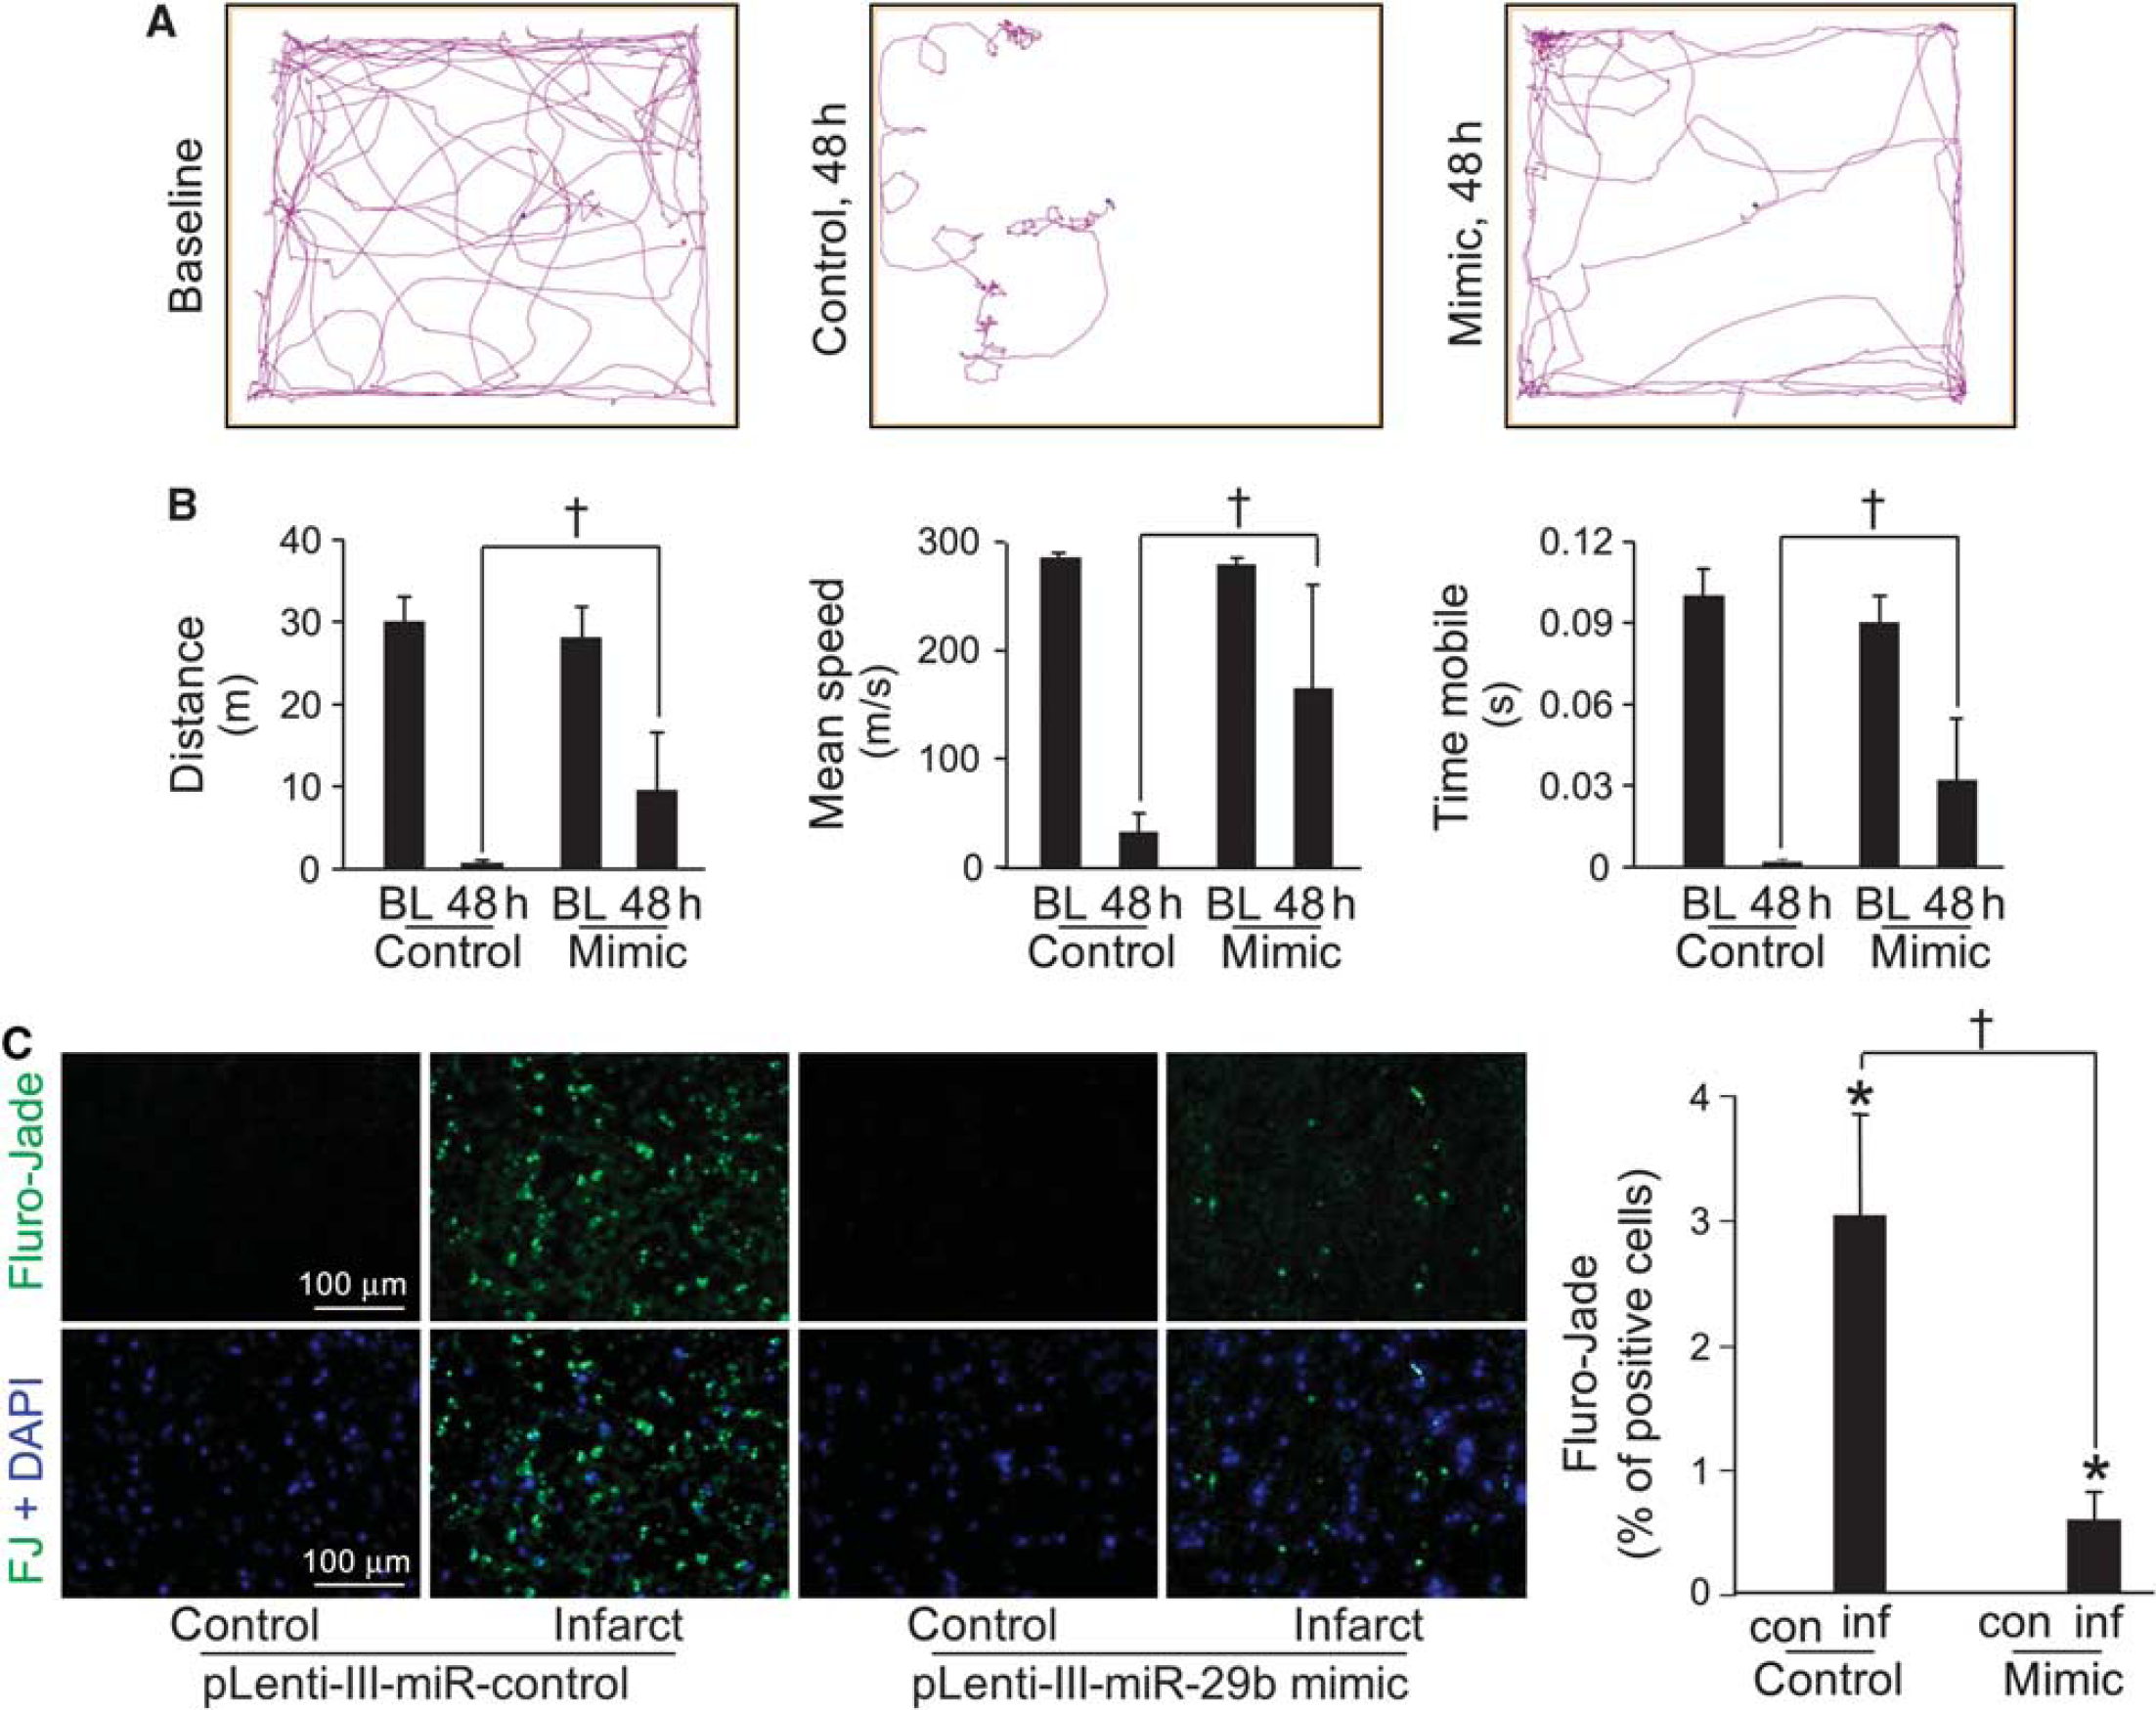
Delivery of miR-29b mimic to the brain improves (BL) poststroke sensorimotor function and attenuates stroke-induced neurodegeneration. (
Under conditions of stroke in vivo, depletion of miR-29b was more severe compared with that of miR-29c. We were therefore led to investigate the specific significance of miR-29b loss by performing rescue experiments where miR-29b mimic (Supplementary Figure 8) was delivered to the area at risk for stroke. Stereotaxic delivery of lentiviral particles was performed 72 hours before stroke surgery to allow for sufficient time for miR-29b expression (Figure 5B). The gene delivery approach was successful in elevating brain tissue miR-29b levels significantly (Figure 5C). Importantly, this approach was successful in completely abolishing stroke-induced loss of miR-29b in the area at risk for stroke (Figure 5D). Magnetic resonance imaging analyses 48 hours after MCAO revealed that the delivery of miR-29b mimic decreased the stroke-induced brain lesion by half (Figure 5E). Furthermore, miR-29b mimic delivery significantly improved poststroke sensorimotor function as compared with control (Figures 6A and 6B). Immunohistochemical localization of neurodegeneration using Fluoro-Jade staining demonstrated that miR-29b gene delivery significantly attenuated stroke-induced neurodegeneration (Figure 6C).
Oral Tocotrienol Protect Against Acute Ischemic Stroke by Sparing Loss of miR-29b and 29c
In an effort to develop the translational significance of miR-29b regulation, the efficacy of a dietary 12-lipoxygenase inhibitor was tested. α-Tocotrienol, a 12-lipoxygenase inhibitor, is safe for human consumption and when orally supplemented does reach the human brain. 33 Oral supplementation of α-tocotrienol was effective in completely rescuing stroke-induced loss of both miR-29b as well as miR-29c (Figure 7A). Such effect was associated with protection against stroke-induced lesion in the brain (Figure 7B).
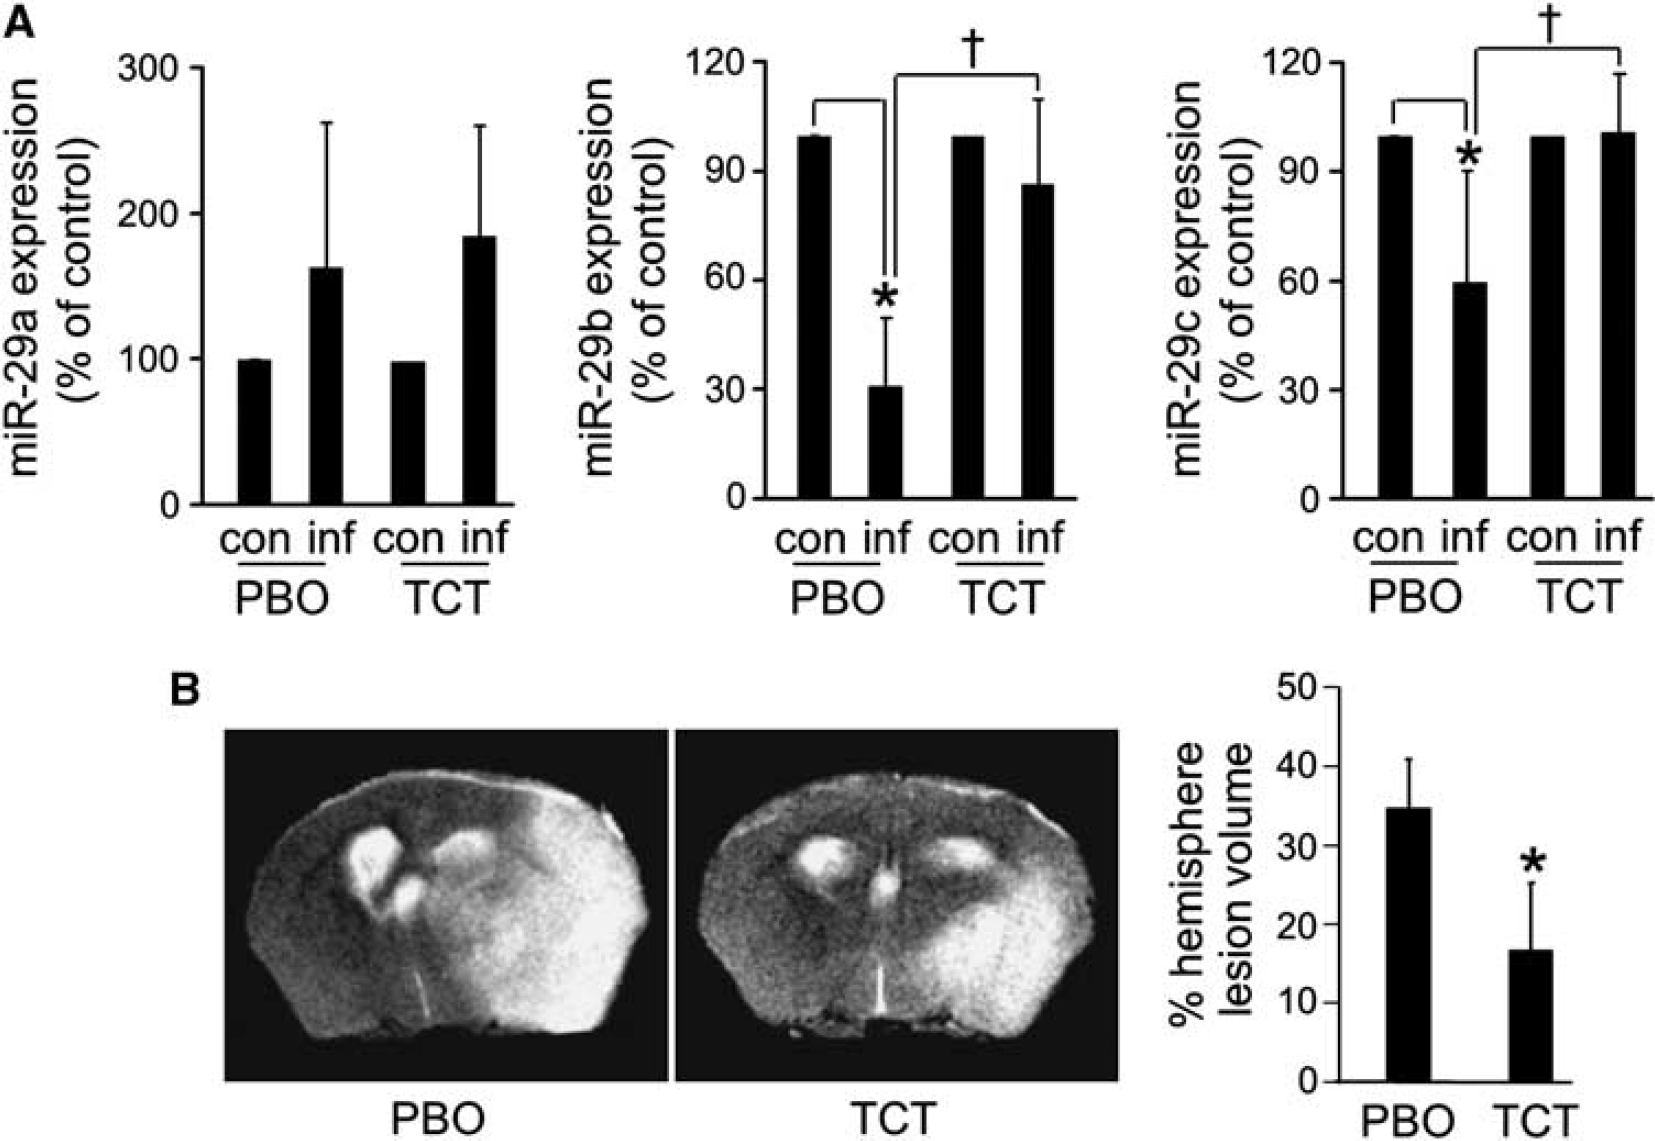
Orally supplemented TCT protected against acute ischemic stroke by sparing loss of miR-29b and 29c. C57BL/6 mice (n = 6) were orally gavaged with vitamin-E-stripped corn oil (PBO) or α-tocotrienol (TCT, 50 mg/kg body weight) for 10 weeks. Next, mice were subjected to middle-cerebral artery occlusion (MCAO) for 90 minutes. (
DISCUSSION AND CONCLUSION
After stroke, changes in the miRNA transcriptome implicate these noncoding small genes in the pathological cascade of events that include blood-brain barrier disruption (miR-15a), caspase-mediated cell death signaling (miR-497) and neural cell survival (miR-200 family). miRNAs regulating poststroke inflammatory response (miR-125b; miR-26a, −34a, −145 and let-7b) are also known to influence stroke outcomes. 34 miR-29b was induced with neuronal maturation and served as an anti-apoptosis factor by silencing pro-apoptotic genes of the BH3-only family. 3 Silencing of members of the miR-29 family have been directly implicated in several types of cancer indicating their tumor-suppressive properties. 35 Lowering of miR-29b in myoblasts causes muscular dystrophy, which can be rescued by miR-29b delivery. In this scenario, miR-29 is under negative regulation by transforming growth factor-β signaling. 36 Loss of miR-29 suppresses myogenesis in chronic kidney disease. 37 In pulmonary fibrosis, miR-29b is protective and shows promise for gene therapy. 38 Strong anti-fibrotic effects of miR-29s have been also demonstrated in the heart and kidney. 1 A recent work recognizes miR-29b as a neuronal survival factor. 3 The current work is the first to report specific loss of miR-29b at the infarct site after stroke. Prevention of such stroke-induced loss of miR-29b using a miR-29b mimic delivery approach significantly improved stroke outcomes. This observation highlights the functional significance of stroke-site miR-29b in influencing lesion outcomes. Rescue of miR-29b against stroke-induced loss was also achieved by the 12-lipoxygenase inhibitor α-tocotrienol, which is a form on natural vitamin E that might be used in nutritional intervention against stroke.7,17,30,33
During stroke, arachidonic acid is mobilized from the membrane of GSH-deficient cells and feeds the 12-lipoxygenase pathway triggering the production of reactive lipid metabolites, which function as mitochondrial toxin.39,40 Our laboratory was the first to report a central role of 12-lipoxygenase in regulating stroke outcomes.7,12 In this work, the observation that 12-lipoxygenase-deficient mice were resistant to stroke-induced loss of miR-29 point toward the 12-lipoxygenase pathway as a major contributor to loss of the miR. The study of neural cell death under conditions of GSH deficiency and arachidonic acid insult has been of outstanding interest to specifically address the 12-lipoxygenase pathway.7,12,13,41,42 Cell biology studies conducted to specifically study the 12-lipoxygenase pathway indicated loss of miR-29b and miR-29c under conditions of arachidonic acid insult of GSH-deficient cells. Cell survival was successfully rescued in these challenged cells using a miR-29b mimic delivery approach. Consistently, inhibition of miR-29b markedly potentiated cell death. These observations underscore the significance of miR-29b as a neural cell survival factor. Knockdown as well as pharmacological inhibition of 12-lipoxygenase spared loss of miR-29b in arachidonic acid challenged GSH-deficient cells confirming a key role of this pathway in lowering miR-29b. These findings constitute first evidence directly linking neural cell arachidonic acid metabolism to changes in miR expression. While lipid peroxidation byproducts are known to influence miR abundance, the underlying mechanisms remain unclear. 43 Taken together, this work recognizes that the loss of miR-29b at the infarct site is a major contributor to development of the stroke lesion.
This work provides first evidence demonstrating that loss of miR-29b at the infarct site is a key contributor to stroke lesion. Such loss is contributed by activity of the 12-lipoxygenase pathway providing maiden evidence linking arachidonic acid metabolism to miR stroke biology.
DISCLOSURE/CONFLICT OF INTEREST
The authors declare no conflict of interest.
Footnotes
References
Supplementary Material
Please find the following supplemental material available below.
For Open Access articles published under a Creative Commons License, all supplemental material carries the same license as the article it is associated with.
For non-Open Access articles published, all supplemental material carries a non-exclusive license, and permission requests for re-use of supplemental material or any part of supplemental material shall be sent directly to the copyright owner as specified in the copyright notice associated with the article.