The purpose of this study was to estimate magnetic resonance imaging-based brain perfusion parameters from combined multiecho spin-echo and gradient-echo acquisitions, to correct them for T1-, T2-, and T∗2-related contrast agent (CA) extravasation effects, and to simultaneously determine vascular permeability. Perfusion data were acquired using a combined multiecho spin- and gradient-echo (SAGE) echo-planar imaging sequence, which was corrected for CA extravasation effects using pharmacokinetic modeling. The presented method was validated in simulations and brain tumor patients, and compared with uncorrected single-echo and multiecho data. In the presence of CA extravasation, uncorrected single-echo data resulted in underestimated CA concentrations, leading to underestimated single-echo cerebral blood volume (CBV) and mean transit time (MTT). In contrast, uncorrected multiecho data resulted in overestimations of CA concentrations, CBV, and MTT. The correction of CA extravasation effects resulted in CBV and MTT estimates that were more consistent with the underlying tissue characteristics. Spin-echo perfusion data showed reduced large-vessel blooming effects, facilitating better distinction between increased CBV due to active tumor progression and elevated CBV due to the presence of cortical vessels in tumor proximity. Furthermore, extracted permeability parameters were in good agreement with elevated T1-weighted postcontrast signal values.
Dynamic susceptibility-contrast perfusion-weighted imaging (DSC PWI) is commonly used for magnetic resonance imaging (MRI)-based assessment of stroke and brain tumor patients. The majority of DSC PWI measurements are acquired using gradient-echo (GE) echo-planar imaging (EPI) MRI pulse sequences. This is mainly due to the relatively high contrast-to-noise ratio of GE EPI and its availability on most clinical MRI systems. One of the several drawbacks of a standard single-echo GE EPI sequence, however, is its sensitivity to T1-shortening effects in cases of contrast agent (CA) extravasation into the extravascular–extracellular space (EES) due to a disrupted blood–brain barrier. The MRI signal intensity measured with a single-echo GE EPI sequence increases as a result of faster tissue T1-recovery in the presence of gadolinium (Gd) molecules within the EES, counteracting the CA-induced signal drop caused by the T*2-effect of the CA.1 It has been shown that either pharmacokinetic modeling1–3 or multiecho GE EPI-based acquisitions4–6 could be used to correct for T1-shortening effects caused by CA extravasation. However, CA leakage into the EES does not only cause T1-shortening effects, it also creates alterations in T2 and T*2.7–9 Since extravasation changes the CA distribution volume from intravascular plasma space (IPS) to a combination of IPS and EES (cf. Figure 1), the central volume principle10,11 used in T2- or T*2-weighted DSC PWI is violated. Moreover, due to altered CA distribution, local susceptibility gradients change, affecting the relationship between CA concentration and changes in the transverse relaxation rate. Thus, errors in estimated perfusion parameters, such as cerebral blood volume (CBV)1,2 or mean transit time (MTT),12,13 could result from CA extravasation into the EES, limiting the diagnostic value of uncorrected DSC PWI data.
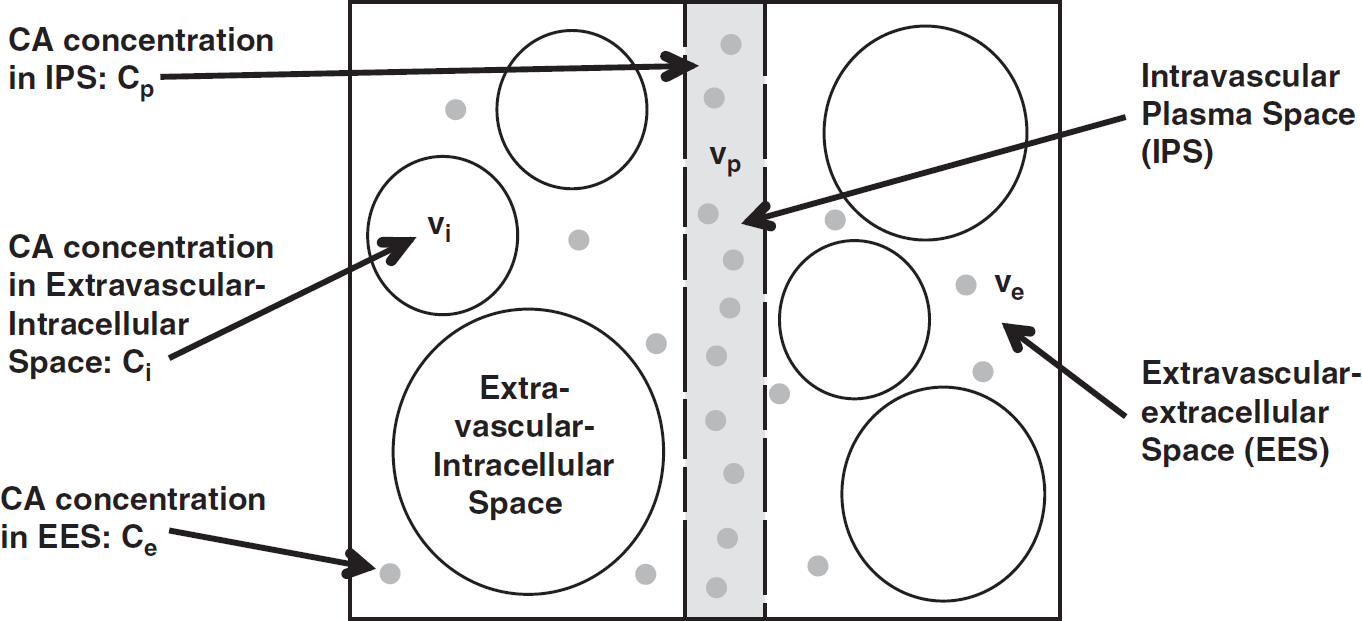
Multicompartment model showing contrast agent (CA) passage through tissue in the presence of CA extravasation. Dots represent CA within intravascular plasma space (IPS) and extravascular–extracellular space (EES) with volume fractions vp and ve, and CA concentrations Cp and Ce, respectively. The extravascular–intracellular space with volume fraction vi is assumed to be impermeable to Gd molecules, thus the extravascular–intracellular CA concentration Ci is assumed to be equal to 0.
Other DSC PWI studies1–3,14–16 have explored the potential of pharmacokinetic modeling to correct for T1- or T*2-related CA leakage effects and to derive additional permeability parameters, such as the volume transfer constant (Ktrans) and the EES volume fraction (ve), which are usually obtained in dynamic contrast-enhanced (DCE) MRI measurements. A popular method proposed by Weisskoff et al1,2 suggested estimating leakage-corrected CA concentrations from a linear combination of reference tissue-averaged intravascular and leakage terms. However, it suffered from the restrictive assumption of equivalent hemodynamic properties (such as bolus arrival time, dispersion, and MTT) in healthy tissue and tumor. Furthermore, this method did not account for T*2-effects caused by CA extravasation. A recently introduced model based on Weisskoff et al1,2 corrected for T*2-effects caused by CA leakage;15 however, it still assumed equal hemodynamic properties, which resulted in errors in the estimation of perfusion parameters. More recently, Bjørnerud et al14 used local residue functions in combination with an advanced pharmacokinetic model, which was originally suggested by St Lawrence and Lee,17 to estimate vascular permeability and to correct for T1- and T*2-related leakage effects. However, the approach by Bjørnerud et al did not explicitly include a model to estimate the relationship between CA concentrations in the different tissue compartments and changes in T*2. This resulted in a nonlinear relationship between Ktrans and the permeability constant used in their study. Furthermore, ve could not be determined with their approach. Quarles et al16 suggested a GE-based dual-echo DSC PWI method to determine leakage-corrected vascular permeability parameters Ktrans and ve, based on a reference-tissue model18 without determination of an arterial input function. However, they did not determine leakage-corrected, quantitative DSC PWI maps.
The present study is based on a modified version of the approach used by Bjørnerud et al.14 Instead of relying on single-echo EPI data, multiecho GE and spin-echo (SE) EPI data were acquired, which enabled simultaneous perfusion and permeability mapping, corrected for CA extravasation effects. Our method facilitated the estimation of T*2-based GE perfusion parameters, T2- based SE perfusion parameters through multiple signal readouts following a 180° refocusing pulse, and vascular permeability parameters Ktrans and ve. The additional determination of SE perfusion parameters resulted in added benefit of increased sensitivity to the microvasculature and reduced sensitivity to larger vessels when compared with GE perfusion data,19–22 leading to reduced large-vessel blooming and complementary information.
The purposes of this study were (1) to estimate GE and SE CBV, cerebral blood flow (CBF), and MTT from combined GE and SE EPI data; (2) to correct GE and SE PWI data for T1-, T2-, and T*2-related CA extravasation effects and to investigate the effects of this correction on PWI parameters in comparison with uncorrected single-echo and multiecho perfusion data; and (3) to simultaneously determine the vascular permeability parameters Ktrans and ve.
MATERIALS AND METHODS
Perfusion Data Acquisition
Perfusion data were acquired using the combined spin- and gradient-echo (SAGE) EPI pulse sequence.23 With this sequence, five EPI signal readouts were measured at different echo times TE, with TE1–5 = 15.9, 32.5, 63.9, 80.4, and 97.0 milliseconds, following the application of a 90° spectral-spatial excitation pulse. A 180° refocusing pulse was applied at TE = TE5/2 to form a SE signal at TE = TE5. This procedure was repeated for a total of 60 time points t, during which a single-dose of a Gd-based CA, gadobenate dimeglumine (MultiHance, Bracco Imaging, Milano, Italy), was injected at an injection rate of 4 to 5 mL/s and an injection delay of 15 to 18 seconds with respect to the beginning of the DSC PWI acquisition, followed by a 20 to 25 mL saline flush injected at the same flow rate. Perfusion-weighted imaging data were acquired with a 3T MRI unit (General Electric Healthcare, Waukesha, WI, USA; gradients: 50 mT/m, 200 T/m per second) using an eight-channel head receiver array (Invivo Corporation, Orlando, FL, USA). In all, 15 slices with an in-plane resolution of 84 × 84 and a slice thickness of 5.0 mm were measured within a field-of-view of 240 mm. The repetition time (TR) was set to 1.8 seconds to facilitate full-brain coverage.
Determination of Perfusion Parameters Using Pharmacokinetic Modeling
Estimation of leakage-corrected perfusion parameters was based on the adiabatic approximation to the tissue homogeneity model,17 which facilitated the simultaneous determination of the permeability parameters Ktrans and ve. The applied pharmacokinetic model is described in the Appendix. It differs from the more commonly used model derived by Tofts24 by accounting for the tissue transit time of blood during the so-called vascular phase, after which all CA leaves the tissue through the vascular network with the exception of the fraction that has leaked into the EES.17
The perfusion parameters CBV, CBF, and MTT were computed from the arterial input function CAIF(t) and the intravascular residue function R(t), according to the methods described elsewhere.25–27 In this study, CAIF(t) was selected manually, derived from multiecho gradient-echo data acquired with SAGE EPI.23 The arterial input function was corrected for partial-volume effects according to the methods used in Schmiedeskamp et al23 and a nonlinear response to CA concentration within blood, as shown in van Osch et al.28R(t) was derived from Equation (10), using pharmacokinetic modeling of T2- and T*2-based CA concentrations (cf. Appendix). The entire tissue CA concentration time curve and CAIF were numerically integrated using the trapezoid rule. The ratio between the integral of the tissue CA concentration and the integral of the arterial input function resulted in the vascular volume fraction vp. vp was then multiplied with a hematocrit-correction factor Hc = (1–0.45)/(1–0.25) and divided by the brain density ρ = 1.04 g/mL to calculate CBV. Cerebral blood flow was derived from the multiplication of Hc/ρ with the intravascular blood flow F, which was determined in Equation (10). Mean transit time resulted from the division of CBV by CBF.10 The resulting perfusion parameters are also referred to as leakage-corrected multiecho perfusion data.
Leakage-corrected multiecho data-derived perfusion parameters were compared with uncorrected multiecho perfusion data. Hereby, changes in R2 and R*2 were derived from T1-independent estimates of R2 and R*2.23 In this case, the adjusted vascular transfer function H(t) (see Appendix) was used to substitute for the intravascular tissue residue function R(t), thus CA extravasation effects were not taken into account.
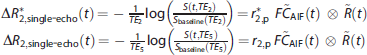
The resulting data were also compared with uncorrected single-echo data-derived perfusion parameters using a single-echo arterial input function C~AIF(t) and an uncorrected tissue residue function R~(t). To simulate a single-echo acquisition, changes in R*2 were derived from the time course of the second EPI signal readout of the SAGE EPI pulse sequence, S(t,TE2), with prebolus baseline average Sbaseline(TE2), and changes in R2 were derived from the time course of the fifth EPI readout, S(t,TE5), with prebolus baseline average Sbaseline(TE5):
r2,p and r*2;p are transverse relaxivities that relate intravascular CA concentration to changes in R2 and R*2, with r2,p = 20.4 L per mmol per second (ref. 23) and r*2;p = 87.0 L per mmol per second (ref. 29).
Data Simulations
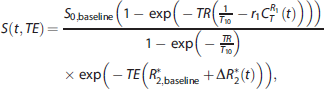
Simulations were performed to analyze the effects of varying leakage properties on perfusion parameters using uncorrected single-echo and multiecho data, as well as leakage-corrected multiecho data using the proposed modeling approach. Cerebral blood flow of 60.0 mL per 100 g per minute and MTT of 5.0 seconds were used in the simulations. Without leakage, this would result in nominal CBV of 5.0 mL/100 g. An arterial input function CAIF was simulated using a gamma-variate function with peak CA concentration of 4.23 mmol/L and an additional postbolus steady-state CA concentration of 1.00 mmol/L to model remaining CA in the blood stream. The intravascular residue function R(t) was modeled with R(t) = exp(–t/MTT). TR and TE were set equal to the MRI pulse sequence parameters used for patient measurements. Ktrans was varied between 0.00 and 0.12 per minute. The EES component ve was set to 0.25, which is within the range of literature values for brain tumors.30,31 Further parameters were R*2,baseline = 1/T*2,baseline = 30 per second, T10 = 1.75 seconds, S0,baseline = 4000 a.u., transverse relaxivities of CA within EES and IPS: r*2;e = 30 L per mmol per second and r*2;p = 87 L per mmol per second (ref. 29), longitudinal relaxivity of CA: r1 = 6.3 L per mmol per second (ref. 32). The raw signals of each echo train, S(t,TE), were generated with the assumption of fast water exchange between different tissue compartments33 and a negligible effect from intravascular T1 changes,2 resulting in
where CR1T(t) is the T1-based tissue CA concentration derived from Ktrans, ve, CBF, MTT, and CAIF(t) using the pharmacokinetic modeling approach described in the Appendix (cf. Equation (6)). ΔR*2 represents local changes in R*2 upon CA passage, derived from the convolution of CAIF(t) with R(t). Equation (2) explicitly includes a term for transverse R*2 decay, thus the estimate of the T1-based tissue CA concentration CR1T(t) was independent of confounding R*2 effects, a common issue in DCE MRI studies.
Patient Population
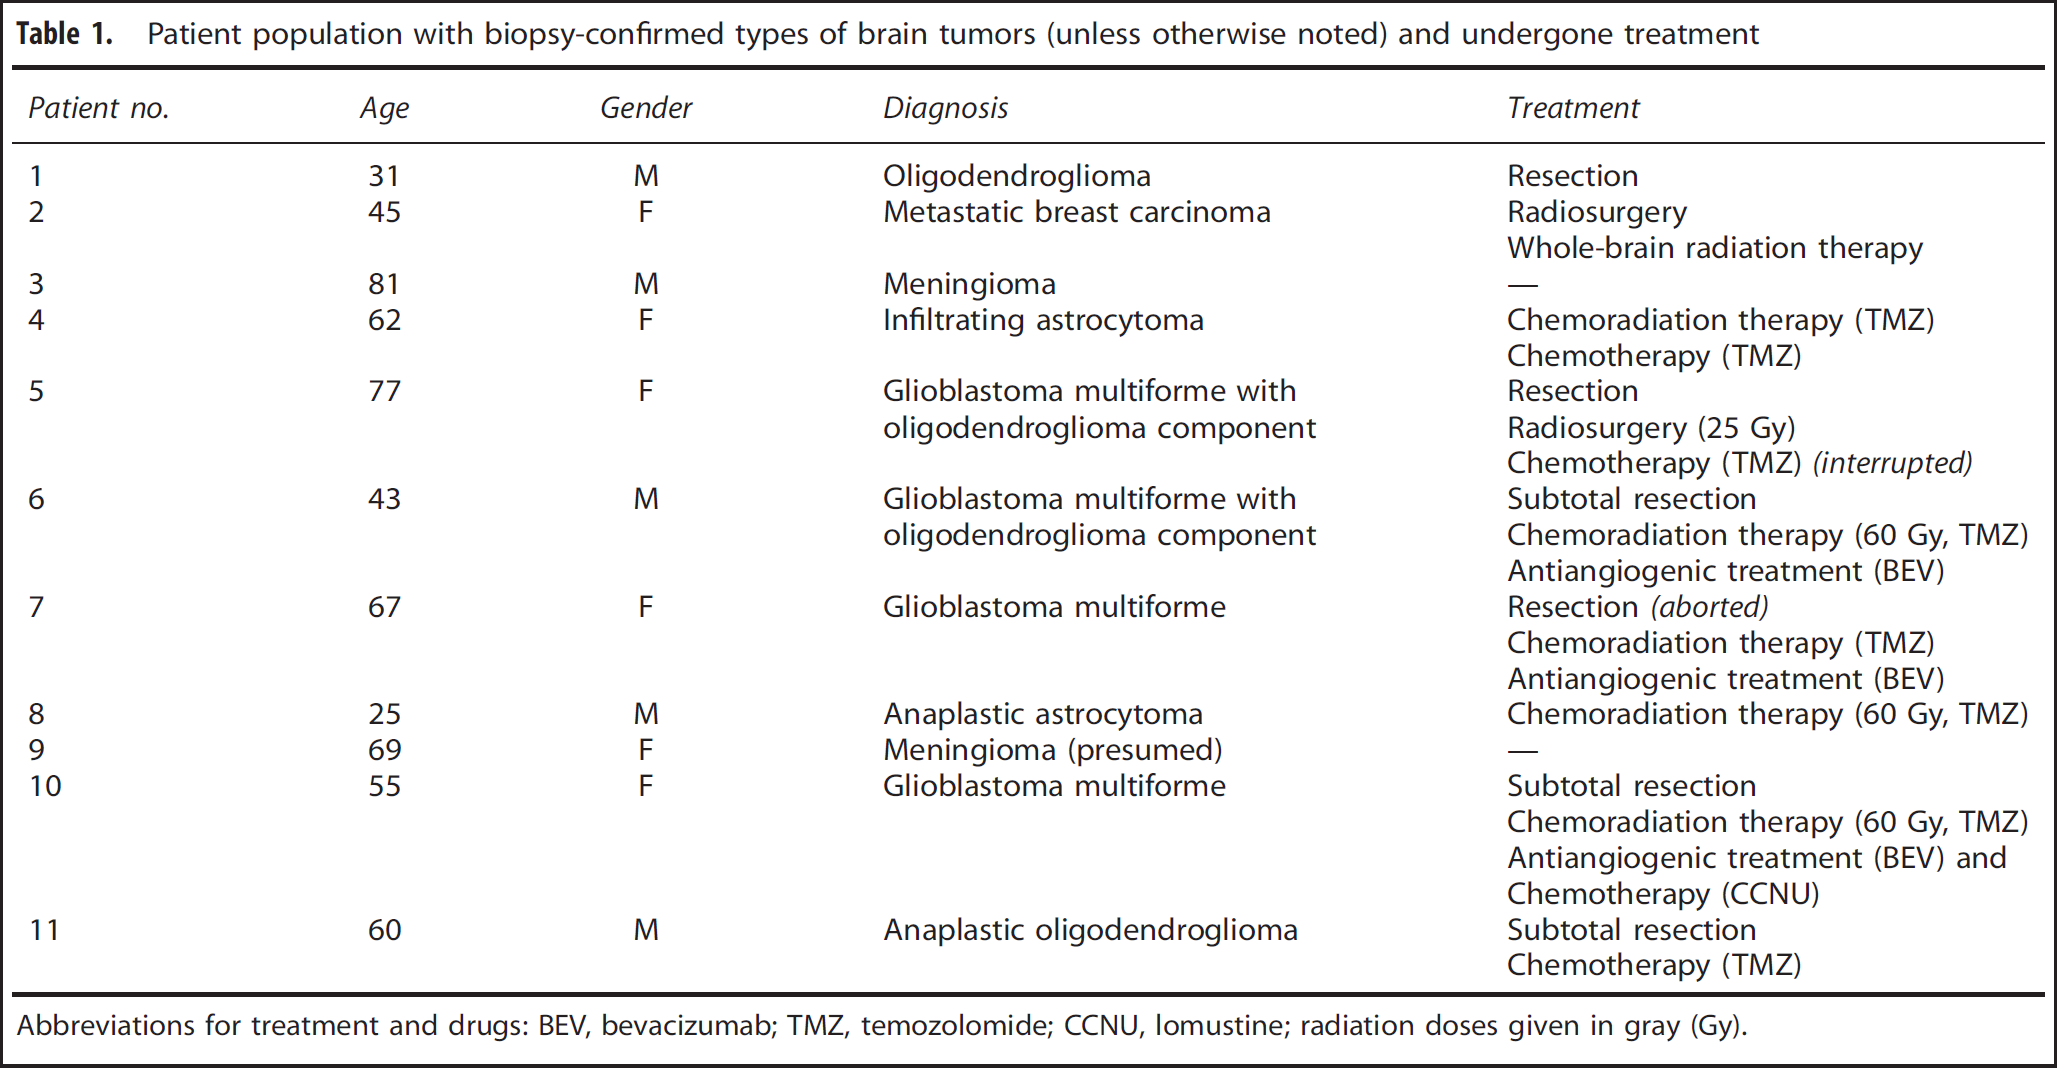
Spin- and gradient-echo perfusion data were acquired in 11 patients as part of routine clinical brain MRI examinations with CA injection. These patients were previously diagnosed with different types of brain tumors shown in Table 1. Informed consent was obtained from all patients in compliance with the institutional review board at Stanford University. The experiments performed in this study rely on the off-label use of Gd-based CA for brain perfusion imaging.
Patient population with biopsy-confirmed types of brain tumors (unless otherwise noted) and undergone treatment
Patient no.
Age
Gender
Diagnosis
Treatment
1
31
M
Oligodendroglioma
Resection
2
45
F
Metastatic breast carcinoma
Radiosurgery
Whole-brain radiation therapy
3
81
M
Meningioma
—
4
62
F
Infiltrating astrocytoma
Chemoradiation therapy (TMZ)
Chemotherapy (TMZ)
5
77
F
Glioblastoma multiforme with
Resection
oligodendroglioma component
Radiosurgery (25 Gy)
Chemotherapy (TMZ) (interrupted)
6
43
M
Glioblastoma multiforme with
Subtotal resection
oligodendroglioma component
Chemoradiation therapy (60 Gy, TMZ)
Antiangiogenic treatment (BEV)
7
67
F
Glioblastoma multiforme
Resection (aborted)
Chemoradiation therapy (TMZ)
Antiangiogenic treatment (BEV)
8
25
M
Anaplastic astrocytoma
Chemoradiation therapy (60 Gy, TMZ)
9
69
F
Meningioma (presumed)
—
10
55
F
Glioblastoma multiforme
Subtotal resection
Chemoradiation therapy (60 Gy, TMZ)
Antiangiogenic treatment (BEV) and Chemotherapy (CCNU)
11
60
M
Anaplastic oligodendroglioma
Subtotal resection
Chemotherapy (TMZ)
Abbreviations for treatment and drugs: BEV, bevacizumab; TMZ, temozolomide; CCNU, lomustine; radiation doses given in gray (Gy).
Data Analysis
Data analysis was based on regions of interest (ROIs) placed within brain tumors and healthy tissue. Tumor ROIs were automatically generated with the following criteria: Ktrans had to be >0.5 times the highest observed Ktrans, and ve had to be >0.4 times the highest observed ve in a given data set. Thereafter, the largest cluster of connected voxels within one slice was selected and served as the ROI within tumor tissue.
Perfusion and permeability data are presented in the form of average values within the selected ROIs ± their standard deviations within the same ROIs. As part of the data analysis, root-mean-square (R.M.S.) errors were determined by calculating the square root of the sum of squared differences between the pharmacokinetic model and the data measured at each time point t. Matlab (The MathWorks, Natick, MA, USA) was used for both simulation and patient data processing.
RESULTS
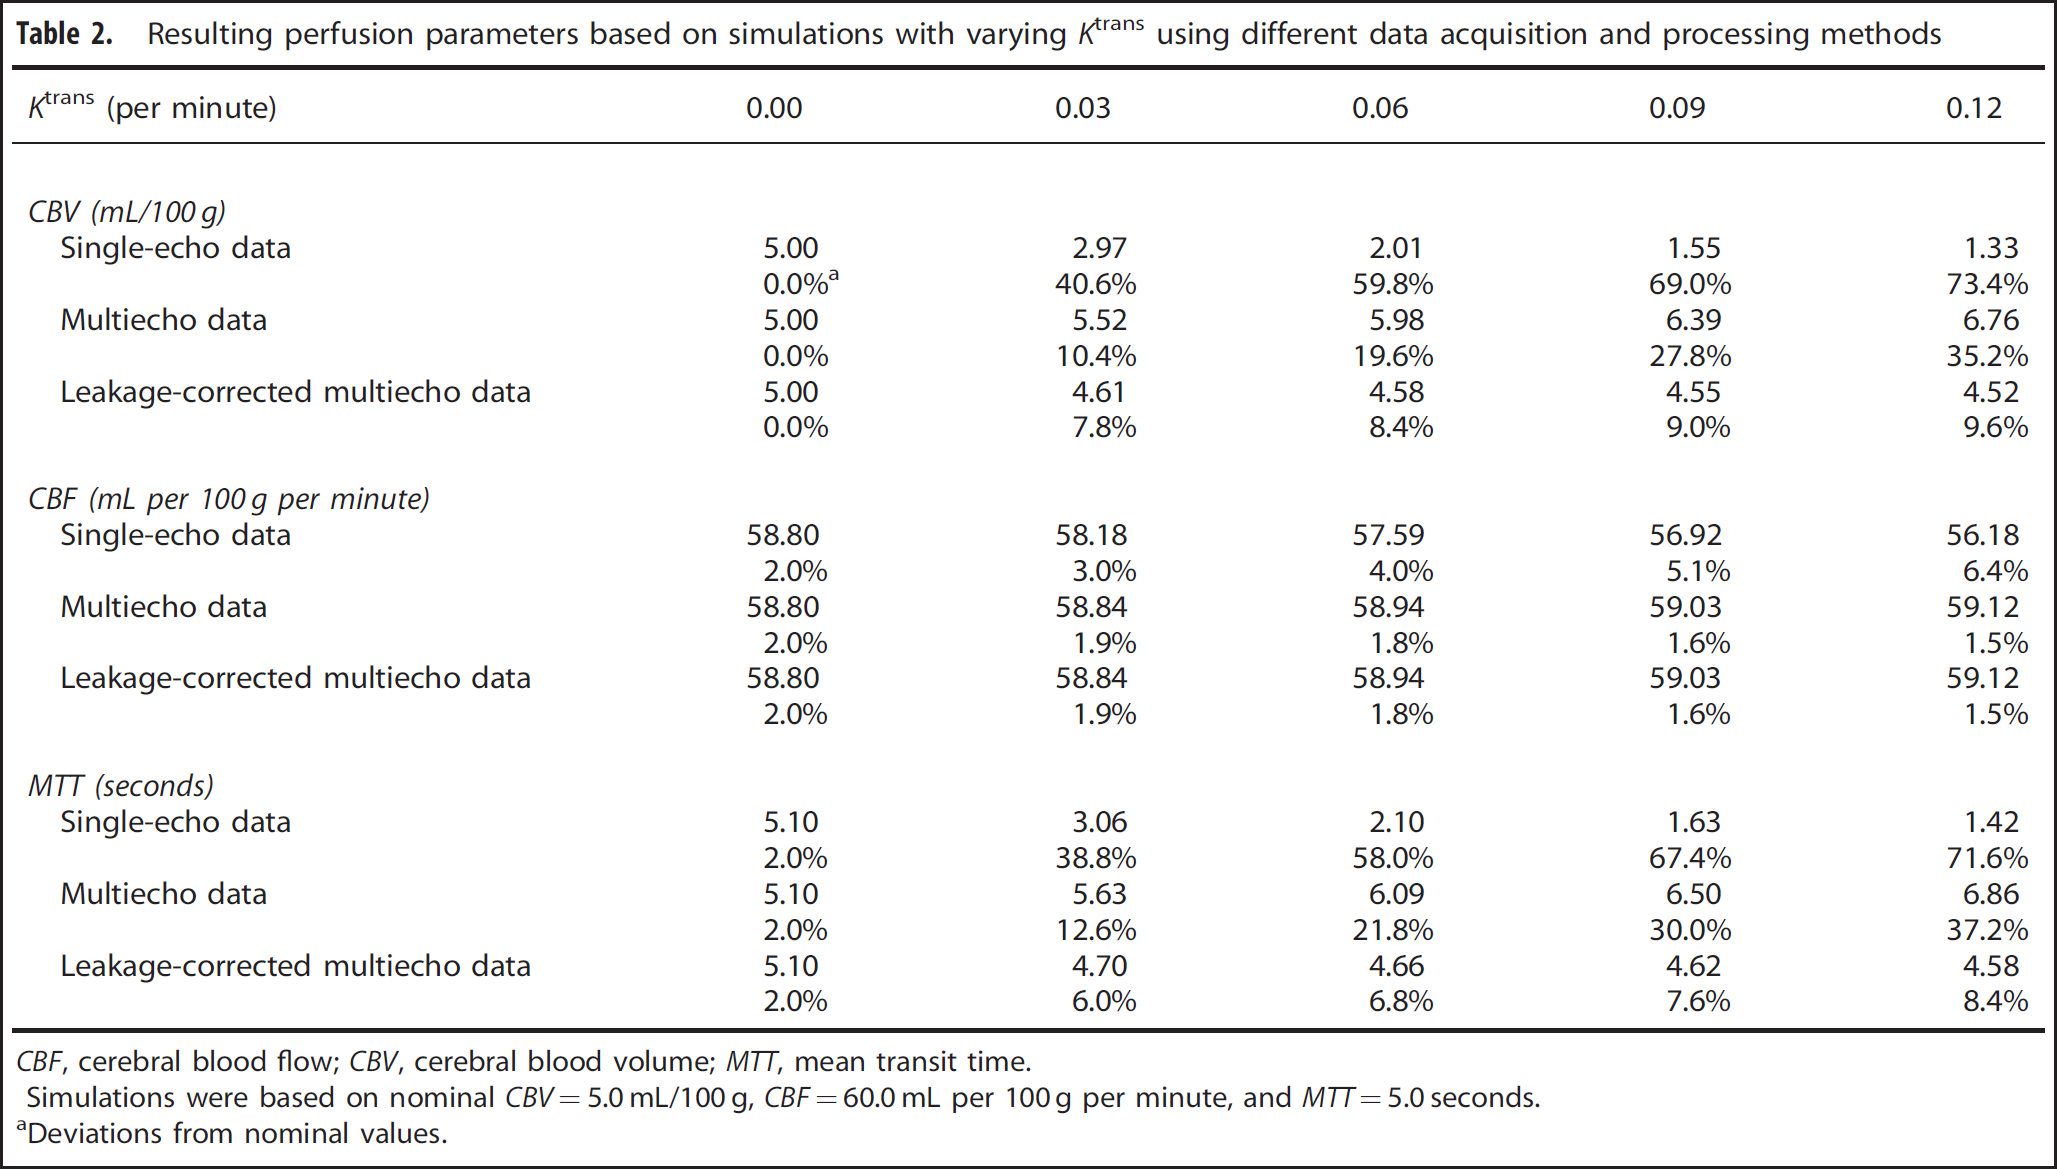
Figure 2 shows the results of data simulations performed with different values of Ktrans. In the absence of CA extravasation (i.e., Ktrans = 0), single-echo data, uncorrected multiecho data, and leakage-corrected multiecho data using the proposed model resulted in CBV = 5.00 mL/100 g, CBF = 58.80 mL per 100 g per minute, and MTT = 5.10 seconds (cf. Table 2). With no CA extravasation, single-echo and multiecho data resulted in good estimates of the simulated perfusion parameters, and the application of the proposed leakage-correction model did not alter these estimates.
Resulting perfusion parameters based on simulations with varying Ktrans using different data acquisition and processing methods
Simulations were based on nominal CBV=5.0 mL/100 g, CBF=60.0 mL per 100 g per minute, and MTT=5.0 seconds.
Deviations from nominal values.
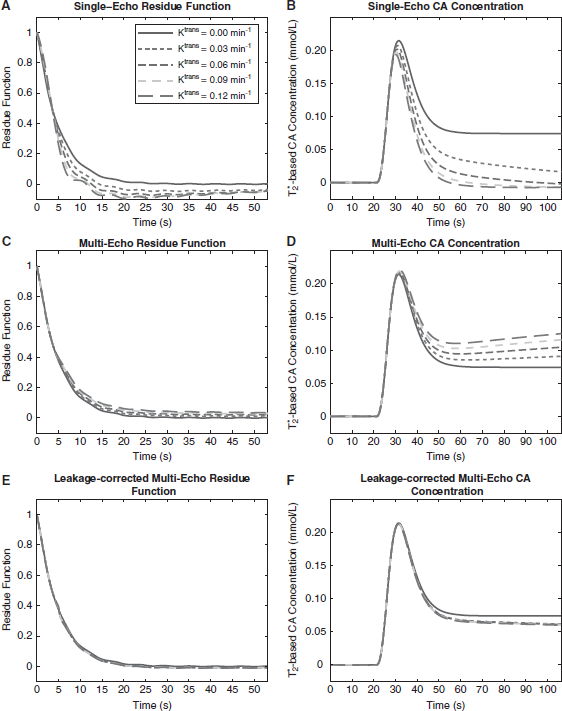
Simulations of contrast agent (CA) concentrations, given different values of Ktrans, obtained using uncorrected single-echo (A, B), uncorrected multiecho (C, D), and leakage-corrected multiecho (E, F) perfusion data. For each data processing method and Ktrans, the residue functions (left) and the calculated CA concentrations (right) are shown. For uncorrected single-echo data, dominating T1-shortening effects resulted in underestimated postbolus CA concentrations, while for uncorrected multiecho data, dominating CA leakage-related T*2-shortening effects caused postbolus CA overestimations. Leakage-corrected multiecho data resulted in more accurate estimates of postbolus CA concentrations (cf. solid curves determined using Ktrans = 0 per minute), with only slightly underestimated postbolus CA concentrations due to assumptions that were made regarding the intravascular residue function.
In the presence of CA leakage, uncorrected single-echo data revealed highly reduced postbolus CA concentrations caused by T1-shortening effects,1,8 while peak bolus concentrations remained almost unchanged when compared with simulations with Ktrans = 0 (cf. Figure 2B). Thus, CBF was minimally affected by CA leakage, with maximum CBF deviations of 4.5% compared with simulations with Ktrans = 0. For Ktrans ≥ 0.06 per minute, simulated postbolus CA concentrations derived from single-echo data dropped below zero, leading to physiologically impossible values. Therefore, by integrating the CA concentration over time, CBV was considerably underestimated, with CBV of 1.33 to 2.97 mL/100 g. The uncorrected single-echo residue functions derived from Equation (1) dropped below zero to accommodate underestimations of postbolus CA concentrations (cf. Figure 2A). Large CBV underestimations and almost unchanged CBF values resulted in low MTT of 1.42 to 3.06 seconds in the presence of CA leakage.
If CA concentrations were estimated based on uncorrected, T1-independent multiecho data, the resulting CA concentrations resulted in comparable peak bolus values for different Ktrans. Cerebral blood flow varied by <0.6%. Postbolus CA concentrations, however, increased with increasing CA extravasation (cf. Figure 2D), as a result of T*2-related CA extravasation effects,8 leading to elevated CBV of 5.52 to 6.76 mL/100 g. The residue function derived from multiecho data was also elevated in the presence of CA extravasation (cf. Figure 2C). Uncorrected multi-echo data resulted in overestimations of MTT (5.63–6.86 seconds), due to CBV overestimations in combination with slightly altered CBF, confirming previous results.13
With our proposed method to separate intravascular from extravascular CA concentrations, the CA concentration time curves simulated for different degrees of CA leakage matched the situation without CA leakage better (cf. Figure 2F), with CBV between 4.52 and 4.61 mL/100 g. The intravascular postbolus CA concentrations obtained in the presence of CA extravasation resulted in slightly underestimated values when compared with the case of no leakage. This underestimation is due primarily to the assumption made previously that the intravascular residue function would decrease to zero for large t (cf. Appendix). However, as shown in Figure 2E, even for large t there is a small nonzero component to the residue function. Nevertheless, the calculated CBV values were more accurately estimated compared with both single-echo and uncorrected multiecho data, with a maximum deviation of 9.6% from nominal CBV. For the same reasons, MTT was slightly underestimated, with MTT ranging from 4.58 to 4.70 seconds. Cerebral blood flow estimates were equivalent to those determined using uncorrected multiecho perfusion data processing; the proposed model assumes no CA extravasation for the duration of the average capillary transit time, thus the peak of the residue function and therefore CBF estimates were unaffected by our correction method.
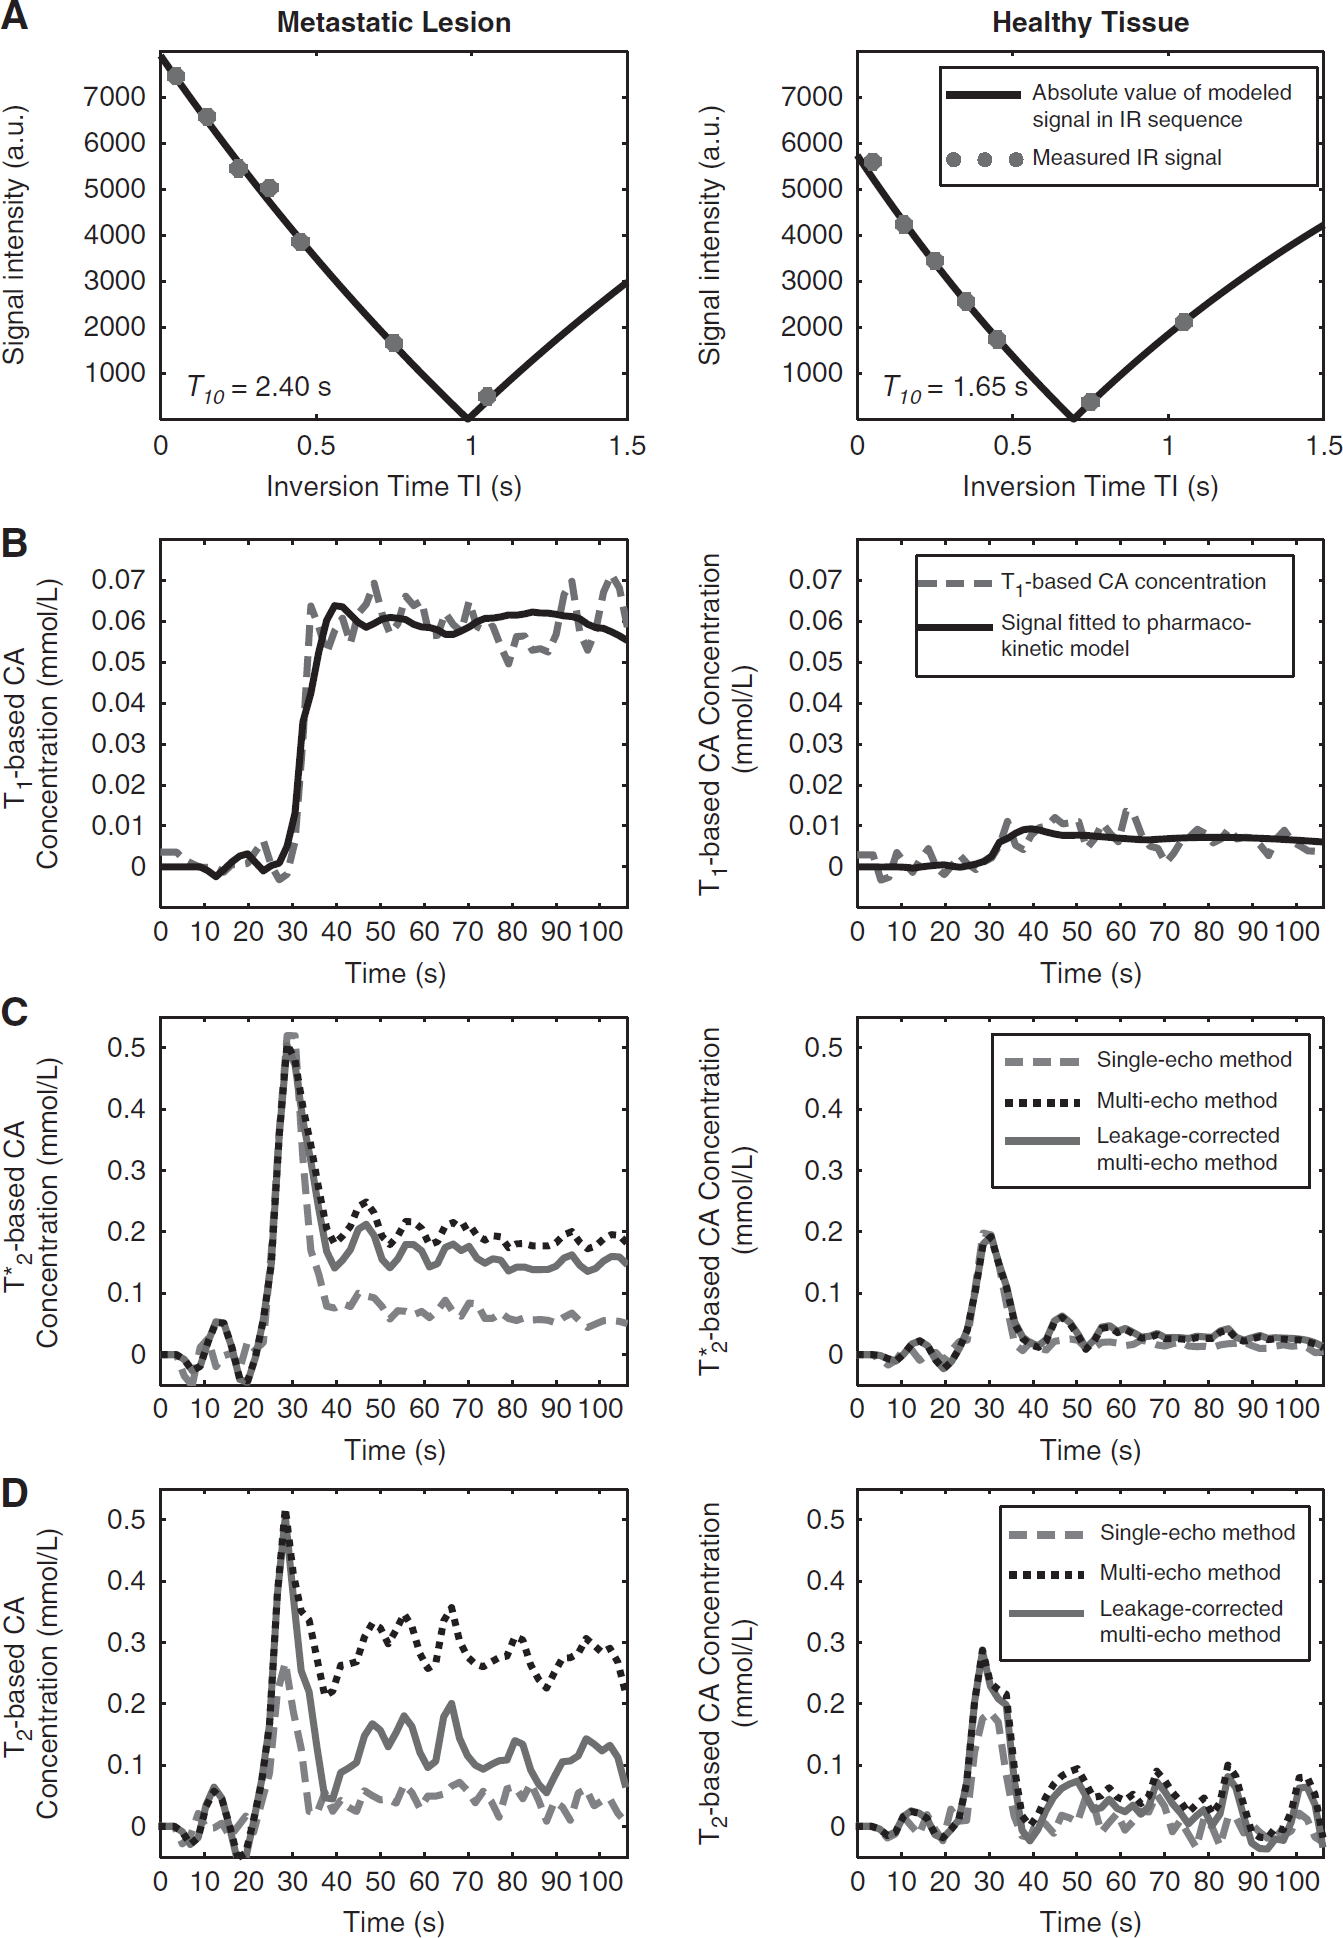
Figure 3 illustrates a patient suffering from metastatic breast cancer (cf. Table 1, patient no. 2). The signal behavior using the presented method is shown in two separate ROIs, each encompassing a volume of 40.8 × 10⁻³ mL (1 voxel). The first ROI was placed in the metastasis located within the right temporal lobe; the second ROI was located within normal brain tissue on the contralateral hemisphere. Figure 3A shows excellent fits of the signal model (cf. Equation (4)) to the measured inversion recovery data, resulting in T10 of 1.65 seconds in healthy tissue and prolonged T10 of 2.40 seconds in the metastasis. Both are within the range of previously reported values.34 The T1-based signal decay model fitted to the measured data (equations (3) and (5)) resulted in the dashed line in Figure 3B; the fits of the pharmacokinetic model (Equation (6)) to the data are shown in red (R.M.S. errors: 6.2 × 10⁻³ mmol/L in tumor, 2.6 × 10⁻³ mmol/L in healthy tissue). In case of the metastasis, a large increase in postbolus T1-based CA concentration resulted (+59.9 × 10⁻³ ± 5.5 × 10⁻³ mmol/L), whereas the concentration time course in healthy tissue remained near baseline (+7.3 × 10⁻³ ± 2.9 × 10⁻³ mmol/L), accounting for residual CA in the blood stream. Ktrans and ve in the metastasis (healthy tissue) were 0.112 per minute (0.019 per minute) and 3.8% (0.4%), respectively. However, in the absence of CA leakage into the EES, ve cannot be accurately determined. In the metastasis, postbolus CA concentrations derived from T2*-based GE data after application of Equation (9) (Figure 3C, solid line) were reduced when compared with uncorrected multiecho GE data (dotted line) and increased when compared with single-echo GE data (dashed line).
Signal behavior in two regions of interest (ROIs) in patient no. 2, a 45-year-old female with breast cancer metastases within the brain. Data derived from a metastatic lesion are shown on the left, and healthy tissue data are shown on the right. (A) T1 decay measured with an inversion recovery sequence to determine T10. (B) Pharmacokinetic model (solid) fitted to T1-based contrast agent (CA) concentrations (dashed). Note that postbolus CA concentrations show large differences between the metastatic lesion and healthy tissue. Small residual postbolus CA concentrations in healthy tissue are due to the presence of residual CA within the intravascular space. (C) Pharmacokinetic model fitted to T*2-based (GE) CA concentrations using uncorrected single-echo data (dashed), uncorrected multiecho data (dotted), and leakage-corrected multiecho data (solid). (D) Pharmacokinetic model fitted to T2-based (SE) CA concentrations using uncorrected single-echo, uncorrected multiecho, and leakage-corrected multiecho data. Within the metastatic lesion, leakage-corrected multiecho data resulted in reduced T2- and T*2-based postbolus CA concentrations compared with uncorrected multiecho data and increased postbolus CA concentrations compared with uncorrected single-echo data.
The corresponding CBV derived from the integration of the CA concentration curves resulted in 5.26 mL/100 g for leakage-corrected multiecho GE data, as opposed to 6.19 mL/100 g for uncorrected multiecho GE data and 3.58 mL/100 g for uncorrected single-echo GE data. In contrast, in healthy tissue the signal time courses and resulting CBV of single-echo, multiecho, and leakage-corrected multiecho GE data were almost identical, with CBV values of 1.03 mL/100 g, 1.19 mL/100 g, and 1.24 mL/100 g, respectively. In the selected ROIs, T2-based SE data (cf. Figure 3D) revealed signal characteristics similar to GE data, with nearly identical CBV values in healthy tissue, but considerably different values within the metastasis.
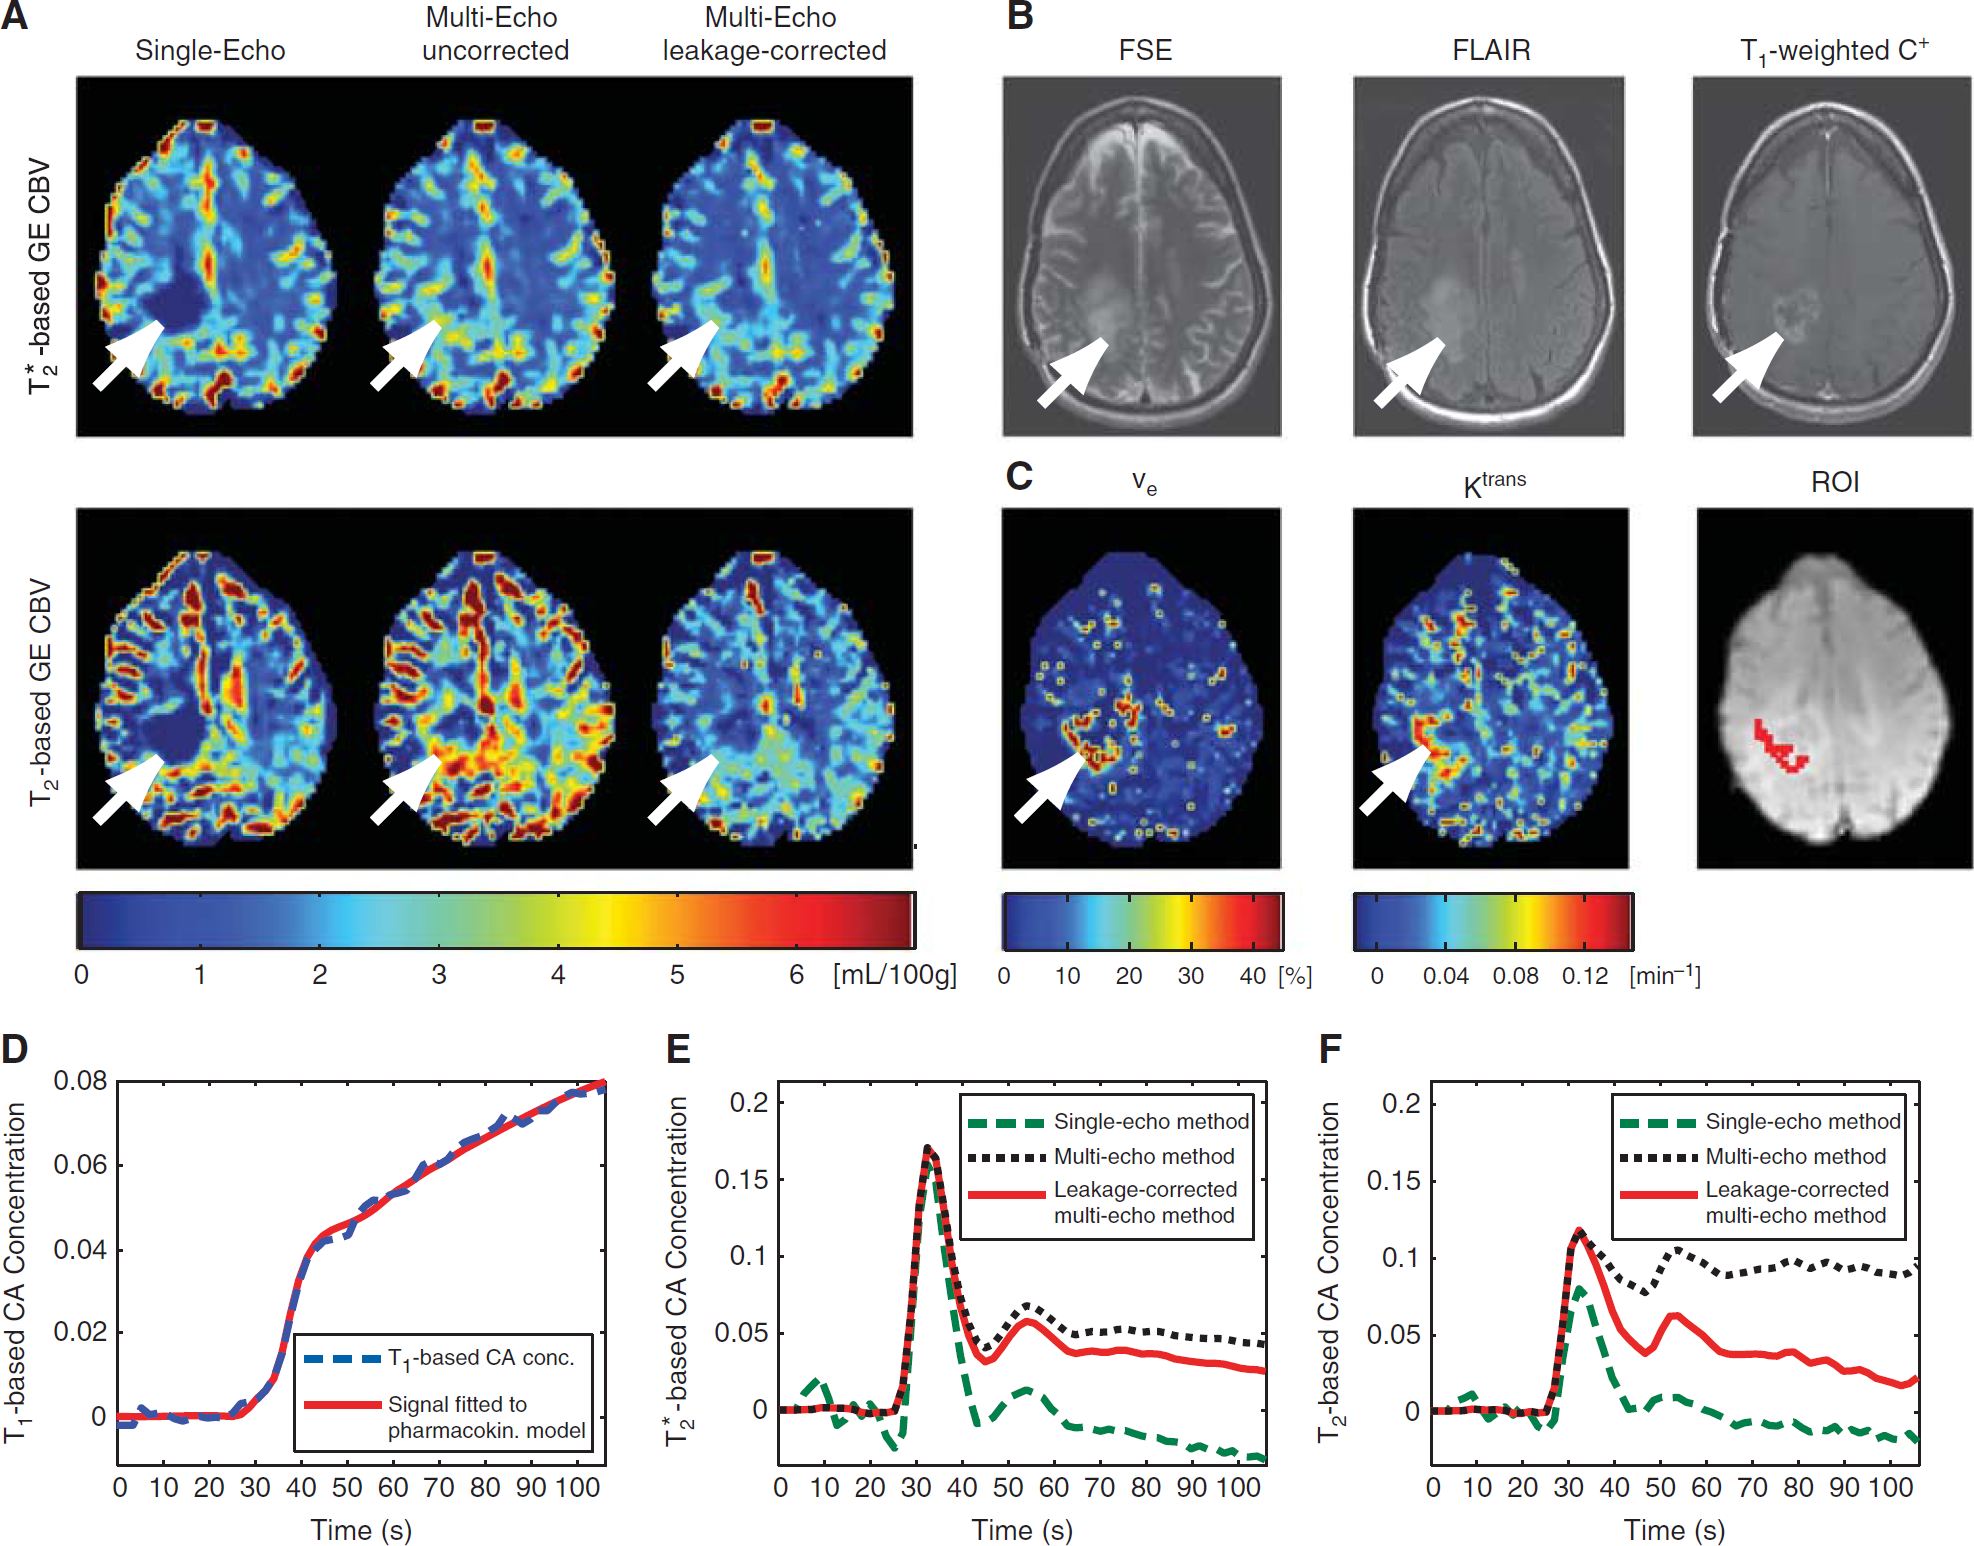
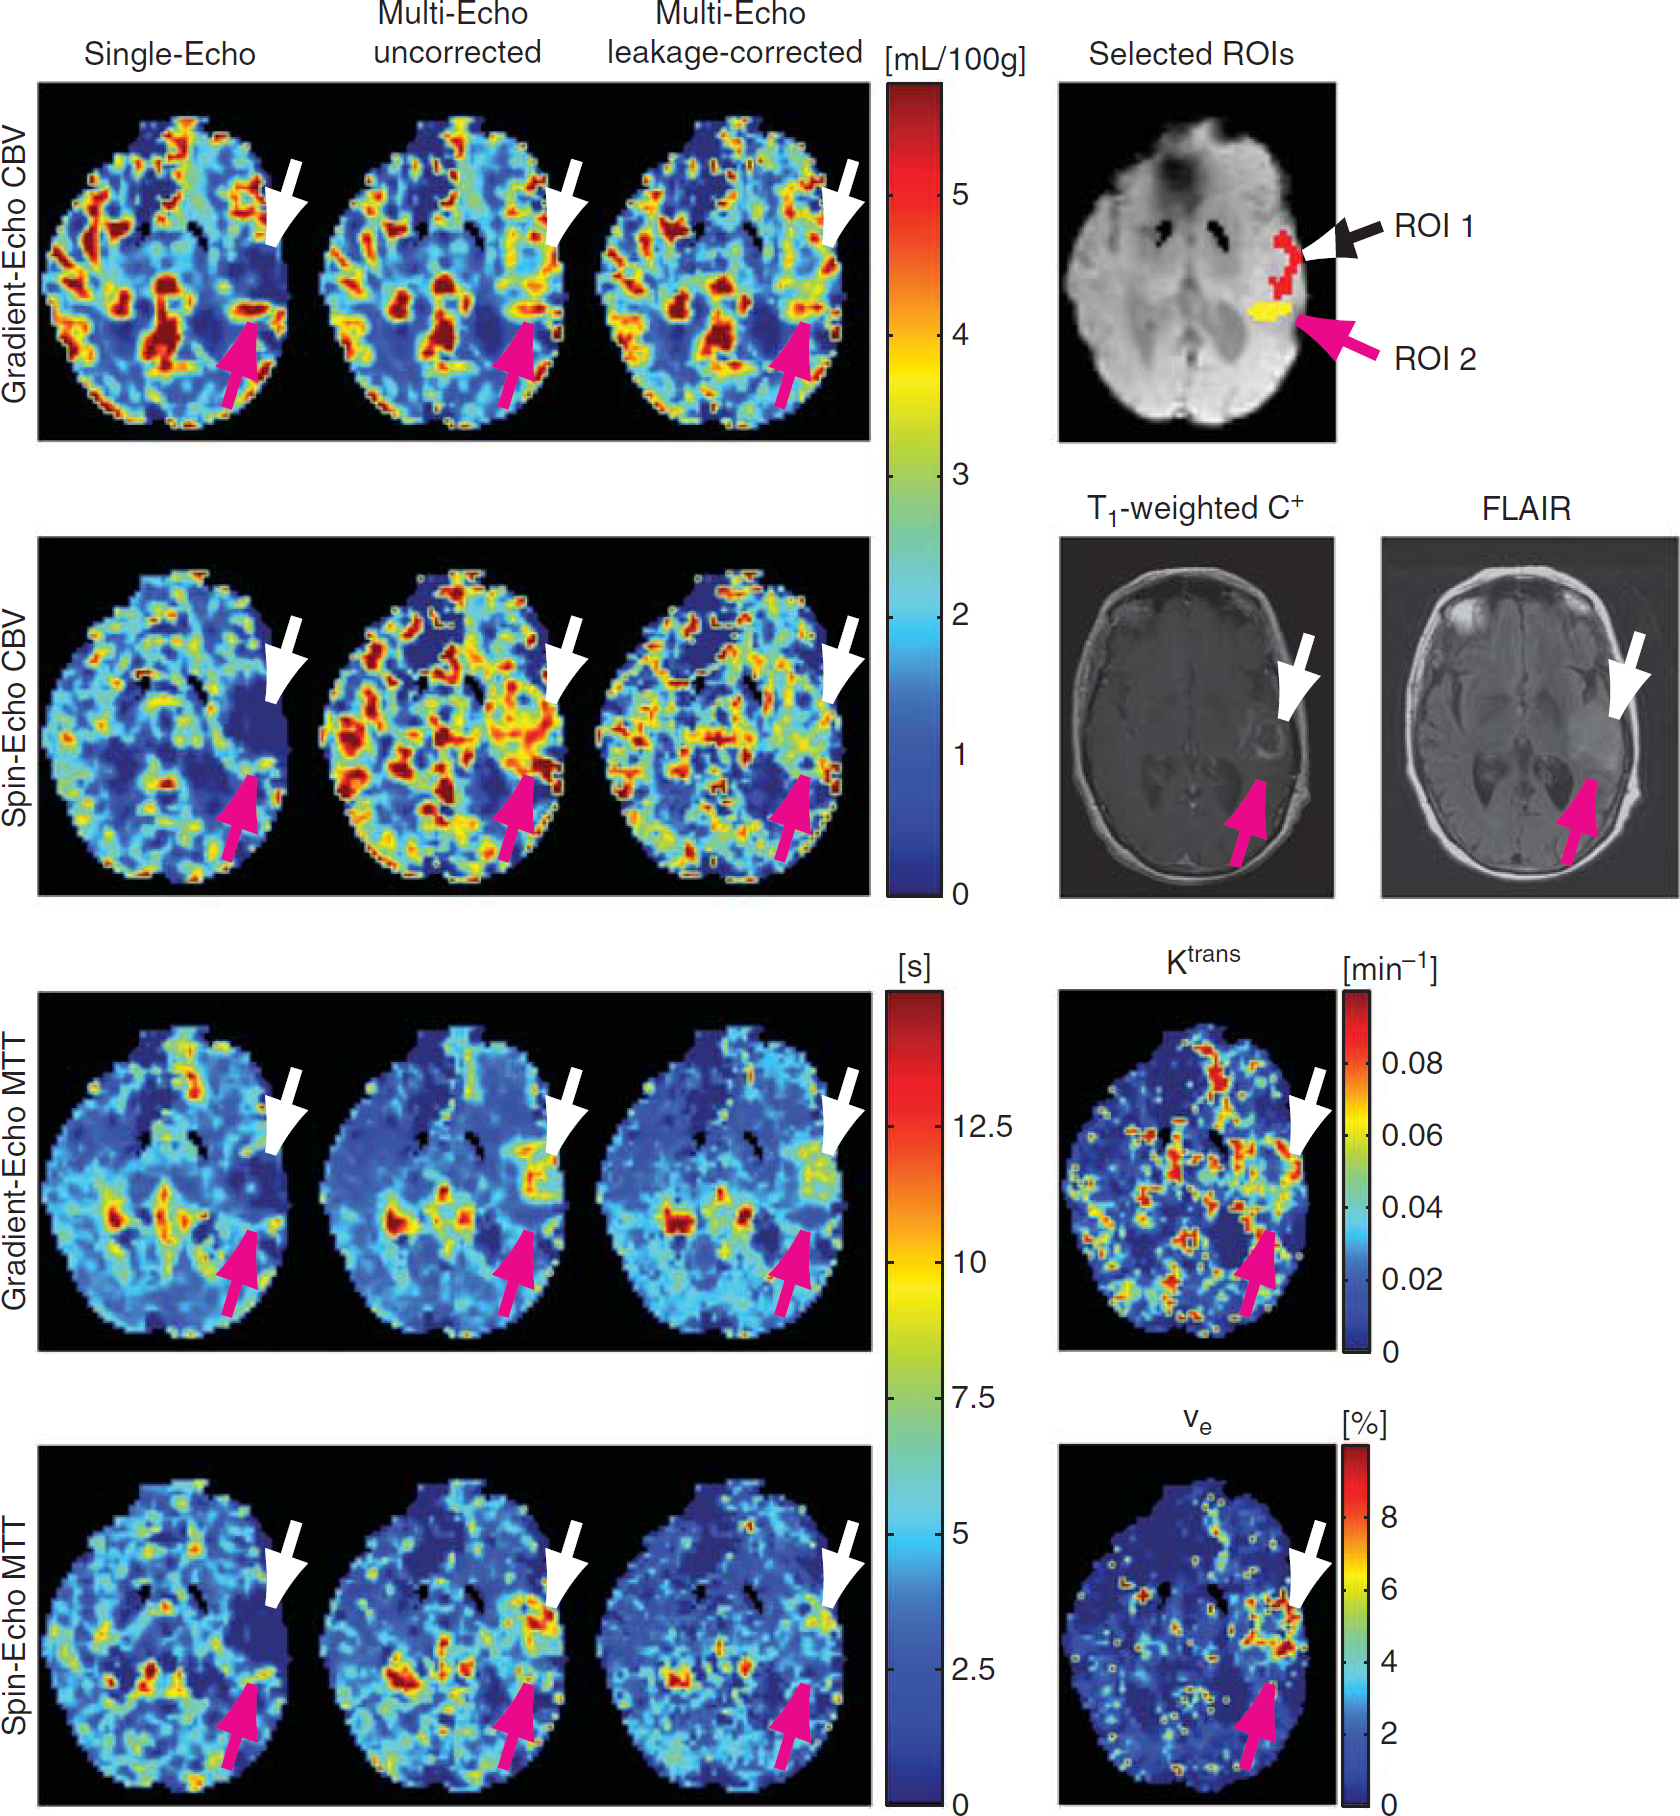
Perfusion and permeability data of a 55-year-old female (patient no. 10) with histologically confirmed glioblastoma multiforme are shown in Figure 4. The tumor was located in the right temporal and parietal lobes, with the data presented in Figure 4 showing a representative slice encompassing a superior section of the tumor. Treatment included subtotal surgical resection, followed by concurrent radiation therapy and chemotherapy with temozolomide, which was then followed by antiangiogenic treatment with bevacizumab combined with chemotherapy with lomustine. In the presented MRI examination, T2-weighted fast spin-echo (FSE) and fluid attenuated inversion-recovery (FLAIR) signals were elevated in the previously treated tumor bed, and T1-weighted postcontrast images showed significant CA enhancement. An ROI with a volume of 0.86 mL (21 voxels) was selected in the area of enhanced CA accumulation (white arrows, area shown in red in Figure 4C). Within the ROI, the SAGE perfusion data showed a steady increase in T1-based CA concentration following CA administration (cf. Figure 4D), as well as large vascular permeability and EES volume fraction (Ktrans = 0.131 ± 0.032 per minute, ve = 46.7% ± 22.9%), which indicates substantial CA leakage. The signal behavior of T2- and T*2-based CA concentrations (cf. Figures 4E and F) was in good agreement with the simulations shown in Figure 2. Specifically:
Patient no. 10 with biopsy-proven glioblastoma multiforme (white arrows). Uncorrected single-echo data (A, left column) showed decreased cerebral blood volume (CBV), which might be interpreted as no evidence to suggest tumor recurrence. However, a combined analysis of (A, right column) elevated CBV seen on leakage-corrected multiecho images, (C) increased vascular permeability parameters (Ktrans and ve), and (B) increased signals on fast spin-echo (FSE), fluid attenuated inversion-recovery (FLAIR), and T1-weighted postcontrast (C+) images indicate tumor progression. Moreover, uncorrected multiecho data (A, center column) resulted in even higher CBV. The selected region of interest (ROI) within tumor tissue is shown in (C), overlaid onto raw echo-planar imaging (EPI) data. T1-based contrast agent (CA) concentration time curve (blue dashed) and fit of the pharmacokinetic model to the data (red solid) are shown in (D), with a substantial postbolus CA concentration increase due to blood–brain barrier leakage. Moreover, T*2-based (E) and T2-based (F) CA concentrations using uncorrected single-echo data (green dashed), uncorrected multiecho data (black dotted), and leakage-corrected multiecho data (red solid) are shown. Low postbolus CA concentrations were observed with uncorrected single-echo data, while uncorrected multiecho data resulted in higher postbolus CA concentrations. In case of SE-based data, CA leakage had a stronger relative effect on total CA concentration in comparison to GE data, resulting in substantial overestimation of CBV derived from SE-based uncorrected multiecho data (cf. A).
Single-echo GE CBV (0.44 ± 1.74 mL/100 g) and SE CBV (0.26 ± 2.23 mL/100 g) were much lower within the ROI in comparison to the surrounding areas. Moreover, T1-shortening effects resulted in reduced single-echo postbolus CA concentrations when compared with multiecho data (cf. Figures 4E and F, green dashed). Towards to the end of the acquisition, GE-derived single-echo CA concentrations became negative, a physiologically impossible finding that can be explained by T1-shortening effects (cf. data simulations shown in Figure 2B).
Uncorrected multiecho data analysis produced larger postbolus CA concentrations in comparison with single-echo data, with the consequence that multiecho GE CBV was 3.51 ± 0.83 mL/100 g and multiecho SE CBV was 5.17 ± 1.60 mL/100 g. The latter was particularly high in this case (cf. Figure 4F, black dotted) as the result of stronger relative effects of CA leakage on total CA concentration in comparison with GE data, resulting in a visible increase in CBV relative to the surrounding tissue.
Leakage-corrected multiecho data resulted in GE CBV of 2.87 ± 0.55 mL/100 g and SE CBV of 2.53 ± 0.81 mL/100 g, with higher postbolus CA concentrations than single-echo data and lower postbolus CA concentrations than uncorrected multiecho data (cf. Figures 4E and F, red solid), showing a signal behavior that reflects the data simulations (cf. Figure 2). Leakagecorrected CBV within tumor tissue was slightly higher than CBV within surrounding tissue.
Within the region of FSE-/FLAIR-positive signals, areas of CA extravasation are seen on T1-weighted postcontrast images, which are overlapping with increased vascular permeability (Ktrans), EES volume fraction (ve), and elevated CBV using leakage-corrected multiecho perfusion data (cf. Figure 4, white arrows). In this patient, all these findings together deliver an argument in favor of tumor progression. In contrast, if the assessment was based on single-echo perfusion data, the images might be interpreted as ‘no evidence to suggest residual or recurrent tumor’, given the absence of elevated CBV.
Figure 5 shows perfusion and permeability maps of patient no. 7, a 67-year-old female with pathology confirmed glioblastoma multiforme in the left frontal and temporal lobes, imaged after administration of chemoradiation therapy with temozolomide and 60 Gy applied to the tumor bed, followed by antiangiogenic treatment with bevacizumab. The MRI measurements shown in this figure are part of a follow-up examination performed to assess potential tumor progression. Fluid attenuated inversion-recovery and T1-weighted postcontrast images showed vasogenic edema around a rim-enhancing, centrally necrotic tumor (cf. Figure 5). An initial interpretation based on FLAIR and T1-weighted postcontrast images as well as single-echo perfusion data might have suggested posttreatment changes and tumor progression as potential differential diagnoses, the latter supported by the apparently elevated single-echo data-derived CBV posterior to the area of rim enhancement (purple arrows). With a single SAGE PWI acquisition, we were able to assess potential tumor progression based on the combination of single-echo, multiecho, and leakage-corrected multiecho GE and SE perfusion data in addition to permeability maps showing Ktrans and ve.
Patient no. 7, a 67-year-old female with history of pathology-confirmed glioblastoma multiforme, status post chemoradiation therapy and combined chemo- and antiangiogenic therapy. White arrows are pointing at a region of suggested tumor progression (area shown in red, overlaid onto raw echo-planar imaging (EPI) data), and purple arrows are pointing to a region of elevated blood volume in proximity to the tumor bed (area shown in yellow), which—after careful examination of the presented data, in particular in the absence of increased cerebral blood volume (CBV) on leakage-corrected SE data—is more consistent with a cortical vessel rather than tumor infiltration.
Within a selected ROI (ROI 1, volume = 1.10 mL, 27 voxels, area shown in red) situated at the CA enhancing tumor rim (cf. Figure 5, white arrows), single-echo GE CBV was very low (0.50 ± 1.60 mL/100 g) in comparison to single-echo GE CBV within the surrounding tissue. GE-based multiecho CBV (4.03 ± 0.68 mL/100 g) and leakage-corrected multiecho CBV (3.89 ± 0.94 mL/100 g) resulted in considerably larger blood volume estimates. In case of single-echo SE data, CBV within ROI 1 resulted in −2.65 ± 1.53 mL/100 g, a physiologically impossible negative blood volume caused by negative postbolus CA concentrations. SE-based uncorrected multiecho data, on the other hand, resulted in CBV of 4.02 ± 0.97 mL/100 g and a slightly lower CBV of 2.78 ± 0.86 mL/100 g with added leakage correction. The reduced CBV obtained from SE-based leakage-corrected multiecho data indicates a slightly smaller microvascular blood volume in comparison to the blood volume derived from leakage-corrected GE-data that are more sensitive to larger vessels. ROI 1 experienced considerable CA extravasation (Ktrans = 0.072 ± 0.024 per minute, ve = 8.9% ± 4.1%), supported by a signal increase seen on T1-weighted postcontrast images.
Leakage-corrected GE-based MTT (7.20 ± 1.13 seconds) and SE-based MTT (6.04 ± 2.34 seconds) were elevated in comparison to the surrounding tissue, which indicates the presence of a complicated vascular network within ROI 1. Based on the combined analysis of all observations, the presented data suggest tumor infiltration into ROI 1. This conclusion could not be drawn from uncorrected single-echo perfusion data showing both decreased CBV and MTT when compared with the surrounding tissue. In fact, without CA extravasation correction, single-echo perfusion data would suggest that the patient responded well to the administered therapy.
In contrast, the purple arrows highlight an ROI (ROI 2, volume = 0.730 mL, 18 voxels, area shown in yellow) with presumably elevated CBV using single-echo GE data (5.19 ± 1.04 mL/100 g) relative to the surrounding tissue. Elevated CBV, although to a lesser extent, was also seen on uncorrected (4.22 ± 0.76 mL/100 g) and leakage-corrected (4.18 ± 0.66 mL/100 g) multiecho GE data, providing evidence for the presence of an increased macrovascular volume. However, leakage-corrected multiecho SE data, which is more sensitive to the microvasculature, resulted in low CBV values of 1.94 ± 1.36 mL/100 g. ROI 2 did not experience significant CA leakage (Ktrans = 0.025 ± 0.019 per minute), and FLAIR and T1-weighted postcontrast images did not show increased signals. In addition, MTT within ROI 2 was shorter than in the surrounding tissue. Therefore, the data suggest that ROI 2 is more consistent with signal alterations caused by a cortical vessel rather than tumor infiltration, justified by the combination of absent CA extravasation, high GE data-derived CBV showing vascular blooming, and low SE data-derived CBV showing a reduced presence of microvasculature.
DISCUSSION
In this study, we presented a method for combined perfusion and permeability measurements with the potential to improve patient diagnosis through additional data not readily available through conventional brain tumor MRI acquisitions. In this context, patient no. 7 is a good example for potential misinterpretation based on incorrectly processed perfusion data. Although separate perfusion and permeability measurements within the same examination are possible in principle, there is an added burden of multiple CA injections necessary for standard perfusion (DSC PWI) and permeability (DCE MRI) acquisitions. Moreover, potential complications associated with Gd-based CA regarding the development of nephrogenic systemic fibrosis favors a reduced amount of CA administration.
We were able to simultaneously measure GE- and SE-based perfusion data together with vascular permeability parameters through the time-resolved acquisition of SAGE EPI data. Pharmacokinetic modeling of SAGE PWI data allowed the correction of GE- and SE-based CBV and MTT for T1-, T2-, and T*2-related CA extravasation effects. Cerebral blood flow, on the other hand, was not affected by CA leakage correction when computed with the proposed model (cf. data simulations shown in Table 2). As exemplified in the case of patient no. 7 (cf. Figure 5), initial data interpretation based on single-echo perfusion data suffered from limited available information, making it difficult to distinguish tumor progression from posttreatment changes. In contrast, the simultaneous availability of GE and SE perfusion data together with vascular permeability parameters might facilitate better distinction between healthy tissue, growing brain tumors, and tumor treatment effects.
The results of our simulations showed previously observed underestimations of postbolus CA concentrations2,8 and therefore artificially low CBV using single-echo data, caused by T1- shortening effects associated with extravasated Gd. In contrast, additional T2- and T*2-related CA extravasation effects led to overestimated postbolus CA concentrations and substantial CBV overestimations using uncorrected multiecho perfusion data, as shown in Figure 2. Thus, multiecho acquisitions alone insufficiently corrected for CA extravasation effects. Instead, pharmacokinetic modeling was necessary to correct for T2- and T*2-related CA extravasation effects. The simulated data in this study showed that our approach for leakage correction resulted in reduced CBV estimation errors (cf. Table 2). The remaining errors were caused by our assumption that the intravascular residue function R(t) decays to zero for t larger than twice the MTT. This assumption was made to decouple intravascular from extravascular CA contributions. It resulted in underestimations of intravascular CA concentrations using leakage-corrected multi-echo data. Compared with uncorrected data, however, these errors were small.
A relatively simple approach to correct for CA leakage effects, which could be used as an alternative to the presented calculations using pharmacokinetic modeling, is to limit the evaluation of the MRI signal to the first pass of the CA through tissue, facilitated by a gamma-variate fit to the acquired data.35,36 Hereby, the effect of CA leakage on the CA concentration time curve would be reduced, resulting in improved CBV and MTT estimates using uncorrected single-echo and multiecho data. However, CA leakage occurring during the first pass of the CA through tissue would be ignored with this approach,8 still resulting in the underestimation of CA concentrations using single-echo data (cf. Figure 2B) and overestimated CA concentrations using multiecho data (cf. Figure 2D). Moreover, the quality of gamma-variate fits depends on the signal-to-noise ratios of the MRI acquisitions, with larger fitting errors occurring in data suffering from lower signal-to-noise ratios,37,38 which is a particular issue with spin-echo data acquired using parallel imaging techniques, such as with those acquired using the SAGE EPI pulse sequence. Finally, the use of first-pass analysis techniques precludes the estimation of the permeability parameters Ktrans and ve, thus eliminating diagnostically valuable information.
A potential limitation to the proposed modeling approach is the selection of an incorrect arterial input function CAIF. If the values of CAIF returned to baseline or became negative after the first bolus passage, that is, in the absence of postbolus nonzero steady-state CA concentrations caused by CA recirculation, Ktrans could become overestimated, as the first term in Equation (6) would be unable to reflect remaining postbolus tissue CA concentrations in the absence of CA extravasation. Thus, careful assessment of the shape of the arterial input function was essential in this study, and candidate voxels with postbolus CA concentrations at or below baseline were excluded, an effect that could originate from substantial flow artifacts. Another limiting factor is potential patient motion, causing sudden changes in postbolus CA concentration even if retrospective motion correction was used, that is, as the result of uncorrected spin history effects. In the presence of through-plane motion, S0(t) derived from Equation (3) would change as a result of altered spin history, thus leading to errors in the estimation of CR1T(t). Finally, a number of voxels had to be excluded from data processing using our method due to substantial noise in the baseline signals, which resulted in even larger fluctuations in CR1T(t) and thus errors in the estimation of Ktrans and ve. These voxels were excluded from our analysis.
Like any quantitative DCE MRI method, the proposed method requires the determination of a prebolus T1 map. In the current implementation, these measurements were accomplished with a preceding inversion recovery EPI acquisition. For an improved workflow, this acquisition could be incorporated into the SAGE EPI sequence as part of the prescan sequence. Alternatively, T1 mapping could be carried out using a multiple flip angle method; however, B1 inhomogeneities need to be corrected for, which usually requires an additional MRI acquisition.
While other studies were able to correct single-echo DSC PWI data for CA extravasation effects and supply some measure of vascular permeability,1–3,14,15 these studies did not estimate the parameter Ktrans. Instead, other parameters termed K21–3,15 or Ka14 were estimated, whose exact relationships to Ktrans remain unknown. Moreover, most of these approaches relied on models derived from Patlak et al,39 which prevented the estimation of ve. In the Patlak model, unidirectional CA flow from the IPS to the EES is assumed for the duration of the perfusion acquisition, which eliminates ve from the equation. The commonly used modeling approach suggested by Weisskoff et al1,2 did not take into account tissue-specific changes in MTT. In this study, however, we observed considerable changes in MTT within tumor tissue (cf. Figure 5) that are not considered in Weisskoff et al1 and Boxerman et al.2
In principle, the model presented in this study could be applied to multiecho GE experiments, such as in refs. 6, 7, 40, to obtain estimates of Ktrans and ve. Quarles et al16 used a dual-echo GE acquisition for the purpose of extracting Ktrans and ve, based on a simpler model than the one described here. They found a good correlation between DSC- and DCE-derived Ktrans and ve in rat brain tumor models. However, the information revealed by SE perfusion measurements is potentially more meaningful than GE perfusion data, due to its higher sensitivity to the microvasculature20–23 and its decreased sensitivity to confounding vascular signal changes arising from cortical vessels (see patient no. 7). SE-based perfusion data provide complimentary information to GE data, and the combination of GE- and SE-data facilitate the determination of the vessel-size index,41,42 a potentially important biomarker for the assessment of tumor angiogenesis.21,43 This is of particular relevance, as much of perfusion-based tumor imaging today relies on the identification of surrogate markers for angiogenic activity. Cerebral blood volume had historically been a dominant focus of monitoring angiogenesis, based on the relationship between microvascular density and tumor behavior in histological studies. However, CBV represents only one facet of angiogenesis. In addition, the marked increase in endothelial permeability associated with vascular endothelial growth factor activity raises the possibility of directly quantifying the permeability of tumor vessel endothelia using relaxivity-based MRI techniques that rely on CA distribution models, allowing for the derivation of several kinetic parameters, including Ktrans and ve. The SAGE MRI technique is unique in that, by utilizing a combined multiecho SAGE DSC PWI technique with correction for CA extravasation effects and simultaneous determination of the permeability parameters Ktrans and ve, it facilitates the evaluation of all of the abovementioned aspects of angiogenesis by virtue of a single MRI acquisition.
CONCLUSIONS
T1-shortening effects caused by CA extravasation compromise single-echo PWI methods. Although T1-shortening effects can be reduced or eliminated by leakage-correction approaches or multiecho data acquisitions, additional T2- and T*2-effects related to CA leakage persist. To assess the effects of CA extravasation on T2 and T*2, pharmacokinetic modeling of CA distribution and a model accounting for different susceptibility effects of CA residing within multiple tissue compartments were used, allowing simultaneous determination of perfusion and permeability parameters. The combined acquisition of T2- and T*2-based perfusion data provides complementary information, with SE data being more sensitive to the microvasculature, which may reveal additional information regarding tumor vasculature. In this study, we presented a method to simultaneously estimate CA leakage-corrected perfusion and permeability parameters from combined multiecho GE and SE MRI data. Our method does not require multiple CA injections, thus it facilitates faster and safer brain tumor assessment. The additional information supplied by this method has the potential to improve patient diagnosis and evaluation of treatment response.
DISCLOSURE/CONFLICT OF INTEREST
The authors declare no conflict of interest.
Footnotes
ACKNOWLEDGEMENTS
The authors are grateful to Alex de Crespigny and Murat Aksoy for helpful comments and suggestions, and Abdullah Feroze for help with the patient data collection.
APPENDIX
Estimation of R2, R*2, and S0
For each t, the following system of equations can be applied to the measured SAGE EPI signals S(t,TE) to estimate the transverse relaxation parameters R2(t) = 1/T2(t) and R*2(t) = 1/T*2(t), as well as the initial signal value S0(t):
To compensate for slice profile imperfections, a factor δ (previously introduced in Schmiedeskamp et al44) served as an additional parameter. Equation (3) can be solved using leastsquares (LSQ) parameter estimation.
Estimation of T1-Based CA Concentrations Using Spin- and Gradient-Echo EPI
To relate T1-based signal changes to CA concentrations and hence to facilitate CA extravasation measurements using the perfusion data acquired with SAGE EPI, an additional prebolus T1 map was acquired based on inversion recovery of the longitudinal magnetization. For prebolus T1-measurements, the same EPI-based pulse sequence used for DSC PWI was employed to guarantee an equal amount of image distortions compared with the actual perfusion data. An adiabatic inversion pulse was added prior to the excitation pulse used for perfusion measurements. Inversion times (TI) were automatically adjusted with each sequence repetition, with inversion times of 50, 150, 250, 350, 450, 750, and 1050 milliseconds. TR was set to 10 seconds. Voxelwise T1 relaxation values (T10) were determined from
Mz(TI)=M0(1−(1−cos(∂))exp(−TI/T10)),
using nonlinear LSQ parameter estimation. Here, ∂ represents the flip angle of the inversion pulse, M0 the initial magnetization, and Mz the measured magnetization along z.
CA concentrations derived from T1-shortening effects of Gd, CR1T(t), were calculated by solving Equation (5) for CR1T(t).
The longitudinal relaxivity r1 of gadobenate dimeglumine at 3 T was determined in Pintaske et al32 for human blood plasma at 37°C, with r1 = 6.3 L per mmol per second. This value was used here for tissue, under the assumption of fast water exchange between tissue compartments.33T10 was derived from Equation (4). S0(t) was determined in Equation (3), and S0,baseline is the prebolus baseline average of S0(t). For increased temporal stability of the nonlinear LSQ algorithms, S(t,TE) was smoothed using locally weighted regression (LOESS,45 span = 7) for the purpose of determining CR1T(t).
Pharmacokinetic Modeling of T1-Based CA Concentrations
Vascular permeability parameters were extracted from T1-based CA concentrations based on SAGE EPI data using the following pharmacokinetic model:
Here, Tc represents the transit time of CA through the capillary network. CAIF(t) is the measured arterial input function derived from the DSC PWI data without correction for CA extravasation, which is justified by the fact that CA within a feeding artery does not leak into the EES. R‘(t) is a model-based intravascular tissue residue function approximated by R’(t) = exp(–t/Tc). Equation (6) was solved for Tc, Ktrans, ve, and F using a nonlinear LSQ algorithm. Equation (6) was based on the adiabatic approximation to the tissue homogeneity model17 and slightly modified to include a decaying tissue residue function R′(t), an adjustment suggested by Bjørnerud et al14 to better characterize single-echo GE-based DSC PWI data.
Determination of Transverse Relaxation Effects of CA
For perfusion data processing based on CA-induced T2- and T*2-shortening effects, total CA concentration was divided into multiple tissue compartments to formulate an appropriate model that accounts for the susceptibility effects of CA residing within the different compartments. These compartments include the IPS, the EES, and the extravascular–intracellular space (Figure 1). In the presence of CA leakage, some tracer material leaves the intravascular space, offsetting the susceptibility gradients created by intravascular CA. To relate measured changes in R2 (ΔR2,m) and R*2 (ΔR*2;m) to CA concentrations within the different compartments of brain tissue, a simplified version of the theoretical framework to model perfusion MRI data in the presence of CA leakage was used, as suggested by Quarles et al,9 rewritten as
Here, the parameters vp and ve represent the volume fractions of IPS and EES, respectively. Cp and Ce denote the corresponding CA concentrations. r(*)2;p and r(*)2;e are transverse relaxivities of CA located within IPS and EES. k is a scaling factor. Due to the impermeability of cells to Gd-based CA, extravascular–intracellular CA concentrations were assumed to be equal to zero. The proposed model differs from the one suggested in Quarles et al9 by assuming kvpve|Cp(t)–Ce(t)| to be small compared with r(*)2;pvpCp(t) and r(*)2;eveCe(t); thus we eliminated the former from Equation (7).
Pharmacokinetic modeling of T2- and T*2 -based CA concentrations The adiabatic approximation to the tissue homogeneity model,17 adjusted for DSC PWI,14 was used again, now to determine leakage-corrected R2- and R*2-based perfusion parameters.
The total CA concentration given by Equation (6) can be separated into distinct contributions emanating from IPS and EES, with
These separate contributions to the total CA concentration were inserted into the model given by Equation (7), resulting in the following equation that relates the changes in R2 and R*2 (both were estimated in Equation (3)) to the convolution of an adjusted vascular transfer function H(t) with the arterial CA concentration CAIF(t):
ΔR2,m(*)(t)=H(t)⊗CAIF(T)
Here, the adjusted vascular transfer function H(t) is given by
H(t) can be derived from CAIF(t) and changes in R2 and R*2 using deconvolution of Equation (9) via singular-value decomposition, similar to the approach used by Østergaard et al.25 The transverse relaxivities r2,p = 20.4 L per mmol per second (ref. 23) and r(*)2;p = 87.0 L per mmol per second (ref. 29) were determined elsewhere. It is assumed here that the residue function R(t) becomes zero for large t (cf. ref. 14). We estimated r2,e and r(*)2;e from H(t) with t ≥ 2Tc using linear LSQ inversion of Equation (10), while Ktrans, ve, and Tc were determined using Equation (6). With all other parameters known, the intravascular tissue residue function R(t) and an estimate of F derived from T2- and T*2-based CA concentrations could then be calculated based on Equation (10).
References
1.
WeisskoffRMBoxermanJLSorensenAGKulkeSFCampbellTARosenBR. Simultaneous blood volume and permeability mapping using a single Gd-based contrast injection. In: Proceedings of the 2nd Annual Meeting of SMRM, San Francisco, CA, USA, 1994, p 279.
2.
BoxermanJLSchmaindaKMWeisskoffRM. Relative cerebral blood volume maps corrected for contrast agent extravasation significantly correlate with glioma tumor grade, whereas uncorrected maps do not. AJNR Am J Neuroradiol2006; 27: 859–867.
3.
QuarlesCCWardBDSchmaindaKM. Improving the reliability of obtaining tumor hemodynamic parameters in the presence of contrast agent extravasation. Magn Reson Med2005; 53: 1307–1316.
PaulsonESSchmaindaKM. Comparison of dynamic susceptibility-weighted contrast-enhanced MR methods: recommendations for measuring relative cerebral blood volume in brain tumors. Radiology2008; 249: 601–613.
9.
QuarlesCCGochbergDFGoreJCYankeelovTE. A theoretical framework to model DSC-MRI data acquired in the presence of contrast agent extravasation. Phys Med Biol2009; 54: 5749–5766.
10.
StewartGN. Researches on the circulation time and on the influences which affect it. J Physiol1897; 22: 159–183.
11.
MeierPZierlerKL. On the theory of the indicator-dilution method for measurement of blood flow and volume. J Appl Physiol1954; 6: 731–744.
StrakaMSchmiedeskampHZaharchukGAndreJBOlivotJ-MFischbeinNJ. Consequences of multi-echo fits in perfusion MRI for the determination of MTT in presence of T1-effects. In: Proceeedings of the 19th Annual Meeting of the ISMRM. Montreal: Canada, 2011, p 462.
14.
BjørnerudASorensenAGMouridsenKEmblemKE. T1- and T2*-dominant extravasation correction in DSC-MRI: part I-theoretical considerations and implications for assessment of tumor hemodynamic properties. J Cereb Blood Flow Metab2011; 31: 2041–2053.
15.
LiuHLWuYYYangWSChenCFLimKEHsuYY. Is Weisskoff model valid for the correction of contrast agent extravasation with combined T1 and T2* effects in dynamic susceptibility contrast MRI?Med Phys2011; 38: 802–809.
16.
QuarlesCCGoreJCXuLYankeelovTE. Comparison of dual-echo DSC-MRI- and DCE-MRI-derived contrast agent kinetic parameters. Magn Reson Imaging2012; 30: 944–953.
17.
St LawrenceKSLeeTY. An adiabatic approximation to the tissue homogeneity model for water exchange in the brain: I. Theoretical derivation. J Cereb Blood Flow Metab1998; 18: 1365–1377.
18.
YankeelovTELuciJJLepageMLiRDebuskLLinPC. Quantitative pharmacokinetic analysis of DCE-MRI data without an arterial input function: a reference region model. Magn Reson Imaging2005; 23: 519–529.
19.
WeisskoffRMZuoCSBoxermanJLRosenBR. Microscopic susceptibility variation and transverse relaxation: theory and experiment. Magn Reson Med1994; 31: 601–610.
20.
BoxermanJLHambergLMRosenBRWeisskoffRM. MR contrast due to intravascular magnetic susceptibility perturbations. Magn Reson Med1995; 34: 555–566.
21.
DonahueKMKrouwerHGRandSDPathakAPMarszalkowskiCSCenskySC. Utility of simultaneously acquired gradient-echo and spin-echo cerebral blood volume and morphology maps in brain tumor patients. Magn Reson Med2000; 43: 845–853.
22.
SpeckOChangLDeSilvaNMErnstT. Perfusion MRI of the human brain with dynamic susceptibility contrast: gradient-echo versus spin-echo techniques. J Magn Reson Imaging2000; 12: 381–387.
OstergaardLWeisskoffRMCheslerDAGyldenstedCRosenBR. High resolution measurement of cerebral blood flow using intravascular tracer bolus passages. Part I: Mathematical approach and statistical analysis. Magn Reson Med1996; 36: 715–725.
26.
RemppKABrixGWenzFBeckerCRGuckelFLorenzWJ. Quantification of regional cerebral blood flow and volume with dynamic susceptibility contrast-enhanced MR imaging. Radiology1994; 193: 637–641.
van OschMJVonkenEJViergeverMAvan der GrondJBakkerCJ. Measuring the arterial input function with gradient echo sequences. Magn Reson Med2003; 49: 1067–1076.
29.
KjolbyBFOstergaardLKiselevVG. Theoretical model of intravascular paramagnetic tracers effect on tissue relaxation. Magn Reson Med2006; 56: 187–197.
30.
SykovaENicholsonC. Diffusion in brain extracellular space. Physiol Rev2008; 88: 1277–1340.
31.
DonaldsonSBWestCMDavidsonSECarringtonBMHutchisonGJonesAP. A comparison of tracer kinetic models for T1-weighted dynamic contrast-enhanced MRI: application in carcinoma of the cervix. Magn Reson Med2010; 63: 691–700.
32.
PintaskeJMartirosianPGrafHErbGLodemannKPClaussenCD. Relaxivity of Gadopentetate Dimeglumine (Magnevist), Gadobutrol (Gadovist), and Gadobenate Dimeglumine (MultiHance) in human blood plasma at 0.2, 1.5, and 3 Tesla. Invest Radiol2006; 41: 213–221.
33.
DonahueKMBursteinDManningWJGrayML. Studies of Gd-DTPA relaxivity and proton exchange rates in tissue. Magn Reson Med1994; 32: 66–76.
34.
SourbronSIngrischMSiefertAReiserMHerrmannK. Quantification of cerebral blood flow, cerebral blood volume, and blood-brain-barrier leakage with DCE-MRI. Magn Reson Med2009; 62: 205–217.
35.
ThompsonHKJrStarmerCFWhalenREMcIntoshHD. Indicator Transit Time Considered as a Gamma Variate. Circ Res1964; 14: 502–515.
36.
BahnMM. A single-step method for estimation of local cerebral blood volume from susceptibility contrast MRI images. Magn Reson Med1995; 33: 309–317.
37.
BoxermanJLRosenBRWeisskoffRM. Signal-to-noise analysis of cerebral blood volume maps from dynamic NMR imaging studies. J Magn Reson Imaging1997; 7: 528–537.
38.
BennerTHeilandSErbGForstingMSartorK. Accuracy of gamma-variate fits to concentration-time curves from dynamic susceptibility-contrast enhanced MRI: influence of time resolution, maximal signal drop and signal-to-noise. Magn Reson Imaging1997; 15: 307–317.
39.
PatlakCSBlasbergRGFenstermacherJD. Graphical evaluation of blood-to-brain transfer constants from multiple-time uptake data. J Cereb Blood Flow Metab1983; 3: 1–7.
SchmaindaKMRandSDJosephAMLundRWardBDPathakAP. Characterization of a first-pass gradient-echo spin-echo method to predict brain tumor grade and angiogenesis. AJNR Am J Neuroradiol2004; 25: 1524–1532.
44.
SchmiedeskampHStrakaMBammerR. Compensation of slice profile mismatch in combined spin- and gradient-echo echo-planar imaging pulse sequences. Magn Reson Med2012; 67: 378–388.
45.
ClevelandWSDevlinSJ. Locally Weighted Regression: An Approach to Regression Analysis by Local Fitting. J Am Statist Assoc1988; 83: 596–610.