
Abstract
Decreased blood–brain barrier P-glycoprotein (Pgp) function has been shown in Alzheimer's disease (AD) patients using positron emission tomography (PET) with the radiotracer (R)-[11C]verapamil. Decreased Pgp function has also been hypothesized to promote cerebral amyloid angiopathy (CAA) development. Here, we used PET and (R)-[11C]verapamil to assess Pgp function in eighteen AD patients, of which six had microbleeds (MBs), presumably reflecting underlying CAA. No differences were found in binding potential and nonspecific volume of distribution of (R)-[11C]verapamil between patient groups. These results provide no evidence for additional Pgp dysfunction in AD patients with MBs.
Keywords
Introduction
Pathological hallmarks of Alzheimer's disease (AD) are fibrillary amyloid-β depositions in brain parenchyma and amyloid-β accumulation in cerebral blood vessel walls, known as cerebral amyloid angiopathy (CAA; Smith and Greenberg, 2009). CAA is present in nearly all AD brains, although severity among individuals varies strongly (Viswanathan and Greenberg, 2011). Microbleeds (MBs), that can be observed using gradient echo weighted magnetic resonance imaging (MRI) supposedly reflect underlying CAA (Knudsen et al, 2001). Prevalence of MBs in AD is reported to be around 23% (Cordonnier and van der Flier, 2011).
The mechanisms behind intraparenchymal and intravascular amyloid-β depositions in sporadic AD still are largely unknown. A widely held hypothesis states that impaired clearance of amyloid-β from the brain is the main problem in AD (Hardy and Selkoe, 2002; Mawuenyega et al, 2010). There are several pathways for clearance of amyloid-β, including degradation by proteolytic enzymes, perivascular drainage pathways, and active transport over the blood–brain barrier (BBB) (Weller et al, 2008).
A major transporter at the BBB is P-glycoprotein (Pgp), a 170-kDa transmembrane protein, which is highly expressed at the endothelial cells that line the brain blood vessel walls. Pgp functions as an efflux transporter for a wide variety of substrates (Schinkel, 1999) and is involved in amyloid-β transport (Vogelgesang et al, 2011). Recently, decreased BBB Pgp function in sporadic AD patients was found using positron emission tomography (PET) with the radiolabelled Pgp substrate (R)-[11C]verapamil (van Assema et al, 2012). Decreased Pgp function has also been hypothesized to promote CAA development (Vogelgesang et al, 2004).
To date, no studies have been performed to assess differences in BBB Pgp function between AD patients with and without signs of advanced CAA in the brain. The purpose of the present study was to investigate global and regional associations between MBs and Pgp function in AD patients.
Materials and methods
Patients
Eighteen patients with probable AD in a mild-to-moderate disease stage (Mini-Mental State Examination scores 20) were included in this study. Six of these patients had MBs on brain MRI. Patients were recruited from the outpatient Memory Clinic of the Alzheimer Center of the VU University Medical Center in Amsterdam, where they received a standard dementia screening that included medical history, physical and neurologic examinations, screening laboratory tests, and MRI. Diagnosis was established by consensus in a multidisciplinary meeting according to the criteria for probable AD as proposed by the National Institute of Neurological and Communicative Disorders and Stroke and the Alzheimer's Disease and Related Disorders Association. To confirm presence of AD pathology in the brain, increased cortical accumulation of [11C] Pittsburgh compound B (PIB) PET was required (Tolboom et al, 2010). Parametric [11C]PIB PET images were evaluated by an experienced nuclear medicine physician (BvB) and were rated either as being PIB positive (binding in more than one cortical (frontal, parietal, temporal, or occipital) brain region) or as PIB negative (predominantly white-matter binding). All 18 AD patients were classified as PIB positive. Exclusion criteria were major psychiatric or neurologic disorders (other than AD), history of alcohol and drug abuse and use of medication that could possibly interfere with Pgp function (Bart et al, 2000). The study was approved by the Medical Ethics Review Committee of the VU University Medical Center. Written informed consent was obtained from all patients after a complete written and verbal description of the study.
Magnetic Resonance Imaging
Patients underwent structural MRI scanning using a 1.5-T Sonata scanner (Siemens Medical Solutions, Erlangen, Germany). The scan protocol included a coronal T1-weighted 3-D MPRAGE (magnetization prepared rapid acquisition gradient echo), which was used for coregistration and region of interest definition. To assess the presence of MBs and superficial siderosis, which is also a common MRI finding associated with CAA (Linn et al, 2010), a susceptibility weighted imaging sequence was performed in all patients.
Microbleeds were identified on the susceptibility weighted imaging sequence by an experienced neuroradiologist and defined as rounded, hypointense homogeneous foci up to 10 mm in size. Lesions in sulci probably representing flow voids from vessels and lesions in the globus pallidus, supposedly representing iron or calcium deposits, were not considered. Choroid plexus and pineal calcifications were also not considered, as were lesions suggestive of partial volume effects.
Positron Emission Tomography
The PET scans were acquired using an ECAT EXACT HR+ scanner (Siemens/CTI, Knoxville, TN, USA) and data were corrected for attenuation, randoms, dead time, scatter, and decay. (R)-[11C]verapamil and [11C]PIB PET data acquisition and analysis were performed as described previously (Tolboom et al, 2010; van Assema et al, 2012). In brief, after acquiring a 10-min transmission scan in 2D mode, a dynamic 60 min emission scan in 3D mode was started simultaneously with the intravenous injection of 340±37 MBq (R)-[11C]verapamil. During the scan, arterial blood was withdrawn continuously through a radial artery cannula and, at set times, manual samples were taken to obtain a metabolite corrected plasma input curve. Images were reconstructed using a standard filtered back projection algorithm, applying a Hanning filter with a cutoff at 0.5 times the Nyquist frequency. A zoom factor of 2.123 and a matrix size of 256 × 256 × 63 were used, resulting in a voxel size of 1.2 × 1.2 × 2.4 mm and a spatial resolution of ∼6.5 mm full width at half maximum at the center of the field of view. Images were also reconstructed using a partial volume corrected ordered subset expectation maximization reconstruction algorithm, reducing partial volume effects (Mourik et al, 2010). Kinetic analysis was performed using nonlinear regression of the standard two-tissue compartment model, including a blood volume component, and fixing the nonspecific volume of distribution (=K1/k2) to the mean whole-brain grey-matter value. Possible differences in K1/k2 ratio and distribution volume VT (K1/k2 (1+k3/k4)) were investigated. The nondisplaceable binding potential was used as outcome measure. These were obtained for the global cortical brain region, frontal, parietal, temporal and occipital regions, posterior and anterior cingulate cortices, medial temporal lobe and cerebellum (van Assema et al, 2012).
Statistical Analysis
Data are presented as mean±s.d., unless otherwise stated. Statistical analysis was performed using SPSS version 15.0 (Chicago, IL, USA). Group differences were calculated using nonparametric Mann–Whitney U tests. A P value of <0.05 was considered significant.
Results
Twelve of the eighteen patients (of which five females) included did not have MBs or superficial siderosis on brain susceptibility weighted imaging MRI scan (AD MB− group), while six males had single or multiple MBs in the brain (AD MB+ group). In the AD MB+ group, three patients had a single lobar MB and the other three multiple lobar MBs (three, four and nine, respectively). The patient with nine MBs also had superficial siderosis. There were no significant differences between AD MB− and AD MB+ groups with respect to age, mini-mental state examination scores, injected dose and specific activity of (R)-[11C]verapamil (Table 1).
Characteristics of patient groups
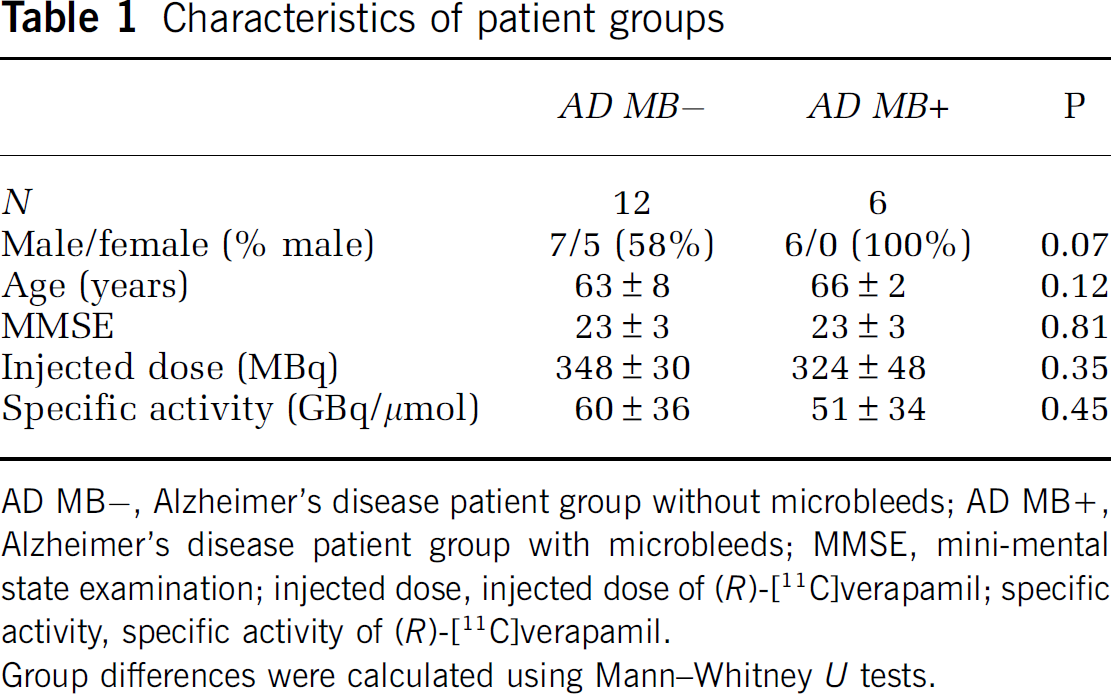
AD MB−, Alzheimer's disease patient group without microbleeds; AD MB+, Alzheimer's disease patient group with microbleeds; MMSE, mini-mental state examination; injected dose, injected dose of (R)-[11C]verapamil; specific activity, specific activity of (R)-[11C]verapamil.
Group differences were calculated using Mann–Whitney U tests.
As shown in Table 2, there were no significant differences in nondisplaceable binding potential between AD MB− and AD MB+ groups for any of the regions investigated. Results were essentially the same after partial volume effect correction (data not shown).
Binding potential (BPND) of (R)-[11C]verapamil for the several cortical brain regions
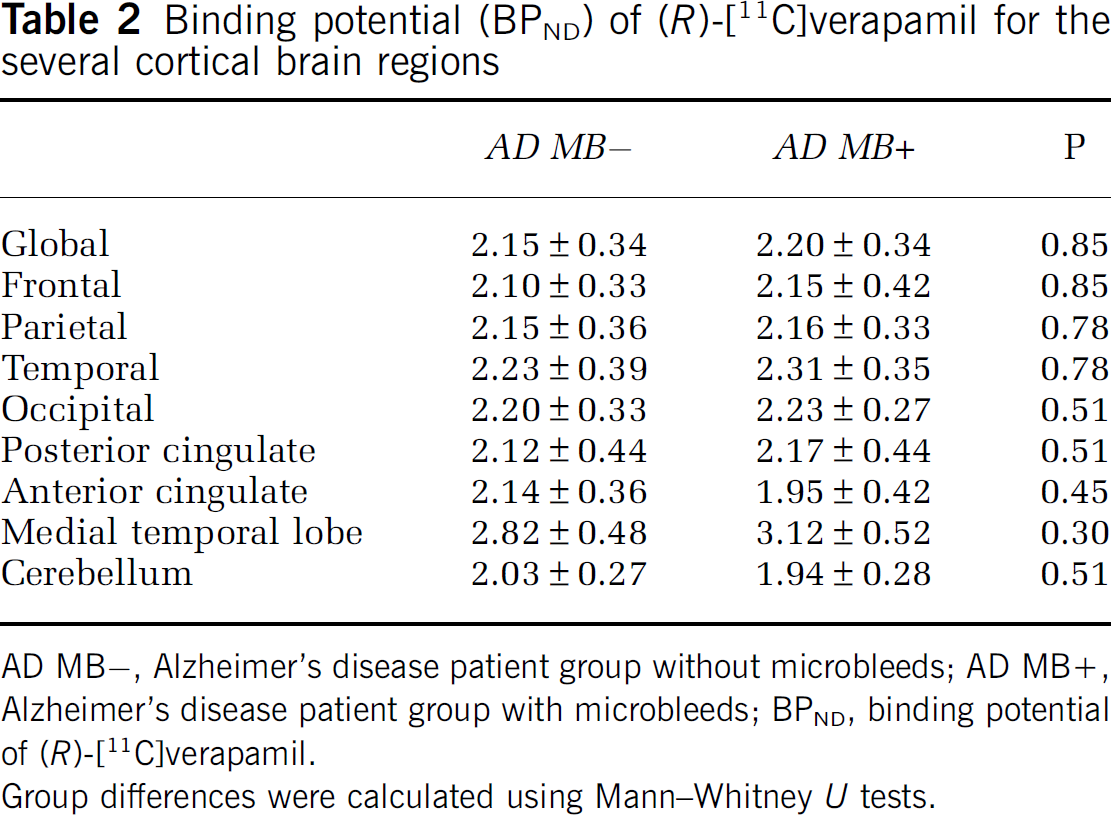
AD MB−, Alzheimer's disease patient group without microbleeds; AD MB+, Alzheimer's disease patient group with microbleeds; BPND, binding potential of (R)-[11C]verapamil.
Group differences were calculated using Mann–Whitney U tests.
Distribution volumes (VT) did not differ between the AD MB− and MB+ groups for any of the regions investigated (e.g., for the global cortical brain region, VT=0.84±0.16 and 0.89±0.17 for MB− and MB+ groups, respectively; P=0.35).
In addition, the non-specific volume of distribution (K1/k2 ratio) did not differ (for the global cortical brain region: AD MB− 0.27±0.08; AD MB+ 0.29±0.07, P=0.71) between the AD MB− and AD MB+ group for any of the regions investigated.
Discussion
No differences were found in nondisplaceable binding potential of (R)-[11C]verapamil between AD patients with MBs and those without. These results indicate that there is no evidence of additional Pgp dysfunction at the BBB in support of the hypothesis of additionally impaired Pgp function in AD MB+ patients compared with AD MB− patients.
There may be multiple explanations for these findings. First, it is possible that decreased Pgp function in AD MB+ patients could not be shown due to lack of statistical power (small group sizes). Second, it could be due to the inclusion criteria used in this study. Autopsy studies have shown that nearly all AD patients show some degree of vascular amyloid-β. Still, only a minority of AD patients shows signs of CAA on MRI such as MBs or superficial siderosis during life. It is possible that only patients with severe CAA show MBs on MRI, but conclusive evidence is missing. An alternative explanation would be that severity of CAA pathology is only weakly related to the presence and number of MBs on MRI. In addition, it is also possible that additional Pgp dysfunction does occur, but at a more locoregional level, e.g., directly around MB locations. This would, however, be beyond the spatial resolution of PET, given the relatively low target to background ratio of (R)-[11C]verapamil uptake.
It should be noted that it is also possible that AD MB+ and AD MB− patients really do not differ from each other in terms of Pgp function, since almost all AD patients do have some degree of CAA and all have amyloid-β accumulation in the brain. Because both groups have the same pathology, which very likely is present in the brain for several years or even decades before clinical symptoms occur, the possible destructive effects of these pathological processes will have taken place already. In a previous study, decreased Pgp function in AD patients compared with age-matched healthy controls was shown (van Assema et al, 2012). The order of events regarding Pgp dysfunction and amyloid deposition has not been unravelled yet. Dysfunction of BBB Pgp could contribute to accumulation of intraparenchymal and intravascular amyloid, while, however, Pgp dysfunction could also be the result of these amyloid depositions having a destructive effect on the blood vessel walls.
Negative findings were not due to different patterns of atrophy between groups, as volumes of the various cortical brain regions, including the global cortical brain region, did not differ between groups (for the global cortical region: AD MB− 192±24 mL; AD MB+ 193±17 mL, P=0.85). Additionally, applying a partial volume effect correction did not alter results.
A limitation of this study is the small sample size of the two groups. Strengths are the full dynamic scanning and quantitative kinetic modelling procedures. This is the first study that directly compares in vivo BBB Pgp function between AD patients with and without CAA characteristics, showing that Pgp function is comparable in AD patients with and without MBs.
Footnotes
Acknowledgements
The authors thank the PET radiochemistry and technology staff of the Department of Nuclear Medicine and PET Research for tracer production and acquisition of PET data, and the technology staff of the Department of Radiology for acquisition of MRI data.
Disclosure/conflict of interest
The authors declare no conflict of interest.