
Abstract
The ‘new penumbra’ concept imbues the transition between injury and repair at the neurovascular unit with profound implications for selecting the appropriate type and timing of neuroprotective interventions. In this conceptual study, we investigated the protective effects of pigment epithelium-derived factor (PEDF) and compared them with the properties of epidermal growth factor (EGF) in a rat model of ischemia–reperfusion injury. We initiated a delayed intervention 3 hours after reperfusion using equimolar amounts of PEDF and EGF. These agents were then administered intravenously for 4 hours following reperfusion after 1 hour of focal ischemia. Magnetic resonance imaging indices were characterized, and imaging was performed at multiple time points post reperfusion. PEDF and EGF reduced lesion volumes at all time points as observed on T2-weighted images (T2-LVs). In addition PEDF selectively attenuated lesion volume expansion at 48 hours after reperfusion and persistently modulated blood–brain barrier (BBB) permeability at all time points. Intervention with peptides is suspected to cause edema formation at distant regions. The observed T2-LV reduction and BBB modulation by these trophic factors is probably mediated through a number of diverse mechanisms. A thorough evaluation of neurotrophins is still necessary to determine their time-dependent contributions against injury and their modulatory effects on repair after stroke.
Keywords
INTRODUCTION
The classic concept of stroke evolution, as proposed by Dirnagl et al, 1 involves a continuum of multiple mechanisms (from hypoxic injury to inflammation to induction of apoptosis) that lead to neuronal injury. To achieve neuroprotection, persistent protective effects must be mediated through a number of agents possessing multiple mechanisms of action. The ‘new penumbra’ concept of Eng Lo 2 highlights the necessity to select the appropriate type and time of drug intervention by giving due consideration to the mechanisms underlying the transition from injury to repair. A prime example for this is the intervention with matrix metalloproteinase inhibitors. Their early administration (during injury phase) reduces infarction, but their delayed administration resulted in increased infarct volume. 3 Adequate reconstruction and/or regeneration of damaged neuronal circuits may need to take place before satisfactory functional recovery can occur. 4 Developing a single pharmacological agent that can meet such a plethora of demanding therapeutic requirements may be impossible.
Neurotrophic factors (NTFs) are a class of proteins normally present within the mammalian nervous system promoting survival and/or maintenance of neurons. They may also stimulate axonal growth, synaptic plasticity, and neurotransmitter synthesis and release. 5 Among neural cells, neurons are particularly sensitive to injuries such as ischemia, hypoxia, hypoglycemia, infection, and trauma. Episodes of acute ischemic stroke have been shown to cause a marked increase in cell proliferation at the subventricular zone as well as cell migration into severely damaged areas of the striatum, where the cells express markers of developing and mature medium spiny neurons. 4 However, after 6 weeks of the insult only ~0.2% of the dead striatal neurons have been replaced by new neurons. To a large measure this poor cell survival is most likely because of the immediate pathologic environment encountering the newborn neurons, and may be reflected by an early phase of blood–brain barrier (BBB) opening. 6 Next to elevated levels of reactive oxygen species (ROS), cytokine release and glutamate toxicity, inflammation with its diverse cell types and variable activation states appears to be an important component and this inflammatory cascade could prove to be anything from detrimental to supportive for adult neurogenesis. 7 We hypothesized that once this initial deleterious post-hypoxic response have been minimized by a suitable agent, the prevailing environment surrounding the ictus could provide a favorable setting for neuronal repair/replacement by proliferating cells. To enable this environment, we strategized an early intervention with the non-inhibitory member of the serine protease inhibitor (SERPIN), pigment epithelium-derived factor (PEDF) by considering its anti-inflammatory, anti-oxidant and inhibitory properties on the VEGF-NADPH oxidase pathway among others followed by another exposure to the potent mitogen epidermal growth factor (EGF).8,9
As a first step toward such a combined therapeutic approach, we investigated the properties of each of these peptides separately on a rodent model of ischemia–reperfusion (I/R) injury. This model exhibits a biphasic course of BBB permeability changes over time and the NTF treatment was initiated and confined to the initial phase of the altered BBB permeability.10,11 The entire study was performed non-invasively using a clinical 3T dedicated head magnetic resonance (MR) scanner (Siemens Magnetom Allegra, Siemens Healthcare sector, Erlangen, Germany) customized to perform small animal imaging as described previously. 12
MATERIALS AND METHODS
All animal experiments were performed in accordance with the European Community Council's directive (86/609/EEC) and institutional guidelines for animal care after obtaining approval from our local ethics committee (Ethics Committee for Animal Laboratories, Medical Faculty, University Hospital of Regensburg).
Assessment of Blood–Brain Barrier Permeability to Macromolecules After Ischemia–Reperfusion Injury
Before any treatment with macromolecular proteins was initiated, we confirmed the BBB permeability changes after I/R injury to ensure the entry of NTFs into the brain parenchyma. As Evans blue (EB) binds to serum albumin (molecular mass 67 kDa), the dye serves as a reliable marker to assess characteristics of BBB permeability. The extravasation of the EB-albumin complex into the brain parenchyma, identified by bluish-colored tissue, is indicative of compromised BBB permeability resulting from I/R injury. 13
Experimental Methods
Male Sprague-Dawley rats (Janvier, Le Genest-St-Isle, France), weighing 250–300 g, were divided into three groups of three animals each. The groups were 3-, 6-, and 8-hour reperfusion groups (3 R, 6 R, and 8 R groups, respectively). The animals were subjected to 60 minutes of transient middle cerebral artery occlusion (tMCAO), with modifications as described in a previous protocol. 10 Briefly, anesthesia was induced with 5% isoflurane (Isofluran Baxter, Baxter Deutschland GmbH, Unterschleissheim, Germany) in a mixture of 70% nitrous oxide/30% oxygen. After endotracheal intubation, anesthesia was maintained using 1.5% isoflurane with the aid of a mechanical rodent ventilator (RS Biomed, Sinzing, Germany). The body temperature was kept maintained constant throughout the entire experiment by using a feedback-regulated heating pad. A cannula was inserted into the left femoral vein for EB administration. After this, the left common carotid artery (CA) bifurcation was exposed through a midline neck incision, and the occipital artery branches of the external CA were isolated, ligated, and dissected. After careful isolation of the internal CA, a 3-cm-long silicone-coated polyamide 4-0 monofilament (Ethicon, Johnson & Johnson Medical GmbH, Norderstedt, Germany) was advanced through the internal CA to the MCA until the filament met a mild resistance. The filament was tethered to the stump of the external CA and the neck incision was closed with a silk suture. The animal was then transferred to its cage and allowed to move freely after recovery from anesthesia.
After 60 minutes, the rat was again anesthetized, neck incision was reopened, and the filament was gently pulled back to facilitate reperfusion. In the 3 R group, after reperfusion for 3 hours, EB (2% EB in 0.9% saline, 4 ml/kg) was administered through the femoral vein and was allowed to circulate for 1 hour. The same procedure was repeated for the 6 R and 8 R groups after reperfusion at 6 and 8 hours, respectively. Animals were then deeply anesthetized with pentobarbital (40 mg/kg i.p.), chest cavity opened, and the right atrium was punctured. Ice-cold phosphate-buffered saline (pH 7.4, < 4°C) was then perfused through the left ventricle at 110 mm Hg, until a colorless perfusate was obtained from the right atrium. The rat skull was immediately opened and the entire brain was removed and deep-frozen at −80°C for 20 minutes. The frozen brain was cut into 1-mm slices using a rodent brain matrix (ASI Instruments, Warren, MI, USA) and the tissue sections were gently placed on a transparent plastic film and scanned at 1,200 dpi using an office document scanner (Scanjet 7,650, Hewlett-Packard, Palo Alto, CA, USA) to obtain a digital copy.
Treatment Regimens with Epidermal Growth Factor and Pigment Epithelium-Derived Factor
The EGF and PEDF dosing regimens were prepared to achieve an equimolar dose of brain derived NTF (molecular mass 28 kDa). This dose (50 μg/300 g rat) had demonstrated neuroprotective effects in a previous study. 14 Dilutions of human recombinant PEDF (Creative Biomart, Shirley, NY, USA) and EGF (BIOTREND Chemikalien GmbH, Cologne, Germany) were prepared in cold sterile water for injection (<4 °C) to achieve final concentrations of 89.28 μg/1,000 μL, and 11.16 μg/1,000 μL, respectively, for a 300 g rat. These dilutions were prepared from previously constituted stock solutions, randomized, and masked from the experimenters. The intravenous dosing regimen consisted of a 10% bolus dose (100 μL) followed by a continuous infusion of the remaining 90% (900 μL) at the rate of 225 μL/h for 4 hours, administered using a micro-infusion pump (Syringe Pump 540,310, TSE, Bad Homburg, Germany).
Sample Size Calculation
A preliminary experiment was conducted with two groups (control and PEDF, each n = 5) to determine the differences in mean lesion volumes between the two groups as measured on T2-weighted MR images (T2-LVs) obtained at 24 hours after reperfusion. The test was performed using an unpaired t-test with a significance level (α) of 0.05.
Exclusion Criteria
After tMCAO, any animal without a neurologic score of at least 1 (failure to extend right forepaw fully) was considered an experimental failure and discarded from the study. In addition, any animal that exhibited labored irregular breathing after reperfusion with a depressed level of consciousness was examined for subarachnoid hemorrhage at the MR scanner and if hemorrhage was confirmed, the animal was excluded from the study.
Experimental Design
Three treatment groups were considered namely, EGF- (n = 16), PEDF- (n = 14), and control (saline)- (n = 17) treated animals. Animal specifications and surgical procedures remains the same as mentioned earlier. After a 3-hour reperfusion period after an hour of ischemia, NTF or saline infusions maintained at a temperature <3°C was infused for the next 4 hours as mentioned earlier. A schematic representation of the experimental design is provided in Figure 1.
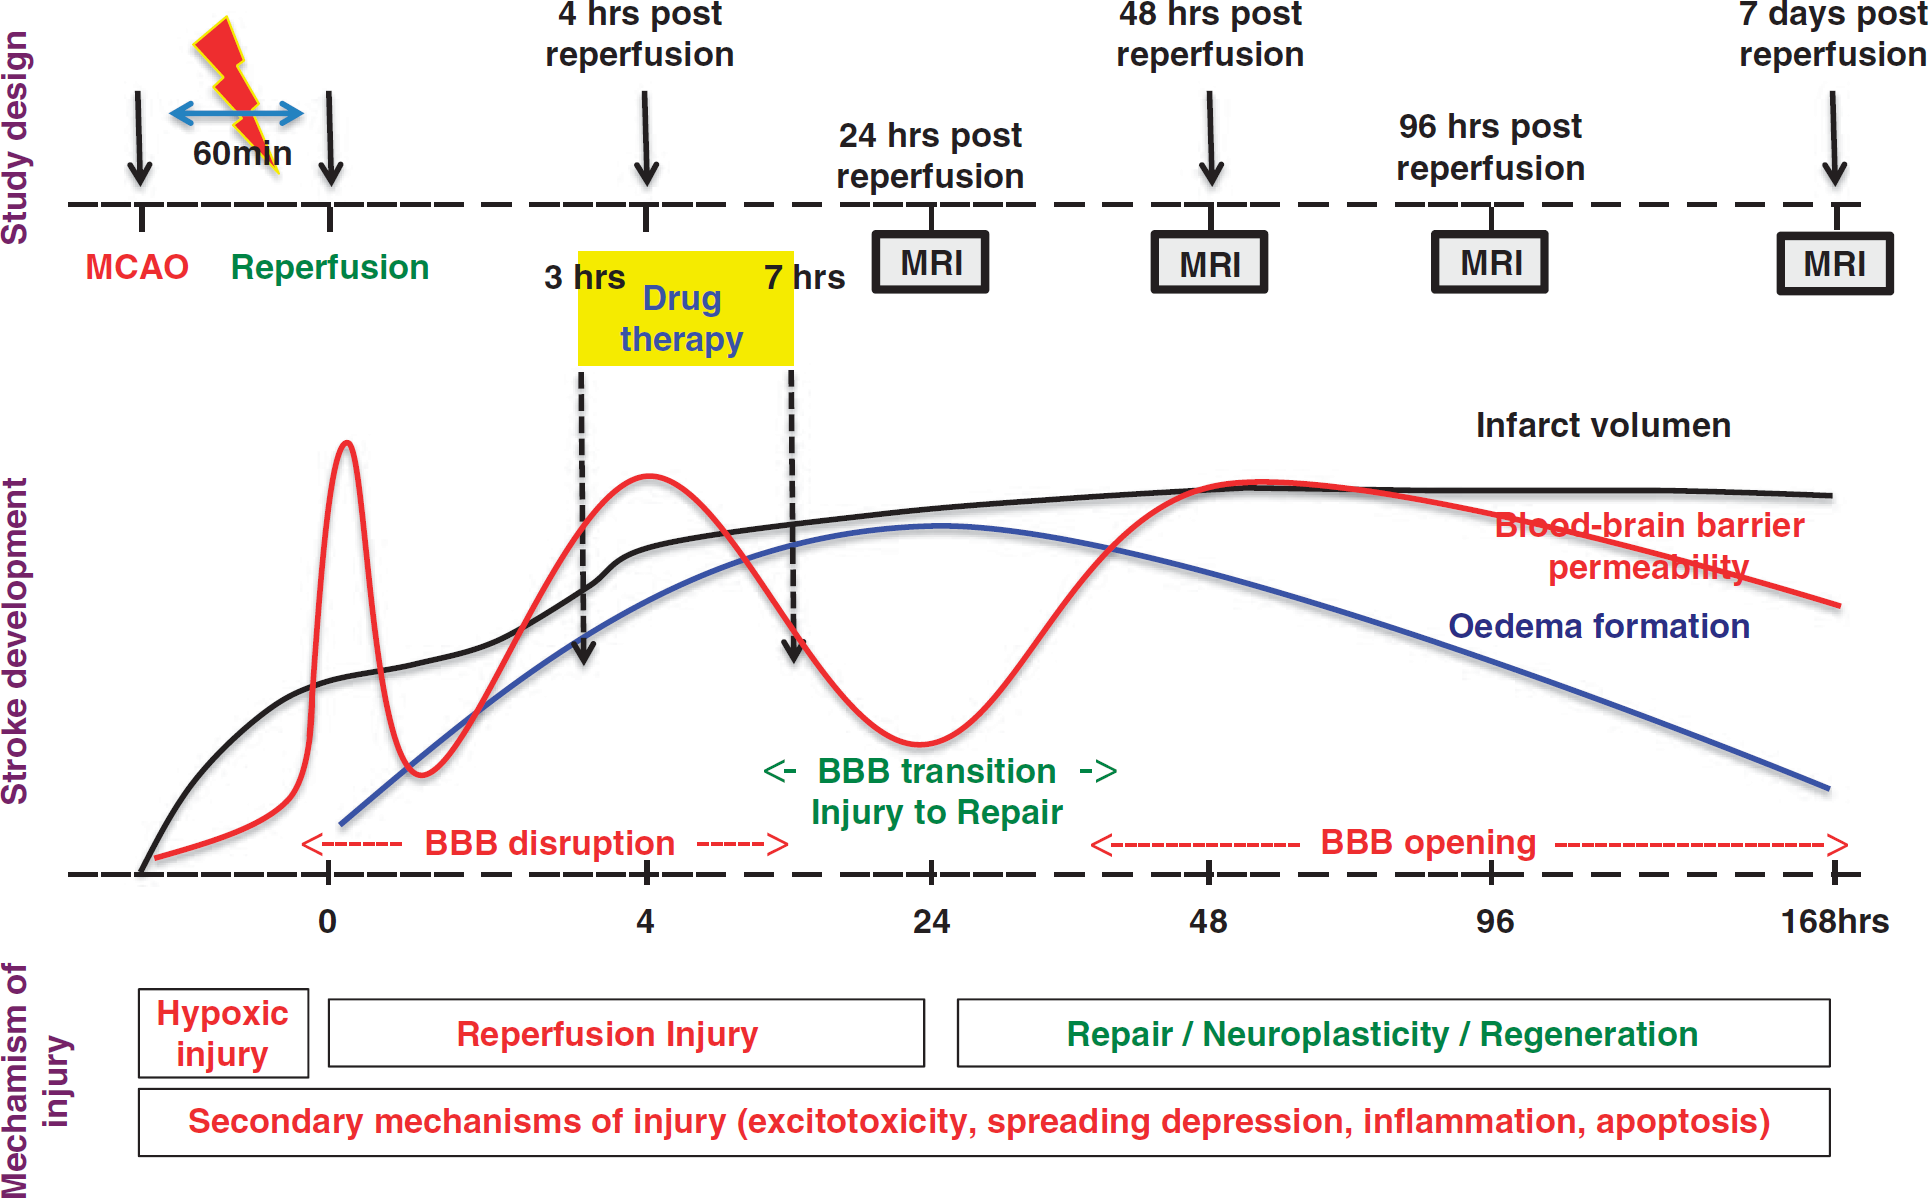
Schematic representation of the experimental design. Animals were subjected to 1 hour of ischemia followed by reperfusion. After 3 hours of reperfusion, intravenous infusions of pigment epithelium-derived factor, epidermal growth factor, or normal saline (control) was initiated and continued for 4 hours. Schedule of magnetic resonance imaging at 24, 48, 96 hours, and 1 week with respect to infarct evolution, blood–brain barrier permeability, and their probable underlying pathologic mechanisms are also provided. BBB, blood–brain barrier; MCAO, middle cerebral artery occlusion; MRI, magnetic resonance imaging.
Magnetic Resonance Imaging
To facilitate rodent imaging, the clinical MR system was equipped with a customized four-channel phased-array receive-only radiofrequency (RF) coil assembly and a volume resonator was used for RF transmission (RAPID Biomedical, Rimpar, Germany). The RF assembly was complemented by an animal handling system including provisions for inhalational anesthetic supply and a feedback-regulated heating pad. T2 relaxometry was primarily used to detect subtle changes in edema dynamics at the infarct region and also at regions remote from the lesion site. To obtain normal control values, Tissue transverse (T2) relaxation times were estimated at the cortical and striatal regions of healthy male Sprague-Dawley rats (n = 8), subsequently referred to as the ‘healthy’ animal group. T2 relaxometry was performed using a spin echo (SE) sequence with a repetition time (TR) of 4,000 ms and data sets were acquired at 7 echo times (TE): 29, 58, 88, 117, 146, 175, and 204 ms. Treated groups were subjected to serial MR imaging at pre-designated time points (24, 48, 96 hours and 1 week) after reperfusion. T2-weighted turbo spin echo (T2-TSE) sequences were used to visualize the temporal and spatial changes in vasogenic edema formation (T2 lesion). The sequence parameters were: TR = 3,000 ms, TE = 70 ms, field-of-view (FOV) = 2.5 cm2, image matrix (IM) = 128 × 128, and number of averages (NOA) = 4. Acquired images had an in-plane resolution of 200 μ and required an acquisition time of 5 minutes, 39 seconds. Contrast-enhanced T1-weighted SE sequences were obtained to determine BBB permeability to gadolinium diethylenetriamine pentaacetic acid (Gd-DTPA), as described previously. 10 The sequence parameters were: TR = 900 ms, TE = 10 ms, and NOA = 3; the FOV and IM were similar to the T2-TSE sequence. Acquired images had an in-plane resolution of 200 μ, requiring an acquisition time of 11 minutes, 34 seconds.
To detect hemorrhage, susceptibility-weighted (T2*) gradient recalled echo images were obtained using the following sequence parameters: TR = 500 ms, TE = 30 ms, FOV = 5 cm2, IM = 256 × 256, and NOA = 2. Acquired images had an in-plane resolution of 200 μ and required an acquisition time of 4 minutes and 18 seconds. The slice thickness for all image acquisitions was kept at 1.5 mm.
Data Analysis
Lesion volumes on T2-weighted images:. T2-LVs were determined by manually outlining the lesion area with the aid of tools built into the Siemens SyngoMR 2004A software (Siemens Healthcare sector) and by multiplying the outlined area with the slice thickness. T2-LVs are then subsequently corrected for edema in the following manner. For each 1.5-mm-thick slice, the ‘original’ hemispherical volume (HVo) could be determined from the total slice volume (TV) as this remains unchanged.


Characterization of edema formation***:. A two-tier approach was considered to characterize the time course of edema formation and resorption. In the first approach, we determined the difference between VIH and HVo (if any), and represented edema as a percentage increase in ipsilateral hemispheric volume represented in cubic centimeters. The second approach was based on quantitative T2 relaxometry, where the T2 relaxation times were derived from three adjacent slices and is then represented as a mean value. Those three slices were selected as follows; in all the treatment groups, the largest infarct volume was found at the slice located 6 mm posterior to the anterior tip of the frontal cortex. One slice preceding this (located at 4.5 mm) and another slice following this (located at 7.5 mm) posterior to the anterior tip of the frontal cortex was then considered.
Quantitative relaxometry was performed at three regions of interest (ROI). At the ipsilateral striatum, an ROI was defined over the hyperintense region depicted on the T2-TSE image. An identical ROI was defined at the corresponding region on the contralateral side. Another ROI was also defined at the healthy ipsilateral cortex, well outside any region of infarction, if present. As the T2-LV was found expanded at 48 hours, the area of the ROI at this time was kept constant for all subsequent time points (that is, the outlined area remained the same for 48, 96 hours and 1 week). In situations involving those animals in which the 48-hour T2-LV was equal to or less than that at 24 hours, the area of the ROI measured at 24 hours was maintained identical throughout.
In those cases in which hemorrhage was detected using T2*-gradient recalled echo sequences (Supplementary Figure S1), two strategies were considered. The first strategy was to completely exclude the slice in which hemorrhage was detected and rely on the average value of the other two slices. The second was to exclude the hemorrhagic region from the ROI and only consider the other region of the infarct. However, both techniques yielded similar if not identical values. Henceforth, data presented here consist of T2-LVs averaged from three slices, and in those cases in which hemorrhage was identified in any slice, the ROI was modified to selectively exclude that region.
BBB permeability changes were characterized on identical slices as those considered for T2 relaxometry. To analyze BBB permeability changes, digital subtraction maps from unenhanced and contrast-enhanced T1-weighted SE images were derived from the three slices to highlight regions of Gd-DTPA extravasation. T2-TSE images and subtraction maps were opened side-by-side on the viewer running Siemens SyngoMR 2004A software. Entire T2-LVs were selectively outlined following the same method as mentioned above. As the position of the animal within the scanner remained identical across image acquisitions, the corresponding region on the subtraction map was automatically selected. Furthermore, the same ROI was reproduced on the contralateral side to derive the corresponding values. The measured pixel intensity values (T1SIdiff) were then averaged for the three slices and were considered to represent the extent of Gd-DTPA extravasation or vascular reactivity.
Throughout the study, values are expressed as mean ± s.d. Monoexponential nonlinear curve fitting to determine the T2 relaxation values and statistical data analysis was performed using Graphpad Prism Version 5.00 for Windows (Graphpad Software, San Diego, CA, USA). Repeated-measures analysis of variance with Tukey–Kramer post-hoc tests were performed for within group comparisons at all time points. One-way analysis of variance with Tukey–Kramer post-hoc tests were performed for comparisons between all pairs of groups and Dunnett's multiple comparisons test was performed to compare values between the healthy animal and treatment groups. A P < 0.05 was considered significant.
RESULTS
Evaluation of Blood–Brain Barrier Permeability to Macromolecules
All animal groups demonstrated EB extravasation, as indicated by bluish-colored tissue after exposure to circulating EB. Representative images (Supplementary Figure S2) are provided.
Effect of Epidermal Growth Factor and Pigment Epithelium-Derived Factor on Edema Corrected T2-LVs
The preliminary study undertaken to determine the sample size yielded the following results. The PEDF and control groups had T2-LVs (uncorrected for edema) of 4.6 ± 1% and 9.8 ± 3.9%, respectively. A sample size of 9 in each group had a 99% power to detect the difference in T2-LVs between the two means (5.2%) with a significance level (α) of 0.05 (two-tailed).
At all time points, the T2-LVs of the EGF and PEDF groups were significantly smaller (P < 0.0001) than that of the control (saline) group. At 24 hours, T2-LVs of both EGF (5.26 ± 1.01%) and PEDF (4.29 ± 0.73%) groups were significantly smaller (P < 0.0001) than control (7.38 ± 0.98%). By 48 hours after reperfusion, T2-LVs of the control (10.36 ± 3.91%, P < 0.001) and EGF group (6.7 ± 2.12%, P < 0.05) increased significantly compared with 24 hours after reperfusion, whereas there was an insignificant decrease in T2-LV (3.84 ± 0.86%) of the PEDF group. All groups demonstrated a significant reduction (P < 0.0001) in T2-LV by 96 hours, compared with 48 hours after reperfusion. These results are schematically represented in Figure 2 and the representative T2-LVs are provided with Figure 3.
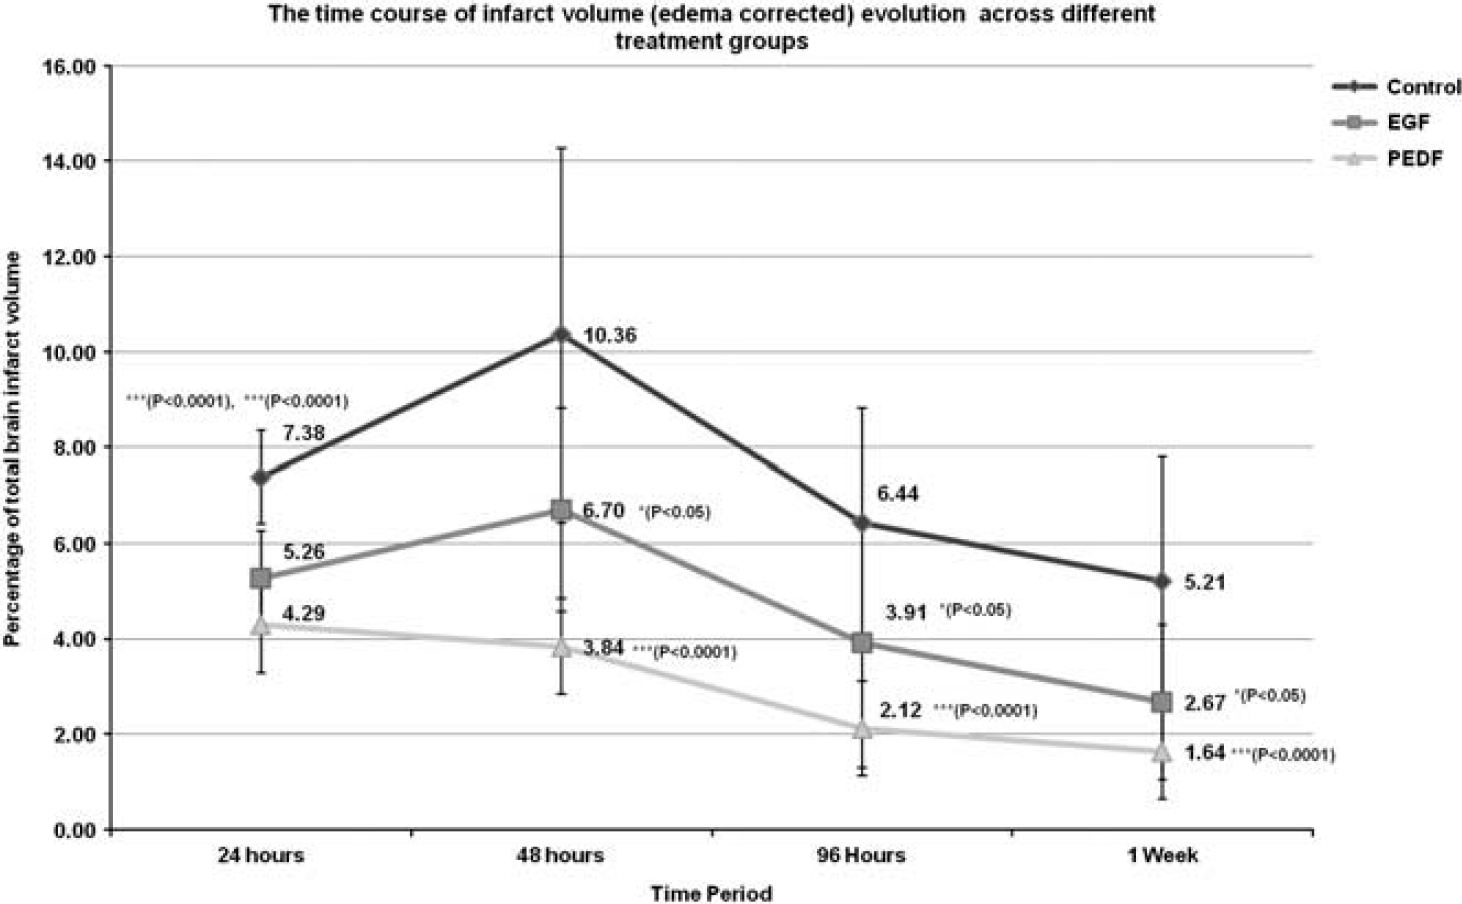
Schematic representation of the temporal changes in edema corrected infarct volumes as a percentage of the total brain volume across different treatment groups up to 1 week. After the delayed intervention with pigment epithelium-derived factor (PEDF) and epidermal growth factor (EGF) at 3 hours after reperfusion, the infarct volumes of these groups were significantly lower than the control group at all time points up to 1 week. Moreover, both the EGF and control groups demonstrated significant increases in T2 lesion volumes at 48 hours after reperfusion, which was completely arrested by PEDF treatment.
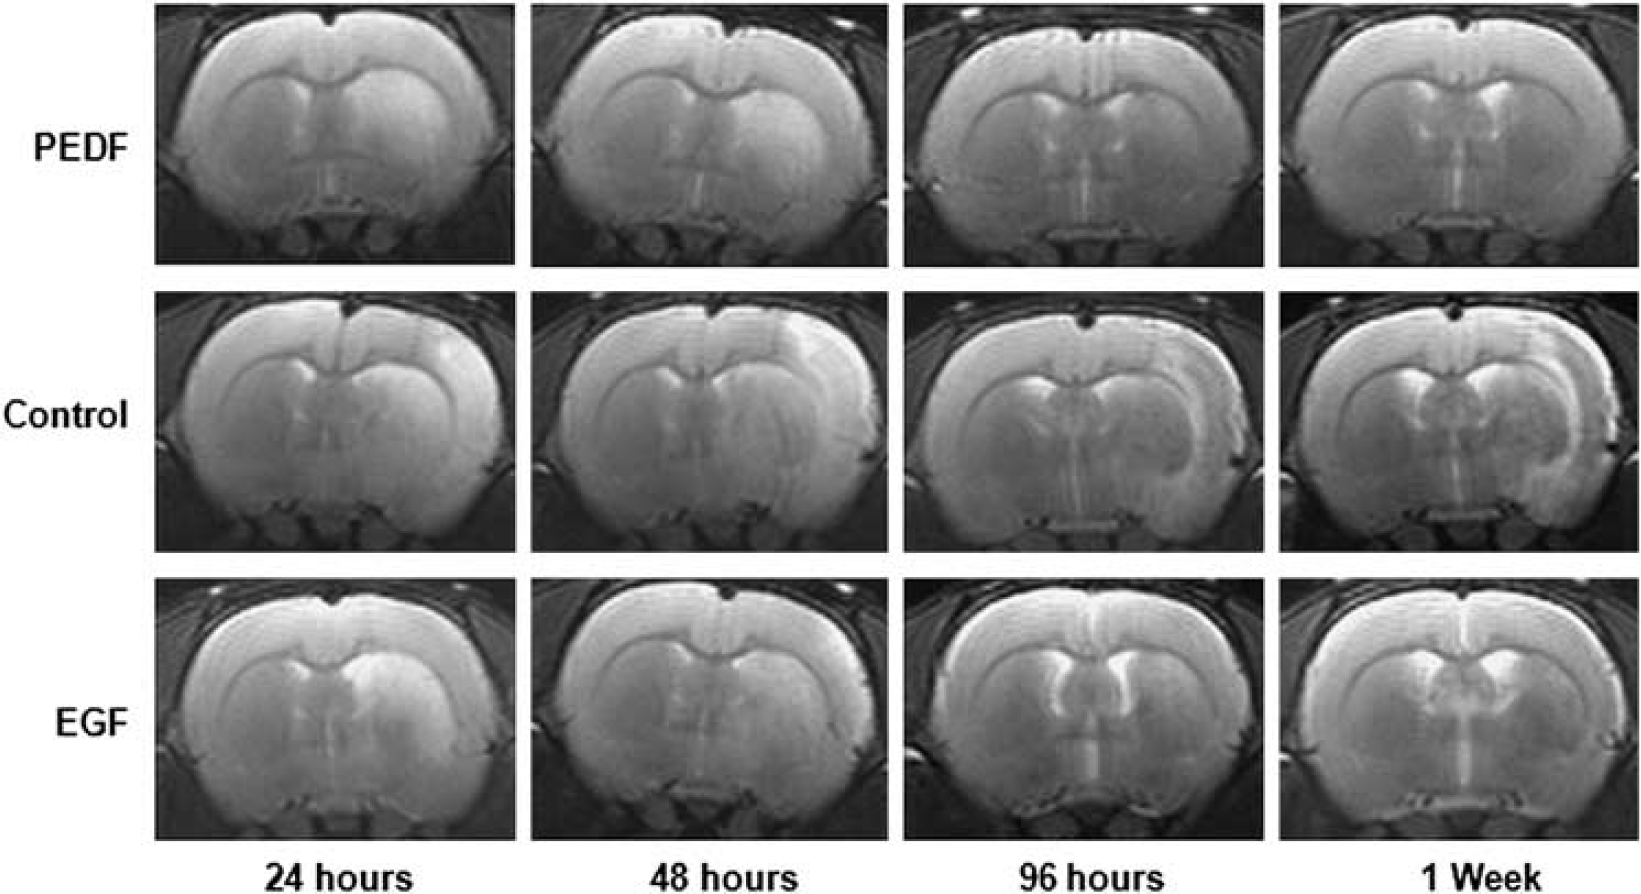
Representative T2-weighted turbo spin echo magnetic resonance images from the three different treatment groups at time points up to 1 week. Hyperintense regions of these images were manually outlined and were then corrected for edema. The hemispheric volumes were also determined from the same images to calculate the expansion factor (F) of the ipsilateral hemisphere due to edema, which was used later to derive the actual infarct volume. EGF, epidermal growth factor; PEDF, epithelium-derived factor.
Effect of Epidermal Growth Factor and Pigment Epithelium-Derived Factor on Edema Dynamics
At 24 hours after reperfusion, the percentage increase in ipsilateral HVo attributed to edema formation in the control, EGF, and PEDF groups were 2.85 ± 2%, 3.26 ± 1.56%, and 1.61 ± 0.55% respectively. By 48 hours, significant percentage increments were found with the control (5.14 ± 3.15%, P < 0.001) and EGF (5 ± 2.52%, P < 0.05) groups, compared with 24 hours. The PEDF group demonstrated a nonsignificant increase (1.97 ± 0.87%) and this volume was significantly (P < 0.05) lower than those of the EGF and control groups. At 96 hours all the groups demonstrated significant decline (control (3.01 ± 2.1%, P < 0.001), EGF (2.14 ± 2.13%, P < 0.0001) and PEDF (1.15 ± 0.66%, P < 0.05)) in edema volume compared with 48 hours after reperfusion. These results are schematically represented in Figure 4.
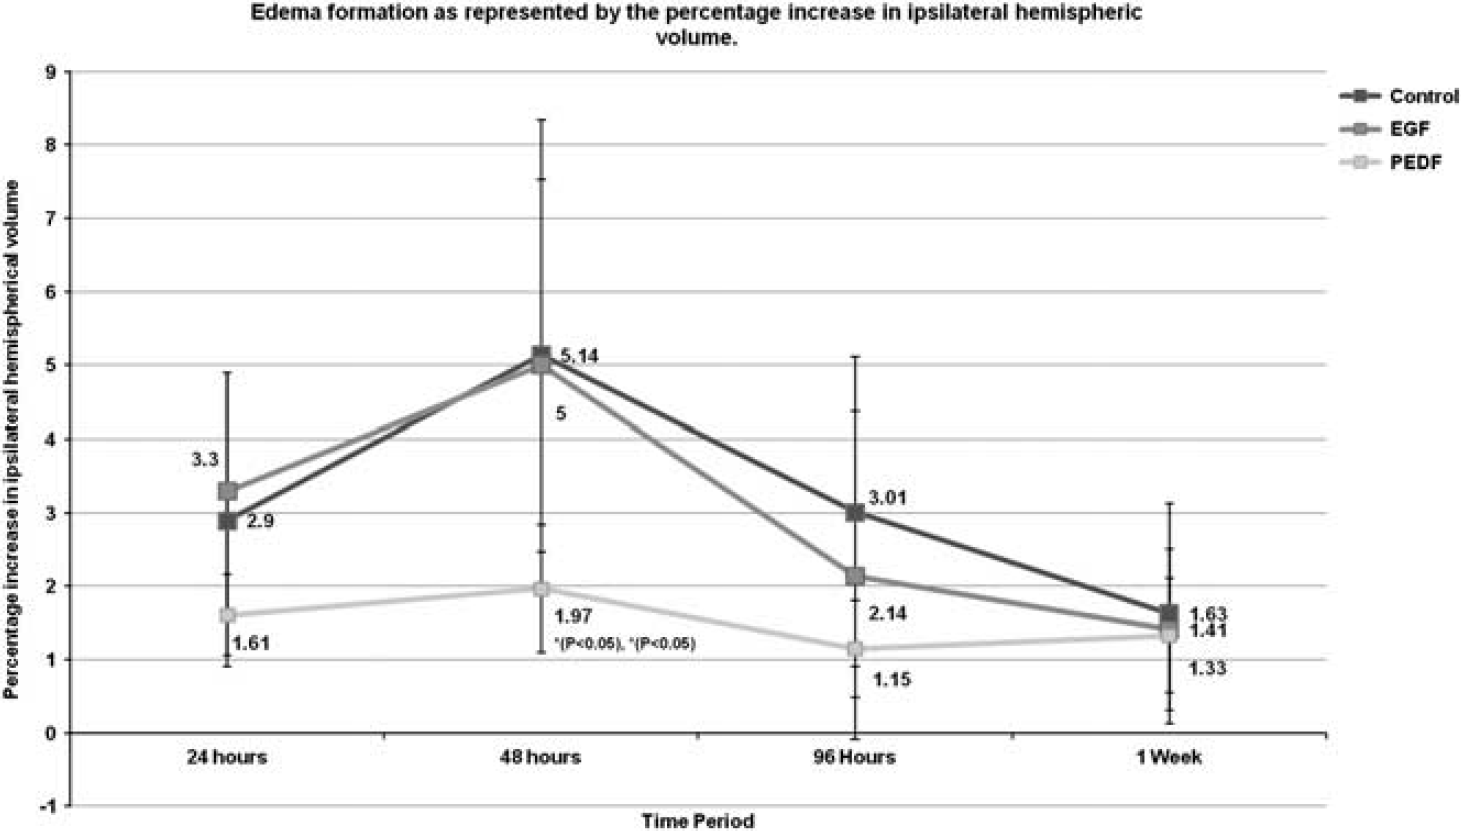
Schematic representation of the temporal changes in ipsilateral hemispheric volumes (representing edema formation) across different treatment groups up to 1 week. After a delayed intervention with pigment epithelium-derived factor and epidermal growth factor at 3 hours after reperfusion, the epithelium-derived factor (PEDF) group demonstrated less edema at all time points and, moreover, the increase in edema formation at 48 hours when compared with 24 hours was nonsignificant. EGF, epidermal growth factor.
At 24 hours after reperfusion, all the treatment groups demonstrated a significant elevation in T2 values (control (122.2 ± 27.04 ms, P < 0.0001), EGF (130.7 ± 10.52 ms, P < 0.0001), and PEDF (116.5 ± 8.56 ms, P < 0.0001)) in comparison with the healthy animal group (83.21 ± 4.12 ms). By 48 hours, the T2 values of all the treatment groups were still significantly elevated compared with the healthy group (P < 0.0001) and only the EGF group was found to have a significant reduction in T2 value (114.8 ± 12.58 ms, P < 0.001) compared with 24 hours. At 96 hours after reperfusion, the T2 values continued to decrease for all the treatment groups compared with 48 hours but was significant only in those case with the neurotrophins (control 94.58 ± 16.29 ms, EGF 96.76 ± 5.72 ms, P < 0.0001 and PEDF 92.17 ± 8.86 ms, P < 0.0001). However, the T2 value of the EGF group remained significantly higher than that of the healthy group (P < 0.001). These results are summarized in the Supplementary Figure S3.
Effect of Epidermal Growth Factor and Pigment Epithelium-Derived Factor on Blood–Brain Barrier Permeability at the Ipsilateral Striatum
At 24 hours after reperfusion, the T1SIdiff values of the control, EGF, and PEDF groups were 26.32 ± 6.3, 23.06 ± 2.8 and 13.74 ± 3.02, respectively. The T1SIdiff value of the PEDF group was significantly lower than values of the control (P < 0.0001) and EGF groups (P < 0.0001). By 48 hours, the T1SIdiff values of the control (59.87 ± 14.4, P < 0.001), EGF (56.03 ± 21.49, P < 0.0001), and PEDF (30.98 ± 8.52, P < 0.0001) groups increased significantly compared with the 24-hour time point. However, the T1SIdiff value of the PEDF group remained significantly lower than the values of the control (P < 0.0001) and EGF (P < 0.001) groups.
At 96 hours after reperfusion, a significant decrease in T1SIdiff value compared with the earlier time point was evident only with the PEDF group (17.99 ± 8.1, P < 0.001). Moreover, the T1SIdiff value of the PEDF group remained significantly (P < 0.0001) lower than that of the control group. By 1 week, only the T1SIdiff value of the control group (38.6 ± 10.34, P < 0.05) decreased significantly. At the same time, the T1SIdiff value of the PEDF group remained significantly lower than that of the control (P < 0.001) and EGF (P < 0.001) groups. These data are schematically represented in Figure 5 and the subtraction maps of the three different treatment groups at all time points are provided with Figure 6.
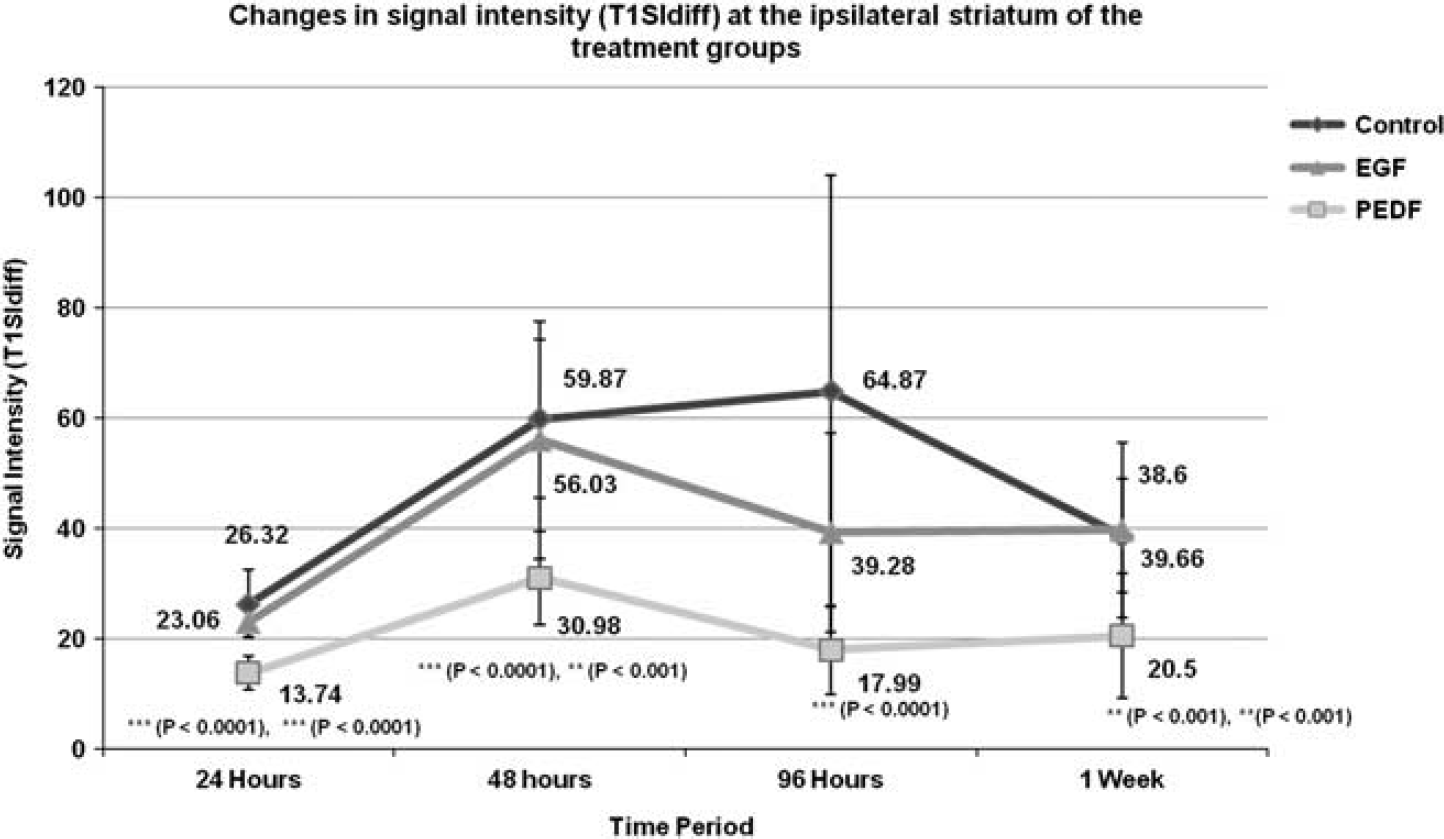
Temporal profile of signal intensity (T1SIdiff) changes at the ipsilateral striatum of the different treatment groups at various time points. Delayed intervention with pigment epithelium-derived factor and epidermal growth factor at 3 hours after reperfusion resulted in a significant suppression of blood–brain barrier permeability of the epithelium-derived factor (PEDF) group at all time points up to 1 week. No gross changes were observed with the epidermal growth factor (EGF) group during the considered time course.
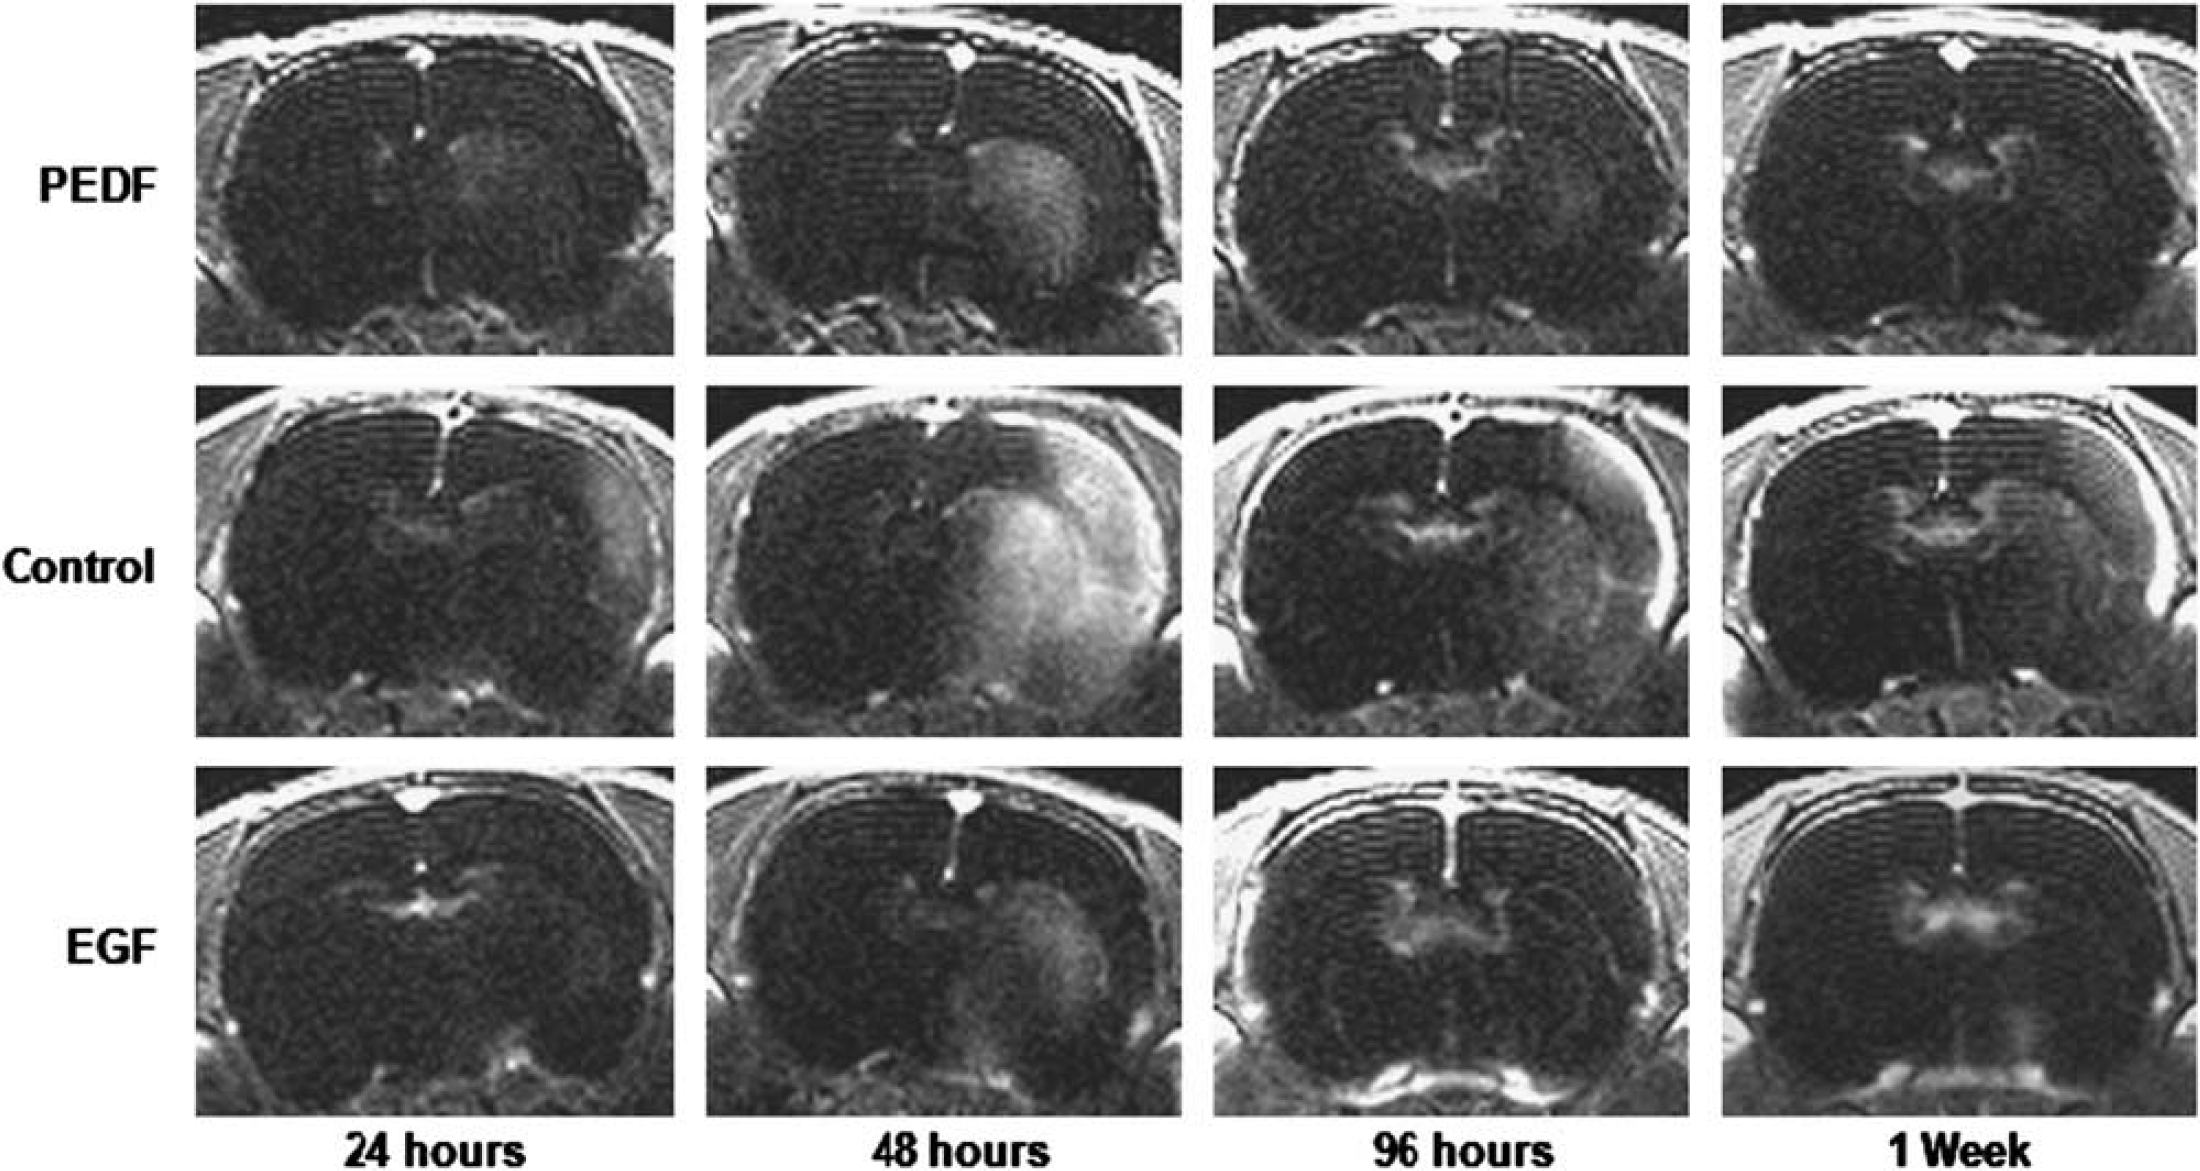
Subtraction T1-SE maps of different treatment groups at specific time points. Images provided for control (saline), pigment epithelium-derived factor, and epidermal growth factor groups at all time points up to 1 week were derived by subtracting the unenhanced T1-weighted images from the contrast-enhanced T1-weighted images. EGF, epidermal growth factor; PEDF, epithelium-derived factor.
Effect of Epidermal Growth Factor and Pigment Epithelium-Derived Factor on the Vasculature at the Contralateral Striatum
On the basis of findings from a previous study, 10 we also assessed the T1SIdiff value at the contralateral striatum. At 24 hours after reperfusion, T1SIdiff values at the contralateral striatum of the control, EGF, and PEDF groups were 12.4 ± 2.9, 14.26 ± 4.6, and 9.41 ± 2.7, respectively. The T1SIdiff value of the PEDF group remained significantly (P < 0.05) lower than that of the EGF group. At 96 hours, the T1SIdiff value of the PEDF group remained significantly (P < 0.001) lower than that of the EGF group. By 1 week after reperfusion the T1SIdiff value of the EGF group remained significantly higher than values of both the control (P < 0.0001) and PEDF (P < 0.0001) groups. These results are summarized in Figure 7.
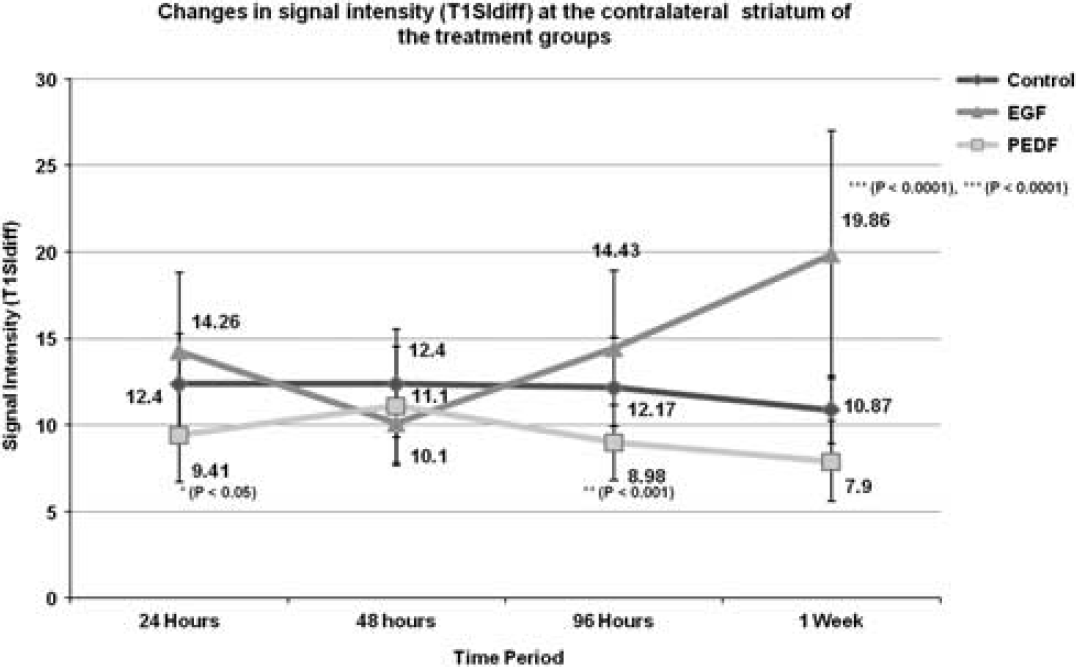
Temporal profile of signal intensity (T1SIdiff) changes at the contralateral striatum of the treatment groups at various time points. Delayed intervention with pigment epithelium-derived factor and epidermal growth factor at 3 hours after reperfusion also demonstrated significant changes in vascular reactivity. The control (saline) group presented with a rather constant value throughout all time points, whereas the epithelium-derived factor (PEDF) group had significantly lower values than the epidermal growth factor (EGF) group at all time points except 48 hours. Moreover, the EGF group values increased steadily from the 48-hour time point.
Effect of Epidermal Growth Factor and Pigment Epithelium-Derived Factor on T2 Values at the Contralateral Striatum
At 24 hours after reperfusion, the T2 value of the EGF group was significantly (89.41 ± 5.6 ms, P < 0.05) higher than the healthy (83.21 ± 4.1 ms) and control (77.66 ± 12.14 ms) groups. By 48 hours only the T2 value of the PEDF group increased significantly (88.44 ± 5.1 ms, P < 0.001) compared with the earlier time point. Moreover, the T2 values of the EGF (88.27 ± 7.1 ms) and PEDF groups were significantly higher (P < 0.05) than both the healthy (83.21 ± 4.1 ms) and control groups (80.53 ± 8.3 ms). At 96 hours the T2 value of the EGF group reversed its course and decreased significantly (78.84 ± 4.3 ms, P < 0.001) compared with the previous time point. By 1 week, the PEDF T2 value (88.59 ± - 4.1 ms) remained significantly (P < 0.05) higher than those of the healthy and control groups (80.99 ± 9 ms). A schematic representation of the data is provided in Supplementary Figure S4.
Effect of Epidermal Growth Factor and Pigment Epithelium-Derived Factor on T2 Values at the Ipsilateral Cortex
At 24 hours after reperfusion, the cortical T2 value of the control group (85.16 ± 14.04 ms) was similar to that of the healthy group (83.87 ± 4.5 ms), whereas the cortical T2 values of the PEDF (91.4 ± 5.9 ms) and EGF (91.7 ± 6.3 ms) groups were significantly higher (P < 0.05) than that of the healthy group. By 48 hours, only the T2 value of the PEDF group demonstrated a significant increase (97.59 ± 7.53, P < 0.05) from the earlier time point. This value was also significantly higher than the healthy (P = 0.0001), EGF (P < 0.05), and control (P < 0.05) groups. At 96 hours, the T2 value of the PEDF group (91.01 ± 4.6 ms) decreased significantly (P < 0.05) compared with the earlier time point but still remained significantly higher (P < 0.05) than the healthy group. By 1 week all the treatment groups exhibited similar values. From 96 hours up to 1 week, the PEDF T2 value remained significantly elevated than the healthy group (P < 0.05). These data are graphically summarized in Supplementary Figure S5.
Animal Mortality
All the treatment groups were brought to a final strength of 10 animals each after mortalities and loss of animals due to experimental errors. In the control (saline) group, four rats died between 18 and 24 hours after reperfusion, probably because of vasogenic edema, one rat died because of air embolism during Gd-DTPA injection and two rats died of undetermined causes between 70 and 92 hours after reperfusion. In the EGF group, four animals died within 24 hours, probably because of vasogenic edema formation and another two animals died between 78 and 90 hours after reperfusion. In the PEDF group, one animal died of exsanguination within 24 hours because of an experimental error involving the internal CA. One rat died of an anesthetic overdose and another one was lost probably because of an air embolism. One more was found dead at 64 hours after reperfusion and the cause remains undetermined.
DISCUSSION
Effect of Epidermal Growth Factor and Pigment Epithelium-Derived Factor on Infarct Volume
Reperfusion of the ischemic brain is the most effective therapy to date for acute ischemic stroke. 15 Despite numerous studies in which neuroprotective compounds have been shown to reduce infarct volumes in animal stroke models and, in some instances, promising phase II results, no neuroprotective compound has proved efficacious on the basis of a positive phase III trial. 16 In the present preliminary study, our aim was to investigate the protective properties of PEDF, if any, and compare the results with those obtained using EGF. Equimolar amounts of both peptides were administered during the early phase of BBB opening following reperfusion after 1 hour of ischemia.10,13 At 1 week, infarct volumes in the PEDF and EGF groups were three and two times smaller, respectively, than those in the control (saline) group.
PEDF, a 50-kDa glycoprotein also known as SERPIN-F1, has demonstrated profound trophic effects on neurons. 17 The mechanisms by which PEDF exerts its protective effects suggest multiple modes of action. Pigment epithelium-derived factor was originally shown to induce a neuronal phenotype in retinoblastoma Y-79 cell line cultures and later to promote survival and protect cerebellar granule neurons in a rat primary culture from acute glutamate toxicity and apoptosis. 18 PEDF also protects postnatal rat motor neurons from chronic glutamate-induced excitotoxicity and downregulates the pro-inflammatory genes such as interleukin (IL)-1β, tumor necrosis factor-α, and macrophage inflammatory protein-1α after quinolinic acid-induced neurotoxicity in rats. 19 In cultured retinal pericytes, PEDF exerts anti-oxidative properties and suppresses ROS formation within microvascular endothelial cells. 20
In contrast to PEDF, EGF is a potent mitogen that promotes cellular proliferation rather than maturation. Epidermal growth factor stimulates endogenous neural precursor cells at the subventricular zone and promotes tissue regeneration in animal models of stroke. 21 Neurons within the MCA territory (lateral cortex and striatum) are rich in EGF receptors and are thus susceptible to administered EGF. 22 The neuroprotective properties of EGF successfully prevent ferrous sulfate–induced lipid peroxidation and ensuing cell death in neuron cultures. 23 Receptors for EGF, basic fibroblast growth factor (bFGF), BDNF, and NGF use similar downstream transduction pathways, and therefore it may be that EGF rescues ischemic neurons by enhancing activities of anti-oxidant enzymes, such as superoxide dismutase, glutathione peroxidase, and catalase. 24
Effect of Epidermal Growth Factor and Pigment Epithelium-Derived Factor on Edema
Consistent with earlier findings, 10 in this study tMCAO resulted in significant increases in T2 values indicative of vasogenic edema formation. In fact, the NTFs were unable to significantly reduce water content within the infarct region. However, edema as determined by changes in ipsilateral hemispheric volume readily exhibited effects of the various interventions. As expected, the PEDF group not only possessed lower edema volumes at all time points but also displayed significant suppression of edema formation at 48 hours. A reduction in vasogenic edema by PEDF was also observed with other models of experimental ischemic stroke 25 and cold brain injury. 26 Overexpression of PEDF in a rodent model of tMCAO blocked the increased expression of aquaporin-4 mRNA associated with edema reduction. 25 Intraperitoneal administration of PEDF in a mouse model of cold brain injury also led to edema reduction mediated by suppression of Rac-1 activation, essential for NADPH oxidase activation. 26 Moreover, PEDF has been shown to stabilize actin, maintain normal membrane occludin and N-cadherin structure, and thus preserve the endothelial tight junction (TJ) function of retinal pigment epithelial cells against oxidative stress. 27 All these properties of PEDF may act in concert to reduce early deleterious effects of I/R injury.
It is noteworthy that even though the percentage increase in ipsilateral HVo in the control and EGF groups peaked at 48 hours, indicating maximal edema accumulation, the T2 values derived from the infarct regions of these groups demonstrated a decrease. T2 values are influenced by many factors, including flow effects, altered levels of oxy- and deoxyhemoglobin, tissue oxygenation, and exchange of nuclear spin magnetization between ‘free’ and ‘bound’ proton pools. 28 Vasogenic edema fluid at the 48-hour after reperfusion time point (when the BBB remains open) also contains protein molecules and its infiltration not only increases water content but also the number of macromolecular surfaces available thereby lessening the change in relaxation rates that would be observed with the same increase in water alone. 29 This mechanism may be the most probable reason for the reduction in T2 relaxation values observed at these times.
Gross anomalies between T2 relaxation values and ipsilateral hemispheric volumes were not observed further and the data remains mutually compatible during subsequent time points even though the underlying causative mechanisms may have varied. A reduction in water content attributed to edema resorption is mediated by a variety of mechanisms including uptake of extravasated proteins by glial cells and the subsequent reduction in oncotic force, migration of edema into cerebrospinal fluid spaces, and effects from proliferating endothelium. 10 Even though these factors primarily mediate the reduction in T2 values and ipsilateral hemispheric volume, other factors, such as necrotic tissue and extravasated protein clearance from the infarct region by infiltrating macrophages and activated microglial cells, can also have a role in altering T2 relaxation characteristics. 30
Temporal Profile of Blood–Brain Barrier Permeability Changes at the Ipsilateral Striatum
The 24-hour post reperfusion time point represents a phase where the BBB permeability is minimal for Gd-DTPA. 10 PEDF demonstrated an additional suppression of permeability even at this early time point. The reasons behind this are believed to reside with the three distinct properties of PEDF; as an antioxidant, an anti-inflammatory agent and protective for TJ proteins such as occludin and cadherin.20,31 Considering the effect of ROS on TJ proteins, it is not surprising that an agent with anti-oxidant properties demonstrates a significant reduction in barrier permeability. Inflammatory mediators such as thrombin, histamine, and bradykinin can also cause BBB permeability changes by actin polymerization-dependent endothelial cell rounding resulting in increased inter-endothelial gaps. 10 As PEDF stabilizes actin and inhibits inflammatory processes, these mechanisms can be additive and act in a synergistic way to minimize barrier permeability.
The dramatic increase in BBB permeability after I/R injury at 48 hours seems to correspond with the time course of the angiogenic response mediated by the vascular endothelial growth factor (VEGF). 32 Vascular hyperpermeability is intricately associated with and is inherent to progressive pathologic angiogenesis, marked by leaky vessels and increased permeability to macromolecules and water, and resulting in an uncontrolled delivery of solutes to the tissue. 33 A wealth of data indicates PEDF as an inhibitor of vascular permeability and angiogenesis. PEDF counteracts VEGF-induced vascular hyperpermeability and inhibits endothelial cell migration toward a variety of angiogenic inducers including platelet-derived growth factor, VEGF, IL-8, acidic FGF, and lysophosphatidic acid.34,35 VEGF exacerbates degradation of occludin and zona occludens-1 in vitro, and the loss of these proteins increases BBB leakage in the human brain. 36 Of the three proposed mechanisms underlying angiogenesis, such as sprouting, intussusception, and recruitment of endothelial progenitor cells, VEGF-induced sprouting mediated through VEGF receptor-2 is invariably accompanied by increased permeability.33,37 In-vitro studies demonstrate that PEDF downregulates VEGF expression and competes with VEGF binding to VEGF receptor-2, thereby adding multiple pathways to inhibit the barrier permeability mediated by VEGF. 31
VEGF also promotes proliferation of vascular endothelial cells and these activated endothelial cells upregulate surface Fas, thereby becoming sensitive to apoptosis when the Fas ligand is activated by inhibitors such as PEDF. 38 Fas-mediated signaling mainly induces procaspase-8 auto-proteolytic cleavage, although it may subsequently cause activation of procaspase-9. PEDF increases the expression and transcriptional activity of peroxisome proliferator-activated receptor-γ (PPARγ) in human umbilical vein endothelial cells and PEDF's action on PPARγ results in apoptosis of endothelial cells perhaps mediated through p53. Researchers have also demonstrated that an inhibitor to p38 mitogen-activated protein kinase extensively blocks PPARγ mRNA and protein expression. 39 The aforementioned properties of PEDF involved in ameliorating vascular permeability and angiogenesis may act in concert to arrest the progression of infarct volume while suppressing BBB permeability and edema formation.
Effect of Epidermal Growth Factor and Pigment Epithelium-Derived Factor on Edema at Remote Sites
Throughout the experiment, those animals receiving growth factor therapy selectively demonstrated significant elevations in T2 values at distant regions away from the site of infarct. Even though the precise underlying mechanisms remains unknown, we suspect that the movement of protein-rich edematous fluid from the lesion site to other regions (routed protein migration) is mediating this remote edema formation as stated previously. 10 Elevated T2 values in the EGF group were observed relatively early, at 24 hours, whereas a persistent T2 value elevation was observed with PEDF. Epidermal growth factor possesses a low tortuosity (λ) value of 1.8 and this low resistance to migration may cause the elevated T2 value as seen at the early time point of 24 hours. 40 Eight times heavier than EGF, PEDF might have induced a rather persistent elevation in T2 values as observed with this group. As the core body temperatures of all animals were maintained at 37.5–37.7°C any influence of temperature on T2 values may be safely ruled out. A detailed investigation of the underlying cause was beyond the scope of this work as further efforts are required in this direction to clarify the observed increase in T2 values.
Temporal Profile of T1SIdiff Changes at the Contralateral Striatum
The fact that the T1SIdiff values were lower for the PEDF group than the EGF group, especially at later time points, when the values of the EGF group were increasing significantly presents an interesting insight into the persistent effects of PEDF. It has been reported that PEDF may reduce edema by interfering with the VEGF–NADPH oxidase pathway. 26 ROS may serve as important signaling molecules in the cerebral circulation and, in contrast to systemic arteries, major products of superoxide metabolism, such as hydrogen peroxide, are powerful cerebral vasodilators raising the possibility that ROSs represent important molecules for increasing local cerebral blood flow. 41 In cerebral arteries, NADPH oxidases along with cyclooxygenases and lipoxygenases, are considered the probable primary sources of ROS formation and activation of NADPH oxidase elicits both an increase in superoxide production and vasodilatation.
PEDF's anti-oxidant properties coupled to inhibition of the VEGF–NADPH oxidase pathway could effectively suppress the vasodilatory mechanism. Epidermal growth factor acting through the mitogen-activated protein kinase signaling cascade has already demonstrated a dose- and time-dependent increase in the endothelial nitric oxide synthase levels. 42 Our earlier work also demonstrated such a vasodilatory effect from repeated exposures to isoflurane at the scanner. 10 Thus, treatments with EGF and exposure to isoflurane may be additive in inducing endothelial nitric oxide synthase and resulting in the observed T1SIdiff increase attributed to cerebral vasodilatation.
CONCLUSION
To the best of our knowledge, this is the first study in which the protective properties of systemic PEDF were evaluated in a rodent model of transient ischemic stroke. Although neuroprotection is warranted immediately during or after injury, the relatively late intervention at 3 hours after reperfusion by selected NTFs at the time of the first BBB opening demonstrated protective effects after I/R injury, as evident from reduced T2-LVs and edema formation. The potent anti-angiogenic action of PEDF is probably the key factor behind the arrested infarct volume expansion observed at 48 hours after reperfusion. However, additional investigations are required to clarify the impact of a persistent inhibition of BBB permeability and/or angiogenesis because this would impact post-ischemic repair mechanisms and final functional outcome.
DISCLOSURE/CONFLICT OF INTEREST
The authors declare no conflict of interests.
Footnotes
References
Supplementary Material
Please find the following supplemental material available below.
For Open Access articles published under a Creative Commons License, all supplemental material carries the same license as the article it is associated with.
For non-Open Access articles published, all supplemental material carries a non-exclusive license, and permission requests for re-use of supplemental material or any part of supplemental material shall be sent directly to the copyright owner as specified in the copyright notice associated with the article.