
Abstract
Positron emission tomography (PET) with 15O-labeled water can provide reliable measurement of cerebral blood flow (CBF). Quantification of CBF requires knowledge of the arterial input function (AIF), which is usually provided by arterial blood sampling. However, arterial sampling is invasive. Moreover, the blood generally is sampled at the wrist, which does not perfectly represent the AIF of the brain, because of the effects of delay and dispersion. We developed and validated a new noninvasive method to obtain the AIF directly by PET imaging of the internal carotid artery in a region of interest (ROI) defined by coregistered high-resolution magnetic resonance angiography. An ROI centered at the petrous portion of the internal carotid artery was defined, and the AIF was estimated simultaneously with whole brain blood flow. The image-derived AIF (IDAIF) method was validated against conventional arterial sampling. The IDAIF generated highly reproducible CBF estimations, generally in good agreement with the conventional technique.
INTRODUCTION
Quantification of cerebral blood flow (CBF) is important for the understanding of normal and pathologic brain physiology. While several imaging techniques for measuring CBF have been described, 1 positron emission tomography (PET) with [ 15 O]H2O2,3 is the current gold standard, 4 especially when absolute measures are of interest. [ 15 O]H2O-PET is commonly used in conjunction with other 15 O tracers, i.e., [ 15 O]CO and [ 15 O]O2, to measure cerebral blood volume 5 and cerebral oxygen metabolic rate.2,6 To quantify these parameters, mathematical modeling is required, for which knowledge of the arterial input function (AIF) is a prerequisite.2,3 Currently, arterial blood sampling is the standard approach for obtaining the AIF; however, this is invasive and technically challenging. Therefore, investigation of other approaches for estimating the AIF is warranted.
Several approaches have been developed to estimate the AIF without arterial blood sampling. One approach calibrates a population template AIF to each specific scan,7,8 but this approach neglects individual differences in physiology and uncontrolled timing variability of tracer introduction. A second approach applies partial volume correction to region of interest (ROI) time-activity curves (TACs) obtained from imaging major blood pools, such as large arteries and the cardiac ventricles.9,10 An approach based on factor analysis has also been developed and validated for AIF estimation;11,12 a difficulty with this approach is that the linear system does not have a unique solution and additional information, such as radioactivity measurements in a few blood samples, is generally required to calibrate the estimated AIF.11,13 Simultaneous estimation of both AIF and tracer kinetic parameters has been proposed but this requires full kinetic modeling and assuming a particular mathematical model of the AIF.14–16 Although considerable effort has been devoted to the development of image-based AIF estimation, a reliable method is still unavailable. In fact, a recent study evaluating eight methods for quantitative estimation of the cerebral metabolic rate of glucose utilization 17 found that none reliably estimates the AIF or cerebral metabolic rate of glucose utilization in human brain without the requirement for taking blood samples.
Here, we present a noninvasive image-derived AIF (IDAIF) method that uses coregistered high-resolution magnetic resonance angiography (MRA), which identifies the precise location of the carotid artery. A joint estimation approach is used to estimate the AIF and CBF. The proposed method was tested for reproducibility and also validated against the conventional technique based on arterial blood sampling.
MATERIALS AND METHODS
Human Subjects
Imaging data were acquired in healthy volunteer subjects without history of neurologic disorders. All procedures were approved by the Human Studies and the Radioactive Drug Research Committees at our institution. Subjects provided written informed consent and were paid for their participation. Of these subjects, a first group of eight participants (age 29 ± 6 years, 4 females) was recruited to test the reproducibility of the CBF measurements as well as to compare two different PET scanners. Each subject in this group underwent four repeated [ 15 O]H2O scans in a single session on a Siemens EXACT 962 HR + scanner (Siemens Medical Solutions USA, Inc., Mallvern, PA, USA), and another four 15 O-water scans in a single session on a Siemens Biograph 40 PET/CT scanner (Siemens Medical Solutions USA, Inc.). Each [ 15 O]H2O scan started with 35 2-second frames, followed by six 5-second frames and eight 10-second frames. The PET images were reconstructed using filtered-back projection method without smoothing. A second group of 12 participants (age 30 ± 7 years, 6 females) completed the study to validate the IDAIF method against the conventional arterial sampling AIF (ASAIF) technique. Each subject in this group underwent one [ 15 O]H2O scan on the Siemens EXACT 962 HR+ scanner with frame setup similar to group 1. During these PET studies, arterial blood was withdrawn at 5 mL/min from the radial artery through narrow bore tubing to a lead shielded scintillation detector that measures positron emissions with 1 second temporal resolution. 18 Blood sampling started simultaneously with time-binned PET scanning and continued for 2 min. Each participant in both groups also underwent MRI using a Siemens Trio 3T scanner (Siemens Medical Solutions USA, Inc.), which included one Magnetization Prepared Rapid Gradient Echo (MPRAGE) scan and one time-of-flight MRA scan.
Image Processing
Cross-modal registration, i.e., MPRAGE to PET and MRA to MPRAGE, was achieved using the vector gradient method. 19 Within modality registration, e.g., PET to PET, was achieved using standard techniques 20 implemented with an in-house software. Atlas registration (12-parameter affine) was performed via the MPRAGE against a template representing young healthy volunteers using the same software. A modified adaptive segmentation algorithm 21 was used to automatically segment the MRA images into three tissue types, (1) arteries (Figure 1A); (2) signal contributing tissue, i.e., brain tissue, muscle, etc.; and (3) nonsignal contributing structures, i.e., bone, cerebrospinal fluid, and airways. Three versions of arterial ROIs (ROIa) were created for AIF estimation. The first version (ROIa1) was centered on the left and right petrous segments of the internal carotid arteries, which were manually defined based on the automatically segmented arteries (Figure 1B). The second version (ROIa2) used all the arterial regions in a rectangular box (7 cm × 9 cm × 3.5 cm) defined in the atlas space centered at the petrous portion of the internal carotid artery (Figure 1C). The third version (ROIa3) used all arterial regions within the time-of-flight MRA field of view, less a 1.5-cm border to minimize the boundary effects (Figure 1D). FreeSurfer v5.1 (Martinos Center for Biomedical Imaging, Charlestown, MA, USA) was used to segment the MPRAGE image. Three additional ROIs were defined based on the FreeSurfer segmentation: a whole-brain ROI (ROI1), a cortical gray matter ROI (ROI2), and a deep white matter ROI (ROI3) (Figure 2) to facilitate IDAIF and CBF estimation as described below.
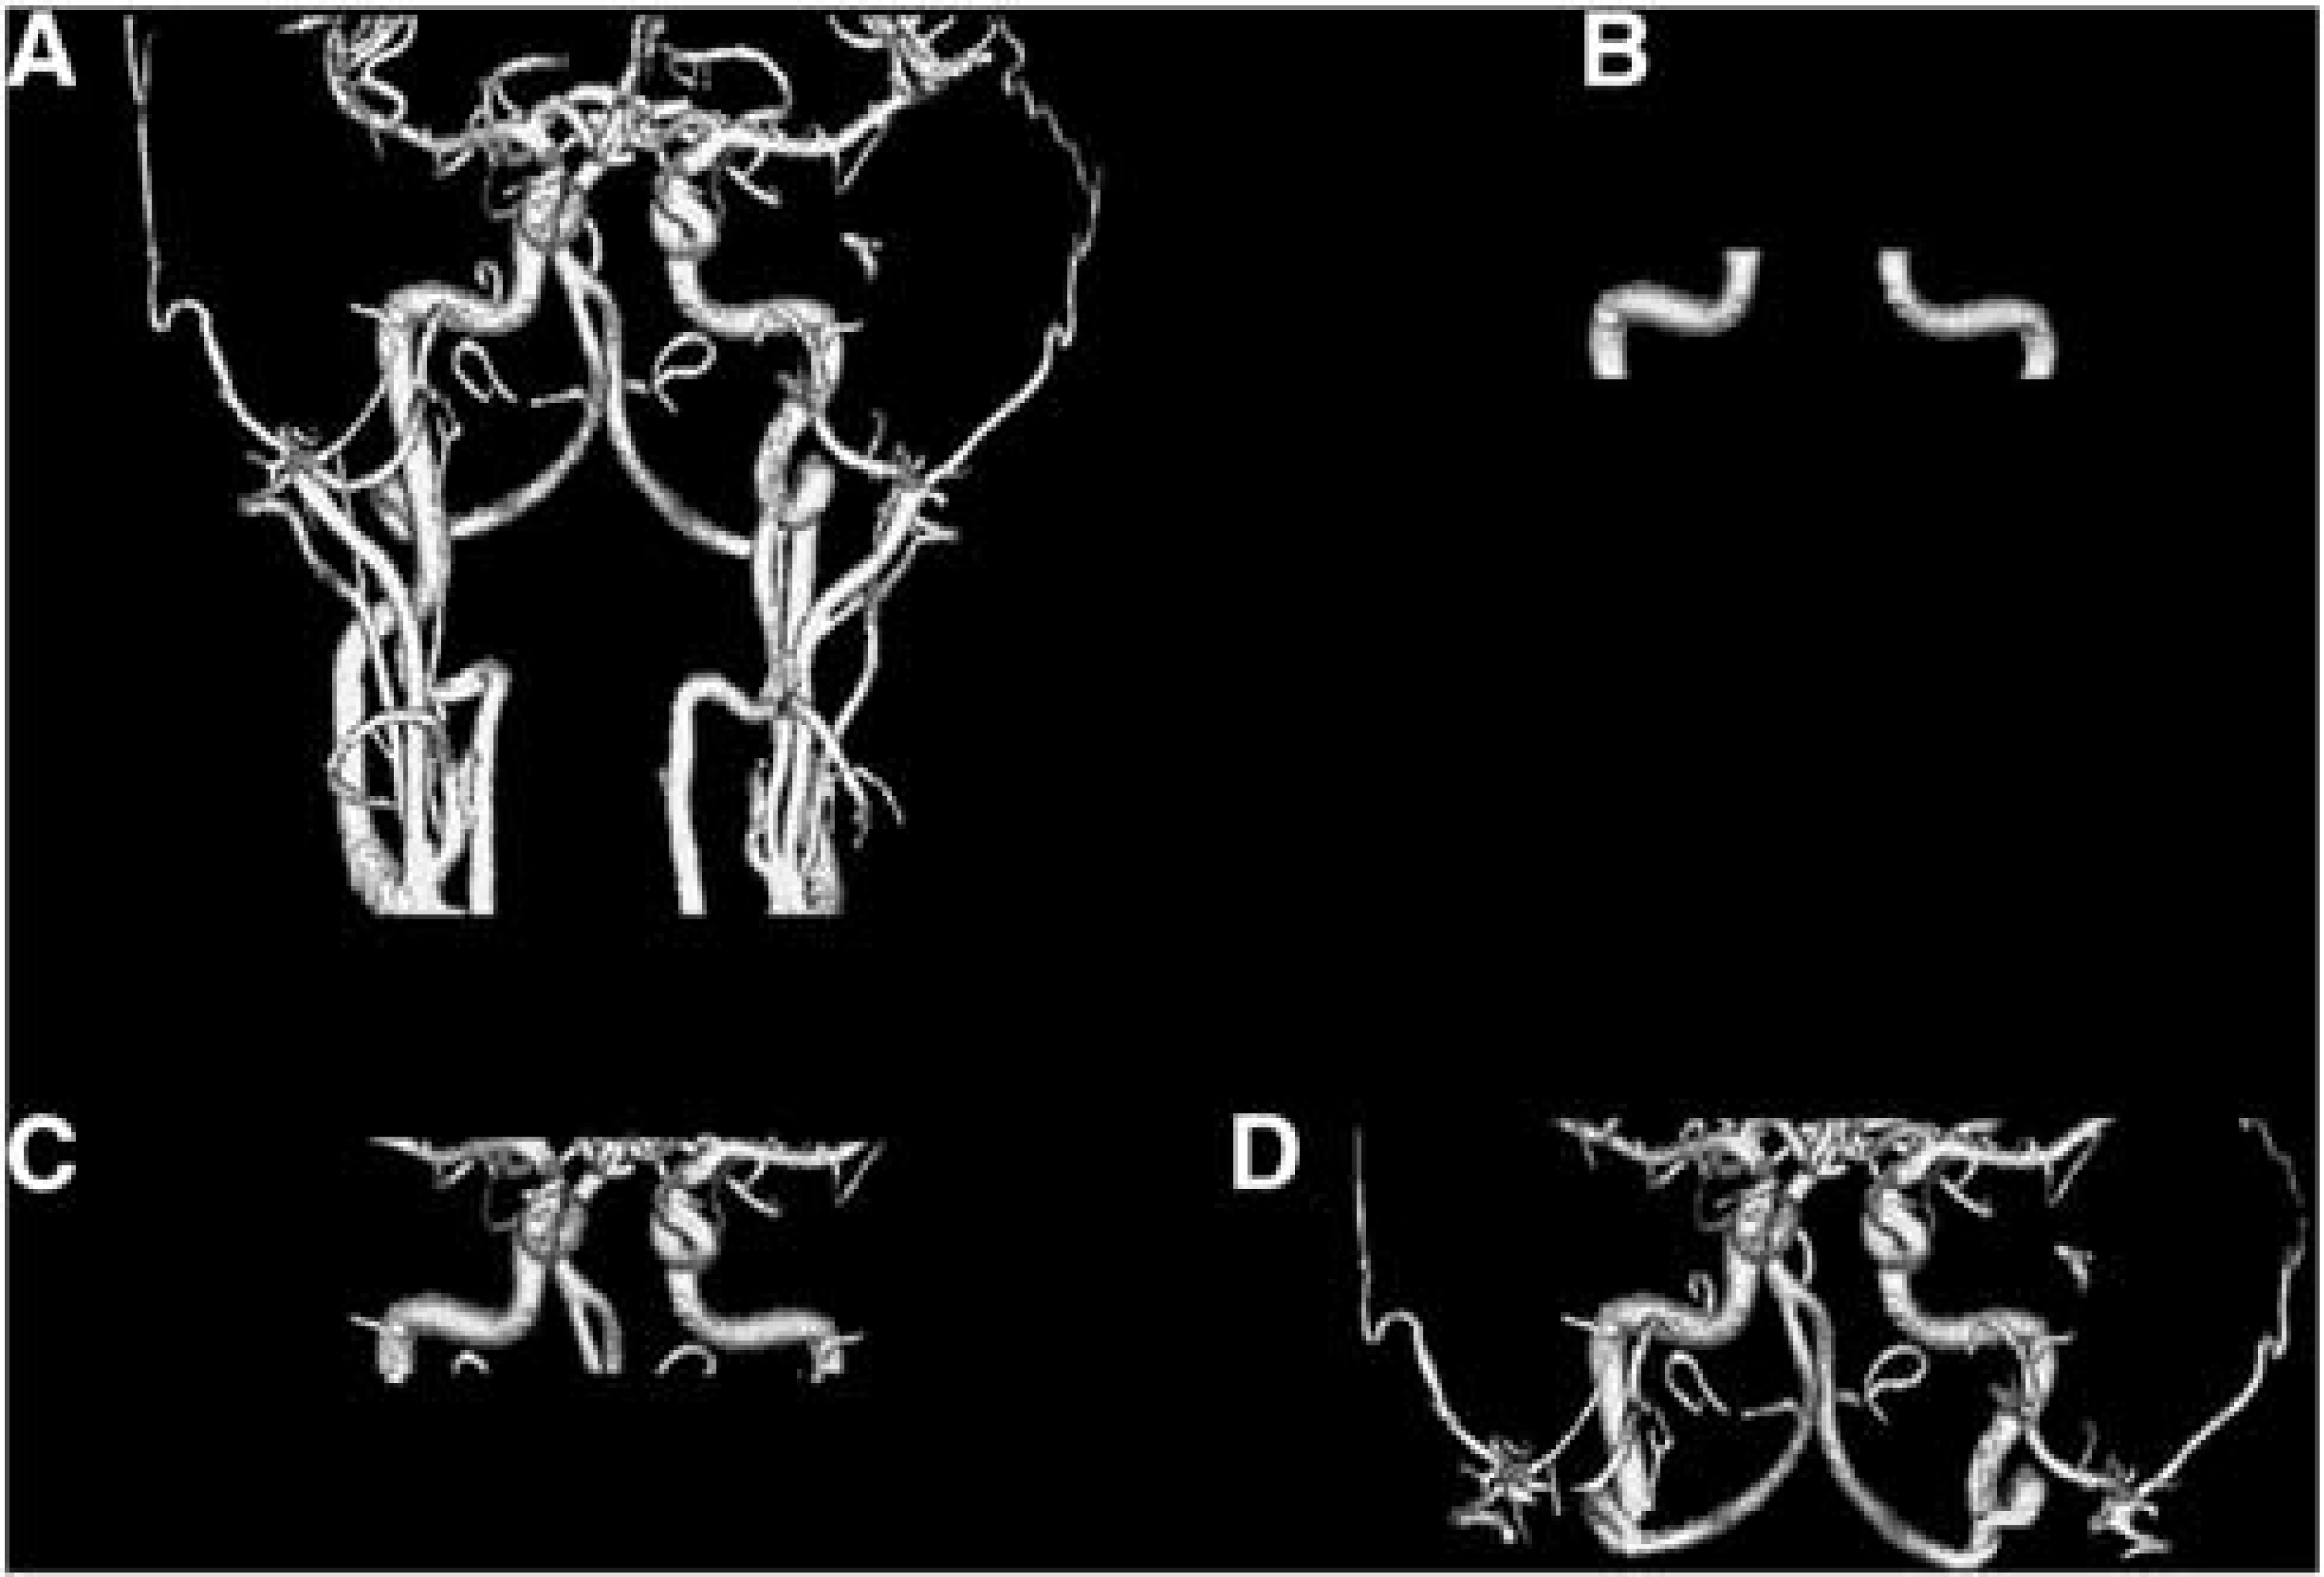
Three-dimensional rendering of segmented artery from the time-of-flight magnetic resonance angiography images (
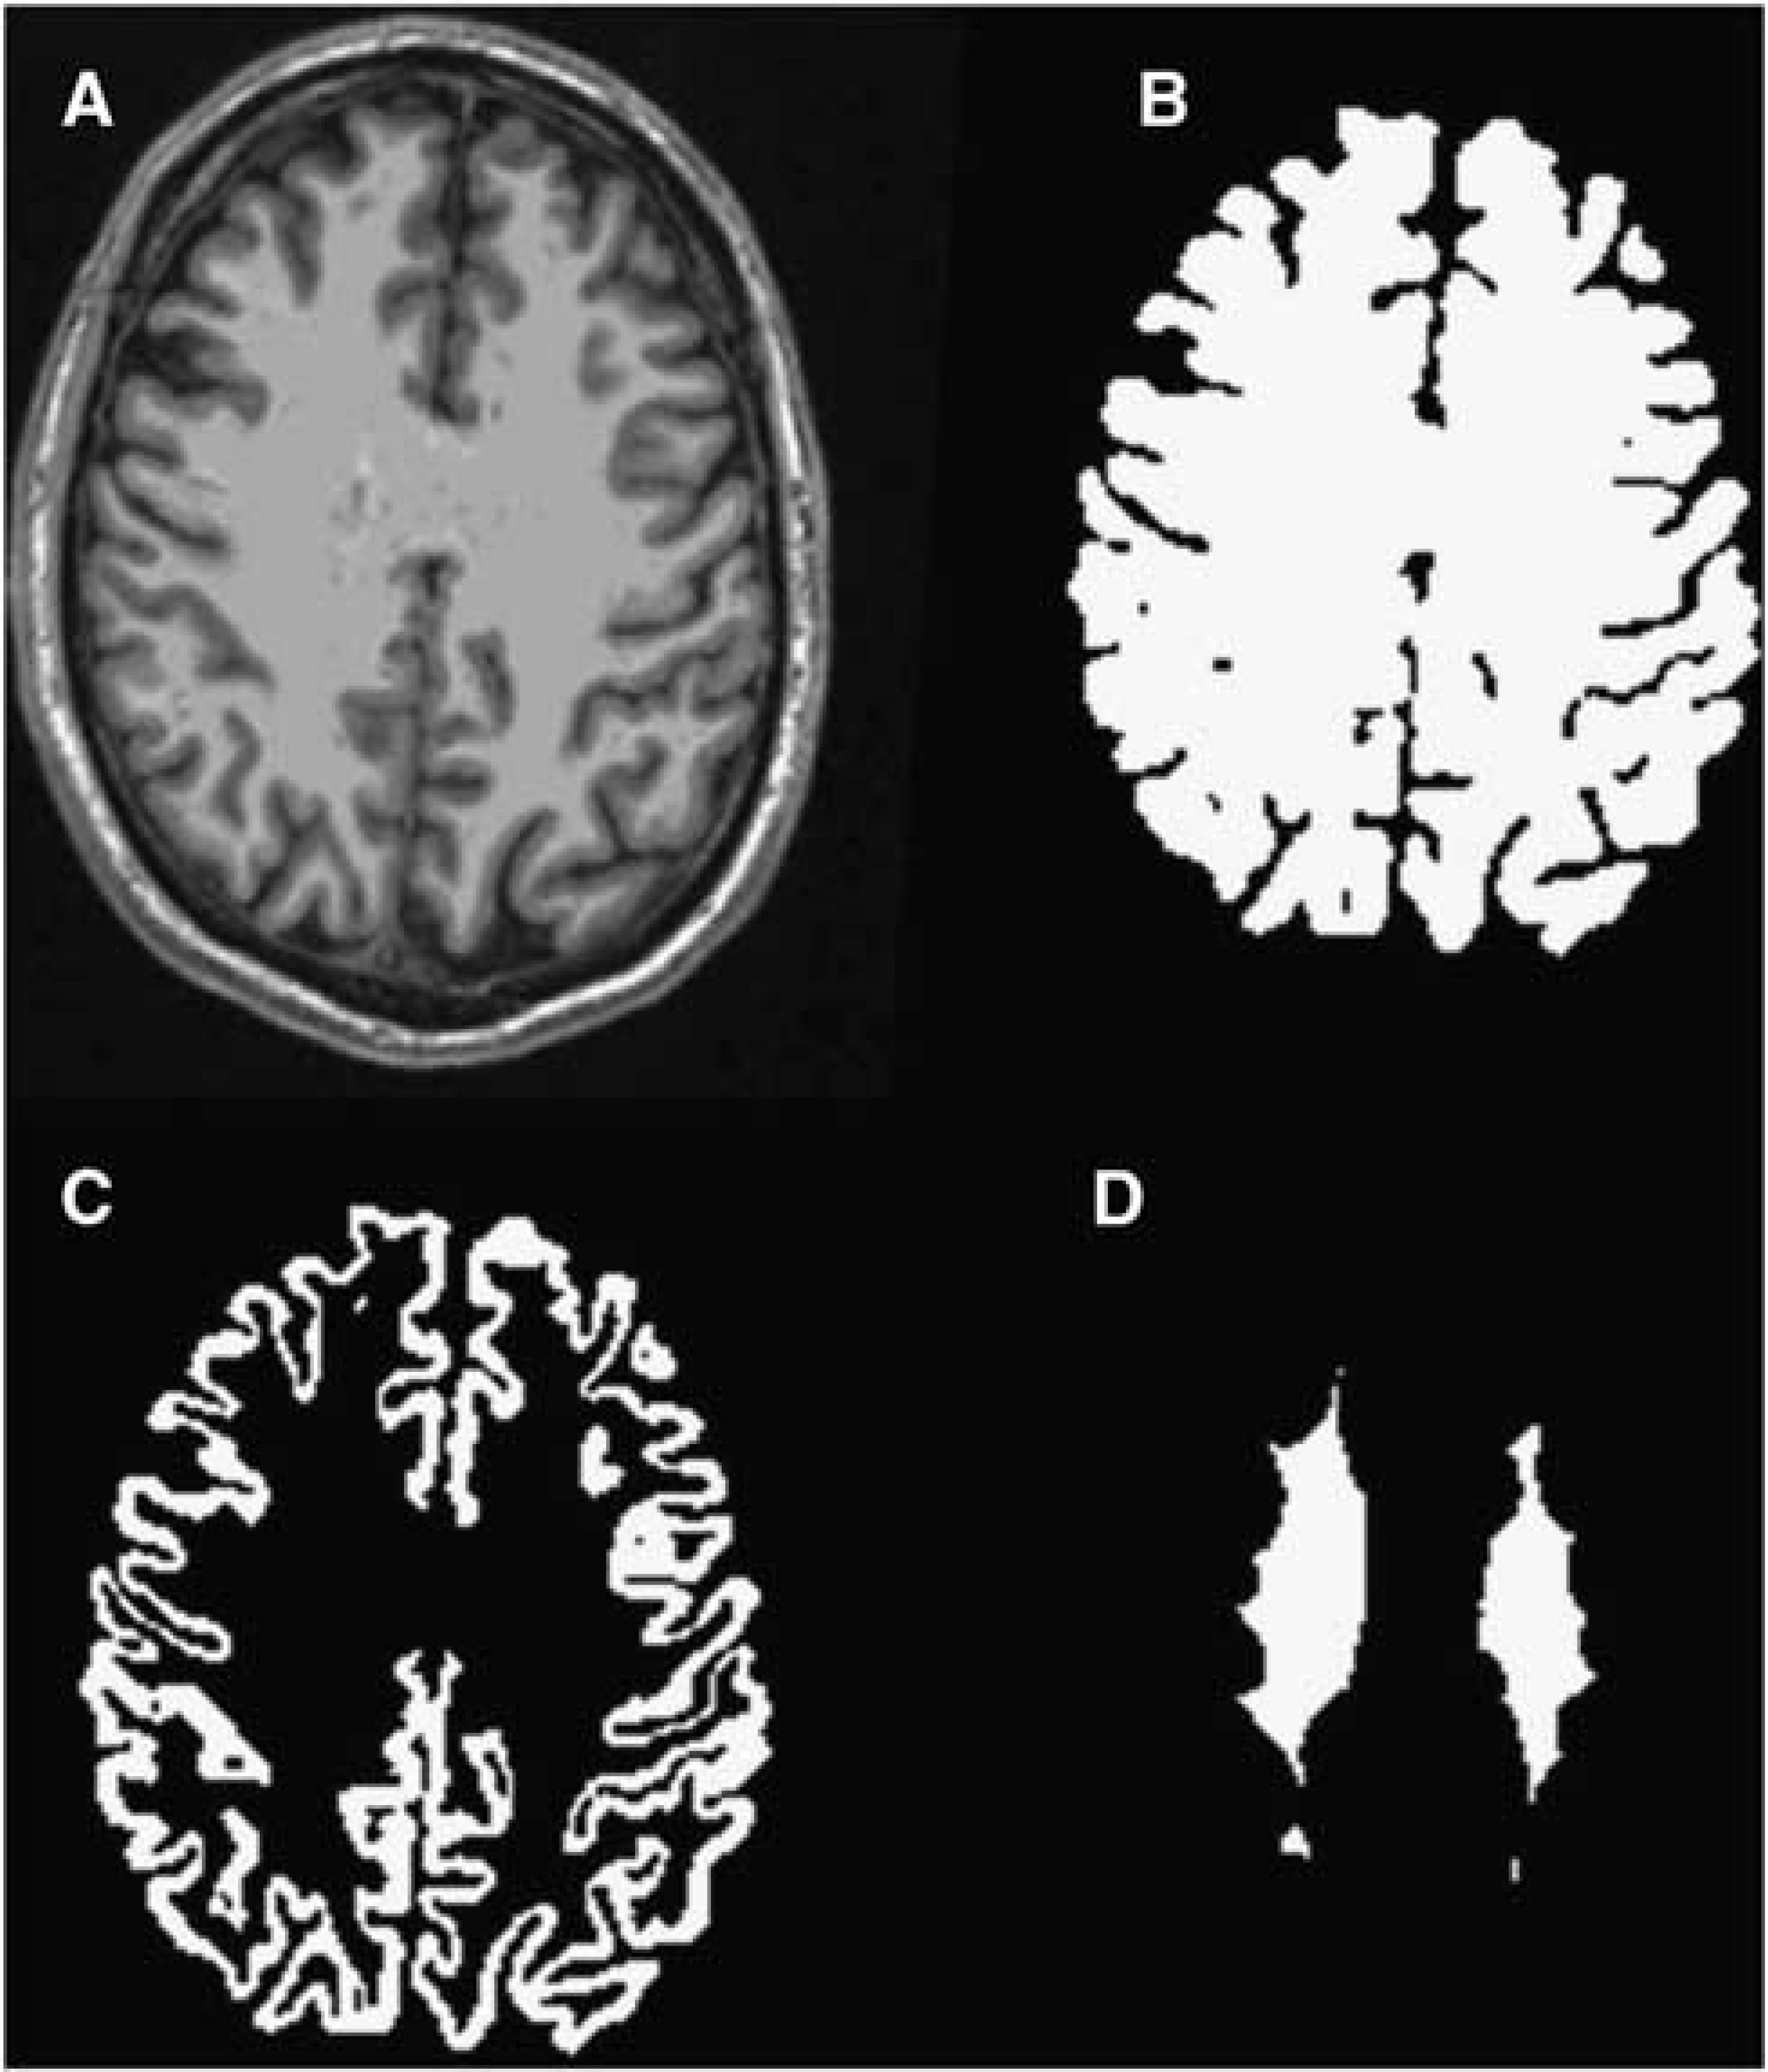
Example Magnetization Prepared Rapid Gradient Echo (MPRAGE) images (
Image-Derived Arterial Input Function Method
The primary difficulty in PET image-based AIF estimation is limited spatial resolution. The diameter of the arteries feeding the brain is comparable to or smaller than the spatial resolution of PET (nominally, 6 mm).
22
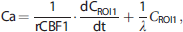
Simple ROI-based measurement greatly underestimates the peak portion of the AIF because of partial volume effects. To account for limited spatial resolution, the PET data were modeled as a linear mixture of the true arterial signal and a surrounding tissue component (Equation 1).
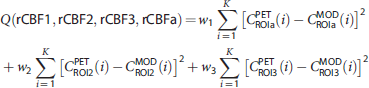
To estimate the AIF, we adopted a simultaneous estimation approach, in which three additional ROIs were defined to obtain three distinct TACs. The AIF (Ca) was estimated by minimizing the following cost function:
Cerebral Blood Flow Calculation with Arterial Sampling (Arterial Sampling Arterial Input Function)
Estimation of CBF on the basis of arterial sampling currently is the gold standard. Nevertheless, this technique is systematically biased by delay and dispersion caused by both the finite length of tubing between the wrist and the activity detector and hemodynamic differences between the radial artery and the arterial blood supplying the brain.
18
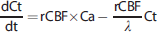
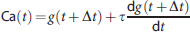
A modeling approach was adopted to estimate delay, dispersion, and rCBF simultaneously within the whole-brain ROI based on the following equation:25–27
Statistical Analysis
In experiment 1, in which each subject had four repeated [ 15 O]H2O scans, reproducibility of estimated hemodynamic parameters was evaluated as the within-subject, repeated measures standard deviation (SDw) of whole-brain CBF. The within-subject coefficient of variation (CVw%) was estimated as the percentage ratio of SDw to the mean CBF for a particular subject.
To evaluate the agreement of CBF estimated with the ASAIF versus IDAIF, intraclass correlation (ICC) coefficients were calculated
28
in addition to Pearson's correlation. Absolute (Δ) and percentage differences (Δ%) were also evaluated in individuals according to the formula,
RESULTS
Study Group 1: Within-Subject Reproducibility and Comparison of Two Scanners
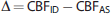
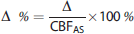
Example brain ROI TACs and the IDAIF are illustrated in Figure 3. Table 1 lists estimated whole-brain rCBF (rCBF1) based on data acquired on the HR+ scanner for the eight subjects in group 1. The mean within-subject coefficient of variation (CVw) for rCBF1 estimated using the three alternative arterial ROIs (Figures 1B and 1D) was 7.83%, 6.38%, and 6.08%, respectively. This result shows that IDAIF-based CBF estimation is only moderately affected by the selected aROI. This property most likely reflects calculation of the AIF using the whole-brain TAC. The rCBF measurements obtained using the PET/CT scanner were comparable to those obtained using the HR+ scanner as assessed by intrasubject variability and mean value. The two sets of measurements were also highly correlated (r = 0.9553) (Figure 4).
Whole brain cerebral blood flow (CBF) (mL/100 g per minute) estimation using image-derived arterial input function on the EXACT 962 HR+ scanner with three different versions of arterial ROI (ROIa)
ROIa1 has the least number of voxels while ROIa3 had the largest number of voxels. Within-subject standard deviation (SDw) and within-subject coefficient of variation (CVw%) were also reported.
Example time-activity curves for whole brain (WBTAC), cortical gray matter (GMTAC), deep white matter (WMTAC), and estimated image-derived arterial input function (IDAIF). PET, positron emission tomography.
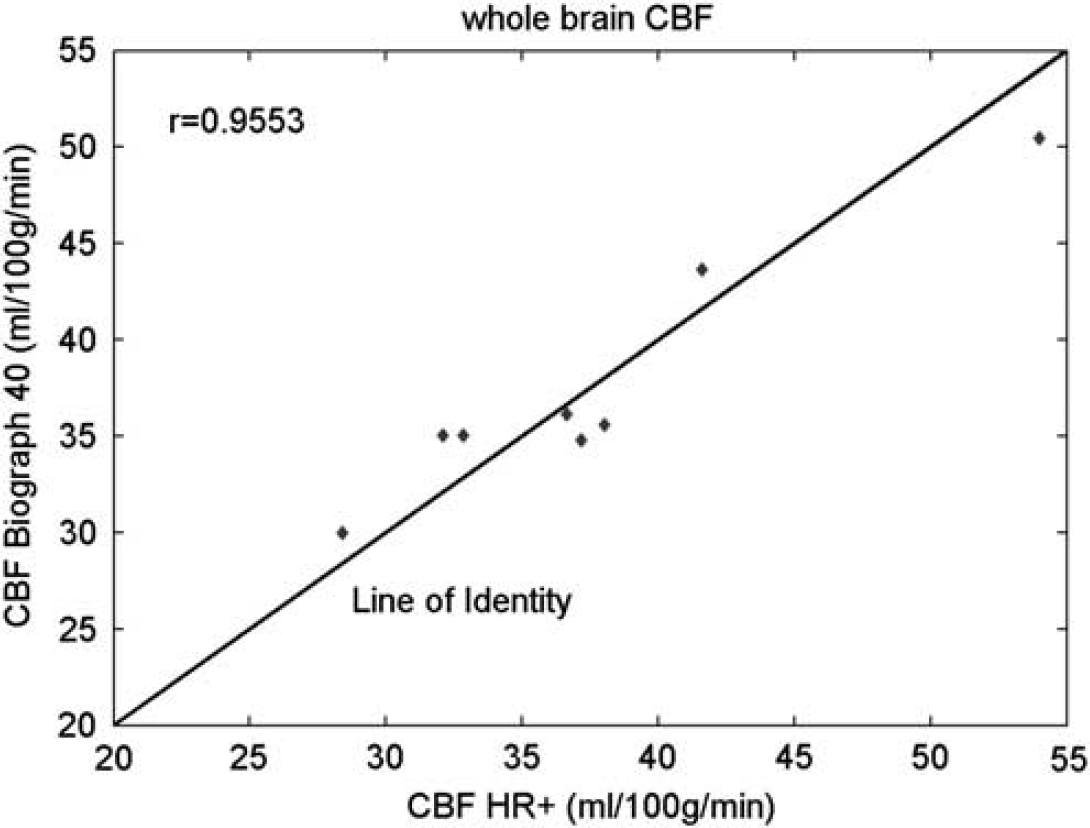
Comparison of whole-brain cerebral blood flow (CBF) measurements on the EXACT 962 HR+ scanner and the Biograph 40 PET/CT scanner.
Study Group 2: Image-Derived Arterial Input Function Versus Conventional Arterial Sampling
Table 2 lists whole-brain CBF estimated in the same subjects, using both the arterial sampling technique and the image-based technique. An example IDAIF together with a delay and dispersion corrected ASAIF is illustrated in Figure 5. Among the 12 data sets analyzed, 2 of them (#11 and #12) were identified as outliers. Extremely low blood flow was observed in data set #11; we suspect that this anomaly is because of excessive patient motion. Data set #12 had unusually large dispersion factor and long delay time, indicating possible arterial sampling failure. Excluding these two outliers, the ICC between whole-brain CBF computed by ASAIF and IDAIF (arterial ROIa2) was 0.77. The Pearson's correlation between the two measurements was 0.89 (P = 0.0006) excluding the outliers. Mean whole-brain CBF estimated using the IDAIF technique was 2.67 mL/100 g per minute, or 7.66% greater than the result obtained using the ASAIF technique. The absolute and relative difference was calculated between IDAIF (ROIa2) and ASAIF. The visual cortex gray matter rCBF using the two approach was also highly correlated (r = 0.93; P = 0.0001; ICC = 0.82), the IDAIF-based rCBF was 4.26 mL/100 g per minute, or 9.51% greater than the result obtained using the ASAIF technique.
Whole brain CBF (mL/100 g per minute) measurements obtained using the arterial sampling technique (ASAIF) and the image-derived AIF (IDAIF) technique with three different versions of arterial ROIs (ROIa1, ROIa2, and ROIa3) as well as the absolute (Δ) and relative difference (Δ%)
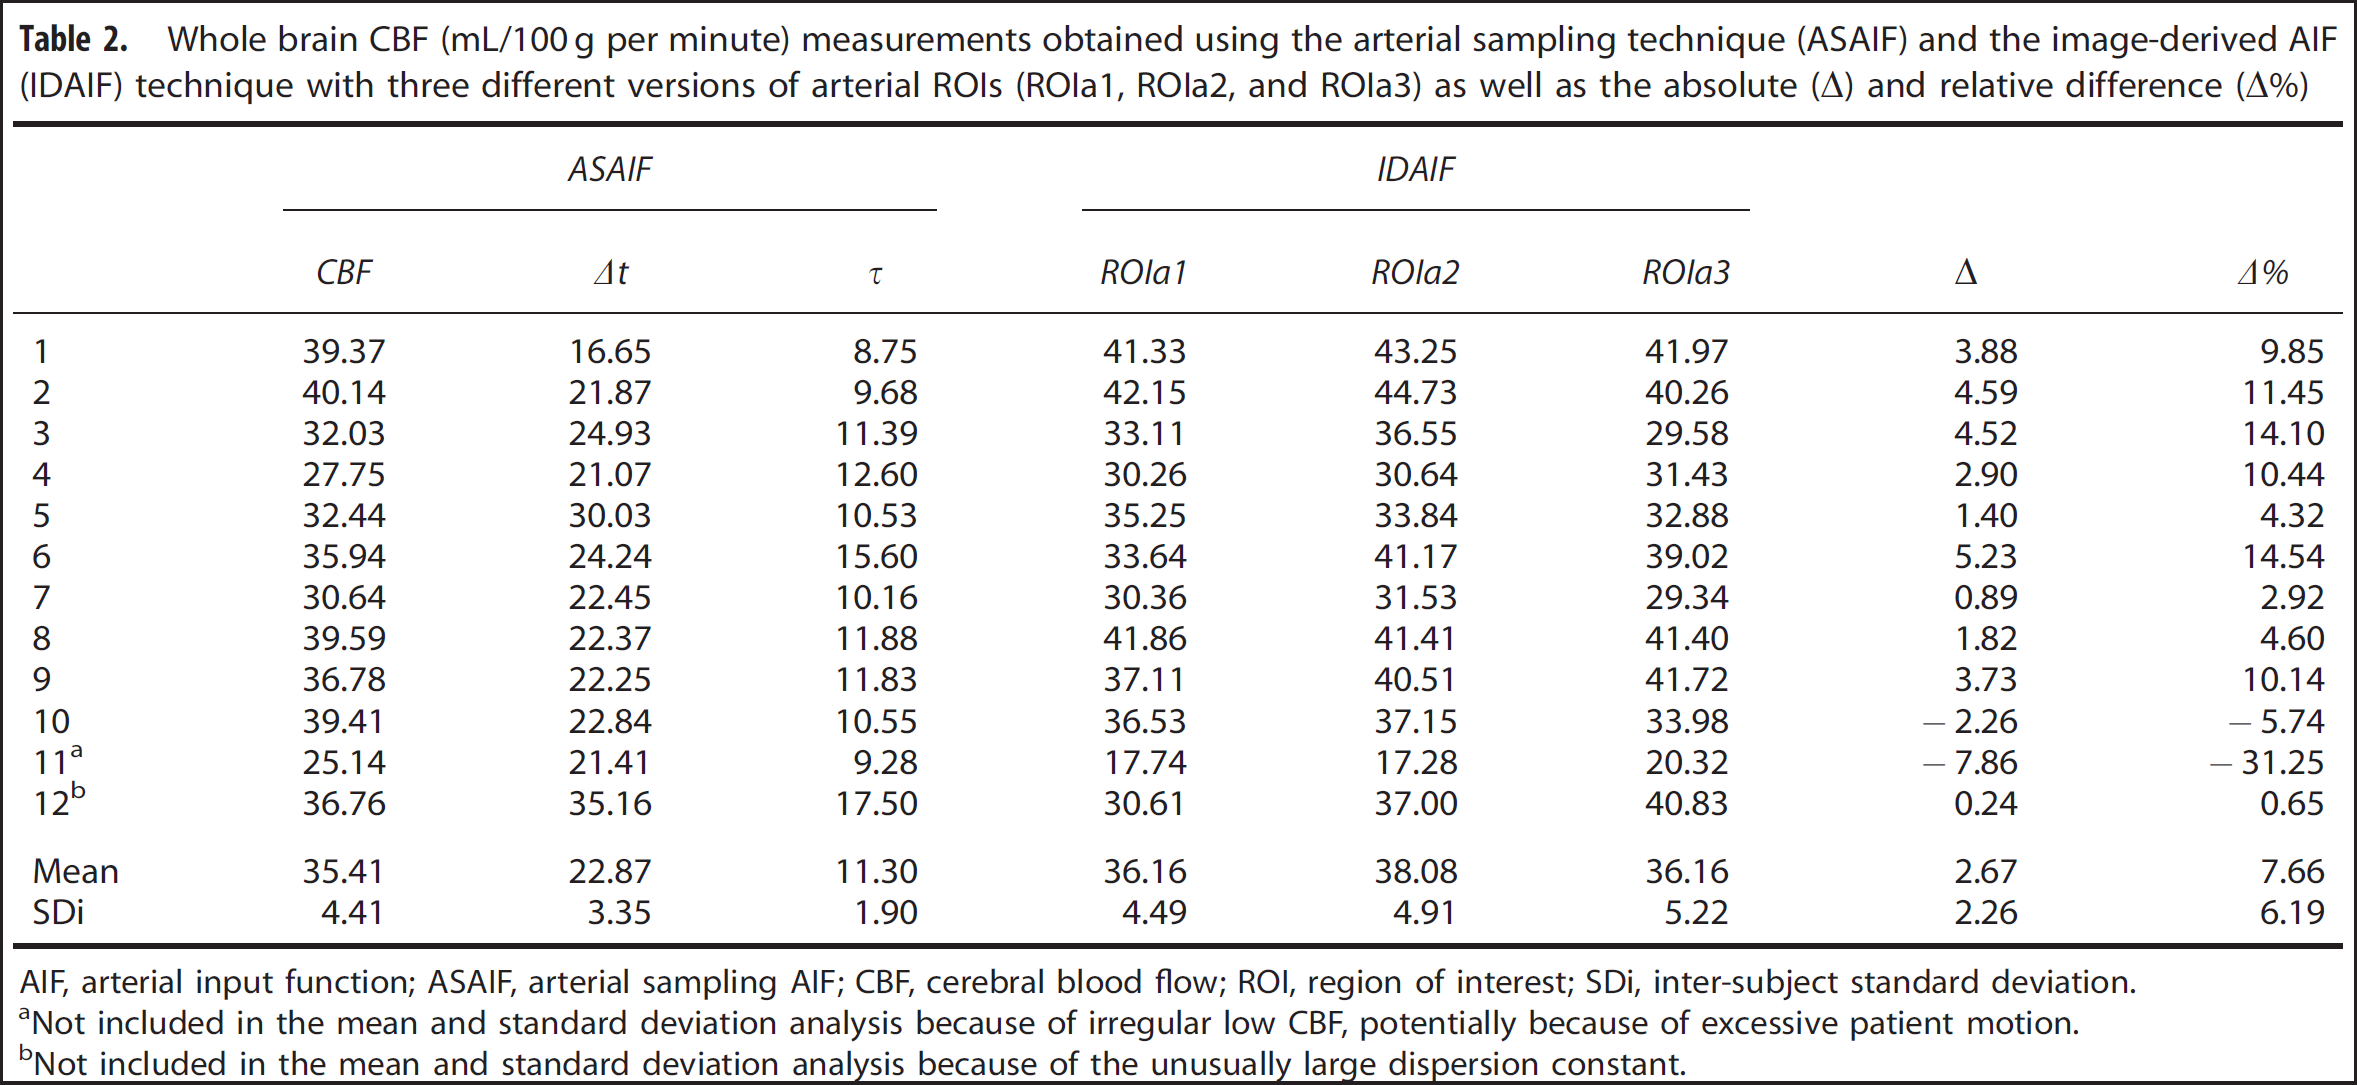
AIF, arterial input function; ASAIF, arterial sampling AIF; CBF, cerebral blood flow; ROI, region of interest; SDi, inter-subject standard deviation.
Not included in the mean and standard deviation analysis because of irregular low CBF, potentially because of excessive patient motion.
Not included in the mean and standard deviation analysis because of the unusually large dispersion constant.
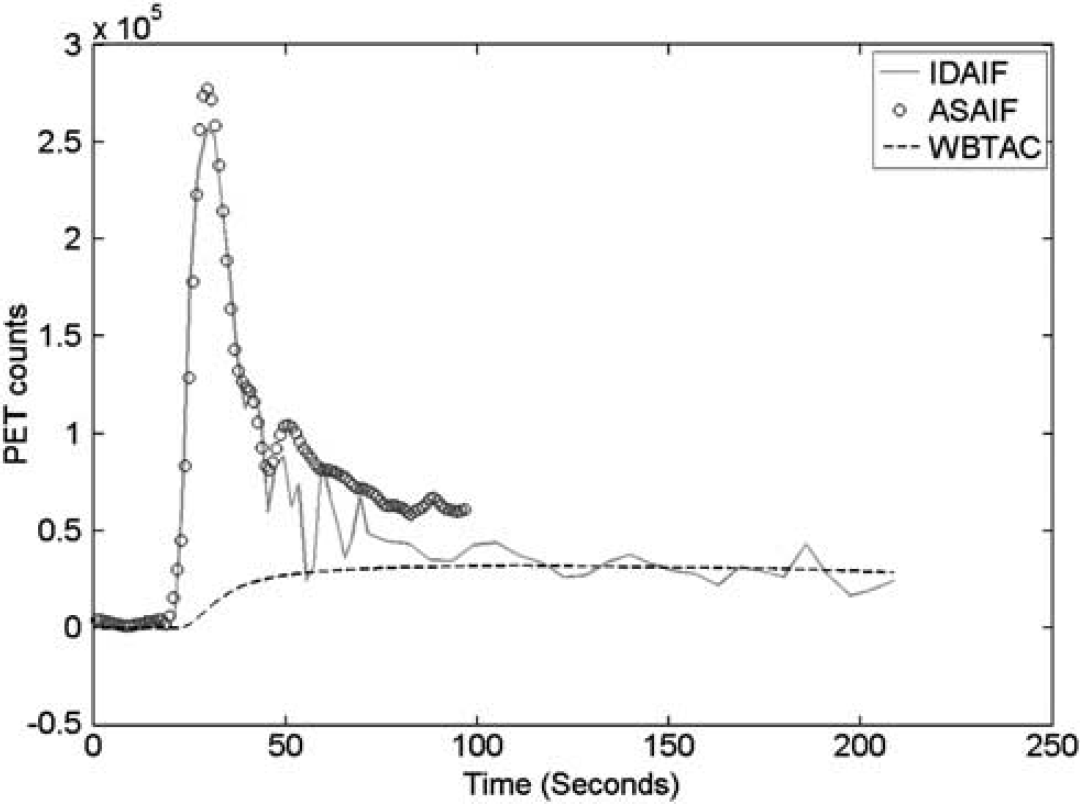
Example image-derived arterial input function (IDAIF), arterial sampling data after correction for delay and dispersion (ASAIF) and time-activity curves for whole brain (WBTAC). ASAIF, arterial sampling arterial input function; PET, positron emission tomography.
DISCUSSION
Reproducibility
The IDAIF technique generated highly reproducible whole-brain CBF measurements as assessed by CVw%. Presently obtained CVw% values were comparable to previously reported results for CBF measured with PET using conventional arterial sampling 23 as well as CBF measured with MRI using arterial spin labeling. 29 Whole-brain CBF measured on the two scanners (HR+ and PET/CT) was not only correlated but also virtually identical.
Image-Derived Arterial Input Function Versus Arterial Sampling Arterial Input Function
The presently described IDAIF method relies on empirical calibration of the effective scanner resolution to obtain results comparable to the conventional ASAIF technique. The presently tabulated results were obtained using an empirically derived scanner resolution of 8.3 mm FWHM, based on a single scan. Reasonably good agreement between IDAIF and the conventional technique (ASAIF) was observed, although IDAIF yielded systematically greater whole-brain CBF values (mean difference 2.67 mL/100 g per minute, or 7.66%). Recalibration based on all presently available group two data yielded an effective scanner resolution of 8.7 mm FWHM, eliminated systematic whole-brain CBF differences and increased ICC from 0.77 to 0.90. For the visual cortex gray matter, after recalibration, the ICC improved from 0.82 to 0.93, and the mean difference reduced to 0.74 mL/100 g per minute, or 1.31%.
Physical PET scanner resolution depends on gantry geometry, 30 the isotope being imaged 31 and location in the field of view. Reported FWHM values for the HR+ scanner varied from 4.3 mm at the field of view center to 8.3 mm at the extreme periphery. 30 Another study reported that a 5-mm FWHM Gaussian filter was needed to smooth PET images acquired on an HR+ scanner to obtain 8 mm FWHM; 22 this translates to a scanner resolution of ~6.2 mm FWHM. The difference between 6.2 mm FWHM and the presently obtained empirical value of 8.3 to 8.7 mm is likely attributable to errors in the arterial segmentation algorithm and the finite resolution of the time-of-flight MRA image: a segmentation procedure too generous in labeling voxels as the artery would cause overestimation of the recovery coefficient, r, in Equation (2). It should be noted that the spatial resolution of the image is also dependent on the reconstruction algorithm used, this may also be part of the reason the effective resolution based on our calibration was different from what was reported in the literature. Once the empirical calibration has been performed, the same image reconstruction method should be used for future studies to avoid biases. Regardless of the source of error, IDAIF is highly sensitive to the value used as the empirical PET scanner resolution: decreasing the FWHM by 0.5 mm results in overestimation of CBF by ~10%. One implication of these considerations is that consistent placement of subjects in the PET scanner will be important in applying IDAIF in practice. In the present work, if we had used the often-quoted value of 4.3 mm FWHM 30 in Equation (1), CBF would have been overestimated by ~90%. This effect probably accounts for the previously reported 104% overestimation of blood flow using an IDAIF technique. 25 It should be noted that the spatial resolution of PET scanner varies across the field of view; therefore, an effective resolution is determined by empirical calibration. This parameter is likely to be different for different choice of arterial ROIs, which is part of the reason for different CBF estimated as shown in Tables 1 and 2. However, different choice of aROI may be necessary, for example, in cases of subjects with partially occluded carotid arteries.
We used a constant water partition coefficient (0.90) within this study for all four regions used for the data fitting and parameter estimation. It is acknowledged that this parameter may differ from region to region, especially for the aROI. It is possible to include this as additional model parameter to be estimated, but it increases the instability of the procedure, therefore, it is not done in this study.
Uncertainties in Conventional Arterial Blood Sampling
Unless the AIF is sampled at the base of the brain, as in IDAIF, all AIF measurements must be corrected for delay and dispersion. The standard protocol at our institution 32 involves deconvolution of the AIF measured at the radial artery by a hematocrit-dependent kernel derived by prior calibrations (Blood containing a tracer quantity of [ 15 O]H2O was placed in one-half of a chamber maintained at 37°C. Unlabeled blood was placed in the other half. The two halves were separated by a rubber septum. Blood was withdrawn at a constant rate of 5 mL/min through the same tubing used during PET scanning. The distal end of this tubing passed through a lead-shielded scintillation detector. The proximal end was connected to a needle. Calibration runs started with the needle in the cold chamber. To measure the convolution kernel of the tubing, the needle was passed through the septum, thereby generating a timed pulse of activity. Precise timing of the pulse was provided by a voltage level switched by the position of the needle.). This deconvolution is correct only if the blood sampling tubing and flow rate during PET scanning are identical to whatever has been calibrated. Moreover, the calibrated deconvolution accounts only for delay and dispersion within the tubing, not for the difference between arterial blood at the wrist versus that supplying the brain. These problems with ASAIF may partly account for the anomalous results obtained with data set #12. To avoid these problems, we adopted a modeling approach25–27 to correct for ASAIF delay and dispersion. It is observed that the estimated delay and dispersion parameters are larger than what has been shown in other studies. 26 This is likely because of the difference in the automated blood sampling device.
Dependence of Measurement on the Evaluation Interval
Evaluation of Equation (3) was restricted to 40-second window, as in our standard quantitative [ 15 O]H2O auto-radiographic protocol.3,6,32 It has been observed that using a longer time window leads to underestimation of blood flow,3,33 which result has been attributed to the complicated kinetics of water uptake within the brain. 34 Other groups have used longer evaluation times.35–37 Here, we note that estimating CBF with IDAIF over extended dynamic data sets did not markedly reduce estimated CBF, whereas with ASAIF, it did. As can be seen in Figure 5, ASAIF was consistently above the IDAIF after the main peak; overestimation of the AIF results in lower estimated CBF. We hypothesize that the delay and dispersion correction model for the ASAIF technique is oversimplified and may cause overestimation of the AIF at a later time point, while the IDAIF more correctly models the compartmental kinetics of H2O uptake within the brain. In fact, using a longer time window may be beneficial since more data are available. It should be noted that the kinetic model used in this study as well as many [ 15 O]-water-based CBF studies assumes a complete extraction, which is not completely true especially under high flow conditions.38,39 This simplification will lead to underestimation of the CBF, which is another source of error in [ 15 O]-water-based CBF technique.
Sensitivity to Image Registration Error
Image registration error introduces noise in estimating CBF using the IDAIF approach. Deliberately introducing registration errors showed that a translational error of 1 mm or a rotational error of 1° leads to underestimation of the AIF and ~10% overestimation of CBF. However, transform consistency-based evaluation of our registration error 40 indicates that we routinely achieve errors under 0.5 mm translation and 0.5° rotation. This implies that computational registration error does not present a major problem in our AIF estimation technique. Subject motion during PET scanning is another factor that can affect CBF estimation. The IDAIF is more sensitive to subject motion than ASAIF because IDAIF estimates the AIF by differentiating the whole-brain TAC, which becomes noisy consequent to subject motion. In fact, subject motion could well account for the anomalously low global CBF in data set #11. Alternative approaches may reduce sensitivity to patient motion. For example, the AIF may be estimated by solving a set of linear equations in a manner similar to the hybrid-single-input-dual-output (HSIDO) technique we proposed for animal studies. 14 In addition, one may also correct for motion using a registration technique. 41 Image registration errors introduced by subject motion may be minimized by use of a PET/MR hybrid scanner. 42 We currently are evaluating the IDAIF method on a Biograph mMR scanner (Siemens Medical Solutions USA, Inc.).
We adopted high-resolution MRA to facilitate AIF estimation based on the fact that MRI is routinely performed in many neurologic imaging studies, clinical as well as experimental. Adding a 9-minute MRA scan is not unduly burdensome to patients nor would it dramatically increase MRI costs. The same IDAIF approach can be applied using CT angiography. While this has the potential benefit of obtaining an arterial image using a single PET/CT scanner, it would substantially increase the radiation dose to obtain the high-quality image required by IDAIF. It should be noted that we have shown comparable CBF measurements using a PET/CT scanner, which operates in 3D mode, and a (PET only) HR+ scanner operating in 2D mode. Thus, the increased scattering associated with 3D PET imaging does not appear to affect CBF estimation using IDAIF.
Summary
In summary, an IDAIF estimation technique using coregistered MRA images was developed and validated in the context of quantitative [ 15 O]H2O CBF imaging. The IDAIF technique offers several advantages in comparison with conventional arterial sampling. First, it does not require invasive arterial catheterization, which is burdensome to participants and can fail in >10% of cases for various reasons. 43 Second, the arterial blood samples are commonly taken from an artery that does not supply the brain, which introduces measurement noise and bias. Moreover, IDAIF is suitable for use during combined PET-MRI, whereas special instrumentation would be required to measure the ADAIF in the presence of a large, static magnetic field. However, IDAIF is sensitive to several factors, viz., the modeled effective scanner resolution and image registration error including that caused by subject motion. Nevertheless, we show that the IDAIF method provides reproducible CBF estimation without arterial blood sampling. Good agreement in CBF measured using IDAIF versus conventional arterial sampling also was observed. Further work is ongoing to validate the IDAIF technique for use with other tracers such as [ 15 O]O2 and [ 15 O]CO.
DISCLOSURE/CONFLICT OF INTEREST
The authors declare no conflict of interest.