
Abstract
The 5-hydroxytryptamine type 2a (5-HT2A) selective radiotracer [18F]altanserin has been subjected to a quantitative micro-positron emission tomography study in Lister Hooded rats. Metabolite-corrected plasma input modeling was compared with reference tissue modeling using the cerebellum as reference tissue. [18F]altanserin showed sufficient brain uptake in a distribution pattern consistent with the known distribution of 5-HT2A receptors. Full binding saturation and displacement was documented, and no significant uptake of radioactive metabolites was detected in the brain. Blood input as well as reference tissue models were equally appropriate to describe the radiotracer kinetics. [18F]altanserin is suitable for quantification of 5-HT2A receptor availability in rats.
Introduction
The benzoylpiperidine [18F]altanserin, 3-(2-(4-(4-[18F]fluorobenzoyl)-1-piperidinyl)ethyl)-2,3-dihydro-2-thioxo-4(1H)-quinazolinone, is a selective antagonist of the 5-hydroxytryptamine type 2a (5-HT2A) receptor (Lemaire et al, 1991; Kristiansen et al, 2005). To date it is the established 18F-labeled radiotracer for 5-HT2A receptor imaging and a considerable number of studies have been conducted in humans (Biver et al, 1994; Sadzot et al, 1995; Smith et al, 1998; Pinborg et al, 2003, 2004; Larisch et al, 2003; Haugbøl et al, 2007; Paterson et al, 2010) since its development in 1984 (Wong et al, 1984), enabled by the development of a practical route for its production (Lemaire et al, 1991). The 5-HT2A binding site is a postsynaptic G-protein coupled receptor thought to be involved in psychosis, mood disorders like bipolar disorder and major depression, anxiety disorders such as obsessive compulsive disorder and Alzheimer's disease (Blin et al, 1993; Williams et al, 1996; Chee et al, 2001; Choi et al, 2004; Adams et al, 2005). This receptor is mainly concentrated in cortical regions, highest densities are found in lamina IV of the frontal cortex. The 5-HT2A receptor is expressed in lower density in the hippocampus and the striatum, and is virtually absent in the cerebellum except in the Purkinje cell layer (Maeshima et al, 1998; Eastwood et al, 2001; Geurts et al, 2002).
Only limited data, however, are available for [18F]altanserin in rodents. Preliminary investigations have elucidated biodistribution and metabolism of [18F]altanserin in rat blood and brain (Lemaire et al, 1991). The distribution in frontal cortex, striatum, thalamus, and cerebellum was investigated in Wistar rats by dissection and later on the whole brain distribution was visualized by
Materials and methods
In total, seven PET scans were performed in Lister Hooded rats: three control studies with blood sampling for input function and metabolite analysis in both blood and brain tissue; two saturation studies following pretreatment with altanserin (1.5 mg/kg); and two displacement studies wherein ketanserin (1.5 mg/kg) was injected 1 hour into the 2-hour scanning protocol.
General
Analytical high pressure liquid chromatography (HPLC) was performed on an Agilent 1100 series HPLC system (Agilent Technologies UK Ltd, Wokingham, UK), consisting of a G1312 A binary pump and a G1314 variable wavelength UV (ultraviolet) detector. A Bioscan (Bioscan Inc., Washington DC, USA) dual BGO metabolite detector system with Flow-Count B-FC-4000 analog/digital interface was used for radioactivity detection. Lablogic Laura 3 (Lablogic Systems Ltd, Sheffield, UK) was used for data acquisition and evaluation. For metabolite determination in plasma, a LichroSorb RP-18 (7
Radiosynthesis, quality control, and metabolite analysis in plasma was performed via modified procedures adapted from the literature (Lemaire et al, 1991; Hamacher and Coenen, 2006; Hasler et al, 2009).
Radiosynthesis
Automated production of [18F]altanserin
[18F]altanserin was synthesized from the precursor nitroaltanserin, via aromatic nucleophilic substitution with [K⊂222][18F]F− using a GE tracerlab FX FN synthesis module. [18F]Fluoride was produced on a GE PETtrace cyclotron (GE Healthcare, Waukesha, WI, USA) via the 18O(p,n)18F nuclear reaction.
The produced radioactivity was trapped on a Waters Accell plus light QMA cartridge, preconditioned with 5 mL of 1 mol/L K2CO3 solution followed by 10 mL of water. The radioactivity was eluted directly into the reactor in the form of [K⊂222][18F]F− using a mixture of 7.5 mg K2CO3 in 0.3 mL of water and 22 mg of kryptofix 222 in 0.3 mL of acetonitrile. The mixture was concentrated to dryness at 110°C under reduced pressure in a stream of helium. Free water was removed by azeotropic distillation with 1 mL of acetonitrile. The reactor was cooled to 40°C and 5.0±0.4 mg nitroaltanserin in 1 mL of anhydrous DMSO was added to the dried [K⊂222][18F]F−. The reaction mixture was heated to 150°C and stirred for 10 minutes. The reactor was cooled to 40°C before the addition of 3 mL of preparative HPLC solvent. The obtained mixture was passed through a Waters SepPak plus Alumina N cartridge and injected into a preparative HPLC system. The stationary phase was a Macherey-Nagel VP 250/16 Nucleosil 100-7 C18 column, the mobile phase was a mixture of EtOH, THF, and 0.05 mol/L ammonium acetate buffer at pH 4.75 (1:2:27) at a flow rate of 10 mL/min. The product fraction was collected after a total retention time of 45 minutes in a vessel containing 100 mL of sterile water. The UV detection wavelength was 254 nm.
The diluted product fraction was passed through an Oasis cartridge, preconditioned with 5 mL of ethanol and 10 mL of water. The trapped product was washed with 10 mL of water before the elution of the trapped [18F]altanserin in 1 mL of ethanol. The ethanolic solution was collected in a vial precharged with 13 mL of 0.9% NaCl solution. The final formulation of [18F]altanserin for animal experiments was obtained via sterile filtration of the mixture of ethanol and NaCl solution into a sterile multiinjection vial.
Quality control
A total of 20
Animals, Anesthesia, and Surgery
All animal experiments were in accordance with UK Home Office guidelines and were approved by the University of Cambridge Animal Ethical Review Panel. Studies were performed in seven Lister Hooded rats (370 to 437 g; Charles River, Margate, Kent, UK). Anesthesia was induced with 4% isoflurane administered in 1 L/min oxygen and maintained throughout the experiment with 1.5% to 2% isoflurane. Terminal experiments were conducted in all rats, the left femoral vein was cannulated for intravenous administration of [18F]altanserin and drugs. In three rats, the left femoral artery was also cannulated to allow for collection of serial blood samples. Cannula patency was maintained using a heparinized (10 U/mL) isotonic saline flush (150
Positron Emission Tomography Scanning Protocols
Animals were imaged under baseline conditions for 3 hours, whereas animals used for displacement and saturation studies were imaged for 2 hours. Imaging data were acquired using a micro-PET Focus 220 scanner (Concorde Microsystems, Knoxville, TN, USA). The rats were placed prone on the scanner bed and the head was fixed in a custom made plastic frame using ear bars and a bite bar. Anesthesia and body temperature was maintained as described above. In addition, oxygen saturation, heart rate, and respiratory rate were measured and maintained within physiological limits throughout using a noninvasive mouseOX (Starr Life Science Corp., Oakmont, PA, USA) pulse oximeter sensor attached to the foot.
In the control (baseline) studies, three rats had arterial blood sampling to determine blood metabolites and the arterial input function. Brains were harvested after the scan to carry out metabolite analysis in brain tissue.
A pharmacological pretreatment was conducted with nonradioactive altanserin to prove saturability of [18F]altanserin binding to 5-HT2A receptors and specific binding in the rat brain by blocking radiotracer uptake. In total, two rats were pretreated with cold altanserin (1.5 mg/kg infused intravenously over 2 minutes to minimize side effects) 50 minutes before [18F]altanserin infusion.
Reversibility and selectivity of [18F]altanserin binding was scrutinized by pharmacological displacement of [18F]altanserin in binding equilibrium using the known, selective 5-HT2A receptor ligand ketanserin. In displacement studies, ketanserin (1.5 mg/kg) was administered intravenously 60 minutes after [18F]altanserin infusion in a further two rats.
Before injection, singles-mode transmission data were acquired for 515 seconds using a rotating 68Ge point source (∼20 MBq). An attenuation correction sinogram was produced from this scan and a blank scan of the same duration using the reconstruction and segmentation software on the Focus 220. In all experiments, [18F]altanserin (8.0 to 54.9 MBq) was injected intravenously over 30 seconds, followed by a 15-second heparinized saline flush. For all scans, the injected amount of altanserin was kept below 0.6 nmol. Dynamic data were acquired in list mode for a 350 to 650 keV energy window and a 6-nanosecond timing window. Data were subsequently histogrammed into sinograms for the following time frames: 12 × 5 seconds, 6 × 10 seconds, 3 × 20 seconds, 4 × 30 seconds, 5 × 1 minutes, 10 × 2 minutes, 18 × 5 minutes. Corrections were applied for randoms, dead time, normalization, attenuation, and decay. Fourier rebinning (Defrise et al, 1997) was used to compress the 4D sinograms to 3D before reconstruction with 2D filtered backprojection with a Hann window cutoff at the Nyquist frequency. The image voxel size was 0.95 × 0.95 × 0.80 mm3, with an array size of 128 × 128 × 95. The reconstructed images were converted to MBq/mL using global and slice factors determined from imaging a uniform phantom filled with a [18F]fluoride solution. This phantom acquisition was also used to crosscalibrate the scanner and the well counter was used to measure the blood radioactivity concentration.
Blood Sampling
To determine arterial blood and plasma [18F]altanserin kinetics, serial blood samples were taken via the arterial cannula in three rats. Before [18F]altanserin injection, heparin (200 U/kg) was administered intravenously to prevent clotting. Blood samples (∼30
Metabolite Analysis
Blood
Blood samples collected after 3, 10, 30, 60, and 120 minutes were used for metabolite studies. A total of 100
Brain
Following PET scanning, the brains of the three control rats were rapidly resected. Cerebrum and cerebellum were separated and homogenized by grinding under methanol (3 mL/g of tissue) in a glass tube for 5 minutes. The supernatant layer was transferred into a centrifuge tube and centrifuged at 5000 r.p.m. for 5 minutes. The supernatant was analyzed in the same manner as described for the blood analysis.
Positron Emission Tomography Data Analysis
For each scan, a mean PET image was manually coregistered to a T2-weighted magnetic resonance (MR) minimum deformation atlas of 21 Lister Hooded rats. The template was generated from iterative nonlinear image registration using B-splines and a normalized mutual information cost function. Magnetic resonance images were acquired using a Bruker 4.7 T 40 cm bore system (Bruker BioSpin, Ettlingen, Germany), with a rapid acquisition with relaxation enhancement (RARE) sequence with slight T2 weighting (repetition time/echo time (TR/TE)=3500/45 milliseconds, echo train length (ETL) 16, matrix 256 × 256 × 128, resolution 150
Region of interest nondisplaceable binding potential (BPND) (Innis et al, 2007) was estimated using one-tissue (1TCM) and two-tissue compartment models (2TCM) for the three rats with blood sampling. The plasma input models included blood volume correction. These rats and the two rats with altanserin preblocking were also analyzed with the following reference tissue methods: RTM (Hume et al, 1992), simplified RTM (sRTM; Lammertsma and Hume, 1996) and reference tissue input Logan plot (Logan et al, 1996). In addition, maps of BPND were produced using the basis function implementation of sRTM (Gunn et al, 1997), with 100 basis function spaced logarithmically in the range 0.02≤
For the displacement scans, to estimate the degree of displacement, sRTM was fitted to the ROI data up to the time at which ketanserin was injected (60 minutes). The parameters estimated from the sRTM fitting in conjunction with the cerebellum TAC were used to estimate the ROI TAC without displacement. At 2 hours, the displacement of specific binding was estimated using

Results
Radiosynthesis
[18F]altanserin was obtained with a nondecay corrected radiochemical yield of 20%±4% at EOS after a synthesis duration of 94±2 minutes (
Blood Input Function and Metabolites
Figure 1 shows the plasma, metabolite-corrected plasma, and whole blood input functions for one rat, together with the parent fraction in blood over time (averaged over three rats). [18F]altanserin was slowly metabolized to polar metabolites over the course of the PET scan. After 2 hours, the intact [18F]altanserin accounted for 74%±6% of the total activity in the blood plasma. No major metabolite peak was apparent in the plasma.
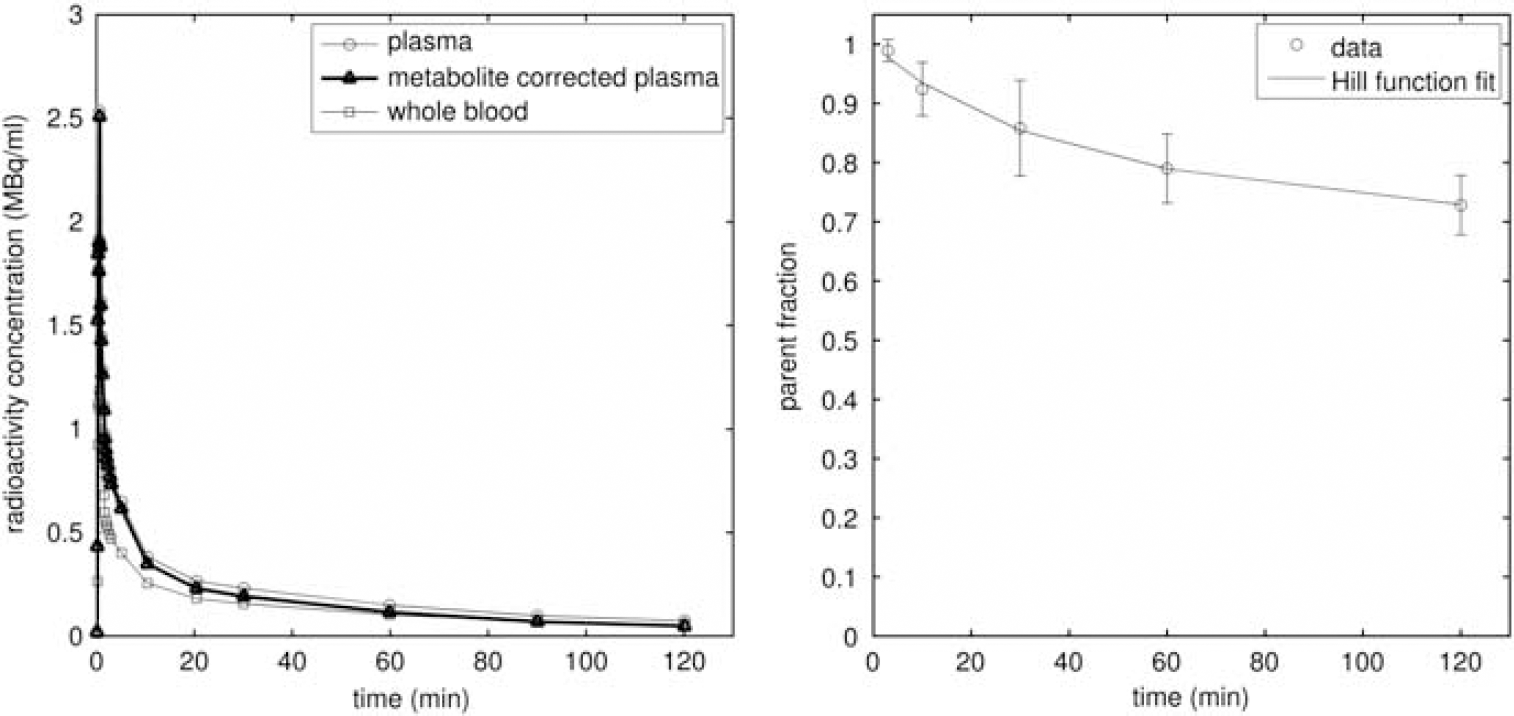
Blood time–activity curves (left) and the parent fraction in blood over time (right). The blood curves, which have been decay corrected, are from a single rat, while the parent fraction values are the mean of three rats with error bars denoting the standard deviation.
Brain Uptake and Metabolites
In the control rats (
Assessment of Specific Binding
Displacement studies
Ketanserin induced significant displacement of ROI signal for the four target regions (Figure 2). The displacements estimated using equation (1) were frontal cortex (67%), cortex (57%), striatum (100%), and hippocampus (57%).
Preblocking studies
Figure 3 shows how the mean ROI TACs were affected by pretreatment with altanserin. The target ROI TACs tend toward that for the cerebellum, indicating large reductions in specific binding. This is confirmed by the large reductions in BPND shown in Figure 4; 89%±3%, 83%±4%, 103%±5%, 70%±1% for frontal cortex, cortex, striatum, and hippocampus, respectively, across the three reference tissue methods. The reduction in BPND with altanserin pretreatment is further illustrated in Figure 5 where BPND maps with/without pretreatment are shown overlaid on the MR atlas.
Comparison of Nondisplaceable Binding Potential Estimation With Blood Input and Reference Tissue Models
Good fits to the target ROI TACs were achieved with 2TCM, RTM, and sRTM, but poor fits were obtained with 1TCM (Figure 6). The BPND values estimated using the reference tissue methods were consistent within themselves and also with 2TCM (Figure 7). Using the paired
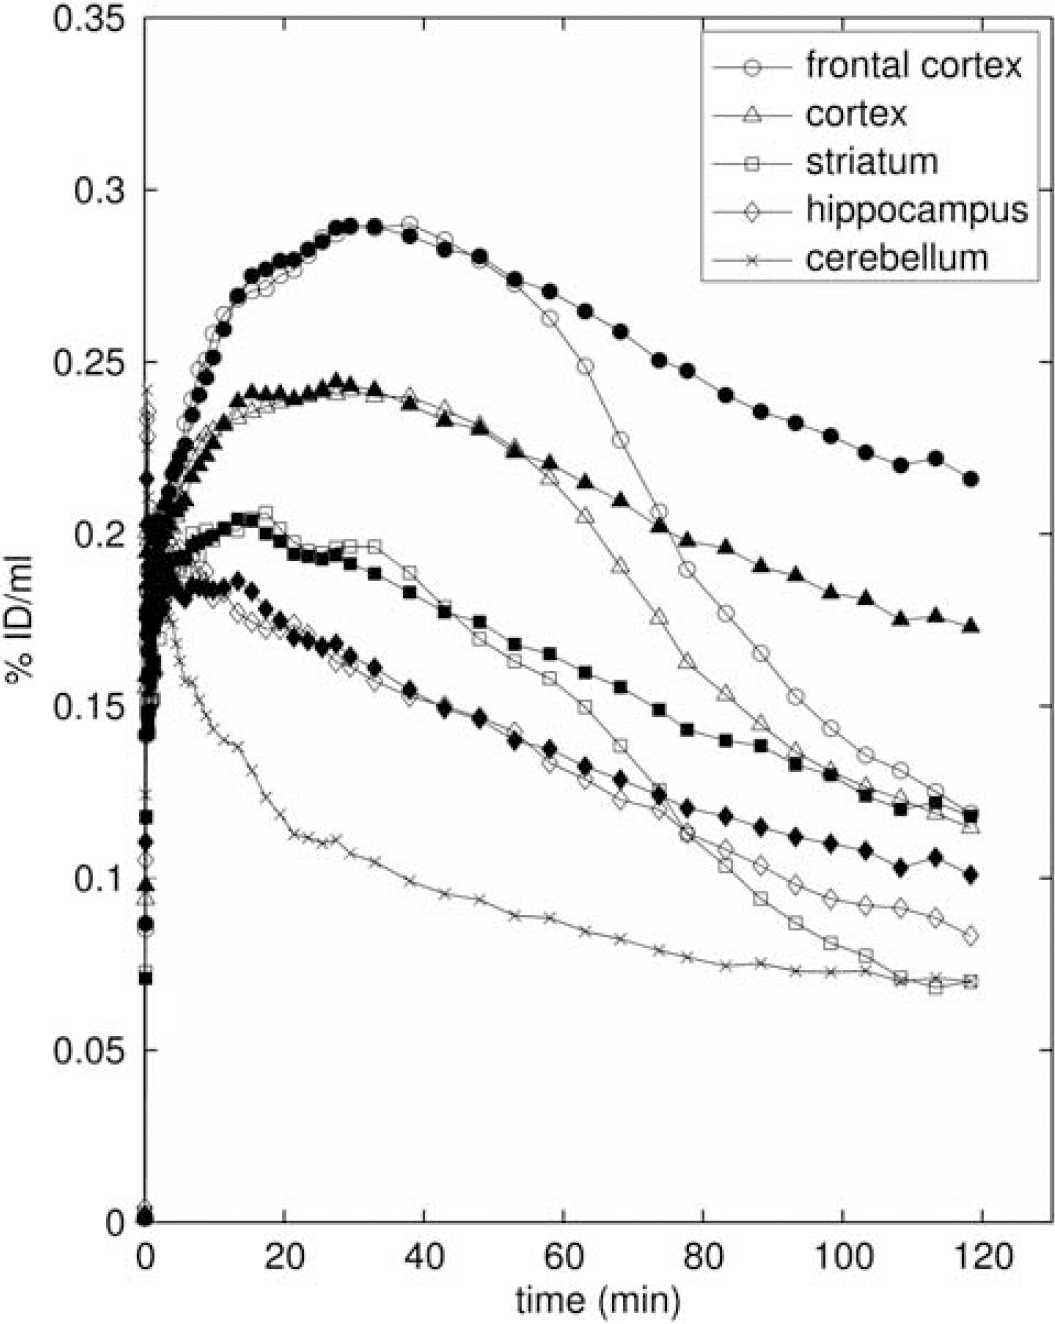
Average regional time–activity curves (
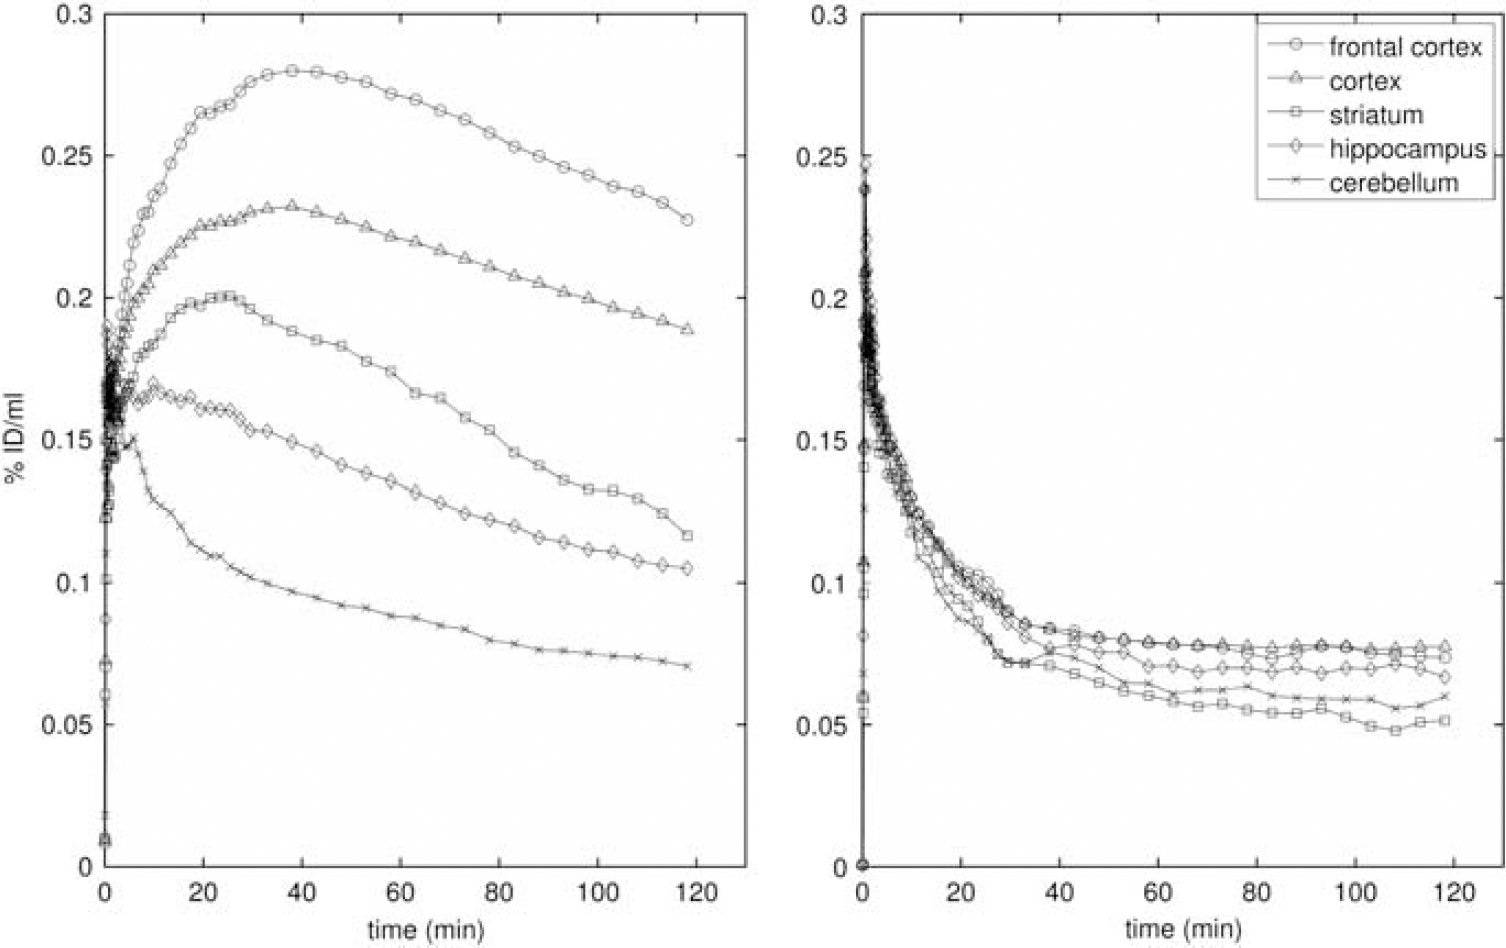
Regional time–activity curves (left) without and (right) with pretreatment with altanserin (1.5 mg/kg). The time–activity curves without pretreatment are the average of three rats, those with pretreatment are the mean of two rats.
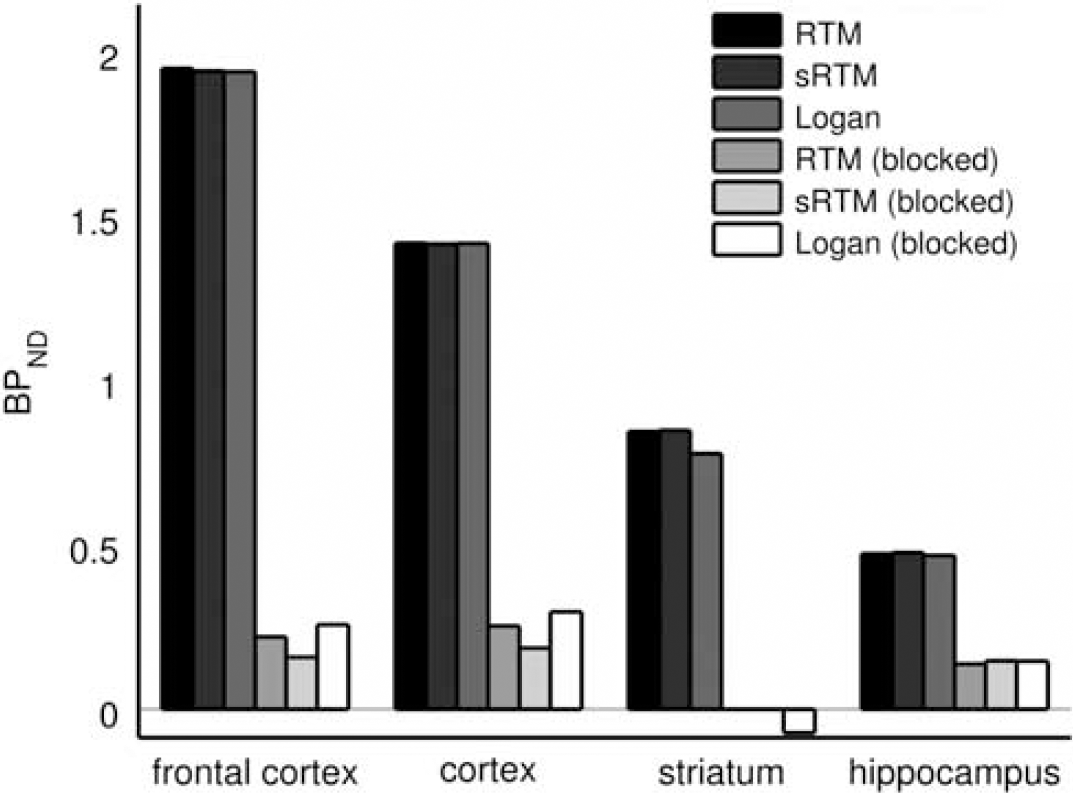
Regional nondisplaceable binding potential (BPND) values estimated by three reference tissue methods for scans with and without pretreatment with altanserin (1.5 mg/kg). The pretreatment scans are referred to as blocked. RTM, reference tissue model; sRTM, simplified reference tissue model.
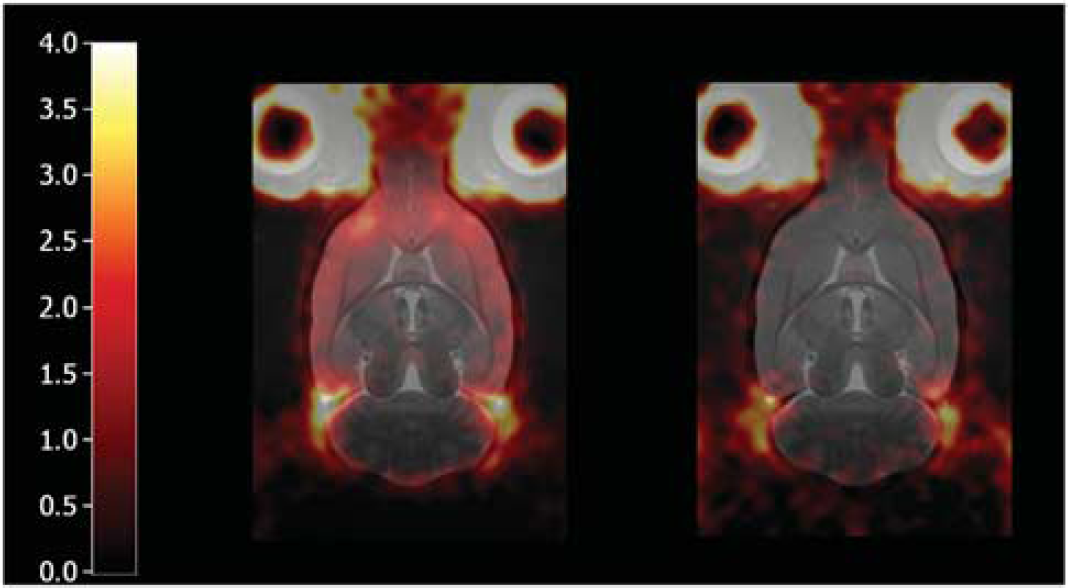
Maps of nondisplaceable binding potential (BPND) produced using the basis function implementation of the simplified reference tissue model (left) without and (right) with altanserin pretreatment. Each map is for a single rat and has been displayed on top of the MR atlas.
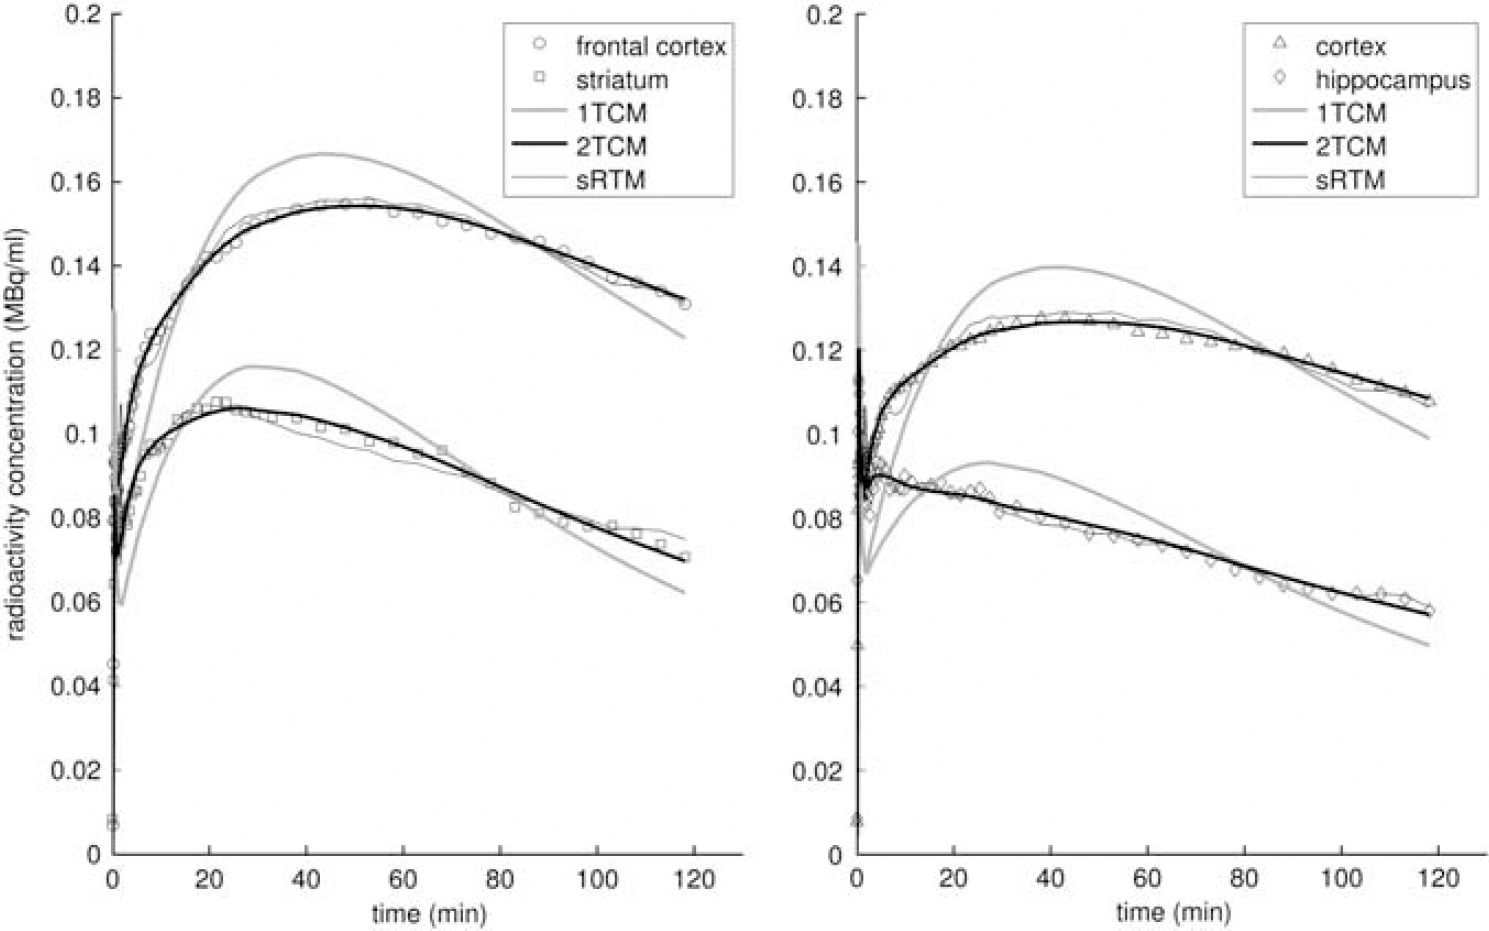
Model fits to regional time–activity curves from a single rat. The models given are metabolite-corrected plasma input compartment models with one- (1TCM) and two-tissue compartments (2TCM), together with the simplified reference tissue model (sRTM). The time–activity curves have been corrected for radioactive decay.
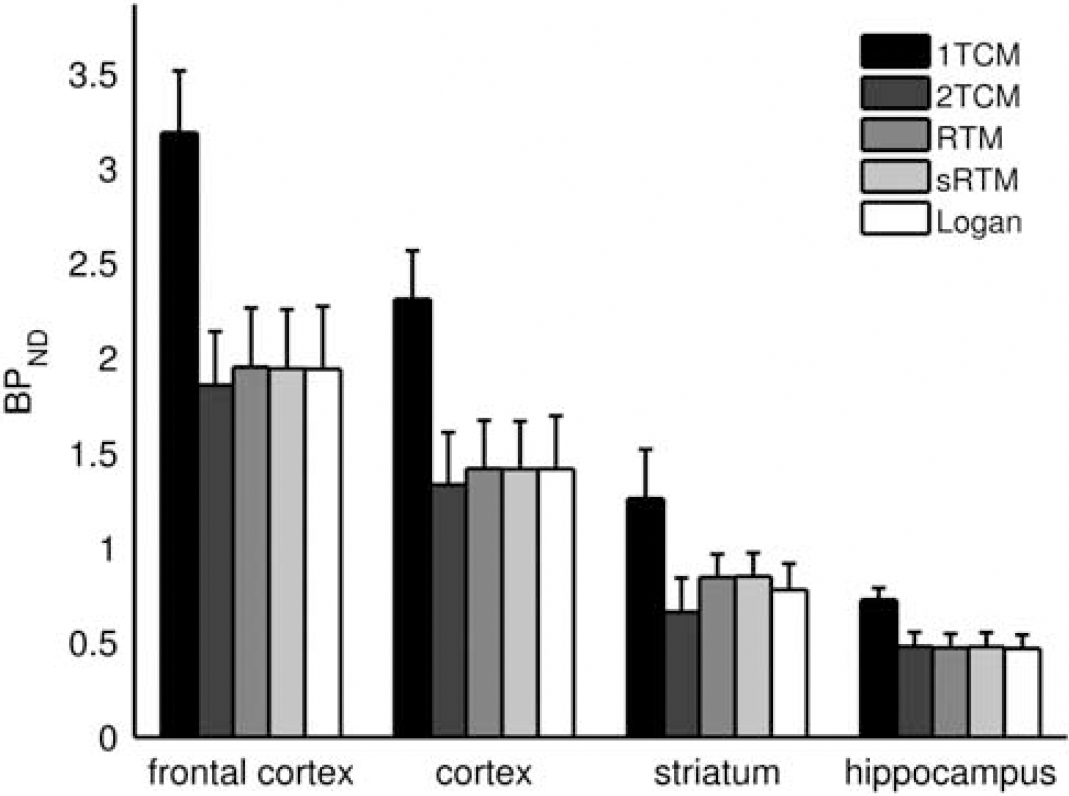
Regional nondisplaceable binding potential (BPND) values produced by five modeling methods (
Discussion
Although [18F]altanserin has been widely used for PET imaging in humans, its use for
Regions of interest were defined on the MRI template as indicated by the anatomical boundaries of the corresponding brain regions. Regions of interest comprised cerebellum, cortex, hippocampus, and striatum. An additional region was drawn in the frontal portion of the cortical ROI to highlight the region known to contain the highest density of 5-HT2A binding sites. The ROI in the cerebellum was offset from the outermost lamina of the cerebellar cortex to avoid the Purkinje cell layer.
Uptake of [18F]altanserin into the brain was comparably low. A peak whole brain uptake of standardized uptake value=0.69 was observed in the rat, whereas 2.7% ID whole brain uptake (equivalent to standardized uptake value=1.26 for a brain volume of 1500 mL and a body weight of 70 kg) has been observed in human subjects (Sadzot et al, 1995). This disparity could at least in part be due to interspecies differences in P-gp-mediated efflux from the brain.
Time–activity curves were derived from the PET data for all ROIs. The highest uptake of [18F]altanserin was found in the cortical ROI (0.23% ID/mL) about 40 minutes after injection. At this time point, peak uptake (0.28% ID/mL) was observed in the frontal cortex ROI. Both regions showed a similar rate of washout. Uptake into the striatum (0.2% ID/mL, after 20 minutes) and into the hippocampus (0.18% ID/mL, after 10 minutes) was lower. Interestingly, whereas the TAC for the hippocampus resembled the washout rate for the cortical curves, the striatal region showed a higher rate of washout (Figure 3). The reason for this finding is unclear; it may be related to some residual non-5-HT2A binding in the hippocampal region, which is also supported by incomplete displacement of the radiotracer from this region. Nevertheless, the distribution of [18F]altanserin was in good accordance with the distribution of 5-HT2A receptors in the rat brain (Biver et al, 1997). Considerable reductions in tissue radioactivity concentration were observed for pharmacological displacement using a small amount of the selective 5-HT2A antagonist ketanserin (Figure 2), clearly illustrating that [18F]altanserin binding is reversible and selective to the rat 5-HT2A receptor subtype.
As expected, the lowest uptake of [18F]altanserin was observed in the cerebellum ROI, radioactivity concentration in this region peaked in the early time frames of the study and decreased rapidly over the course of the study. Moreover, the shape of the cerebellum TAC was not affected by either saturation of the binding sites or pharmacological displacement with a 5-HT2A ligand (Figure 3). These findings underline that the cerebellum ROI is virtually devoid of 5-HT2A specific binding, which is a prerequisite for an appropriate reference region for compartmental modeling.
Contrary to a rapid metabolism in higher species that leads to the formation of several blood–brain barrier penetrating metabolites (Tan et al, 1999; Hasler et al, 2009), only moderate metabolism of the parent radiotracer [18F]altanserin was observed in the rat.
Five kinetic models for quantification of the [18F]altanserin binding data in the rat brain were compared in this study. One- and two-tissue compartment blood input models were compared with three RTMs.
Two-tissue compartmental modeling with a metabolite-corrected plasma input function produced good fits to the data for all of the target regions (frontal cortex, cortex, striatum, and hippocampus; Figure 6). A 1TCM could not adequately model the tracer kinetics in any of these regions. Importantly, although metabolites were found in plasma (∼25% of blood radioactivity 2 hours after injection; Figure 1, right panel), consistent with the findings of Lemaire et al (1991) and Hasler et al (2009), the polar characteristics of the metabolites meant that there was no significant uptake of metabolites into the brain, which was confirmed by direct tissue assay. This substantiates the validity of a single input compartment model.
Blood sampling in rodents, however, is problematic; it has the potential to perturb the physiology of the animal and it hampers recovery for longitudinal studies if surgery is used to access the blood vessel (e.g., the femoral artery). Reference tissue modeling (Hume et al, 1992) is an attractive alternative for quantification of reversible ligand–receptor interactions.
This study demonstrated that BPND determination through reference tissue modeling, with the cerebellum acting as the reference tissue, can produce results consistent with those produced using metabolite-corrected plasma input two-tissue compartment modeling (Figure 7). The cerebellum was chosen as it is supposed to contain negligible numbers of 5-HT2A receptors, although a 5-HT2A like response has been found in the peripheral layer of Purkinje cells using immunostaining in rat brain sections (Maeshima et al, 1998; Geurts et al, 2002). An autoradiographic study in human brain sections has also suggested significant 5-HT2A binding in the same brain region (Eastwood et al, 2001). Consequently, here the reference tissue region defined on the MR atlas of the rat brain was kept away from the outer cerebellar surface.
Three reference tissue approaches for ROI analysis were compared: RTM (Hume et al, 1992), sRTM (Lammertsma and Hume, 1996), and the reference tissue input Logan plot (Logan et al, 1996). There were no significant differences found for the BPND estimates produced by these methods and those obtained using 2TCM. Consequently, no single reference tissue method can be recommended over the others. For mapping of BPND (Figure 5), the basis function implementation of sRTM (Gunn et al, 1997) was chosen but the reference tissue input Logan plot is also well suited to voxel-wise modeling.
Preblocking with altanserin (Figure 3) reduced BPND by between 70% and 100% in the four target regions (frontal cortex, cortex, striatum, and hippocampus), with BPND in regions including the external surface of the brain (all regions except the striatum) falling into a tight range (0.15 to 0.2 for sRTM; Figure 4). From the images (Figure 5) it is apparent that there is some uptake just outside the brain and this uptake may at least be partially responsible, through partial volume error, for these nonzero BPND values.
In summary, the above data show that fully quantitative 5-HT2A receptor availability studies in the rat can be performed using [18F]altanserin. Displacement and preblocking studies documented the selectivity of the ligand to the 5-HT2A receptor, while metabolite analyses showed slow metabolism producing exclusively polar compounds in arterial blood, with only the parent tracer being present in brain tissue. Finally, the binding of [18F]altanserin can be reliably described by blood input and reference tissue modeling. Blood input modeling did not provide a significant advantage over reference tissue modeling, with reference tissue modeling providing BPND estimates of comparable accuracy to those from metabolite-corrected plasma input modeling. The rat cerebellum is a suitable reference region for quantification of the binding data. We conclude that [18F]altanserin is a suitable tracer for quantitative 5-HT2A receptor PET imaging in the rat brain.
Footnotes
The authors declare no conflict of interest.