
Abstract
Cerebral vasospasm after aneurysmal subarachnoid hemorrhage is a potentially severe sequel. The induction of hypertension, hypervolemia, and hemodilution is advocated for vasospasm, but it is unclear whether hemodilution confers any benefit. A finite element model of oxygen transport in the proximal middle cerebral artery (MCA) was used to evaluate the complex relationship among hematocrit, viscosity, oxygen content, and blood flow in the setting of vasospasm. A single-phase non-Newtonian finite element model based on three-dimensional incompressible Navier–Stokes equations was constructed of the M1 segment. The model was solved at vessel stenoses ranging from 0% to 90% and hematocrit from 0.2 to 0.6. A small area of poststenotic recirculation was seen with mild (30%) stenosis. Poststenotic eddy formation was noted with more severe (60% to 90%) stenosis. Volumetric flow was inversely related to hematocrit at mild stenosis (0% to 30%). With near-complete stenosis (90%), a paradoxical increase in flow was seen with increasing hematocrit. Oxygen transport across the segment was related to hematocrit at all levels of stenosis with increasing oxygen transport despite a reduction in blood flow, suggesting that with clinically significant vasospasm in the MCA, hemodilution does not improve oxygen transport, but to the contrary, that ischemia may be worsened.
Introduction
Vasospasm after subarachnoid hemorrhage is associated with increased morbidity and mortality (Brisman et al, 2006; Rosengart et al, 2007; Weir et al, 1978). Therapeutic manipulation of hemodynamics and blood rheology for the supportive management of vasospasm was first described 30 years ago (Kosnik and Hunt, 1976; Rosenwasser et al, 1983). The combination of induced hypertension, hypervolemia, and hemodilution (HHH) therapy is widely used for prophylaxis and therapy in the setting of angiographic or clinical vasospasm (Brisman et al, 2006; Mayberg et al, 1994; Sakowitz et al, 2006). The efficacy of HHH therapy in reversing or in preventing ischemic injury to the brain remains uncertain (Ekelund et al, 2002; Feigin and Findlay, 2006; Sakowitz et al, 2006; Treggiari et al, 2003).
The hemodilution aspect of HHH therapy continues to be controversial (Awad et al, 1987; Ekelund et al, 2002; Hassan et al, 2004; Kosnik and Hunt, 1976; Muench et al, 2007; Naidech et al, 2007; Rosengart et al, 2007; Rosenwasser et al, 1983; Treggiari et al, 2003). In spite of this, it is practiced 30% to 60% of the time (Meyer et al, 2011; Sakowitz et al, 2006). Inducing hemodilution aims to maximize oxygen delivery across the stenosis of vasospastic vessels by decreasing viscosity. As hemodilution also reduces oxygen-carrying capacity, the assumption is that improvements in viscosity-modulated flow overcome the decrease in oxygen content. However, the relationship between hematocrit and viscosity is nonlinear, and the effects of the complex disturbed flow patterns on blood flow that arise from vascular stenoses are not precisely predictable. Even if hemodilution is not a specific therapeutic target, it is an invariable consequence of volume expansion used to achieve hypervolemia and hypertension.
Physical and computational modeling has been used extensively to investigate the properties of vascular systems (Fahrig et al, 1999; Hillen et al, 1986; Kailasnath et al, 1998). Computational fluid dynamic models have the capability to simulate fluid flow in arbitrary geometries, and are suitable for study in complex structures such as the cerebrovascular system. Models can couple fluid flow physics to other physical processes such as oxygen transport. We developed a finite element model to evaluate fluid dynamics in the proximal segment of the middle cerebral artery (MCA) in the presence of stenosis to evaluate the complex relationship between hematocrit, viscosity, oxygen content, and intrastenotic and poststenotic blood flow with the goal of identifying the optimal hematocrit for management of cerebral vasospasm. We chose to study the proximal segment of the MCA because it provides the greatest blood flow of the three cerebral arteries (Tanaka et al, 2006), accounting for 60% of each hemisphere and posing the greatest risk of widespread cerebral injury.
Materials and methods
A single-phase model of blood flow was developed to simulate the flow of blood in the proximal (M1) segment of the MCA and to estimate oxygen delivery to the more distal vasculature. The M1 segment of the MCA begins at the MCA origin and terminates laterally at the genu. The geometry of the M1 segment used in the model was based on published observations of MCA anatomy and those of cerebral vasospasm. The normal length of the M1 segment ranges from 5 to 24 mm (von Lanz et al, 1935). We chose a length of 11.9 mm in our model as used in the three-dimensional physical model by Fahrig et al (1999). The diameter of the M1 segment has been reported as ranging from 2.2 to 3.82 mm (Bentson and Wilson, 1971; Gabrielsen and Greitz, 1970; Ring and Waddington, 1967). Fahrig et al (1999) obtained values of the diameter from angiograms corrected for magnification and used a value of 2.78 mm in their model. This value was chosen as the M1 segment diameter for our study. Vasospasm can involve variable lengths of single or multiple cerebral vessels (Weir et al, 1978). In our model, we chose a single area of vasospasm equal to 80% of the length of the M1 segment.
Model Geometry and Solution Mesh
The three-dimensional geometry was created using SolidWorks Office Professional 2009 (SolidWorks Corp., Concord, MA, USA). A curved line of length 11.9 mm was constructed that was representative of the path of the M1 segment. In all, 10 evenly spaced subsegments with orthogonal circles were created and parameterized to create a smooth stenosis ranging from 0 (no stenosis) to 0.9 (90% diameter reduction). The segment was extended on each end by 5 mm to create straight entry and exit regions. An example of the model geometry with a 50% stenosis is given in Figure 1.
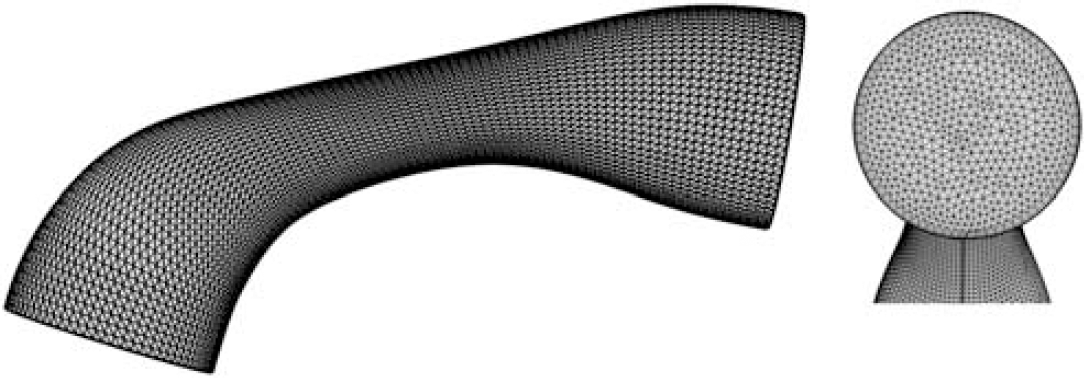
M1 segment geometry with 50% stenosis with mesh. The left-hand figure is the side view with carotid inflow at the lower left and outflow at the upper right. The right-hand figure shows the mesh of the outlet boundary with thin boundary layer elements. The inlet boundary is identical to the outlet boundary and is not shown.
The geometry was imported into COMSOL Multiphysics v3.5 (COMSOL Inc., Burlington, MA, USA) using the SolidWorks Live Connection of the COMSOL CAD Import Module. A structured mesh consisting of extruded prism elements was first generated, and then converted to tetrahedral elements. Thin boundary elements were added along the wall to better resolve boundary layer flow. Based on a mesh convergence study (Table 1), ∼200,000 elements were used in the model. First-order Lagrange functions were used for both velocity and pressure fields.
Mesh convergence study conducted under two flow and stenosis conditions
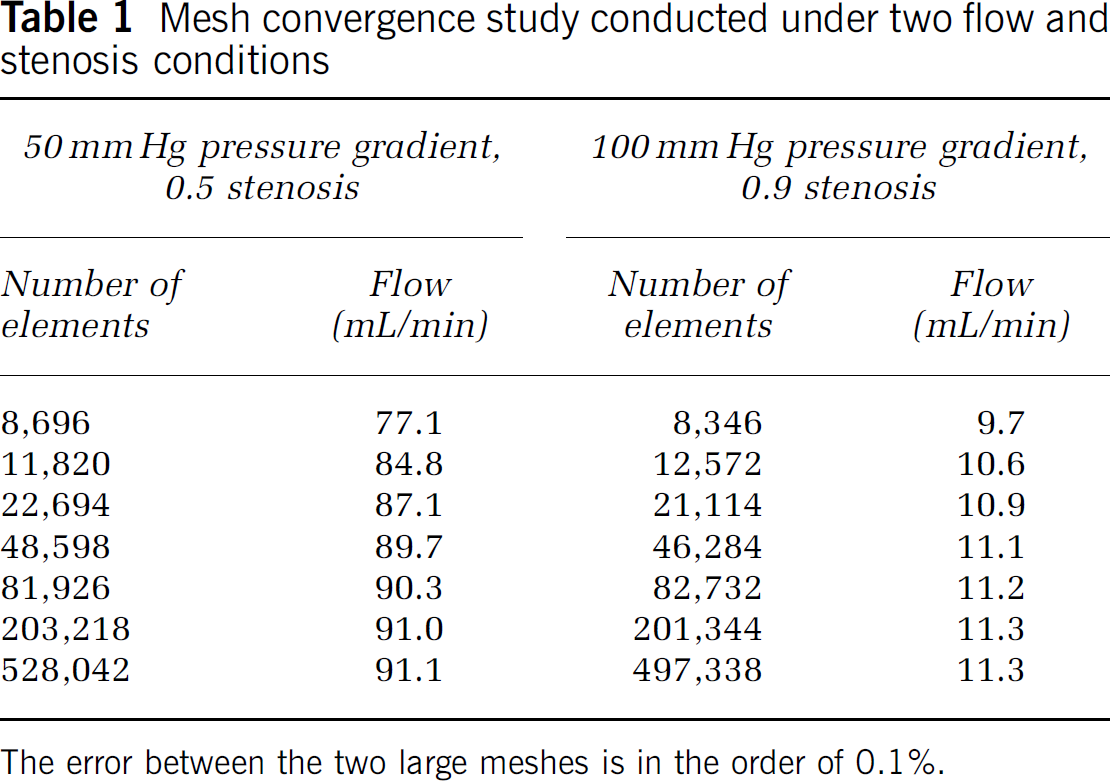
The error between the two large meshes is in the order of 0.1%.
Governing Equations and Boundary Conditions
The single-phase model was based on the incompressible Navier–Stokes equations with no external forces (e.g., gravity):
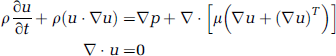
Where u is the velocity vector, with μ, ρ, and p representing dynamic viscosity, density, and pressure, respectively. Whole-blood viscosity was modeled as non-Newtonian using an implementation of the Carreau–Yasuda equation (Bird et al, 1987; Carreau, 1972; Yasuda et al, 1981) parameterized for blood (Gijsen et al, 1999; Jung et al, 2006; Lightfoot, 1974):
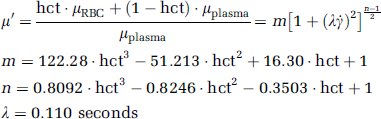
where μ′ represents dynamic viscosity relative to that of plasma (0.0012 Pa seconds), μRBC and μPlasma the dynamic viscosity of the erythrocyte and plasma, respectively, γ̇ the shear rate (derived from velocity gradients in the model), and hct the hematocrit.
Hemoglobin (hgb) was assumed fully saturated with oxygen, and oxygen content was calculated as:

No-slip boundary conditions were used for the wall of the M1 segment. A pressure waveform representing carotid pressure digitized from waveforms described by Saba et al (1993) was applied at the inlet (Figure 2). This waveform was normalized to a frequency of 1 Hz and unit amplitude, and then parameterized for different levels of inlet pressure. Mean pressures of 80, 100, 120, 140, and 160 mm Hg were studied, with pulse pressure held at 40 mm Hg. As we specified pressure as a boundary condition in place of flow, the pressure drop across the segment will vary depending on the degree of stenosis. We estimated the pressure drop in preliminary flow-driven simulations at each level of stenosis. The outlet pressure for the remaining simulations was then set to maintain the appropriate pressure drop across the M1 segment at each level of stenosis.
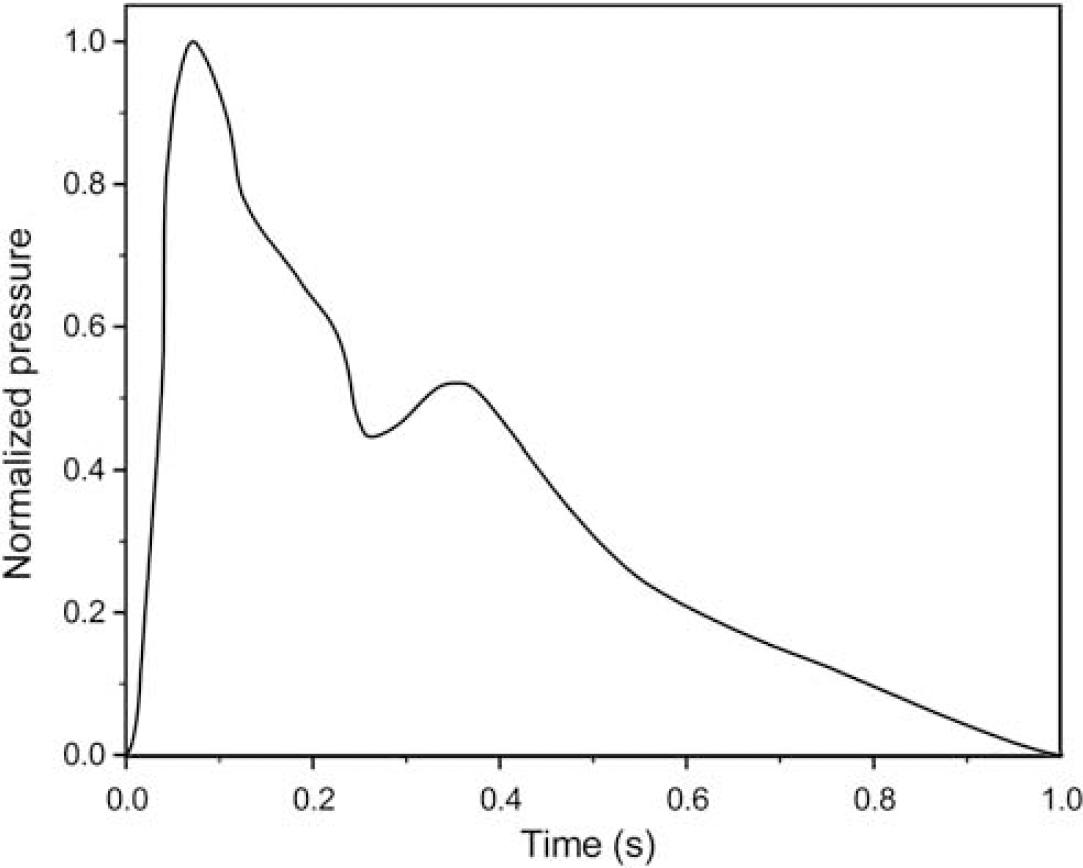
Normalized carotid pressure waveform used to calculate inlet pressure boundary conditions. At each pressure level, the waveform was adjusted to the chosen mean value and pulse pressure before application as the boundary condition.
Model Solution
As flows resulting from stenosis in the cerebral vasculature result in disturbed flow patterns, the model was solved using a time-dependent stabilized finite element method. The approach, which is similar to Monotone Integrated Large Eddy Simulation, or MILES (Tejada-Marínez, 2002), consists of two parts: a Galerkin least-squares streamline diffusion method and a crosswind diffusion method. For stabilization to give a physically correct description of the small eddy energy dissipation, a fine solution mesh was used and the solution time increment was less than the estimated element transit time. A similar method has been used by Bazilevs et al (2007) to simulate arterial drug delivery.
For the solution at each level of stenosis, inlet pressure was increased monotonically from zero to each target boundary condition using a smoothed Heaviside function with continuous first derivatives. A parametric analysis over the values of hematocrit was performed using similarly smoothed transitions between the different levels of hematocrit.
A parallel implementation of the PARDISO solver (PARDISO) with the generalized-α time-dependent solver was used to obtain the solution set. The time-dependent damping factor was 0.75, and the time interval was 1 × 10⁻⁴ seconds. Each solution was run for 8 seconds following full flow development, corresponding to 8 to 30 flow-throughs, with 8 samples collected to obtain an average solution. Solutions were obtained at stenoses of 0% to 90% diameter reduction in increments of 10%, and at values of hematocrit ranging from 0.20 to 0.60 in increments of 0.10.
Volumetric flow was calculated following solution of the model by integration of velocity over the inflow boundary of the M1 segment. Oxygen transport was calculated from the product of volumetric flow and oxygen content. Oxygen content was calculated from the hematocrit assuming 1 gm/dL hemoglobin corresponded to 0.03 hematocrit, and assuming full oxygen saturation. The oxygen content was assumed constant throughout the computational domain because oxygen consumption during the short transit time is negligible.
Results
Time-averaged solutions were obtained for each combination of stenosis and hematocrit. Figure 3 provides streamline flow profiles for a normal hematocrit of 0.40 at four levels of stenosis (0%, 30%, 60%, and 90% diameter reductions) and mean arterial pressure of 100 mm Hg. In the absence of stenosis, flow is laminar with some secondary rotational flow induced by the curve in the M1 segment but no substantial increase in vorticity. There is no evidence of recirculation or eddy formation. With mild-to-moderate (30%) stenosis, the rotational flow is increased and there is a development of a small area of poststenotic recirculation. A poststenotic jet is clearly noted at severe (60%) stenosis, with substantial poststenotic recirculation and retrograde flow comprising a majority of the poststenotic region. With near-complete (90%) stenosis, a very small high-velocity jet is noted with nearly the entire poststenotic region involved in recirculation.
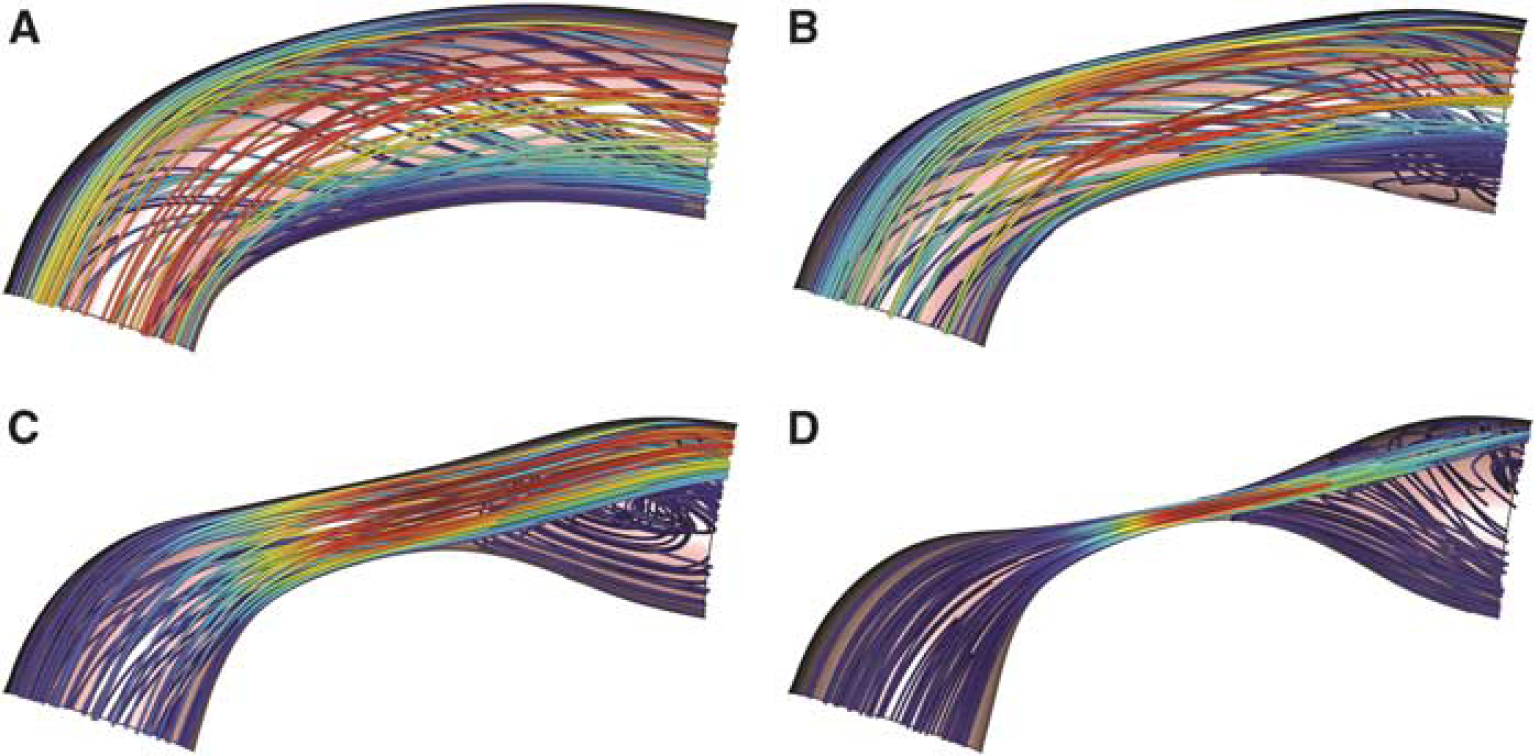
Streamline flow profiles for hematocrit 0.40 at four levels of stenosis: 0 (
A stenosis of 50% is considered severe or critical. Streamlines were obtained for this level of stenosis at hematocrit levels between 0.2 and 0.5, which includes both normal and hemodiluted hematocrit values (Figure 4). Visual inspection reveals the presence of poststenotic recirculation that encompasses a substantial volume fraction of the vessel. There is little influence of hematocrit on this flow pattern, suggesting that volumetric flow is affected primarily by the material properties of blood (e.g., viscosity) and not by the influence of altered flow patterns at this level of stenosis.
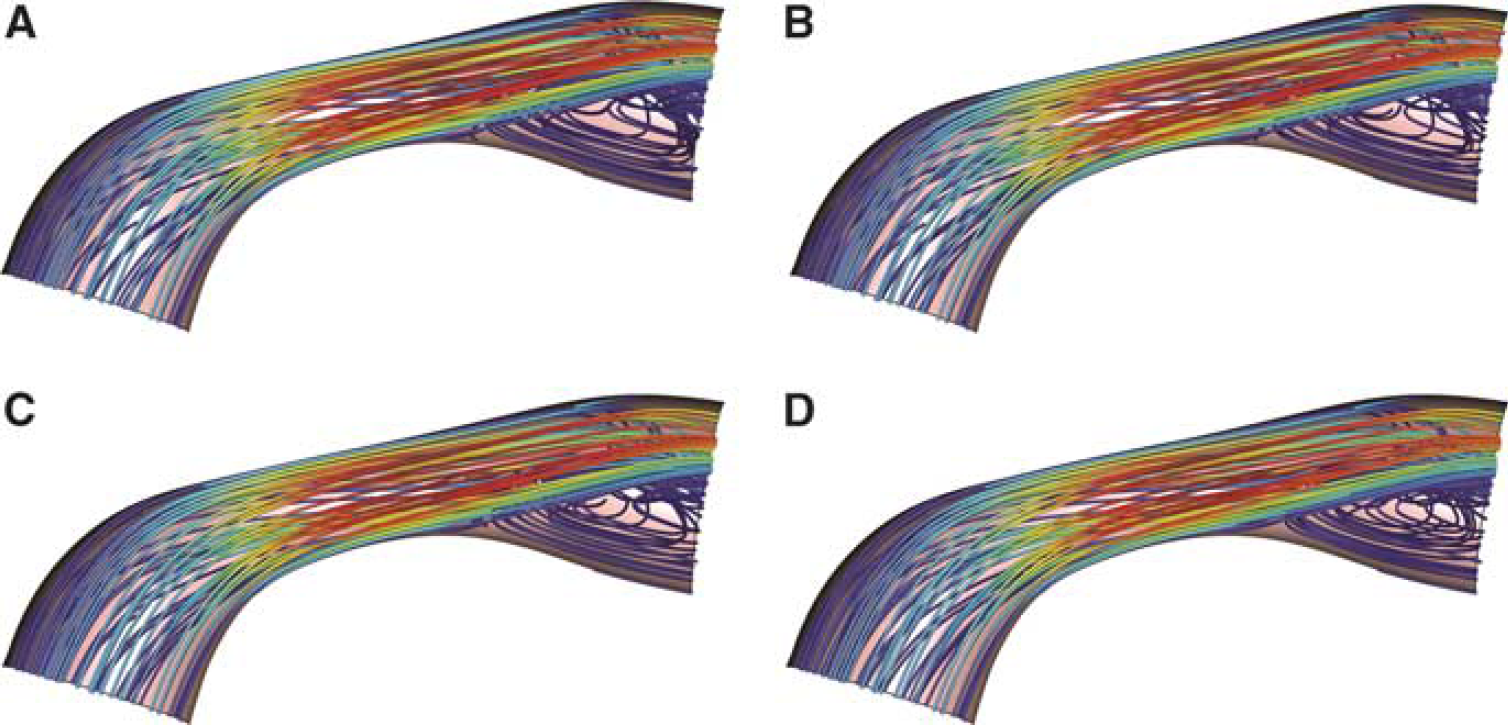
Streamline flow profiles for varying levels of hematocrit at a constant stenosis of 50% (severe stenosis). The hematocrit values displayed include 0.2 (
A more detailed view of fluid flow in the poststenotic region at the M1 segment outlet boundary is given in Figure 5. In the absence of stenosis, the major (z-velocity) flow is directed toward the outer curve of the segment at higher blood pressures. This becomes much more pronounced as the degree of stenosis increases, with the major flow comprising only a fraction of the area of the outlet when stenosis reaches 90%. The majority of the minor (x–y plane velocity) flow is directed from the outer to the inner curve of the outlet.
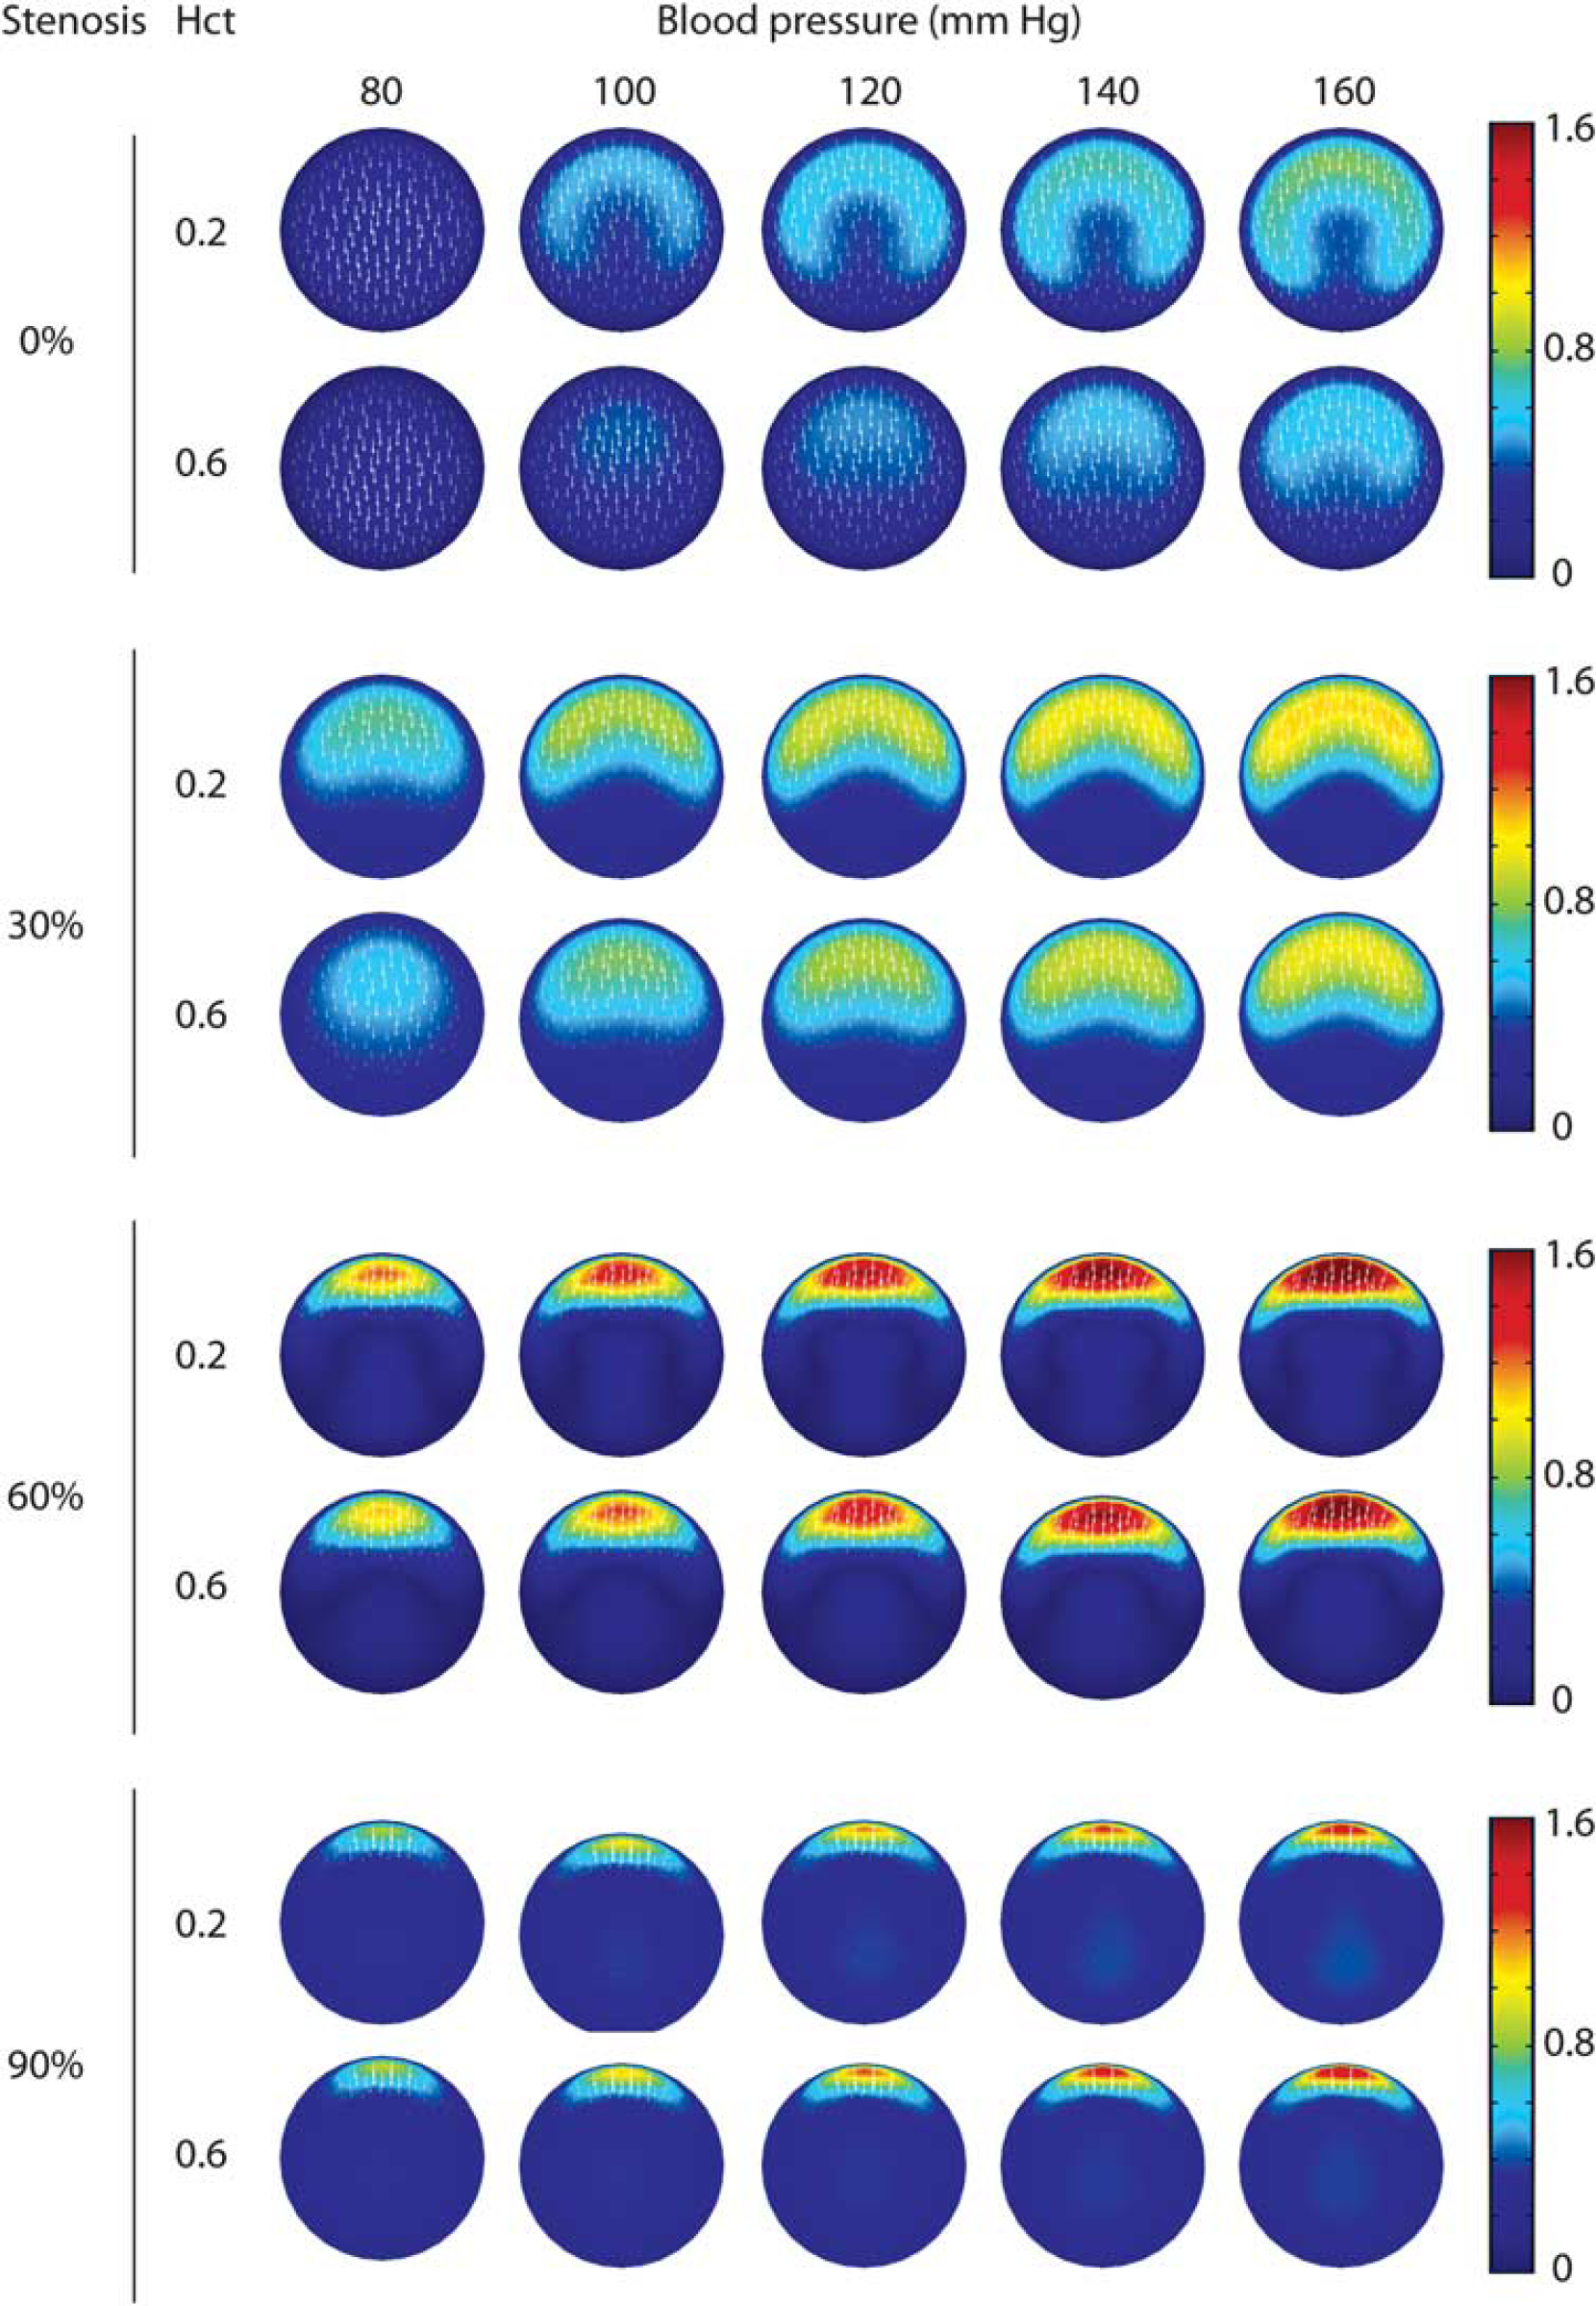
Simulated flow patterns of the poststenotic outlet boundary of the M1 segment at various levels of stenosis, hematocrit, and mean blood pressure. Each panel shows the contours of the z-velocity magnitude and corresponding x–y plane velocity vectors (white arrows). The flow in each panel is computed at the instantaneous velocity of the pressure wave corresponding to the mean pressure. The color scale for the z-velocity is given at the right in m/sec.
The behavior of volumetric blood flow as influenced by hematocrit at four representative levels of stenosis and blood pressure is given in Figure 6. In the absence of stenosis, there is a predictable decrease in flow as hematocrit increases at each level of inlet pressure. In this circumstance, laminar flow predominates and volumetric flow is dependent on the viscosity as determined by hematocrit. There is a large but nonlinear relationship between pressure and flow, in which doubling the pressure results in 2.5 to 3 times the blood flow. The nonlinearity may be caused by non-Newtonian behavior of blood with higher viscosity from lower shear forces found at lower blood flow and a more uniform flow pattern. With a 30% stenosis, this hematocrit and pressure dependence of flow is present, but much less pronounced. At 60% stenosis, flow is relatively independent of hematocrit but more directly related to pressure, and at 90%, there is a paradoxical increase in flow at higher hematocrit at each level of inlet pressure. The most likely explanation of this paradoxical behavior is that at a higher hematocrit level, there is less poststenotic flow disturbance resulting from higher viscosity, and therefore less impedance to flow.
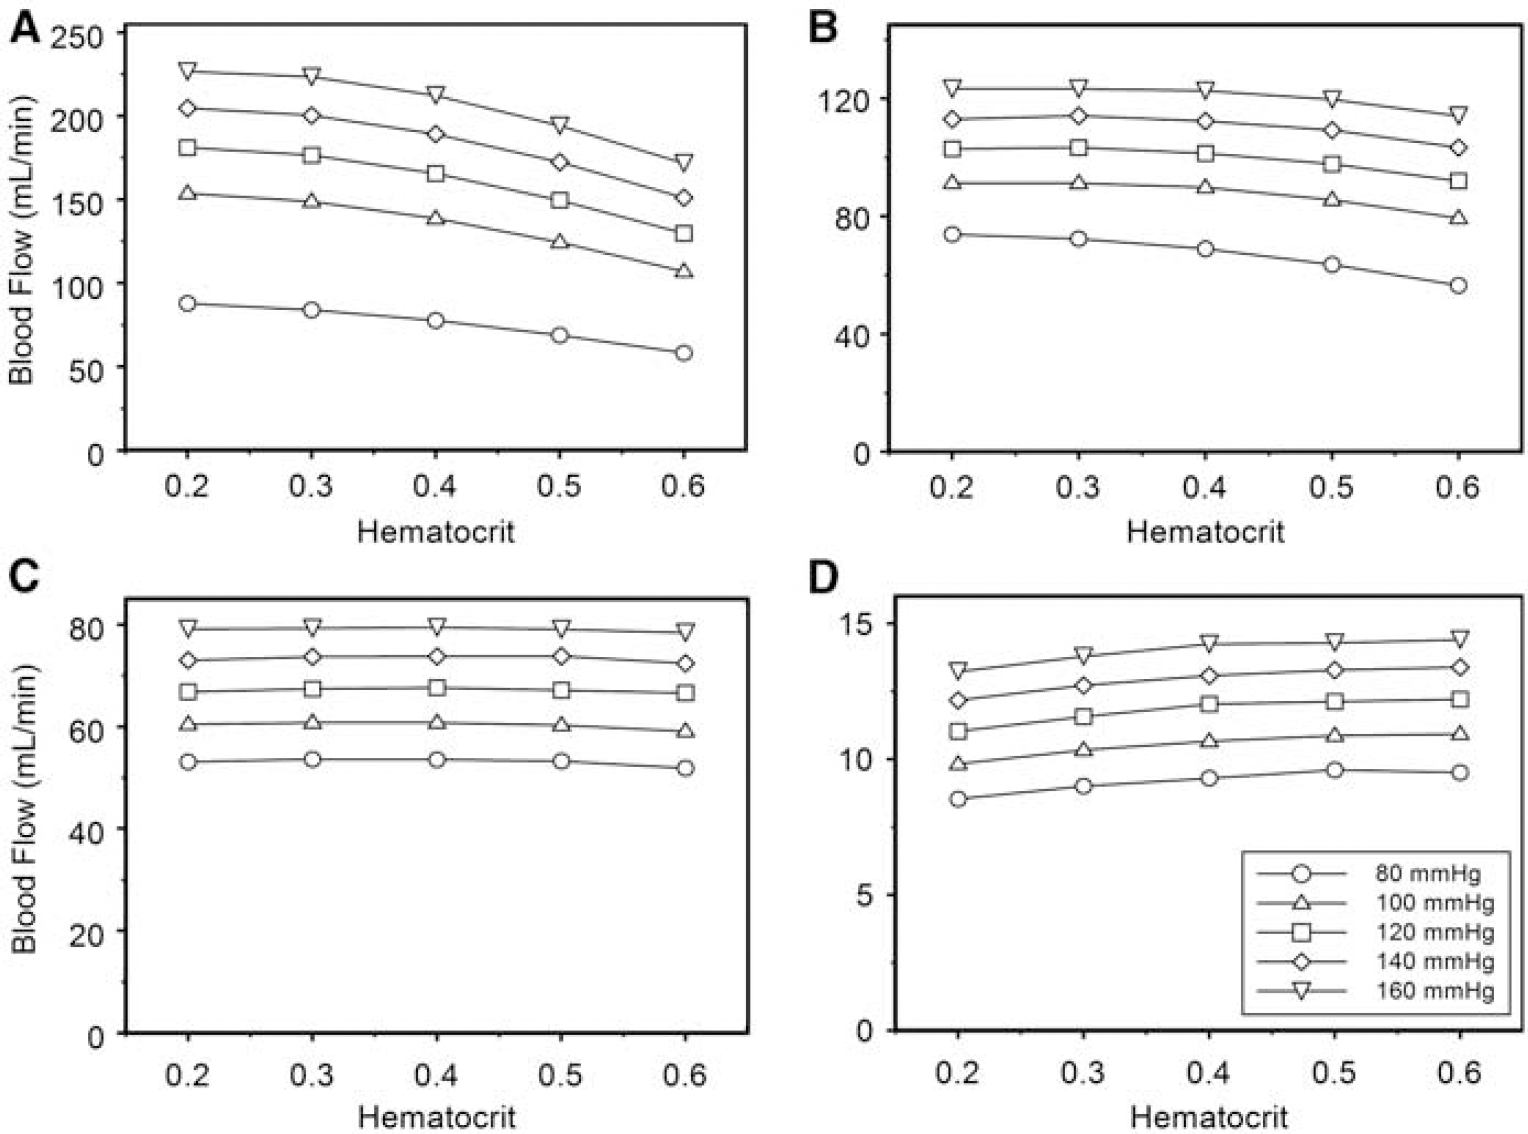
Influence of hematocrit on volumetric blood flow through the simulated M1 segment of the MCA at representative values of stenosis. The five levels of inlet pressure are represented as separate curves within each graph. (
Oxygen transport across the M1 segment was related to hematocrit at all levels of stenosis, with increasing hematocrit resulting in increased oxygen transport despite a reduction in blood flow (Figure 7). The nonlinear relationship between pressure and flow is noted for oxygen transport as well at low or absent levels of stenosis. Improvement in blood flow by decreasing viscosity through hemodilution was associated with a correspondingly greater reduction in oxygen-carrying capacity. There was no level of stenosis at any given inlet pressure in which hemodilution appeared to be beneficial.
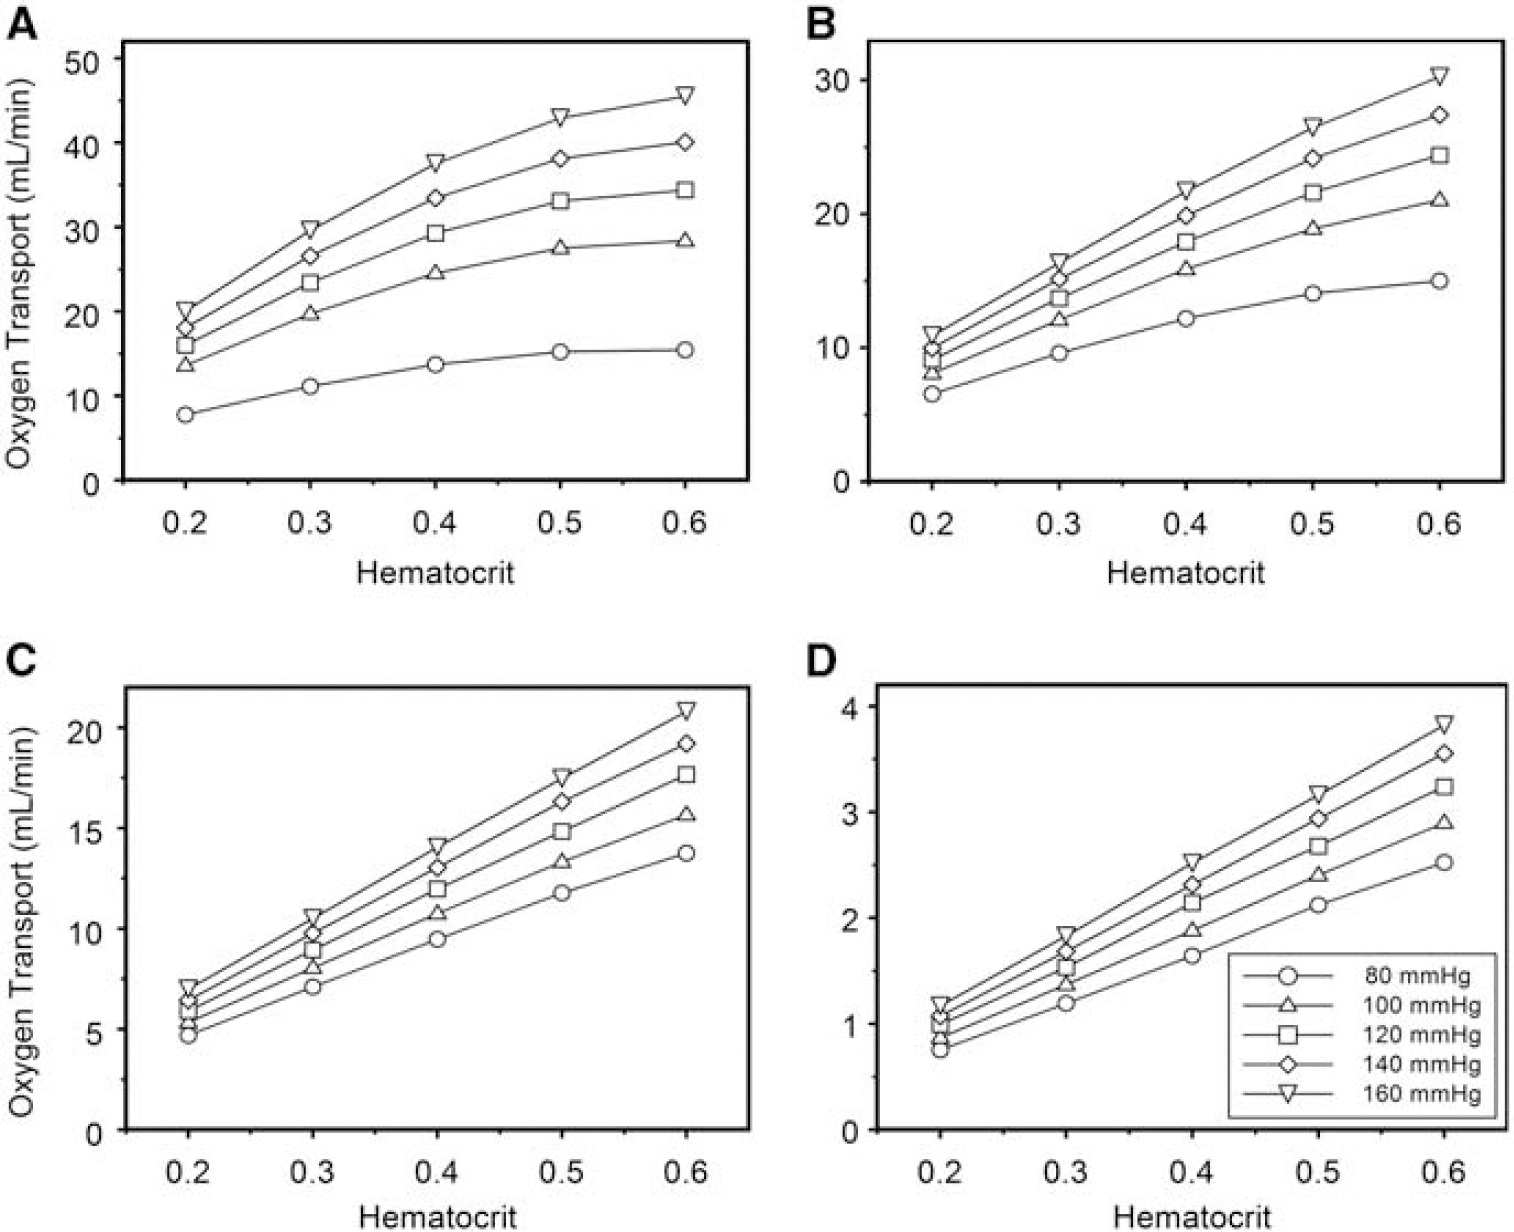
Influence of hematocrit on oxygen transport across the simulated M1 segment of the MCA at representative values of stenosis. The five levels of inlet pressure are represented as separate curves within each graph. (
The use of a pressure inflow boundary condition requires an inlet section to allow flow to fully develop before entrance into the M1 segment. To show that flow was fully developed in our model, we provided a graph of the centerline velocity in the inlet section showing that flow is essentially asymptotic as it approaches the M1 entrance (Figure 8).
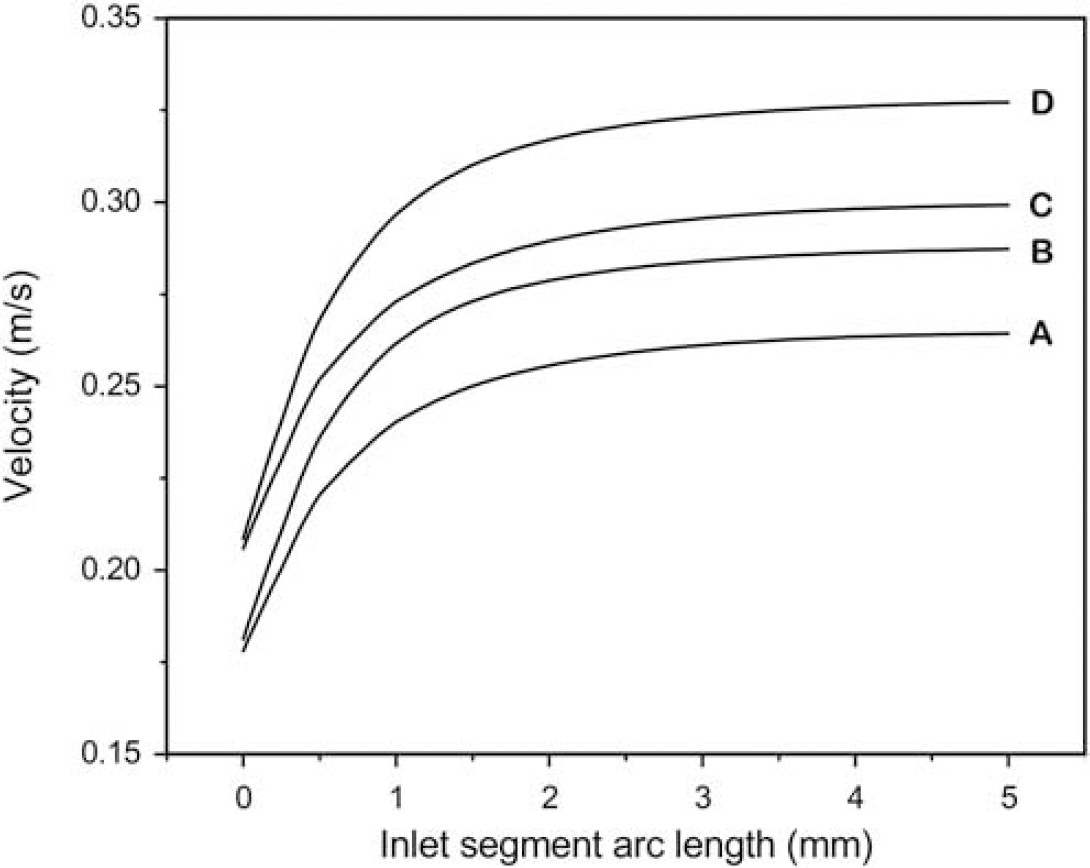
Centerline velocity profile of the inlet segment of the 60% stenosis model showing achievement of constant velocity at the end of the inlet segment (corresponding to the M1 segment inflow boundary). The curves were obtained at the point on the pressure curve corresponding to mean velocity. Curves A and B represent hematocrits of 0.6 and 0.2, respectively, at 80 mm Hg inlet pressure. Curves C and D represent hematocrits of 0.6 and 0.2, respectively, at 160 mm Hg inlet pressure. Corresponding curves for the remaining degrees of stenosis were of identical shape.
Discussion
The prevailing practice for supportive management of postsubarachnoid hemorrhage vasospasm frequently includes hypertensive hypervolemic hemodilution. Two recent surveys of predominant strategies and practices for patients with aneurysmal subarachnoid hemorrhages have been published. One revealed that up to 60% of respondents used HHH therapy prophylactically (Sakowitz et al, 2006), whereas the second found that nearly 30% of respondents actively used the practice (Meyer et al, 2011).
However, this practice is coming under increasing scrutiny (Lennihan et al, 2000; Treggiari et al, 2003). Awad et al (1987) reviewed the existing evidence pertaining to HHH therapy in 1987, and did not find evidence to support hemodilution as an effective component of HHH.
Recently, however, there has been renewed interest in evaluating the role of hemodilution in the management of vasospasm, and a number of studies support the findings of our model that hemodilution may not be beneficial. Ekelund et al (2002) induced isovolemic hemodilution in an animal model with hemoglobin reduced from 119±9 g/L to 92±8 g/L, resulting in an increase in cerebral blood flow from 52.25±10.12 mL/100 g per min to 58.56±11.73 mL/100 g per min. However, cerebral regional delivery of oxygen decreased from 7.94±1.92 mL/100 g per min to 6.98±1.66 mL/100 g per min. Hypervolemia was then induced by autotransfusion, but cerebral blood flow and cerebral regional delivery of oxygen remained unchanged at 51.38±11.34 and 6.77±1.60, respectively. The authors concluded that hemodilution from 0.36 to 0.28 does not help improve oxygen delivery to tissue.
Naidech et al (2007) conducted an observational study of 611 patients with subarachnoid hemorrhage, of which 81 patients received HHH therapy. These patients had a lower mean hemoglobin (106 versus 114 g/L) and nadir hemoglobin (79 versus 94 g/dL). The authors found that higher nadir hemoglobin was associated with reduced risk of poor outcome at 14 days or at the time of discharge.
Rosengart et al (2007) analyzed the prognostic factors for clinical outcome in 3,567 patients with aneurysmal subarachnoid hemorrhage. Multivariate analysis with complete data using binary Glasgow outcome scale found that unfavorable outcome was associated with the absence of therapeutic hypervolemia or induced hypertension. A Cox proportional hazards models revealed that hemodilution was not a significant factor in outcome.
Our computational model addresses the hemodilution and hypertension components of HHH therapy with the goal of gaining insights into the individual components of this combination therapy. Results of our simulations indicate that there are complex poststenotic flow patterns that can alter volumetric blood flow in unexpected ways. At high degrees of stenosis, blood flow was actually paradoxically higher at higher levels of hematocrit. The simulations also indicate that the loss of oxygen content resulting from hemodilution was not compensated by any gain in viscosity-enhanced blood flow, and that higher hematocrit levels in the range studied (0.2 to 0.6) resulted in greater oxygen transport across the stenotic region. We also noted a nonlinear relationship between blood pressure and flow at low levels of stenosis, in which increasing blood pressure resulted in greater flow and oxygen transport increases than expected. Increasing blood pressure above normal at low levels of stenosis provided a greater improvement in oxygen transport than did increasing the hematocrit. This relationship was not noted at critical levels of stenosis, however, where one would expect HHH treatment to be instituted. At critical stenosis levels, increasing hematocrit seems to confer greater increases in oxygen transport than does increasing blood pressure.
Given that many, if not most, patients treated with volume expansion in the management of cerebral arterial vasospasm develop anemia even without a direct attempt to induce it, this study also raises the question as to whether transfusion of patients with anemia to a more favorable hematocrit might be warranted. Such a question could be the subject of future clinical trials.
There are several limitations of this model. Our model assumed a constant downstream resistance, so that alterations in flow were assumed to be the result of stenosis in the M1 segment alone. In reality, downstream resistance may vary under different physiologic and rheological conditions, but at critical levels of stenosis, the majority of vascular resistance is in the stenotic region. The outlet geometry of our idealized model did not include bifurcation of the MCA, and it is conceivable that there could be additional poststenotic flow effects that are otherwise not included. We assumed a single symmetric stenosis, whereas vasospasm can induce stenoses with various morphologies. We modeled blood as a single-phase fluid, whereas blood consists of two phases (namely cells and plasma). Given that the density of erythrocytes is close to that of plasma and because blood flow rates associated with MCA flow are high, there should be only a negligible difference from a two-phase model.
Our choice of a pressure boundary condition was necessary because we had no previous knowledge of the flows present at the given levels of pressure. This is in contrast to many computational models of the arterial system, which uses a flow boundary condition based on experimentally or clinically measured flows (Hayase et al, 2011; Milner et al, 1998; Steinman et al, 2000). The limitation of this approach is that the flow pattern is highly dependent on upstream geometry that can vary from among patients, which we are not able to simulate.
This computational simulation provides evidence that at clinically significant degrees of vasospasm, hemodilution as an individual component of therapy does not improve oxygen delivery through the resulting stenosis. On the contrary, this model suggests that ischemia may be worsened by reducing hemoglobin to less than normal values, and raises the question of whether transfusion to a more optimal hemoglobin level may be beneficial.
Footnotes
The authors report no conflict of interest concerning the materials or methods used in this study or the findings specified in this paper.