
Abstract
To examine the impact of excessive erythrocytosis on local cerebral blood flow (CBF) and cerebral glucose metabolic rate (CMRglc), we made use of our constitutively erythropoietin (Epo)-overexpressing transgenic mouse line (tg-6) that reach a mean hematocrit of 0.87. Compared with wild-type (wt) control siblings, CBF decreased by 44% in tg-6 mice, while upon hemodilution (tg-6-HD) to a physiologic hematocrit (e.g., 0.44) tg-6-HD mice returned the CBF to wt levels. Cerebral blood flow was determined in another transgenic mouse line that overexpresses human Epo in the brain only (tg-21): CBF increased by 17% compared with wt controls. However, oxygen delivery was similar in all four mouse groups tested (wt, tg-6, tg-6-HD and tg-21). Mean CMRglc was higher in tg-6 (+72%), tg-6-HD mice (+43%) and tg-21 (+22%) than in wt mice. Local CMRglc was higher in all 40 brain regions in tg-6 but only in 15 and 8 regions in tg-6-HD and tg-21 mice. These results show that prolonged increases in hematocrit did not alter cerebral oxygen delivery at a decreased CBF and increased CMRglc. Hemodilution suggests that high blood viscosity is a cause of the decrease in CBF and partly of the increase in CMRglc. Cerebral glucose metabolic rate may also be increased by a direct effect of Epo in the brain (tg-21 mice).
Introduction
Under physiologic conditions, cerebral blood flow (CBF) varies inversely with the arterial oxygen content whereas changes in blood viscosity do not directly affect CBF (Brown and Marshall, 1985; Brown et al, 1985; Hudak et al, 1986; Waschke et al, 1994a). Acute changes in blood viscosity appear to be compensated by a dilation or constriction of cerebral blood vessels resulting in an unchanged oxygen delivery to the brain. The limit of such a compensatory mechanism has been tested for the situation of an increased blood viscosity. A maintained CBF because of compensatory regional vasodilation was observed until hematocrit was decreased to 0.19. Below this hematocrit, a decrease in CBF was found in rats indicating an unstripped vasodilating reserve (Rebel et al, 2001). Whereas these experiments have indicated a low impact of changes in blood viscosity over a wide range of blood viscosities, a higher impact of blood viscosity on CBF has been concluded from results obtained in sheep. When hematocrit was raised from 0.30 to 0.55 approximately 60% of the fall in CBF has been attributed to the increase in blood viscosity (Massik et al, 1987). It is not known how CBF is affected by a further increase of the hematocrit. The effects of such high hematocrits can now be studied, since transgenic mice that overexpress erythropoietin (Epo) systemically show hematocrits of 0.85 and higher (Ruschitzka et al, 2000; Shibata et al, 2003; Vogel et al, 2003).
We tested the hypothesis that a very high blood viscosity results in a considerable reduction of CBF that in turn is uncoupled from cerebral metabolism. Therefore, our transgenic mouse line (tg-6) with elevated Epo levels in brain and plasma was compared with wild-type (wt) siblings to verify the effect of a prolonged increase in viscosity on CBF and CMRglc. To test as to whether the observed effects on CBF or CMRglc is influenced directly by Epo, we made use of our second transgenic mouse line that overexpresses Epo solely in the brain (tg-21) at a normal systemic hematocrit. To further determine the influence of a prolonged increase in hematocrit on CBF and CMRglc, the high blood viscosity of tg-6 mice was acutely reduced to normal values by hemodilution to a normal hematocrit (tg-6-HD). We propose that both increased blood viscosity and direct Epo interaction in the brain influence CBF.
Materials and methods
Animals
After approval by the institutional animal care committee (Regierungspräsidium Karlsruhe, Germany), the experiments were performed on 88 female mice weighing 23.4±3 g. Animals were generated as previously described (Ruschitzka et al, 2000; Wiessner et al, 2001). In brief, following microinjection of the plasmid for human Epo into the pronuclei of fertilized oocytes, two different stems resulted—the transgenic lines tg-6 and tg-21. In tg-6 mice, Epo protein levels increased 12-fold in the blood and 26-fold in the brain as assessed by radio immunoassay (RIA) (Wiessner et al, 2001). Breeding of tg-6 animals was performed by mating hemizygous males to wt littermates (C57Bl6), the latter being used as control group. The second transgenic line tg-21 overexpresses Epo four-fold in neuronal tissue (Wiessner et al, 2001) and was bred to homozygoty. During and after breeding, animals were kept under temperature-controlled environmental conditions on a 14:10 light:dark cycle, were fed standard diet (SSniff, Spezialdiäten, Soest, Germany) and allowed free access to food and water ad libitum until starting the experiments.
Study Groups And Experimental Protocol
Three- to six-month-old female mice (weighing 19 to 32 g) were placed in a small box and anesthetized by inhalation of a gas mixture of isoflurane, oxygen (40%) and nitrous oxide. Afterwards, 1 MAC of isoflurane (Forene; Abbott, Wiesbaden, Germany) was administered using a precalibrated vaporizer (Fortec; Cyprane Keighley, UK) by inhalation via a nose cone. Cannulation of the right femoral artery and vein were performed using polyethylene catheters (PE-10, Labokron, Sinsheim, Germany). In addition, high hematocrit (tg-6) mice were hemodiluted with albumin 5% (Human Albumin 5%, Behring Pharmacia, Erlangen, Germany) to a normal hematocrit (forming group tg-6-HD). Continuously, a quartz pressure transducer (Hewlett-Packard, Palo Alto, CA, USA) registered mean arterial blood pressure and heart rate. Insertion of catheters into femoral vessels in isoflurane anesthesia was followed by a recovery period of 1 h. During a recovery period, mice were placed in restrainers to allow little movement but preserved inserted catheters. Body temperature was measured by a rectal probe using ultrafast microthermocouple probes (IT-23, diameter 0.3 mm, Almemo 2290-3S Thermometer, Hugo Sachs Elektronik, March, Germany), kept constant at 37°C to 38°C with a heating pad and lamp during both the surgical preparation and recovery (Harvard Ltd, Kent, England). Physiologic parameters were assessed and recorded just before the determination of CBF or CMRglc. Arterial blood gases were checked in a pH/blood gas analyzer (AVL Gas Check 939; AVL, Graz, Austria), hematocrit was determined by a routine capillary centrifugation (Haematokrit 24, Hettich, Tuttlingen, Germany); plasma glucose was assessed by an enzymatic assay (Glucose Analyzer 2, Beckmans, Germany). Total hemoglobin content, percent arterial oxyhemoglobin saturation and total arterial oxygen content of whole blood were measured using a hemoximeter (OSM3, Radiometer Brønshøj, Denmark) adjusted for mouse blood. Blood viscosity was measured by a digital stress rheometer (DV-III+, Brookfield, Middleboro, MA, USA) using 200 μl whole blood at 37°C as previously described (SEP 522, Brookfield, Middleboro, MA, USA) (Vogel et al, 2003). Plasma and tissue Epo levels were investigated by enzyme-linked immunosorbent assay and RIA, respectively, as previously published (Ruschitzka et al, 2000).
Measurement of Local Cerebral Blood Flow and Local Cerebral Glucose Metabolic Rate
Wt mice, tg-6 (high hematocrit) and tg-21 (brain Epo) were allowed to recover from anesthesia after instrumentation of the femoral vessels. Thereafter, the animals were placed in a restrainer and were studied approximately 60 min after recovery from anesthesia. Moreover, tg-6 mice were hemodiluted by an isovolemic blood exchange at a rate of 0.1 ml min−1 with albumin (Human Albumin 5%, Behring Pharmacia, Erlangen, Germany) to a normal target hematocrit of 0.45 (forming group tg-6-HD). In each group, 16 animals were randomized to be used either for the autoradiographic determination of local CBF (n=8) or for the measurement of local CMRglc (n=8), according to the methods described in the rat (Sakurada et al, 1978; Sokoloff et al, 1977). These autoradiographic methods were adapted to mice according to the previous use in this species (Jay et al, 1985, 1988).
For the measurement of local CMRglc, 125 μCi/kg bw of 2-[1-14C]deoxy-
The method of measurement of local CBF was performed as previously reported by our laboratory (Frietsch et al, 2001, 2004) with the following modifications for mice: The catheter flow lag time has been separately determined and was found to be increased 2.5-fold in tg-6 animals compared with normal animals. The washout correction rate constant was 40/min (Jay et al, 1988). The brain—blood partition coefficient for iodo [14C]antipyrine was measured by incubation of mouse brain slices of 50 μm thickness with whole mouse blood (n=4) of a defined radioactivity as previously described (Waschke et al, 1993). It was found to be 0.7 in our mice without a difference between the transgenic lines.
Autoradiographic images were converted to digitized optical density images by an image processing system (MCID; Imaging Research, St Catharines, Canada). For measurements of separate brain structures, an ellipsoid cursor was used and adjusted to the size of the individual region. For measurement of mean global CBF or mean global CMRglc (in the following referred to as mean CBF and mean CMRglc), coronal sections were analyzed as a whole at distances of 200 μm and the values were summarized to obtain the area-weighted means of all measured sections (Lenz et al, 1998). Mean oxygen delivery (OD) was calculated from arterial oxygen content of each animal times the respective mean cerebral blood flow.
Statistical Analysis
Differences between the experimental groups were evaluated by analysis of variance, and Bonferroni correction was used when multiple comparisons were performed. Data are presented as mean±s.d. and a P-value ≤0.05 was considered statistically significant. The overall relationship between local CMRglc and local CBF in the examined structures of the brain (Figure 2) was assessed by the least-squares fit of the data to y=ax+b, where x is the mean local CMRglc in a given region, and y is the mean local CBF in that same area. Contrasts of slopes of the local CBF/local CMRglc regression lines were tested by common t-test statistics with Bonferroni correction for multiple comparisons. Owing to the limitations of this kind of analysis, an additional more rigorous statistical approach using log-transformed data was applied, examining the relationship of local CBF and local CMRglc by a repeated measure of the analysis of variance according to McCulloch et al (1982) and Ford et al (1991). For this analysis, a computer software package (BMDP2v, BMDP Statistical Software Inc., Los Angeles, CA, USA) considering interanimal variability and enabling the detection of heterogeneities in the relationship between local CMRglc and local CBF was used.
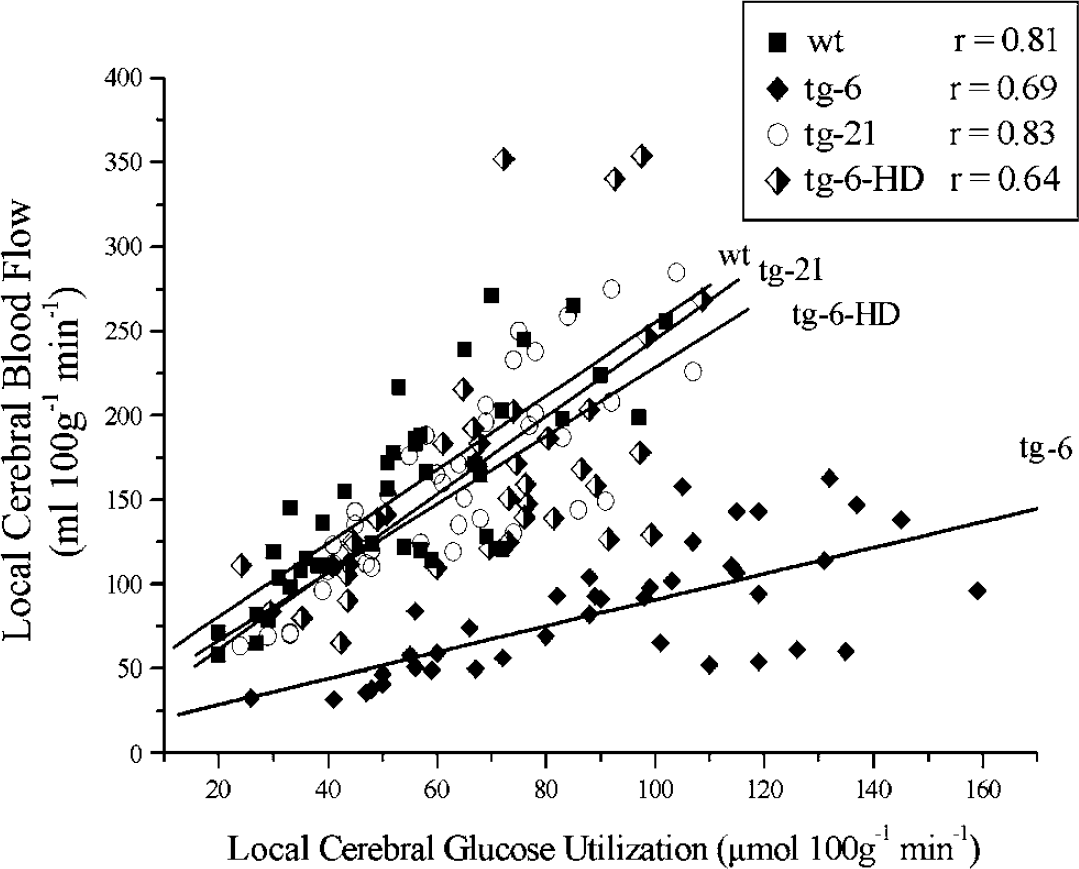
Relationship between local cerebral blood flow and local cerebral glucose utilization in wt mice (wt, black squares), mice overexpressing Epo solely in the brain (tg-21, whole diamonds), mice with a systemic overexpression of Epo (tg-6, hollow circles) and hemodiluted tg-6 mice (tg-6-HD, bisected diamonds). The slope of the regression line of tg-6 mice differed from the others (P≤0.05).
Results
Physiologic variables did not differ between wt and tg-21 groups (Table 1). Tg-6 mice showed a higher arterial oxygen content of 32 ml dl−1, compared with 17, 14 and 17 ml dl−1 in wt, tg-6-HD and tg-21. Also, hematocrit of tg-6 was 0.87 as compared with 0.44, 0.44 and 0.42 in other groups. Mean blood viscosity increased 3.94-fold at physiologic shear rates ranging from 2 to 450 s−1 (Figure 1). Acute hemodilution of tg-6 mice to a normal hematocrit resulted in a decreased PaCo2, mean arterial pressure and increased heart rate (Table 1).
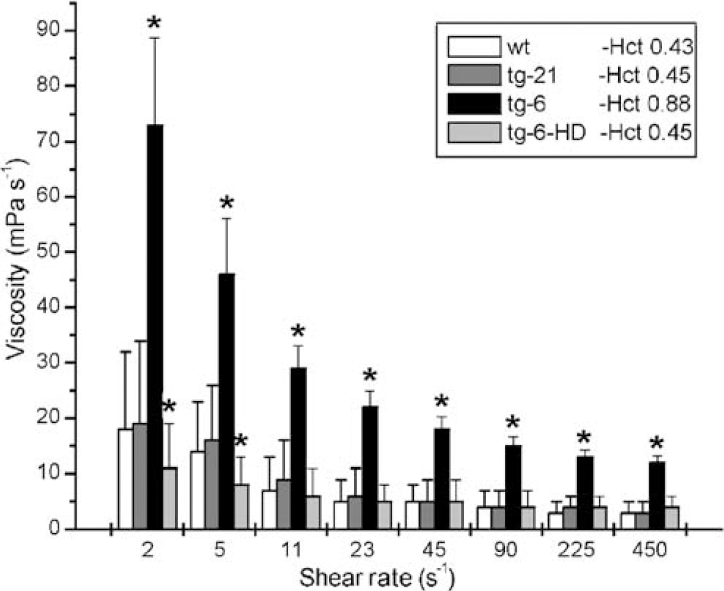
Shear stress-dependent whole-blood viscosity in wt mice (wt, white columns), mice overexpressing Epo solely in the brain (tg-21, hatched columns), mice with a systemic overexpression of Epo (tg-6, black columns) and hemodiluted tg-6 mice (tg-6-HD, grey columns). ∗P≤0.05 versus wt mice. Hct-hematocrit.
Hematologic and hemodynamic parameters of transgenic mice
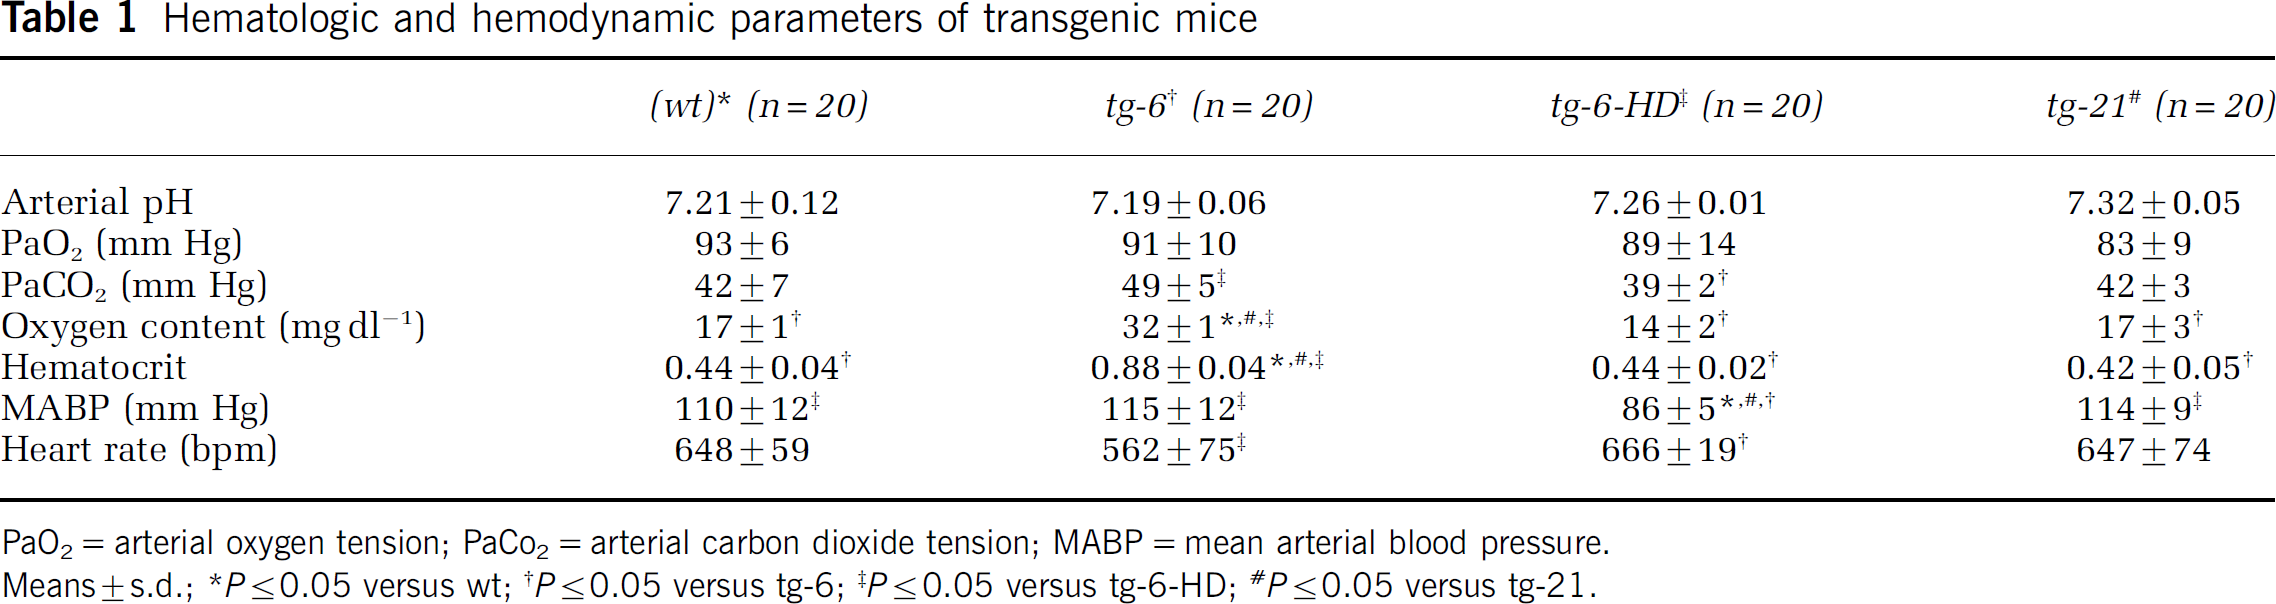
PaO2=arterial oxygen tension; PaCo2=arterial carbon dioxide tension; MABP=mean arterial blood pressure.
Means±s.d.; ∗P≤0.05 versus wt; †P≤0.05 versus tg-6; ‡P≤0.05 versus tg-6-HD; #P≤0.05 versus tg-21.
Compared with wt, mean CBF was reduced in tg-6 by 44% (P≤0.05) whereas CBF in hemodiluted tg-6 mice (tg-6-HD) was not different from CBF in wt mice (8%, NS) (Table 2). In contrast, mice overexpressing Epo in the brain (tg-21) had a 17% higher mean CBF (P<0.05). On the local level, compared with wt, local CBF was lower in all brain structures in tg-6 mice (P<0.05) but was unchanged in all brain regions in tg-21 mice (Table 2). However, mean oxygen delivery (OD) was similar (NS) in all groups — wt (20.82±3.17 ml 100 g−1 min−1), tg-6 (21.76±2.79 ml 100 g−1 min−1), tg-6 HD (17.97±1.14 ml 100 g−1 min−1) and tg-21 (21.92±3.85 ml 100 g−1 min−1).
Cerebral blood flow of experimental groups
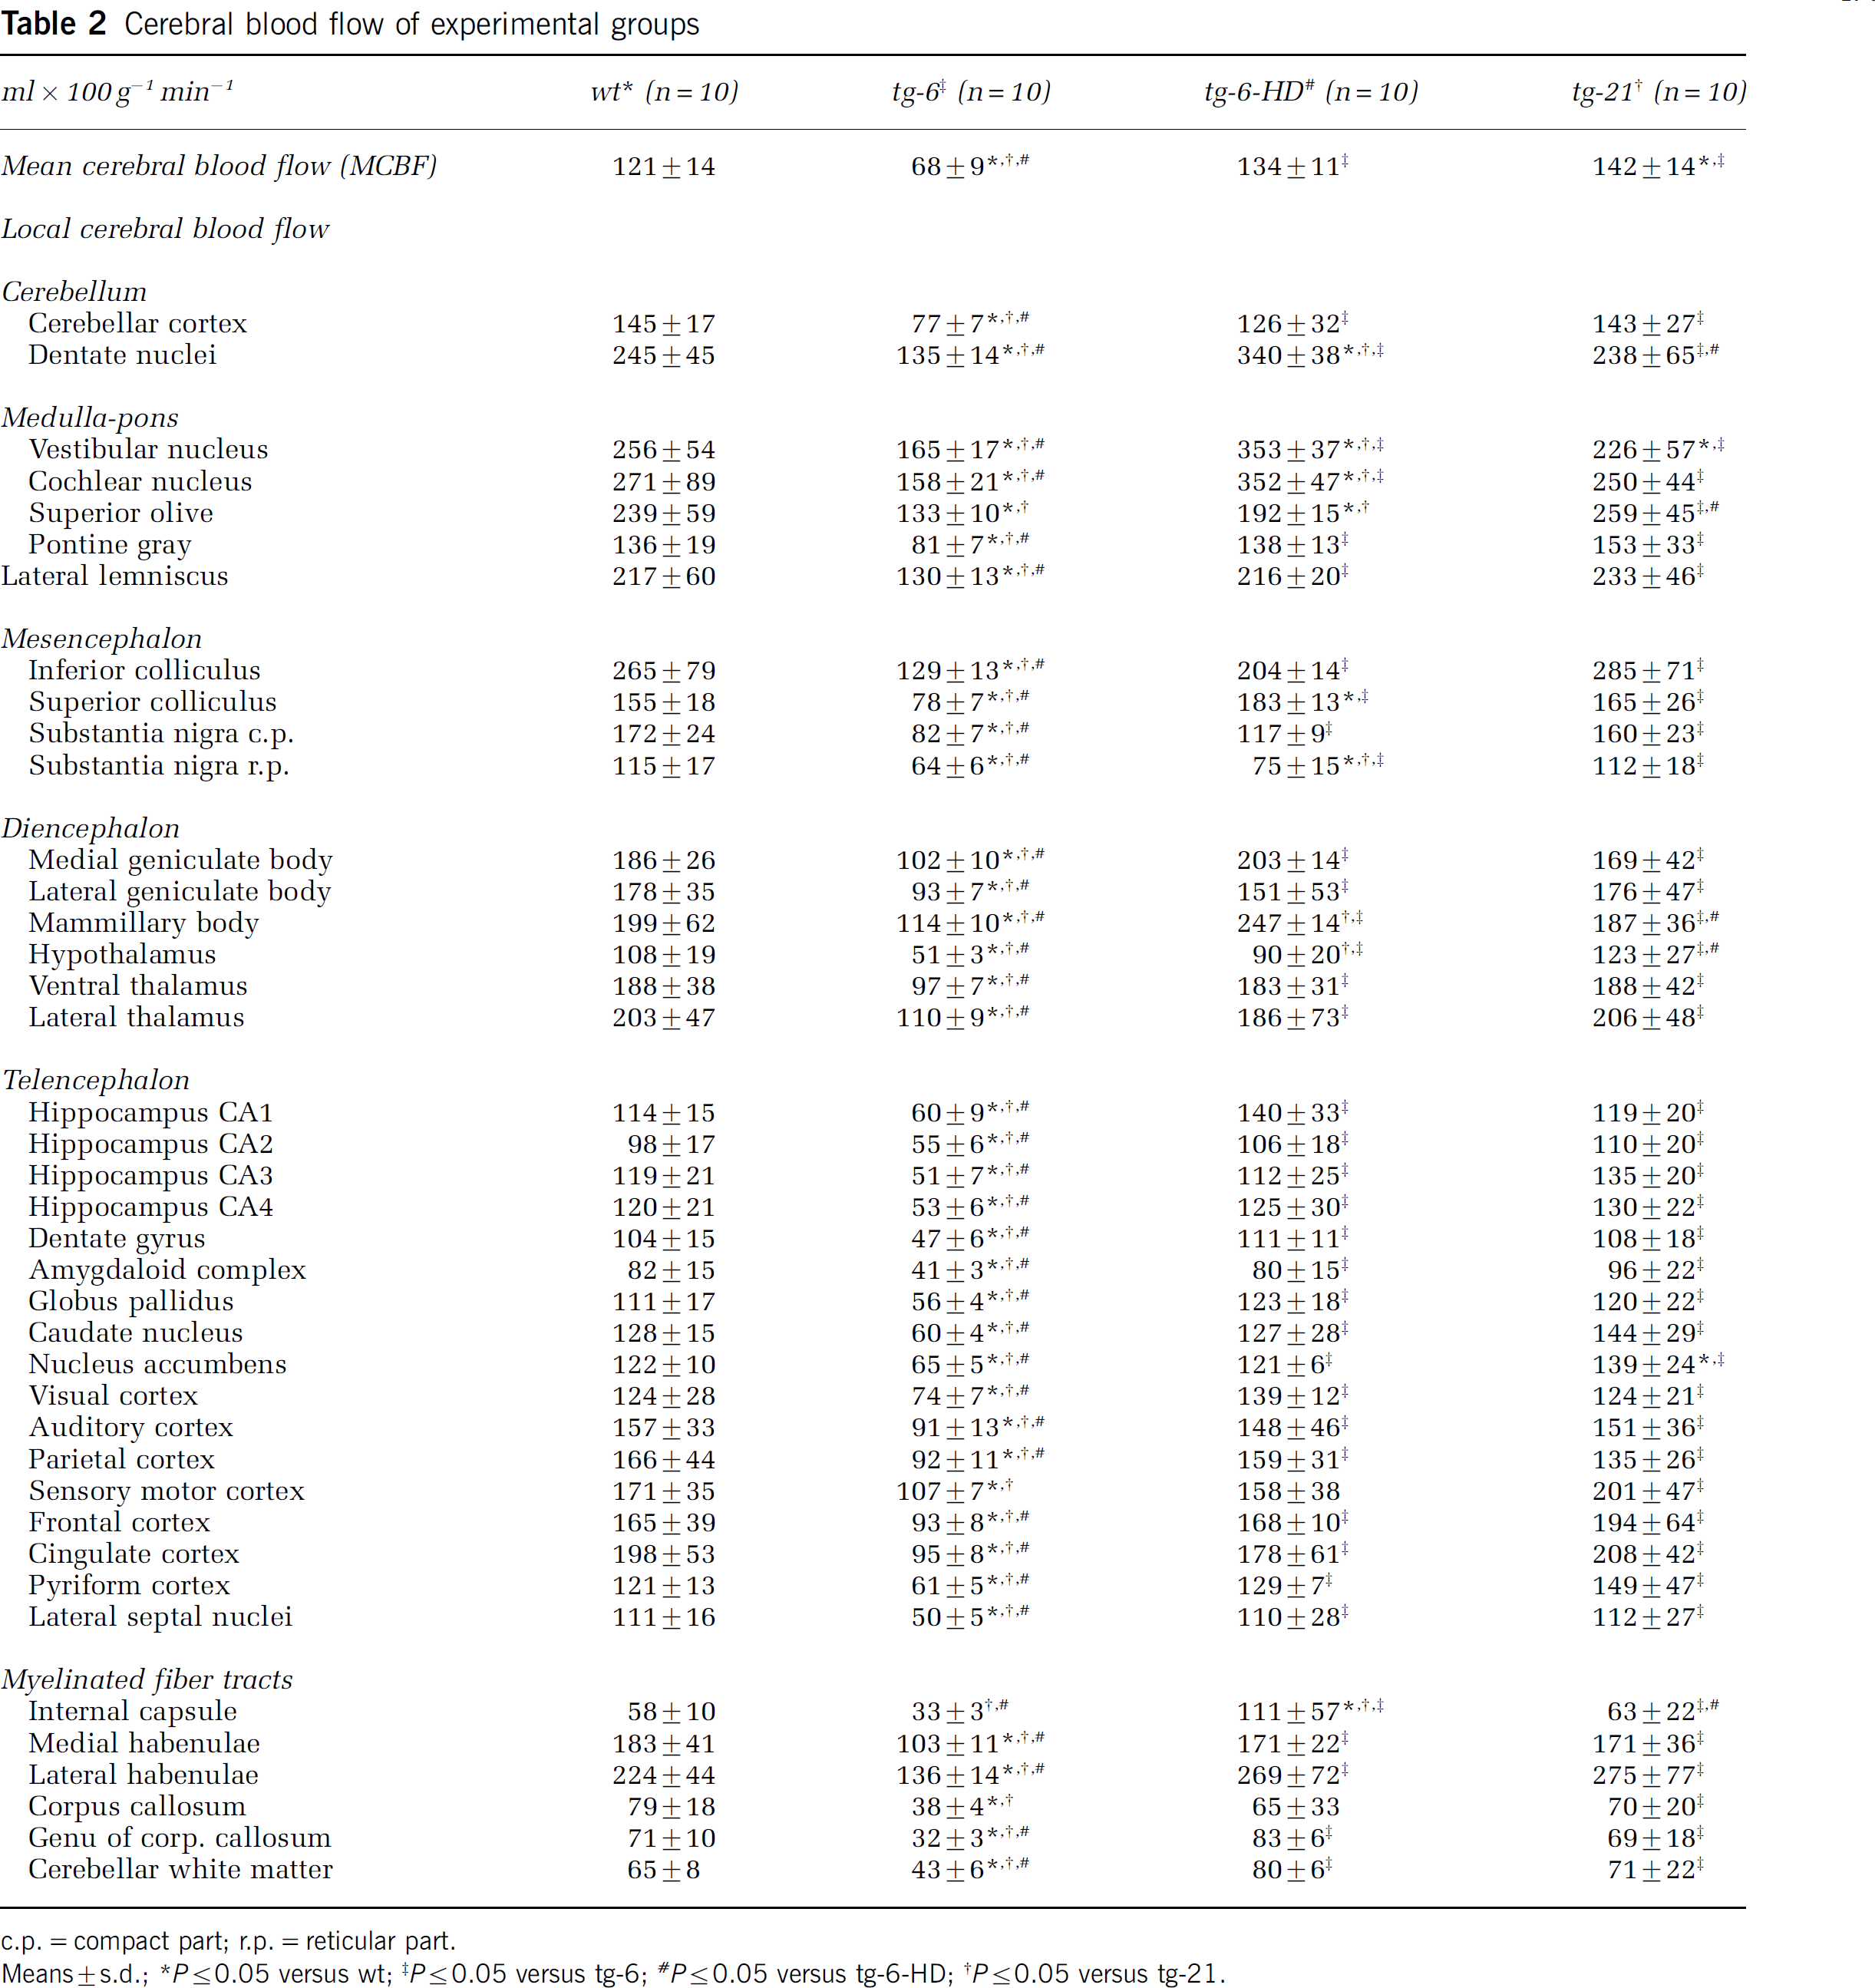
c.p.=compact part; r.p.=reticular part.
Means±s.d.; ∗P≤0.05 versus wt; ‡P≤0.05 versus tg-6; #P≤0.05 versus tg-6-HD; †P≤0.05 versus tg-21.
Compared with wt, mean CMRglc was 72% higher in tg-6 mice, 22% higher in tg-21 mice and 43% higher in tg-6-HD (P<0.05 for the three groups) (Table 3). On the local level, local CMRglc was higher in all 40 brain regions in tg-6 than in wt but only in eight regions in tg-21 (Table 3). After hemodilution of tg-6 mice, local CMRglc was lower in the tg-6-HD mice than in the tg-6 mice except for six brain regions but still remained increased (compared with wt mice) in 27 of 40 analyzed brain regions.
Cerebral glucose utilization of the experimental groups
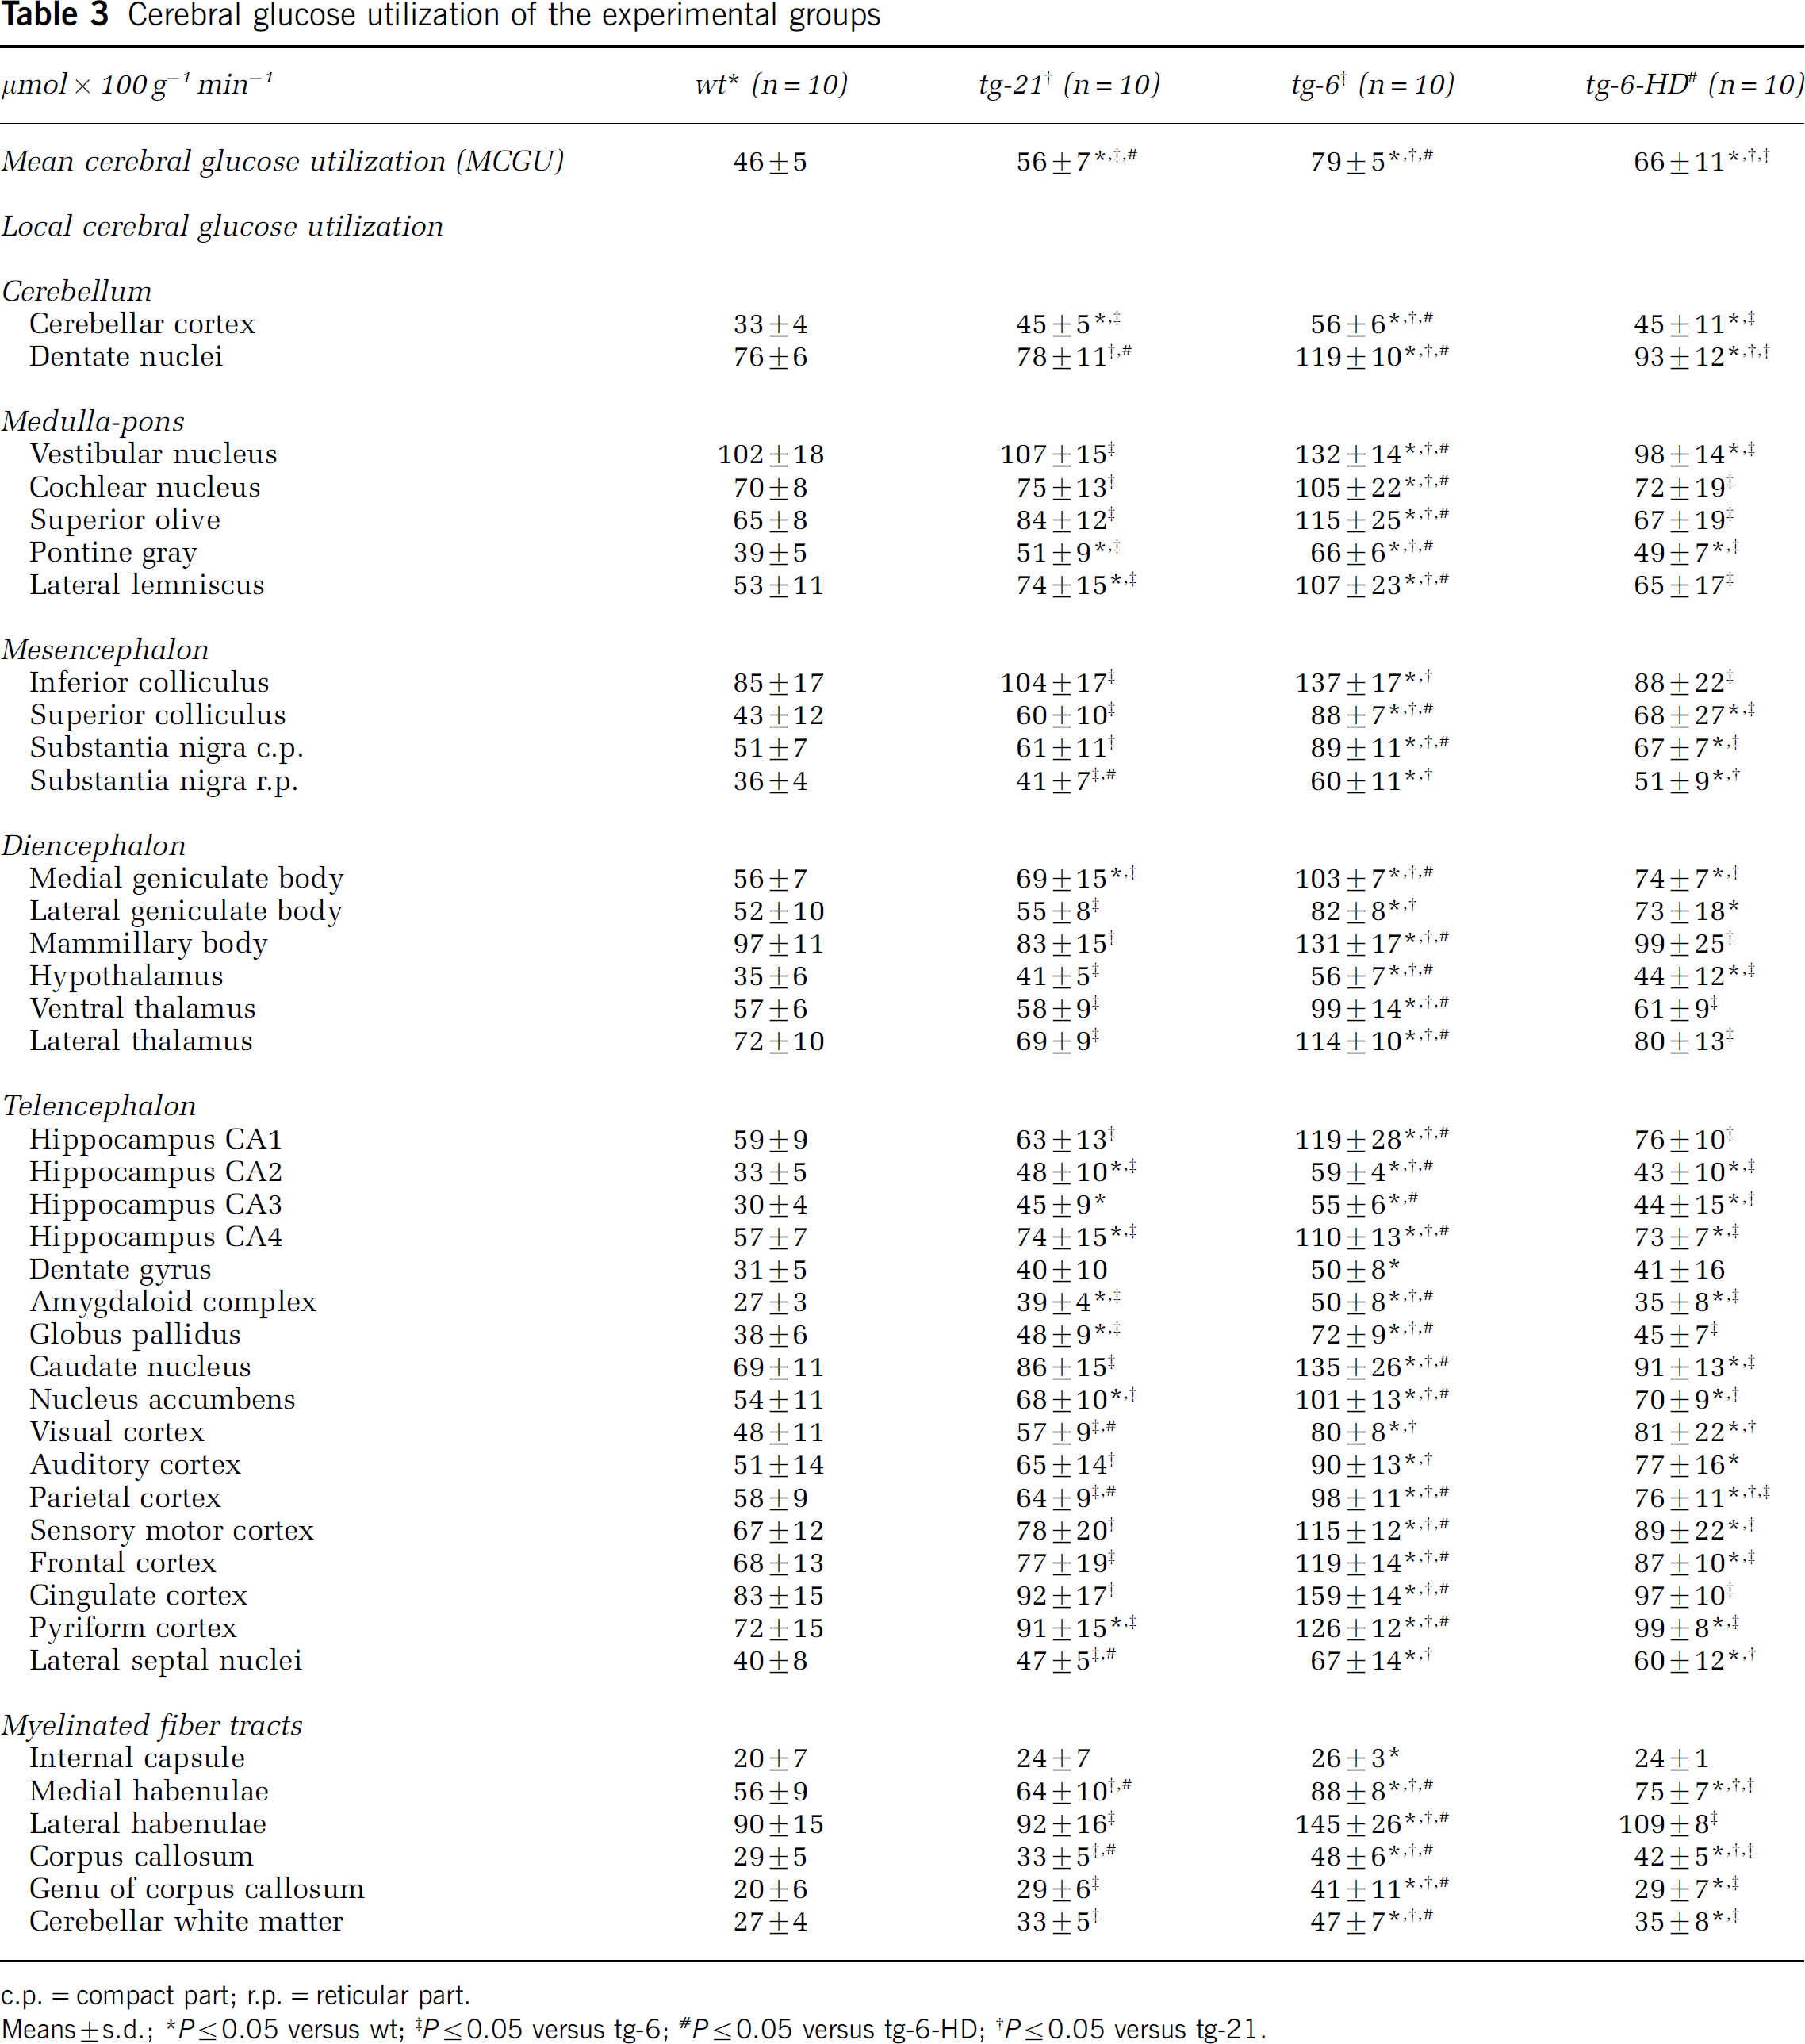
c.p.=compact part; r.p.=reticular part.
Means±s.d.; ∗P≤0.05 versus wt; ‡P≤0.05 versus tg-6; #P≤0.05 versus tg-6-HD; †P≤0.05 versus tg-21.
The relationship between local CMRglc and local CBF was shifted to a lower level in the tg-6 mice (P<0.05) but was identical for wt, tg-21 and tg-6-HD mice (NS) (Figure 2).
Discussion
Transgenic mice overexpressing systemically Epo (tg-6) show a CBF, which is lower by 44% and a CMRglc which is higher by 72% than wt mice. The lower CBF in the tg-6 mice can be explained by the four-fold higher blood viscosity in these mice, which resulted in an increased resistance to flow. This conclusion is based on the fact that hemodilution of the tg-6 mice to a normal hematocrit resulted in a restitution of normal CBF (tg-6-HD-group). In contrast to the decrease in CBF observed in tg-6 mice, the increase in CMRglc in this group appears to be caused by several factors. One factor might be the increased blood viscosity in the tg-6 group since hemodilution results in a significant reduction of CMRglc although not to the normal values of the wt mice. As an additional factor, a direct influence of Epo on brain metabolism was tested. Transgenic mice overexpressing Epo solely in the brain (tg-21) showed a significantly higher CMRglc than wt mice.
From the measured values of CBF and oxygen content of the blood, oxygen delivery could be calculated. Although blood viscosity was about four times higher in tg-6 mice, oxygen delivery was identical in wt and tg-6 mice, which indicates vascular compensatory mechanisms that allowed keeping oxygen delivery constant in spite of a higher blood viscosity. The constant oxygen delivery in the tg-6 mice was measured together with an increase in glucose utilization, which raises the question of an adequate oxygen delivery under these conditions. By the assessment of the relationship between local CBF and local CMRglc in tg-6 mice, it could be shown that it was maintained although shifted to a new level.
Transgenic mice overexpressing Epo appear to be well suited to investigate the influence of a high blood viscosity on CBF. The four-fold increase in viscosity and the resulting high shear rates in the vascular system represent a challenge for the regulation of CBF. The results of the present study show that even under these conditions, CBF is regulated in such a way that oxygen delivery is identical in tg-6 mice with that of wt mice. The capability of the tg-6 mice to adjust CBF to different oxygen contents of the blood is shown by the fact that isovolemic hemodilution back to a normal oxygen content of the blood resulted in values of CBF, which were identical with those of wt mice as early as 1 h after hemodilution. This finding is in accordance with previous experiments of our group (Rebel et al, 2001; Waschke et al, 1994b) and others (Cole et al, 1994; Ulatowski et al, 1996), which showed an adjustment of CBF to keep the oxygen delivery to the brain constant at varying blood viscosities. The decrease in CBF measured in the tg-6 mice is at variance with results previously obtained from the same strain of tg-6 mice. We have previously reported CBF values that were not different from those of control wt mice of a normal hematocrit (Wiessner et al, 2001). This discrepancy may be explained by the differing methods of CBF measurement. In the study of Wiessner et al (2001), CBF was determined semiquantitatively by bolus tracking magnetic resonance imaging. In contrast, in the present study, a quantitative method of CBF measurement has been used. Great care was taken in the present study to adjust the method to the special conditions of high blood haematocrit. The catheter flow lag time and the brain/blood partition coefficient were reassessed, and the washout correction rate constant was corrected for the respective groups.
Whereas CBF was lower (−44%) in the tg-6 mice than in the wt mice, CMRglc was considerably higher (+72%). To explain the increase in CMRglc, two possibilities have been tested. One explanation is that CMRglc is increased because of the high viscosity of the blood in the tg-6 mice. The other explanation is that CMRglc is affected by an action of Epo on brain metabolism. The obtained results indicate that both factors may contribute to the higher CMRglc in tg-6 mice. Concerning the effect of high hematocrit/viscosity on CMRglc, the experiments in which the high-hematocrit mice (tg-6 HD) were hemodiluted to a normal hematocrit (tg-6 HD) showed a reduction of CMRglc from 79 μmol × 100 g−1 min−1 to 66 μmol × 100 g−1 min−1. Although this means a significant reduction, CMRglc is still higher than in control wt mice, which showed a value of CMRglc of 46 μmol × 100 g−1 min−1. It is concluded from these findings that the high hematocrit/viscosity is one of several factors that cause a higher CMRglc in the tg-6 mice than in the wt mice, for example, by shear stress induced gene expression. Another factor appears to be an effect of Epo on CMRglc. Until now, there is only limited evidence that Epo increases the CMRglc in physiologic doses (Hirakata et al, 1992). However, higher dosed Epo increases regional CMRglc of uremic humans mainly in cortical regions (Metry et al, 1999). The fact that CMRglc was higher (56 μmol × 100 g−1 min−1) in the mice expressing Epo only in the brain (tg-21) than in the wt mice (46 mol × 100 g−1 min−1) argues for such an action of Epo on brain metabolism. Moreover, increases in brain metabolism of the two transgenic lines tg-6 (by 72%) and tg-21 (by 22%) correlate with elevated neuronal Epo protein levels (26- and 4-fold, respectively). It appears unlikely that the increases in CMRglc observed in the transgenic mice can be explained by an altered lumped constant in these animals. To result in an increase in CMRglc the lumped constant has to decrease. The only condition in which the lumped constant is significantly decreased is hyperglycemia. The maximal decrease in the lumped constant under such conditions is by 21% at a plasma concentration, which is elevated more than four-fold (Schuier et al, 1990). There is no indication that such increases in plasma (or precursor pool) concentration would occur in the transgenic mice. Assuming such an unlikely situation of a four-fold increase in glucose concentration in the precursor pool, such a change in the lumped constant could only explain an increase in CMRglc by 21%. Therefore, changes in the lumped constant can be excluded as a cause of the increased values of CMRglc measured in the present study in the transgenic mice.
The mechanisms by which Epo increases CMRglc are not known exactly. Known Epo effects in cortical and hippocampal neurons and astrocytes include various downstream signals (via mitogen-activated protein kinases, phospoinositol 3 kinase, SH2 containing protein-tyrosine phosphatases, signal transducer activator of transcription 5, transcription factor inhibitor IκB, Bcl-x(L), protein kinase B, protein kinase C, and cysteine proteases (Ruscher et al, 2002; Zaman et al, 1999)) after access of the Epo membrane receptor and phosphorylation of the Janus tyrosine kinase 2 (for a review see Chong et al, 2002a). Since induction of these pathways itself is energy consuming (phosphorylations) and result in protein and gene expression, an Epo induced increase of CMRglc might be appropriate. Furthermore, indirect Epo effects on cerebral mitochondria function were reported in cerebral microvascular endothelial cells as well as neurons and astrocytes. Epo influences mitochondrial permeability transition pore function and mitochondrial cytochrome c release (Chong et al, 2002b), proliferation and migration as well as vascular resistance regulating endothelial cell function. Other effects of Epo include a hematocrit-independent, vasoconstriction-dependent hypertension, increased endothelin production, upregulation of tissue renin, change in vascular tissue prostaglandins production, stimulation of angiogenesis, and stimulation of endothelial and vascular smooth muscle cell proliferation (Fisher, 2003). The contribution of the cerebral vasculature to the increase in CMRglc might not be substantial, but could participate at extreme blood viscosities and sheer stress.
In conclusion, an extremely high hematocrit in transgenic mice overexpressing Epo induces a decrease in CBF and an increase in CMRglc. Reasons might be both the direct Epo effect on brain cells and viscosity-induced increases in CMRglc.
Footnotes
Acknowledgements
We thank Mathilde Lorenz and Maria Harlacher for their laboratory support.