
Abstract
Magnetic resonance imaging (MRI) of the brain could be a powerful tool for discovering early biomarkers in clinically presymptomatic carriers of the Huntington's disease gene mutation (preHD). The aim of this study was to investigate the sensitivity of resting-state perfusion MRI in preHD and to identify neural changes, which could serve as biomarkers for future clinical trials. Differences in regional cerebral blood flow (rCBF) in 18 preHD and 18 controls were assessed with a novel MRI method based on perfusion images obtained with continuous arterial spin labeling. High-resolution structural data were collected to test for changes of brain volume. Compared with controls, preHD individuals showed decreased rCBF in medial and lateral prefrontal regions and increased rCBF in the precuneus. PreHD near to symptom onset additionally showed decreased rCBF in the putamen and increased rCBF in the hippocampus. Network analyses revealed an abnormal lateral prefrontal pattern in preHD far and near to motor onset. These data suggest early changes of frontostriatal baseline perfusion in preHD independent of substantial reductions of gray matter volume. This study also shows the feasibility of detecting neural changes in preHD with a robust MRI technique that would be suitable for longitudinal multisite application.
Keywords
Introduction
Huntington's disease (HD) is an autosomal dominant inherited neurodegenerative disorder caused by CAG repeat expansion mutation in the HTT gene on chromosome 4 (Vonsattel et al, 1985). Clinically, the disorder is characterized by progressive motor dysfunction, psychiatric disturbances, and cognitive deficits. Much effort at present focuses on identifying therapeutic targets and developing treatments that may delay onset of the disease, or slow down or stop the progression of HD once it manifests. Similarly important is the development of objective measures that allow reliable assessment of the effects on disease progression, or the prevention of the emergence of signs of HD in the preclinical phase (preHD) of such novel treatments. Imaging the brain may be a powerful tool in this regard. Neuroimaging studies of brain structure, metabolism, and perfusion have revealed differences between preclinical mutant HTT gene carriers and controls (Aylward, 2007; Feigin et al, 2007; Harris et al, 1999; Tabrizi et al, 2009). In addition, measuring brain activity changes with functional magnetic resonance imaging (fMRI) may also reveal early and sensitive markers of HD pathology. So far, brain activation in preHD has been assessed using different cognitive stimulation paradigms (Kloppel et al, 2009b). Importantly, brain activation differences in preHD have been demonstrated in the absence of structural changes (Zimbelman et al, 2007), suggesting that MRI-derived markers of brain activation might be more sensitive indicators of neural dysfunction in preHD than volumetric measures alone. However, despite its power to detect early neural changes in preHD, the implementation of task-based fMRI in a multicentric setting is methodologically challenging (Stocker et al, 2005). Unlike resting-state measures of brain metabolism or brain structure, task-based techniques need to be interpreted within their experimental framework, since task complexity, cognitive capacity, and performance variability have as much to be considered as experimental test-retest effects associated with longitudinal study designs (Maitra, 2009).
Regional cerebral blood flow (rCBF) is tightly coupled to neural function and is relatively stable over time (Floyd et al, 2003). Previous studies using single photon emission computed tomography and positron emission tomography have demonstrated striatal and cortical changes of baseline rCBF (Harris et al, 1999) in manifest HD and preHD. In preHD, altered rCBF was associated with changes in memory and executive function, suggesting a relationship between perfusion abnormalities and cognition (Hasselbalch et al, 1992).
In this study, we investigated rCBF in preHD individuals and healthy controls using a novel MRI technique based on perfusion images obtained with continuous arterial spin labeling (CASL; Wang et al, 2005). Continuous arterial spin labeling uses magnetically labeled arterial blood water to endogenously trace and quantify regional changes in CBF as a surrogate marker reflecting underlying neural activity and metabolism (Wang et al, 2005). Continuous arterial spin labeling allows for safe and economical repeated measurements with high stability across sessions (Floyd et al, 2003), and with sufficient test-retest reliability for longitudinal investigations of CBF (Petersen et al, 2010). The CASL data can be analyzed using uni- and multivariate statistical techniques to explore disease-related network patterns (Eidelberg, 2009) in addition to regionally defined differences of neural activity.
We investigated a group of preHD individuals and matched controls to test the prediction that, in preHD, rCBF differs in frontostriatal regions and within an a-priori frontostriatal CBF network of interest. We also expected to detect locally distributed differences between preHD far and near to motor onset if some of these differences reflect an ongoing pathological process. In addition to CASL, high-resolution structural data were collected to account for potential effects of early brain atrophy, and we administered a neuropsychological test battery to relate rCBF to cognitive performance.
Materials and methods
Subjects
We studied 18 right-handed participants with a molecular genetic diagnosis of a CAG repeat expansion (≥39) in the Huntingtin gene (Table 1) and a diagnostic confidence score of ≤2 on the motor Unified Huntington's Disease Rating Scale (UHDRS, Huntington Study Group, 1996). All participants underwent a thorough neuropsychiatric examination by clinicians experienced in HD (GBL and MO); this included the complete UHDRS, the Beck Depression Inventory and the 21-item Hamilton Depression Rating Scale. PreHD participants with a history of another neurologic disorder, a history of head trauma, or learning disabilities were excluded from the study. In addition, all participants underwent a semistructured psychiatric interview to exclude axis-I and axis-II disorders according to DSM-IV-TR (interview conducted by RCW). Only one preHD participant was on medication (venlafaxine, mean daily dosage 150 mg). The ‘age-at-onset’ of motor symptoms, i.e., the age at which the predicted probability of motor symptoms exceeds 0.6, was estimated using a formula based on age and CAG repeat length (Langbehn et al, 2004). PreHD participants were then assigned to two subgroups: those farther (preHDfar) or closer (preHDnear), from onset than the median estimated time to motor symptom onset (= 18.7 years). The healthy control group consisted of 18 right-handed subjects matched for age, education, and handedness. Subjects with a neurologic or a psychiatric disorder according to DSM-IV-TR criteria, substance abuse or dependence were excluded. The project was approved by the local Institutional Review Board. Written informed consent was obtained from all participants after a complete description of the study.
Demographics and clinical scores for healthy controls (n = 18) and preHD individuals (n = 18)
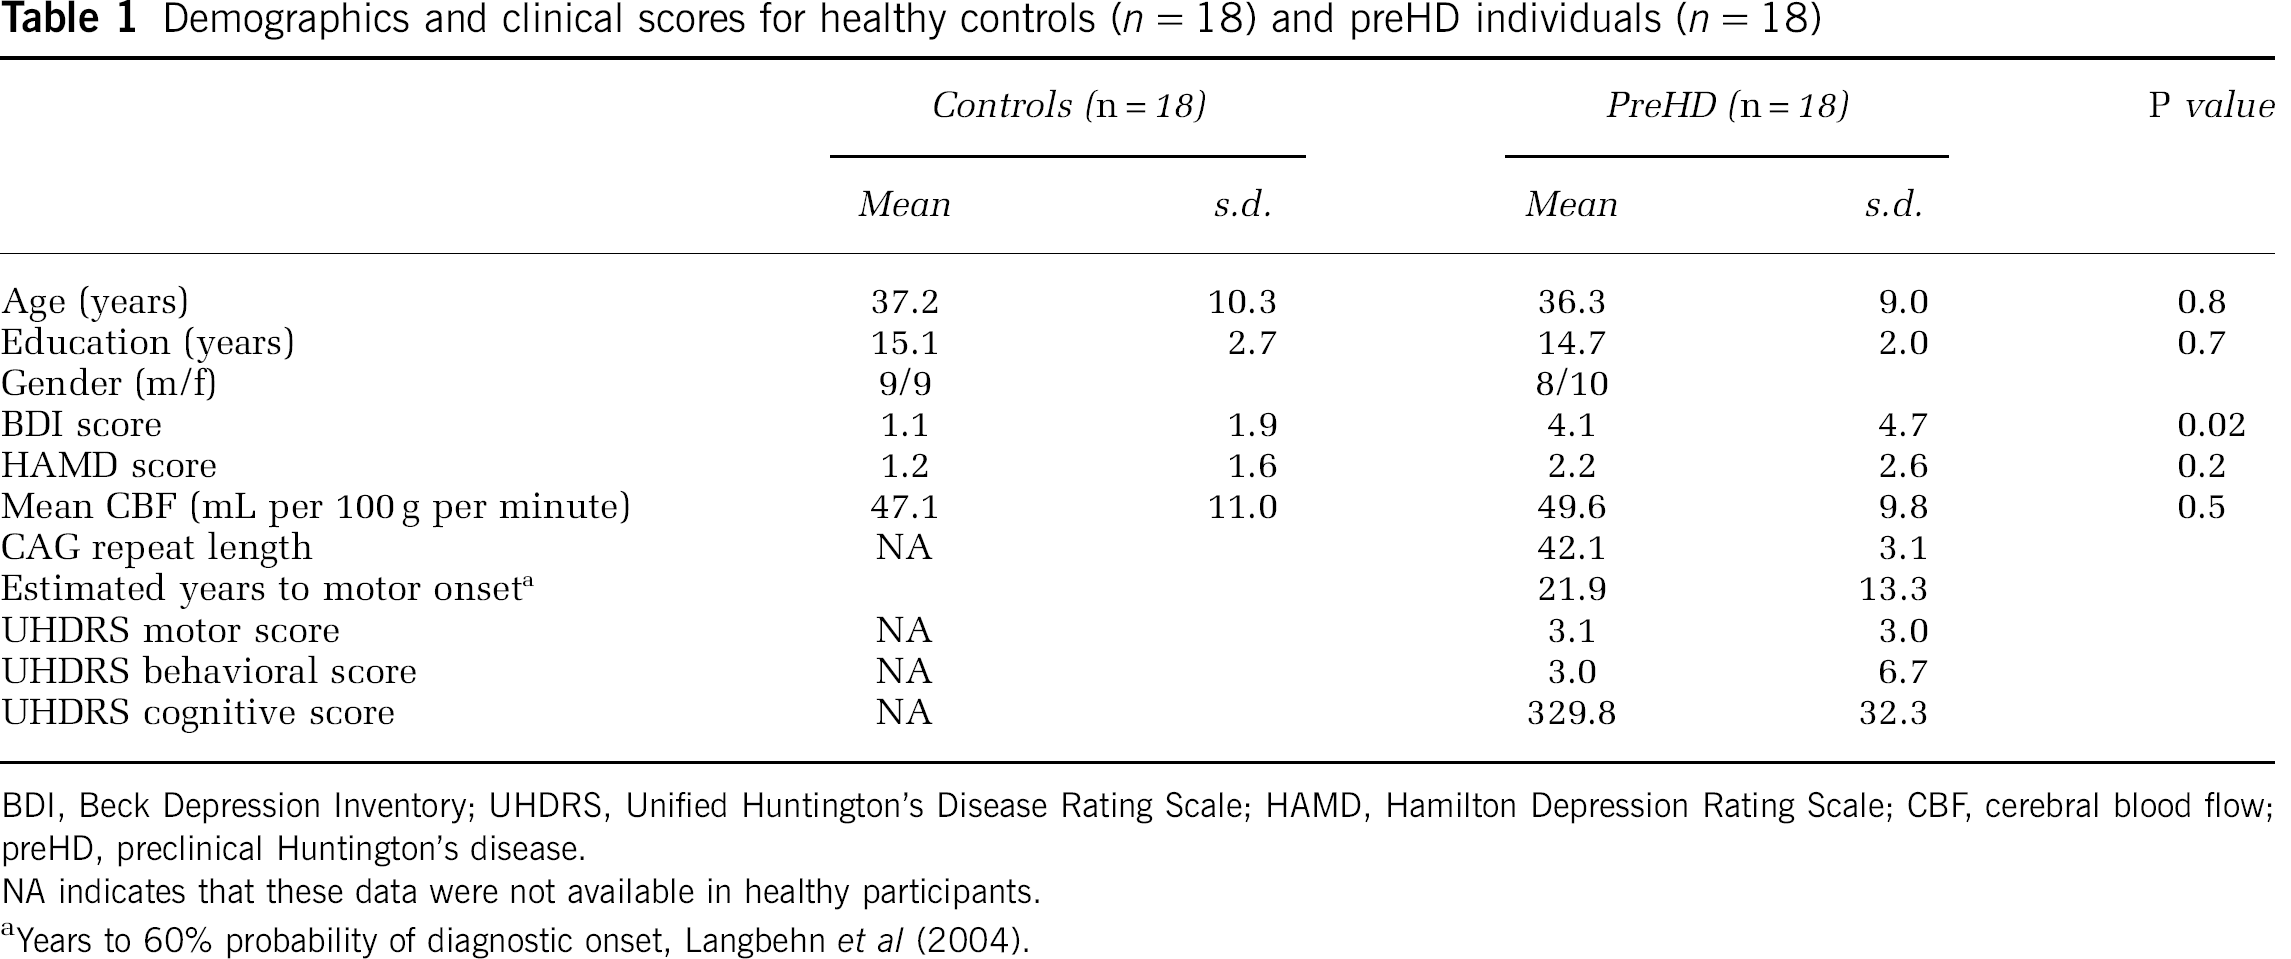
BDI, Beck Depression Inventory; UHDRS, Unified Huntington's Disease Rating Scale; HAMD, Hamilton Depression Rating Scale; CBF, cerebral blood flow; preHD, preclinical Huntington's disease.
NA indicates that these data were not available in healthy participants.
Years to 60% probability of diagnostic onset, Langbehn et al (2004).
Neuropsychological Assessment
A neuropsychological test battery assessed various domains of frontostriatal function. This battery consisted of seven tests that assessed alertness, divided attention (DA), verbal and spatial working memory, executive function and inhibition processes. Divided attention was measured using a computerized DA test from a standardised test battery (Zimmermann and Fimm, 1994). Verbal and spatial working memory tests included the digit and spatial span, where both domains were tested forward and backward (12 verbal or 9 spatial items, presented at 1Hz). Executive function was tested using a computerized version of the Wisconsin Card Sorting Test (WCST). This WCST variant consisted of 48 cards and a maximum of 5 category switches. Inhibition was tested by a computerized version of the Stroop Word-Color Interference Test based on randomized single trials (20 trials per color and condition).
Performance measures were recorded as follows: (1) DA: mean reaction times (in ms) of correctly identified targets as well as the absolute and number of omitted targets (DA-om); (2) verbal span: number of correctly recalled items in forward and backward direction; (3) spatial span: number of correctly recalled items in forward and backward direction; (4) WCST-P: number of perseverative errors (WCST-P), number of total errors (WCST-err) and adjusted switch costs after the procedure by Spitzer et al (2001) (WCST-sc, given in seconds); (5) Stroop test: mean reaction times of correctly identified targets (Stroop reaction times in ms) as well as the difference of errors in the incongruent and congruent Stroop conditions (Stroop-Err). Differences between controls and preHD individuals were assessed by calculating 11 separate t-tests (nominal level of α: P < 0.05). To avoid α-error accumulation, all t-tests were assessed with Bonferroni-adjusted level of α: corrected (P < 0.005).
Continuous Arterial Spin labeling Magnetic Resonance Imaging
Data acquisition: Continuous arterial spin labeling brain volumes were obtained with a 3-T Magnetom Allegra (Siemens, Erlangen, Germany) MRI system equipped with a head volume coil at the Department of Psychiatry and Psychotherapy III at the University of Ulm, Germany. The MRI scanning was performed in darkness, and participants were explicitly instructed to keep their eyes closed, relax, and not to think about anything special.
We opted to use MRI-based perfusion CASL because this method (1) appears better suited than blood oxygen level-dependent techniques for investigating slow changes in neural activity that could otherwise be biased by scanner drifts, (2) has a high stability over long time scales, and (3) generates data that are statistically independent over time under the null hypothesis, i.e., the data do not possess autocorrelation (Detre and Wang, 2002). Technical details on the CASL sequence used in this study were described in more detail elsewhere (Wang et al, 2005). In brief, the labeling plane was 8 cm beneath the center of the imaging sections. 20 radio frequency pulses of 100 ms duration and a gap of 7.5 ms were used for labeling. Mean duration of each control or labeling image acquisition was 2142.5 ms. To reduce transit-related effects a delay of 1 second between the end of the labeling pulses and image acquisition was introduced. Off-resonance artefacts were controlled by a sinusoidally amplitude-modulated version of the labeling pulse. T2*-weighted interleaved label and control images were acquired using a gradient echo echo-planar imaging sequence (matrix size: 64 × 64 pixels, repetition time = 4 seconds, echo time = 16 ms, bandwidth = 3.005 Hz/Px). In all volumes, 18 transversal slices were positioned along the anterior commissure-posterior commissure (AC-PC) line (slice thickness = 5 mm, 1.5 mm gap between slices). In-plane resolution was 3.44 × 3.44 mm. The perfusion block for all participants comprised 80 acquisitions of labeled and control images, with a duration of 320 seconds. Before the perfusion scan head positions were assessed with a localizer scan, followed by whole-brain shimming.
Data analysis: General Linear Model (GLM) analysis: Preprocessing and statistical analyses of perfusion data were performed using Statistical Parametric Mapping (SPM5, Wellcome Department of Cognitive Neurology, London, UK; http://www.fil.ion.ucl.ac.uk) in combination with software implemented in MATLAB 7.3 (MathWorks, Natick, MA, USA) for use as a toolbox under SPM5. The toolbox code is based on an MATLAB script by HY Rao and JJ Wang from the Center for Functional Imaging at the University of Pennsylvania (http://cfn.upenn.edu/perfusion/software.html) that implements a single compartment CASL perfusion model (Wang et al, 2005) for reconstructing images of raw perfusion and quantified rCBF in units of mL per 100 g tissue per minute. The individual images underwent realignment to the first image to correct for head movements, reslicing, and generation of perfusion-weighted images by pairwise subtraction of the label and control images, followed by conversion to quantified rCBF. This procedure also incorporated the calculation of a mean echo-planar imaging by averaging across all acquired echo-planar imaging images and the coregistration of the mean echo-planar imaging to individual T1 image. The rCBF images were normalized to the canonical MNI (Montreal Neurological Institute) space by applying the transformation matrices estimated from the normalization of the individual high-resolution T1-weighted MR images to a standard T1 template of 3 × 3 × 3mm3 voxel. The normalized rCBF images were then smoothed with a three-dimensional 10 mm full-width at half-maximum Gaussian kernel.
To prepare group comparisons of rCBF data individual mean rCBF images were computed for each subject within the framework of the GLM. To reduce spatially coherent noise (Wang et al, 2003), volume-averaged, proportionally scaled mean CBF values were used as a covariate in the individual (first level) GLM analyses, where session means were computed per participant. During this analysis, a proportional scaling of the average CBF of each volume was performed, such that the grand mean (average over all volume averages over time) equaled 50 mL per 100 g per minute. Local or voxelwise variations in CBF were not affected by this procedure. No temporal filtering was involved. Group comparisons between healthy controls, far and near preHD individuals were conducted at the second level using the individual mean rCBF images. An analysis of variance (ANOVA) model was computed, where age, gender, Beck Depression Inventory scores, and the individual mean rCBF values were included as nuisance variables. Inference of meaningful local group differences was based on a cluster extent (CE) of at least 70 contiguous voxel, each significant at P < 0.005 (uncorrected). All whole-brain analyses were inclusively masked by a statistical parametric map comprising voxels with positive rCBF values that were significantly (P < 0.05) different from zero when averaged across both groups of patients and controls.
CBF network analyses: CASL data were preprocessed using SPM5 (Wellcome Department of Cognitive Neurology) and MATLAB 7.3 as described in the previous section. After normalization, a spatial independent component analysis was performed using a group independent component analysis for fMRI toolbox (GIFT; http://icatb.sourceforge.net) (Correa et al, 2005). The dimensionality of the functional data for each subject was reduced using three consecutive steps of Principal Component Analysis alternated with data concatenation across subjects, resulting in one aggregate mixing matrix for all the subjects. An independent component analysis decomposition using the Infomax algorithm was used to extract 11 independent components (ICs), consisting of group spatial maps and related time courses. The minimum description length criteria were used to estimate the order selection, i.e., the number of ICs (Li et al, 2007) from the unsmoothed data sets after taking into account the spatial and temporal correlation of the fMRI data. A set of effectively independent and identically distributed data samples was first estimated for each subject through a subsampling algorithm, and the median of these values across the whole sample was used for order selection. The estimation of the number of the ICs performed directly on the data has been proven to effectively reduce the occurrence of over/under-fitting the data (Li et al, 2007). The group estimated ICs were then back reconstructed into individual ICs using the aggregate mixing matrix created during the dimensionality data reduction steps. Given the neurobiological relevance of frontostriatal function in HD and prior reports of thalamic abnormalities (Feigin et al, 2007) and altered 19 frontostriatal connectivity in preHD (Wolf et al, 2008a), we were primarily interested in a circuit involving lateral prefrontal areas, the striatum, and the thalamus. In order to identify this network of interest, the individual ICs consisting of individual spatial independent maps and time-courses were spatially sorted using the correlation with an a-priori mask comprising left and right lateral prefrontal regions (Brodmann Area [BA] 9, 10, 44, 45, 46), the bilateral striatum (caudate nucleus and putamen) and the bilateral thalamus. The spatial mask was computed using the WFU (Wake Forest University) PickAtlas, Version 2.3 (Maldjian et al, 2003).
One component of interest (COI) exhibiting a pattern of lateral prefrontal, striatal, and thalamic regions that showed the greatest spatial correlation (r = 0.17) with the frontostriatal sorting mask was chosen for the second level within- and between-group analyses. Before second level analyses, the individual COIs were smoothed with a 9-mm full-width at half-maximum Gaussian kernel. The voxel weights for each subject's spatial COI were used as random effects variables and analyzed on the second level using SPM5. For within-group analyses, voxelwise one-sample t-tests against the null hypothesis of zero magnitude were used to calculate within-group maps for each COI. The statistical threshold for these analyses was set at P < 0.001 uncorrected for height and P < 0.05 corrected for spatial extent. For between-group comparisons, an ANOVA model including age, gender, and Beck Depression Inventory scores as nuisance variables was computed to compare spatial maps between healthy controls, preHDfar, and preHDnear individuals. These analyses were masked by a combination of the main effects maps of both groups (P < 0.05). As for the GLM analyses, the statistical threshold for the between-group comparisons was set at P < 0.005 (uncorrected at the voxel level, cluster-level correction of 70 contiguous voxel).
Regions-of-interest analyses were conducted in addition to whole-brain data analysis. Here, we restricted our analyses to subcortical structures, where we included the bilateral caudate nucleus and the bilateral thalamus. The first region was chosen since caudate pathology is a well-known finding in HD, the latter region was chosen given reports of thalamic network abnormalities in preHD (Feigin et al, 2007). Regions-of-interest masks were computed using the WFU PickAtlas. The mean rCBF cluster values were extracted using MarsBar (Brett et al, 2002) and subsequently analyzed using the Statistica software package (Version 6.0, StatSoft Inc., Tulsa, OK, USA).
Correlations with clinical scores and behavioral parameters: Exploratory correlation analyses (P < 0.05) were calculated between CAG repeat length, estimated years to symptom onset, UHDRS scores, neuropsychological variables and rCBF changes in preHD individuals. Correlations were computed using the appropriate clinical and behavioral variables and the extracted rCBF values from the GLM analysis as well as the β parameters from the independent component analysis (corresponding to the voxel weights of the COI) from the maxima emerging from the between-group comparisons (see below). All correlations were conducted using the Statistica software package (Version 6.0, StatSoft Inc.).
Structural Magnetic Resonance Imaging
Data acquisition: As for the CASL data, high-resolution structural data were acquired using a 3-T Magnetom Allegra (Siemens) head MRI system. The MRI parameters of the three-dimensional magnetization-prepared rapid gradient-echo (3D-MPRAGE) sequences were as follows: echo time = 3.93ms; repetition time = 2080ms; inversion time = 1100 ms; field of view = 256 mm; slice plane = axial; slice thickness = 1 mm; resolution = 1.0 × 1.0 × 1.0 mm3; number of slices = 256.
Data analysis: Voxel-based morphometry (VBM; Ashburner and Friston, 2000) analyses were performed with SPM5 and MATLAB 7.3 (MathWorks). We used an extension of SPM5, the VBM tools written by C Gaser (http://dbm.neuro.uni-jena.de/vbm). In brief, each participant's original image was spatially normalized and segmented into gray and white matter. The images were resliced with 1.0 × 1.0 × 1.0mm3 voxel and then used for the group comparison of voxelwise gray matter volume (GMV) differences (Ashburner and Friston, 2000). The resulting GM images were smoothed with a Gaussian kernel of 8 mm full-width at half-maximum, on which all between-group analyses were performed. To identify the brain regions of GMV changes in preHD participants relative to the healthy controls, a group ANOVA was performed where age, gender, and GMV were included as a nuisance covariate in all analyses. These analyses yielded statistical parametric maps, based on threshold of P < 0.001 (uncorrected at the voxel level, P < 0.05 cluster correction).
For all imaging data, all anatomical regions and denominations are reported according to the atlas of Talairach and Tournoux (1988). Coordinates are maxima in a given cluster according to the MNI template.
Results
Participants
All groups, preHDnear, preHDfar and controls, were similar in age and years of education (Table 2). There were more women in the preHDnear group (χ2, P < 0.01), CAG repeat length was higher and the estimated years to motor onset lower (P < 0.05, see also Table 2). Beck Depression Inventory scores were higher in preHD participants than in controls (P < 0.02), whereas Hamilton Depression Rating Scale scores did not significantly differ between the groups (see also Table 2).
Demographics and clinical scores for far (n = 9) and near (n = 9) preHD individuals
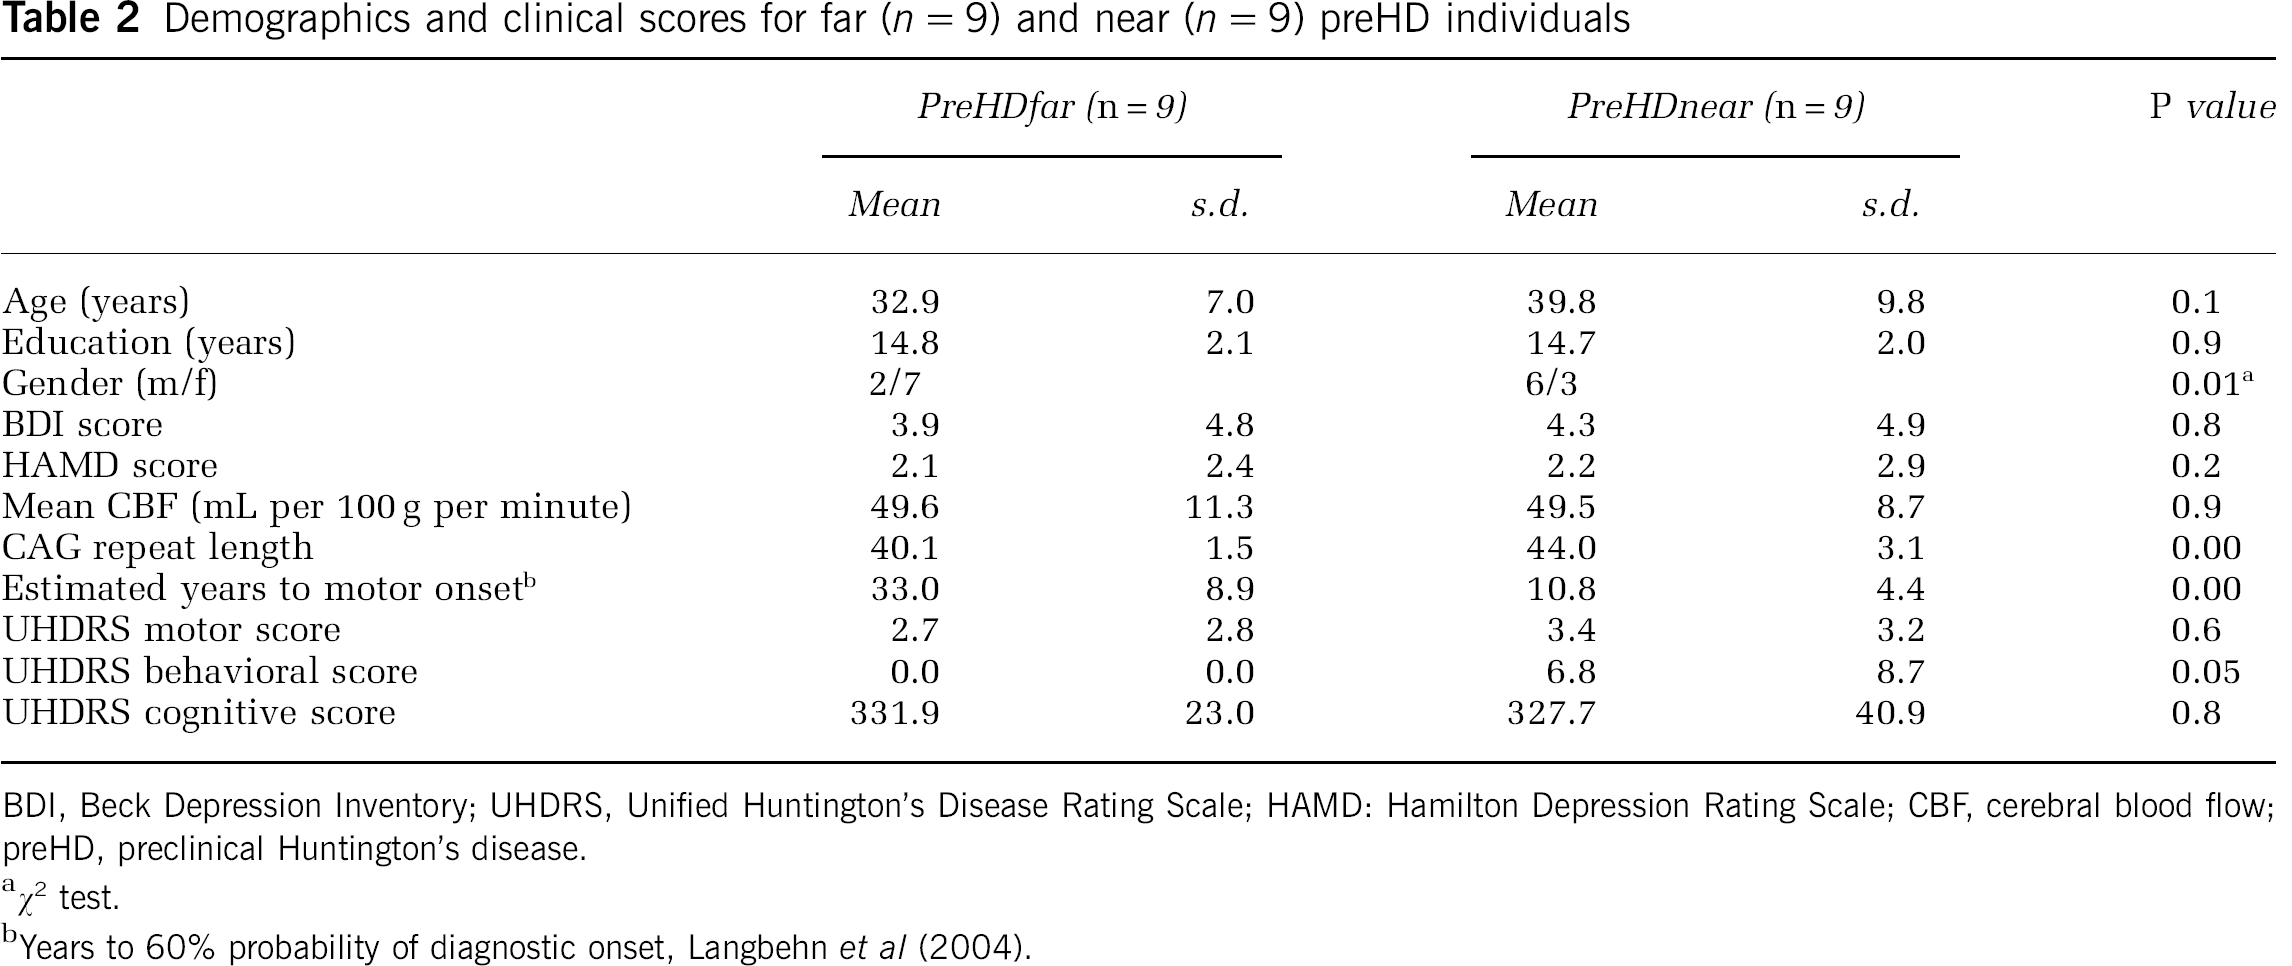
BDI, Beck Depression Inventory; UHDRS, Unified Huntington's Disease Rating Scale; HAMD: Hamilton Depression Rating Scale; CBF, cerebral blood flow; preHD, preclinical Huntington's disease.
χ2 test.
Years to 60% probability of diagnostic onset, Langbehn et al (2004).
Neuropsychological Assessment
Compared with healthy controls, preHD participants showed higher switch costs during WCST performance (P < 0.02; Table 3). However, this difference did not survive the Bonferroni correction for multiple comparisons. No group differences were found for variables measuring DA, verbal and spatial working memory, the total numbers of errors and perseverative responses obtained from the WCST and behavioral inhibition (see Table 3 for detailed results of the statistical analysis). When contrasted separately, switch costs during the WCST were higher for preHDnear participants compared with controls (P < 0.04); however, this difference again did not survive correction for multiple comparisons. On all other assessments, controls, preHDnear, and preHDfar were similar.
Results of the neuropsychological assessment (two sample t-tests)
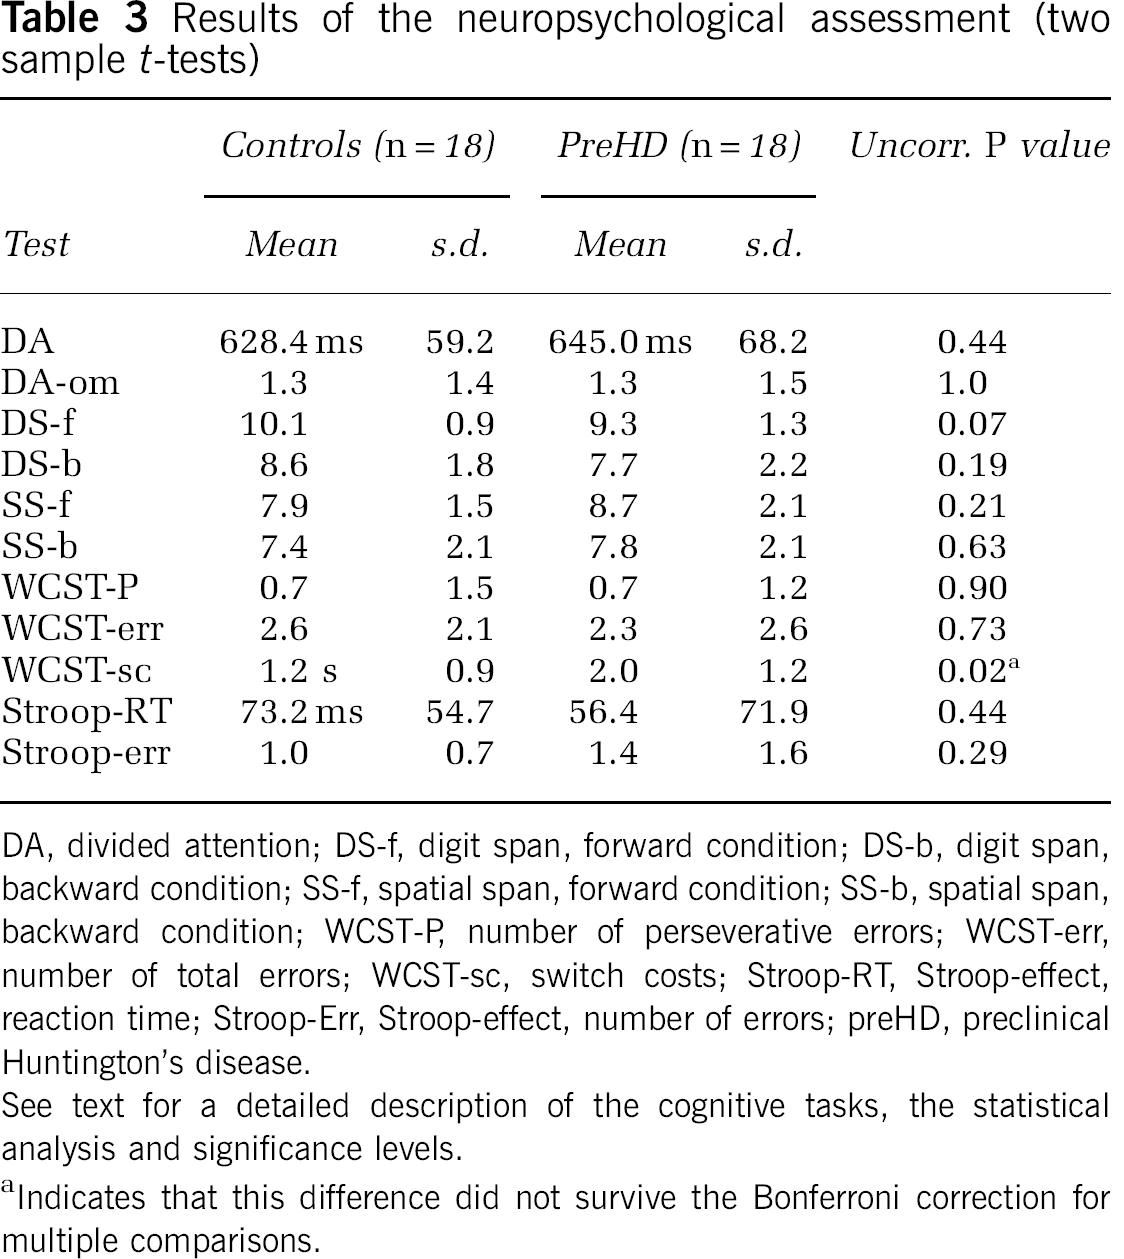
DA, divided attention; DS-f, digit span, forward condition; DS-b, digit span, backward condition; SS-f, spatial span, forward condition; SS-b, spatial span, backward condition; WCST-P, number of perseverative errors; WCST-err, number of total errors; WCST-sc, switch costs; Stroop-RT, Stroop-effect, reaction time; Stroop-Err, Stroop-effect, number of errors; preHD, preclinical Huntington's disease.
See text for a detailed description of the cognitive tasks, the statistical analysis and significance levels.
Indicates that this difference did not survive the Bonferroni correction for multiple comparisons.
Continuous Arterial Spin Labeling Between-Group Analyses
Overall, mean CBF was similar across groups (Table 1). Compared with healthy controls, preHD individuals had significantly less rCBF in the left medial prefrontal cortex (medial frontal gyrus, BA 10, x = −6, y = 60, z = 16, Z = 3.76 and BA 9, x = −10, y = 45, z = 24, Z = 3.64, CE = 426 voxel), the left dorsolateral prefrontal cortex (DLPFC, middle frontal gyrus, BA 9/46, x = −32, y = 46, z = 26, Z = 3.32, CE = 129 voxel) and the left superior frontal gyrus (BA 6, x = −16, y = −8, z = 60, Z = 2.97, CE = 75 voxel); see also Figure 1A. In addition, preHD individuals had more rCBF in the precuneus bilaterally (BA 31, x = −14, y = −58, z = 22, Z = 3.53 and x = 14, y = −60, z = 20, Z = 3.15, CE = 345 voxel) and the right hippocampus (x = 28, y = −22, z = −16, Z = 3.37, CE = 124 voxel); see also Figure 1A.
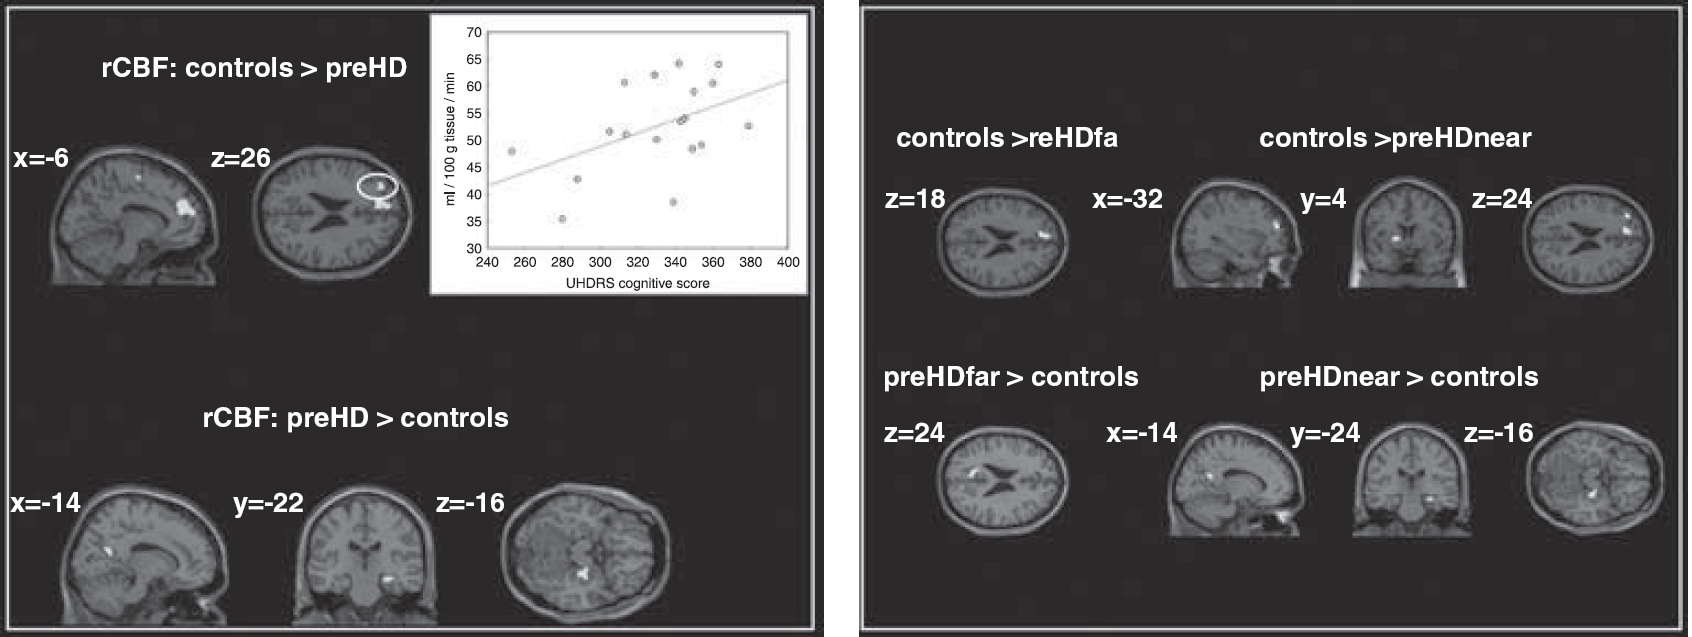
Regions showing changes of rCBF in preHD individuals compared to healthy subjects. Results of the 2nd level ANOVA, P < 0.005 (uncorrected at the voxel level, cluster-level correction of 70 contiguous voxel). The 2nd level maps are rendered on the anatomical templates implemented in SPM5. For the left DLPFC, a positive correlation (r = 0.47, P < 0.05) between rCBF and the UHDRS cognitive score (available in preHD participants only) is shown.
We next compared preHD subgroups with controls: preHDfar participants had less rCBF in the medial prefrontal cortex (medial frontal gyrus, BA 10, x = −6, y = 60, z = 18, Z = 3.46 and BA 9, x = −8, y = 50, z = 22, Z = 3.24, CE = 210 voxel) and significantly more rCBF in the left precuneus (BA 31, x = −12, y = −62, z = 24, Z = 3.64, CE = 230 voxel); see also Figure 1B. PreHDnear participants had less rCBF in the medial prefrontal cortex (medial frontal gyrus, BA 10, x = −4, y = 58, z = 16, Z = 3.47 and BA 9, x = −12, y = 44, z = 24, Z = 3.31, CE = 256 voxel), the left DLPFC (middle frontal gyrus, BA 9/46, x = −32, y = 48, z = 24, Z = 3.26, CE = 103 voxel) and the left putamen (x = −16, y = 4, z = 4, Z = 2.96, CE = 77 voxel), whereas more rCBF was found in the left precuneus (BA 31, x = −14, y = −58, z = 22, Z = 3.05, CE = 77 voxel) and the right hippocampus (x = 28, y = −24, z = −16, Z = 3.36, CE = 75 voxel); see also Figure 1B.
In regions-of-interest analyses, preHD subjects showed similar rCBF values compared with controls in the caudate bilaterally (left: P < 0.53, right: P < 0.35) and the thalamus bilaterally (left: P < 0.57, right: P < 0.42). Furthermore, preHD subgroups did not significantly differ among each other, nor did any of the subgroups differ from healthy controls.
Cerebral Blood Flow Network Analyses
We identified a frontostriatal network of interest that revealed a similar pattern of predominantly lateral and medial prefrontal, temporal, parietal, and subcortical regions in controls and preHD participants (Figure 2A). In particular, within-group analyses revealed a network comprising the bilateral ventrolateral prefrontal cortex, the DLPFC, the frontopolar cortex, the anterior cingulate cortex, superior frontal regions, the insula, the putamen, the thalamus, the bilateral superior, middle and inferior temporal cortex, and bilateral parietal areas.
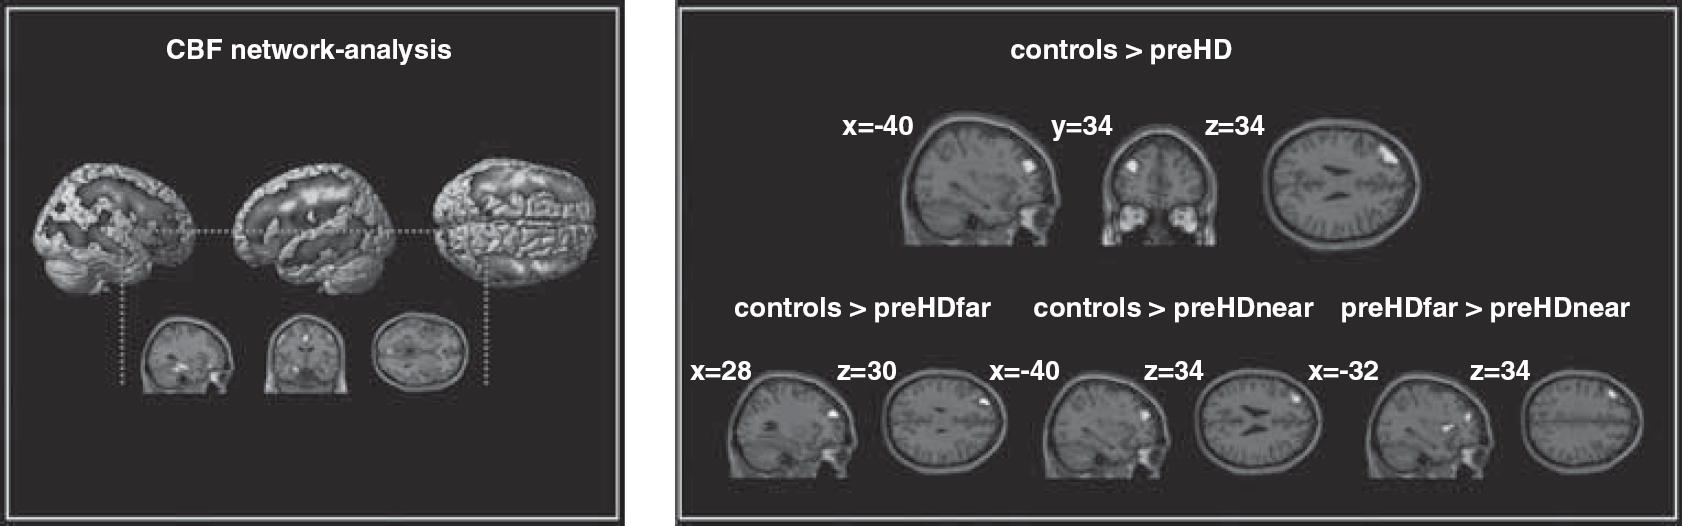
CBF network-analyses: left: ICA-derived component of interest in healthy controls and preHD subjects. Results of the 2nd level within-group t-test, P < 0.001 (uncorrected at the voxel level, P < 0.05 corrected for spatial extent). right: CBF-network between-group comparisons. Results of the 2nd level ANOVA, P < 0.005 (uncorrected at the voxel level, cluster-level correction of 70 contiguous voxel). The 2nd level maps are rendered on the anatomical templates implemented in SPM5.
Between-group analysis revealed that preHD participants showed a reduced pattern of spatiotemporal covariance in the left DLPFC (left middle frontal gyrus, BA 9/46, x = −40, y = 34, z = 34, Z = 4.03) and left superior frontal gyrus (BA 9, x = −32, y = 46, z = 28, Z = 3.92, CE = 405 voxel). In the left DLPFC, preHDfar and preHDnear differed similarly from controls (preHDfar: left superior frontal gyrus, BA 9, x = −28, y = 50, z = 30, Z = 3.12, CE = 114 voxel; preHDnear: left middle frontal gyrus, BA 9, x = −40, y = 34, z = 34, Z = 4.38, CE = 374 voxel); see Figure 2B. In addition, preHDnear individuals showed a reduced pattern of spatiotemporal covariance in left occipital cortical regions compared with controls (left middle occipital gyrus, BA 19, x = −46, y = −76, z = 8, Z = 3.38, CE = 75 voxel). PreHDfar individuals showed increased spatiotemporal covariance in left lateral prefrontal, left occipital and left insular regions when compared with preHDnear participants (left middle frontal gyrus, BA 9, x = −40, y = 34, z = 34, Z = 4.18, CE = 225 voxel; left middle occipital gyrus, BA 19, x = −44, y = −76, z = 4, Z = 3.86, CE = 83 voxel; left insula, x = −32, y = 12, z = 6, Z = 3.45, CE = 85 voxel); see Figure 2B. The inverse contrast did not yield significant findings.
Correlations with Clinical Scores and Behavioral Parameters
The lower the rCBF in the left DLPFC, the lower was the UHDRS cognitive score (r = 0.47, Figure 1A). Higher WCST switch costs were associated with a reduction of rCBF in the left DLPFC (r = −0.56) and the medial prefrontal cortex (r = −0.48). There was no association of any of the imaging parameters with CAG repeat length, estimated years to motor onset or other UHDRS scores.
Voxel-Based Morphometry Analyses of Structural Data
Compared with controls, preHD individuals showed less GMV in the medial frontal gyrus (BA 10, x = 1, y = 50, z = 8, Z = 4.11, CE = 477 voxel); see also Figure 3. This effect was more pronounced in the preHDnear group (medial frontal gyrus, BA 10, x = −1, y = 50, z = 6, Z = 3.58, CE = 163 voxel and x = 3, y = 43, z = −8, Z = 3.37, CE = 107 voxel). Volume measures in the preHDfar group were similar to controls. Total intracranial volume did not differ between healthy controls and preHD individuals (mean/s.d.: 1522.7/134.1ml and 1467.0/158.4 ml, P < 0.33). Total intracranial volume measures were not significant when comparing preHDfar with controls (P < 0.13), preHDnear with controls (P < 0.71) and both preHD groups against each other (P < 0.39).
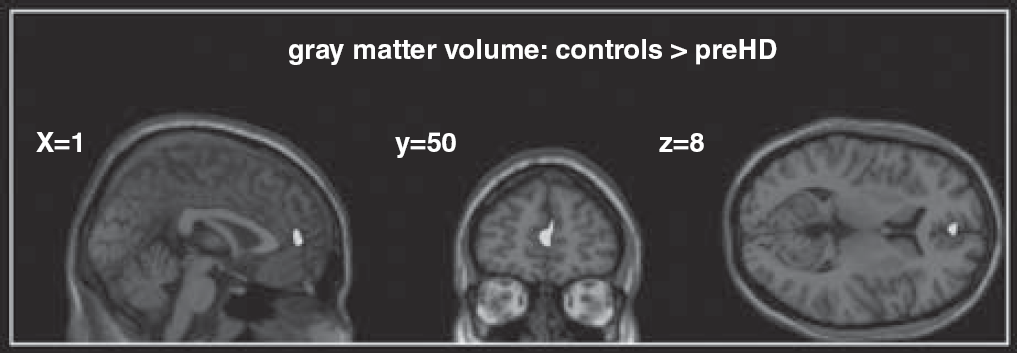
Medial frontal region with decreased gray matter volume (GMV) in preclinical Huntington's disease (preHD) individuals compared with healthy controls. Results of the second level analysis of variance, P < 0.001 (uncorrected at the voxel level, P < 0.05 corrected for spatial extent).
Discussion
This present study investigated changes of rCBF measured at rest in healthy controls and preHD near and far from motor onset. Using MR-based perfusion imaging three main findings emerged: (1) Compared with controls preHDfar and preHDnear participants had less rCBF than controls in the medial prefrontal cortex and increased rCBF in the left precuneus. PreHDnear participants, in addition, had reduced rCBF in medial and lateral regions of the prefrontal cortex and in the left putamen and increased rCBF in the right hippocampus. (2) Within a frontostriatal network, preHDfar and preHDnear participants showed a lower degree of spatiotemporal covariance in the left DLPFC; this pattern was more pronounced in preHDnear than preHDfar individuals. (3) PreHDnear, but not preHDfar participants had less GMV in the medial frontal cortex when compared with controls. However, structural changes revealed by VBM were not associated with lateral prefrontal, striatal, or hippocampal changes in brain perfusion at rest. Our data indicate that there are clear differences between preHD and controls in arterial blood flow without concomitant structural changes. Continuous arterial spin labeling may thus be a useful noninvasive tool for new neurobiological markers in HD.
Measuring CBF can help assess brain activity, a change of which is expected in the course of the neurodegenerative process of HD. In the present study, brain perfusion at rest was measured using MRI-based CASL. This technique requires considerably less time than task-based fMRI, does not use any radioactive substances and can be easily implemented at several sites (Petersen et al, 2010). Continuous arterial spin labeling quantifies regional changes in CBF as a surrogate marker for underlying neural activity and metabolism. Using this approach, we could show rCBF measures differed between controls and preHD subgroups in the striatum but also in the medial and lateral prefrontal cortex. The involvement of the frontal cortex is in good accordance with previous neuropathological, metabolic, structural and functional neuroimaging findings (Kloppel et al, 2009b; Paulsen, 2009). Interestingly, reduced rCBF in our preHDfar group involved regions of the frontal cortex only, whereas blood flow in striatal areas was normal. In contrast, in preHDnear rCBF was reduced in the putamen suggesting that striatal blood flow changes when mutant HTT gene carriers approach motor onset. A previous study by Harris et al (1999) reported that putaminal blood flow was reduced to a similar degree in preHD far and near from motor onset. However, that study included preHD individuals 6.1 ± 6.2 years from estimated motor onset, whereas our group was substantially farther from the motor onset (21.9 ± 13.3 years). The notion that striatal blood flow may only decline when approaching motor onset is further supported by structural imaging (Aylward, 2007), and by fMRI studies showing more pronounced loss of striatal connectivity with closer proximity to motor onset (Wolf et al, 2008b). Another region with a progressive loss of rCBF as HD gene mutation carriers approach motor onset was the left DLPFC. We identified abnormal CBF patterns in regions of the prefrontal cortex that were associated with proximity to motor onset. In the preHDnear group, rCBF in the left DLPFC was lower than in the preHDfar and control groups, both at the regional and at the network level. With the caveat of inferring from a cross-sectional study this suggests the possibility of a progressive loss of CBF in the prefrontal cortex as mutant HTT gene carriers approach motor onset. This finding is in line with left DLPFC hypoactivation in fMRI as a neural signature of regional dysfunction (Wolf et al, 2007) and decreased frontostriatal connectivity (Wolf et al, 2008b). Our present rCBF data extend on these observations suggesting DLPFC physiology is already abnormal at rest. Taken together, these data indicate that changes in the prefrontal cortex might represent an early and robust marker of neural dysfunction in preHD.
Importantly, regions with altered perfusion were not substantially linked to volume loss. Lateral prefrontal and putaminal blood flow in preHDnear was lower without evidence for DLPFC and striatal atrophy in our VBM data. In addition, preHDfar individuals had normal brain volumes in the presence of abnormal rCBF patterns in prefrontal regions. Previous rCBF studies in manifest HD and preHD could not clearly dissociate effects of brain atrophy from brain perfusion abnormalities (Harris et al, 1999), possibly due to issues with spatial resolution of the used techniques, and in conjunction with limited availability of structural data. While striatal volume loss has been frequently shown in preHD individuals near to motor onset (Aylward, 2007), recent studies have also reported normal striatal volumes in preHDfar cohorts (Hobbs et al, 2010). Our data suggest that rCBF measures could improve the sensitivity for detecting neurobiological changes during early presymptomatic stages.
Regional cerebral blood flow was not only reduced but also increased in preHD individuals compared with healthy controls. These increases were confined to the left precuneus in both preHD subgroups. PreHDnear participants, in addition, had increased rCBF in the right hippocampus. Structure and function of precuneus and hippocampus can be abnormal in preclinical and very early HD (Feigin et al, 2006; Voermans et al, 2004), and patterns of increased metabolism and brain activation in preHD have been demonstrated by previous neuroimaging studies (Feigin et al, 2006; Wolf et al, 2007; Zimbelman et al, 2007). Patterns of enhanced activation may reflect ‘compensatory’ neural processes, possibly paralleling striatal degeneration and a subsequent impairment of corticostriatal circuits (Paulsen et al, 2004; Saft et al, 2009). ‘Functional compensation’ in the presence of increased cognitive demand has also been discussed (Kloppel et al, 2009a; Wolf et al, 2007). However, given the absence of specific instructions in our study we cannot sufficiently relate the findings of elevated rCBF patterns to a specific cognitive or affective process. Alternatively, it is also possible that increased levels of metabolism and activation could mirror a generalized spreading of activity due to reduced regional specialization or differentiation (Rajah and D'Esposito, 2005).
Finally, we related rCBF to clinical measures, where prefrontal perfusion was associated with the UHDRS cognitive score. This suggests that the prefrontal cortex hypoperfusion we measured using CASL reflects the level of clinical function even though, in line with previous studies (Brandt et al, 2008), the overall cognitive performance was normal. Interestingly, in preHD participants we also observed an association between higher WCST switch costs and lower rCBF in the left DLPFC and the medial prefrontal cortex. Switch costs have been used as time-dependent markers of cognitive flexibility during card sorting tasks (Spitzer et al, 2001), which have been related to the functional integrity of frontostriatal circuits (Monchi et al, 2001). Our results are in accordance with reports highlighting the relationship of corticostriatal rCBF and executive performance in HD (Hasselbalch et al, 1992), and in line with computational models of frontostriatal function in neurodegenerative disorders (Amos, 2000).
The precise neurobiological mechanisms of resting-state brain perfusion changes in preHD cannot be resolved by the present study. The neural physiology might change reflecting different stages of neural dysfunction in different transitional periods of preHD. Brain volume loss could mirror both incipient and overt cell loss, whereas functional measures including rCBF may detect cell dysfunction even earlier (Paulsen, 2009). Indeed, multiple lines of evidence suggest that deficits in cortical neurophysiology and morphology can precede neuronal degeneration (Gutekunst et al, 1999). Metabolic changes and abnormal cellular process within cortical regions have been documented in preHD (Ciarmiello et al, 2006), and loss of synaptic proteins in cortical regions may contribute to abnormal metabolism and neurotransmission (DiProspero et al, 2004). Other explanations for abnormal CBF in preHD, such as a disturbance of nitric oxide and nitric oxide synthase systems, have been suggested (Deckel et al, 2002). However, the precise physiological underpinnings of cerebral perfusion changes in preHD clearly need further research.
Our results are potentially limited by the fact that physiological parameters influencing CBF, such as heart rate or oxygen saturation, could not be reliably measured for every participant for technical reasons. Also, there was no specific monitoring of CO2 since all participants included in this study neither showed clinical signs of lung dysfunction, nor reported a history of asthma or chronic obstructive pulmonary disease. Given this clinical data, however, we consider states of hypercapnia and associated increases in CBF as unlikely. If acute fear or distress had led to respiratory stress during the perfusion scan one would have expected that increases in breath rates had been most probably associated with states of hypocapnia, which in turn would have led to a decrease in overall CBF. However, mean CBF was similar across groups. Nevertheless, to regress out any unspecific changes in overall CBF, the individual grand mean CBF averages were included in the second level ANOVA. Moreover, the very distinct local pattern of regional CBF between-group differences does not support that group differences were merely a consequence of any unbalanced respiratory distress.
Taken together, our data suggest early, quantifiable resting-state CBF changes in preHD individuals at the regional and neural network level. These changes were most prominent in medial and lateral areas of the prefrontal cortex and were more pronounced with closer proximity to motor symptom onset. Left prefrontal perfusion was associated with UHDRS cognitive scores and executive processing, suggesting a link between prefrontal blood flow and cognitive performance. As shown by VBM analyses of structural data, the perfusion changes in preHD were not substantially affected by early changes of GMV. Continuous arterial spin labeling is a non-invasive and robust measure of resting-state rCBF with high signal-to-noise ratio and short acquisition times. Regional cerebral blood flow measures with CASL are stable over time and thus the within-subject variability is low. Continuous arterial spin labeling may thus lend itself as a read out in multisite studies including clinical trials. However, we acknowledge as a limitation of our study that we infer from cross-sectional data. Hence, we propose that CASL should be investigated more closely in longitudinal studies for its biomarker suitability in HD.
Footnotes
Acknowledgements
The authors thank all participants and their families for their time and interest in this study. The authors are grateful to Jürn Wolf and Johanna Fischer for their assistance with data collection.
The authors declare no conflict of interest.