
Abstract
Brain glutamine synthetase (GS) is an integral part of the glutamate—glutamine cycle and occurs in the glial compartment. In vivo Magnetic Resonance Spectroscopy (MRS) allows noninvasive measurements of the concentrations and synthesis rates of metabolites. 15N MRS is an alternative approach to 13C MRS. Incorporation of labeled 15N from ammonia in cerebral glutamine allows to measure several metabolic reactions related to nitrogen metabolism, including the glutamate—glutamine cycle. To measure 15N incorporation into the position 5N of glutamine and position 2N of glutamate and glutamine, we developed a novel 15N pulse sequence to simultaneously detect, for the first time, [5-15N]Gln and [2-15N]Gln + Glu in vivo in the rat brain. In addition, we also measured for the first time in the same experiment localized 1H spectra for a direct measurement of the net glutamine accumulation. Mathematical modeling of 1H and 15N MRS data allowed to reduce the number of assumptions and provided reliable determination of GS (0.30 ± 0.050 μmol/g per minute), apparent neurotransmission (0.26 ± 0.030 μmol/g per minute), glutamate dehydrogenase (0.029 ± 0.002 μmol/g per minute), and net glutamine accumulation (0.033 ± 0.001 μmol/g per minute). These results showed an increase of GS and net glutamine accumulation under hyperammonemia, supporting the concept of their implication in cerebral ammonia detoxification.
Introduction
In brain, glutamine synthetase (GS) activity is predominantly localized in the astrocytes (Martinez-Hernandez et al, 1977; Norenberg and Martinez-Hernandez, 1979). It is responsible for the synthesis of glutamine (Gln) from glutamate (Glu) cleared from the synaptic cleft, thus having a major role in neurotransmission. This glutamine is then shuttled to neurons where it can be deaminated, completing the so-called glutamate—glutamine cycle (Berl et al, 1968; Clarke et al, 1970; Gruetter, 2004; McKenna, 2007; Shank and Aprison, 1981; Zwingmann and Leibfritz, 2003). In addition, in conditions of hyperammonemia, GS is used for detoxification of brain ammonia (Cooper and Plum, 1987; Kanamori et al, 1993; Kanamori and Ross, 1993). In this process, glutamine is accumulated in the brain, while glutamate concentration remains constant. Thus, glutamine accumulation requires de-novo synthesis from glucose, with involvement of both glutamate dehydrogenase (GDH) and aspartate aminotransferase (Berl et al, 1962; Shen et al, 1998).
Because brain GS is an integral part of the glutamate—glutamine cycle (Berl et al, 1968; Clarke et al, 1970; Shank and Aprison, 1981) and is also functioning as a detoxification pathway for cerebral ammonia (Cooper and Plum, 1987; Kanamori and Ross, 1993; Kanamori et al, 1993), developments of new methods for the noninvasive measurement of the GS activity became important. Several in vitro studies were performed to measure the GS activity in rat brain homogenates (Butterworth et al, 1988) or in cultured rat and mouse brain astrocytes (Yudkoff et al, 1986). However, knowledge of in vivo GS activity is necessary because glial—neuronal interaction has a crucial role in the glutamate—glutamine cycle (Erecinska and Silver, 1990). 13N-labeled ammonia has been used to study the cerebral uptake and metabolism of ammonia in conscious rat (Cooper et al, 1979). However, the rate of GS was not determined, because the isotope enrichment of the precursor ammonia and the physical size of the compartment were not known (Cooper et al, 1979; Kanamori and Ross, 1993). A potential drawback of 13N is its short half-life (10 minutes) which limits its usefulness to experiments of < 1 hour (Cooper et al, 1979). In vivo Magnetic Resonance Spectroscopy (MRS) is a useful technique for the continuous and noninvasive measurement of the concentrations and synthesis rates of individual metabolites within precisely defined areas in the brain. In particular, in vivo noninvasive 13C MRS has been used to study metabolic fluxes, enzymes activities in the living brain of animals and humans (Duarte et al, 2011; Gruetter et al, 2001). 15N MRS is an alternative approach to 13C MRS in studying glutamate—glutamine metabolism and can in principle provide a more direct interpretation than 13C studies. The wide chemical shift dispersion of 15N provides resolution of important metabolites in glutamine—glutamate cycle. Sparse in vivo 15N studies and utilization of different protocols for infusion of 15N-enriched substrates lead to a diversity of results and limited their integration on mathematical models of compartmentalized brain intermediary metabolism.
From these previous studies (Kanamori et al, 1993, 1996; Kanamori and Ross, 1993; Shen et al, 1998), discrepancies have been noticed concerning the GS flux (Vsyn) and the net glutamine accumulation (also called de-novo glutamine synthesis rate; Shen et al, 1998). These divergences could be intrinsically bound to the employment of different experimental protocols and assumptions used to calculate the metabolic fluxes. Therefore, there is a need to acquire additional experimental data during the same experiment, to minimize the number of assumptions to be done on mathematical modeling.
A few past in vivo MRS studies under ammonia infusion used either in vivo 1H (Fitzpatrick et al, 1989) or unlocalized 15N spectroscopy (Kanamori et al, 1993, 1996; Kanamori and Ross, 1993; Shen et al, 1998) but never combined and used in vitro brain extracts (biochemical assays or high-resolution nuclear magnetic resonance (NMR)) for absolute quantification. These studies mainly focused on the incorporation of 15N of ammonia into [5-15N]Gln and measured the apparent GS flux (Kanamori et al, 1993, 1996; Kanamori and Ross, 1993; Shen et al, 1998).
The incorporation of 15N into [2-15N]Gln + Glu may provide further insight into the net flux through GDH (VGDH) (Kanamori and Ross, 1995). However, due to the large chemical shift dispersion between [5-15N]Gln and [2-15N]Gln + Glu, Vsyn and VGDH were never simultaneously determined. Kanamori and Ross (1995) measured [2-15N]Gln + Glu (but not [5-15N]Gln) during 15N-enriched ammonia infusion and estimated VGDH.
In this context, we used a new acquisition strategy combined with an appropriate mathematical model of compartmentalized cerebral glutamine metabolism and determined, in the same experiment, an important number of metabolic fluxes with minimal assumptions. For that purpose, we developed a new 15N pulse sequence to simultaneously detect, for the first time [5-15N]Gln and [2-15N]Gln + Glu in vivo. Together with in vivo localized 15N spectra, we additionally measured for the first time in the same experiment localized 1H spectra for a direct measurement of the net glutamine accumulation. From our knowledge, the combination of localized 15N MRS and 1H MRS in interleaved mode has not been reported previously under 15N ammonia infusion. Consequently, 1H MRS allowed to follow up the total Gln accumulation during ammonia infusion and thereby to directly measure the net glutamine accumulation without any assumptions. Mathematical modeling of 1H and 15N MRS data provided reliable estimations of Vsyn, the apparent neurotransmission rate Vnt, VGDH, and the net glutamine accumulation (Vsyn– Vnt) under 15N-labeled ammonia infusion in the rat brain. Moreover, we performed a direct in vivo absolute quantification of total Gln, [5-15N]Gln and [2-15N]Glu + Gln in the same experiment.
Materials and methods
Animal Preparation
In vivo 15N and 1H MRS experiments were performed on male Sprague-Dawley rats (six animals, 300 to 350 g), which were fasted overnight (12 hours) with free access to water before the experiment. Rats were anesthetized using isoflurane (Attane, Minrad, NY, USA), intubated and mechanically ventilated (2% isoflurane in O2 gas). Two femoral veins were cannulated for infusion of α-chloralose (Fisher Scientific, Pittsburgh, PA, USA) and 15N ammonium chloride (99% enriched, Cambridge Isotopes, And-over, MA, USA), and one cannulated artery allowed regular blood sampling for monitoring blood gases, pH and plasma ammonia and urea levels. After the surgery, anesthesia was switched to α-chloralose given as an 80 mg/kg bolus and continuous infusion at 26.7 mg/kg per hour. Afterwards, the head was fixed in a stereotaxic system (bite bar and a pair of ear bars) and the animal was placed in an in-house-built holder. After giving a bolus (0.25 mmol/320 g of body weight) >1 minute (Kanamori et al, 1993), 15N ammonium chloride was then continuously infused at 4.5 mmol/h per kilogram. Arterial blood was sampled every hour to monitor blood gases (PaO2, PaCO2) and pH using an AVL Compact 3 blood gas analyzer (Roche Diagnostics GmbH, Mannhein, Germany). Plasma ammonia and urea concentrations were measured using an Analox GM7 analyzer (Analox Instruments, London, UK) and a Reflotron Plus analyzer (Roche Diagnostics GmbH), respectively. Respiration rate and volume were adjusted to maintain pH and blood gases within normal physiological ranges (pH = 7.41 ± 0.04; PaCO2 = 40.0 ± 1.8 mmHg, O2 saturation >99.8%). In addition, sodium bicarbonate (7%, Sigma-Aldrich, Steinheim, Germany) diluted in Dulbecco's Phosphate Buffered Saline (dPBS, Sigma-Aldrich, 70% solution) was infused continuously at an adjustable rate to maintain arterial pH in the normal physiological range. The total amount of blood draw from each animal was <10% of the total blood volume of each rat. During the MRS experiments, respiration rate, heart rate, and blood pressure were monitored by a small-animal monitor system (SA Instruments, New York, NY, USA). Body temperature was measured with a rectal thermosensor and maintained at 38.0 ± 0.5°C by warm water circulation.
All animal experiments were conducted according to federal and local ethical guidelines and the protocols were approved by the local regulatory body of the Canton Vaud, Switzerland (Service de la consommation et des affaires vétérinaires, Affaires vétérinaires, Canton de Vaud, Suisse).
Magnetic Resonance Spectroscopy Measurements
All 1H and 15N MRS data were acquired interleaved on a Varian Direct Drive (Palo Alto, CA, USA) console interfaced to an actively shielded 9.4 T magnet (Magnex Scientific, Oxford, UK) with a 31-cm horizontal bore. The magnet was equipped with 12 cm inner-diameter actively shielded gradient sets giving a maximum gradient of 400 mT/m in 120 μs. A home-built 14 mm-diameter 1H quadrature surface coil combined with a single 5-loop 10 mm 15N coil was used as transceiver. The static field homogeneity was adjusted using first- and second-order shims using an echo-planar version of FASTMAP (Gruetter and Tkac, 2000). Localizer images were obtained in the coronal planes using a multislice fast spin echo protocol with echo time (TE)/repetition time (TR) = 60/5,000 ms, a slice thickness of 1 mm and an in-plane resolution of 94 μm.
1H spectra were obtained using the ultra-short TE (TE/TR= 2.8/4,000 ms, 4,096 complex data points, SW (spectral width) = 7 kHz, 160 averages) SPin ECho, full Intensity Acquired Localized technique (SPECIAL) (Mlynarik et al, 2006, 2008). The voxel of interest (VOI) for 1H MRS was placed in the center of the brain (5 × 7 × 7 mm3). The reproducibility of the voxel placement was based on anatomical landmarks using the localizer images. After first- and second-order shimming, the typical linewidth of water resonance at TE = 2.8 ms was 16 Hz. The water signal was suppressed by a series of seven 25 ms asymmetric variable power radio frequency (RF) pulses with optimized relaxation delays, i.e., VAPOR (Tkac et al, 1999). The water suppression pulses were interleaved with three modules of outer volume saturation (OVS) as described previously (Tkac et al, 1999). To compensate for the magnetic field drift, spectra were collected in blocks of 16 averages, which were stored separately in the memory and corrected for the relative shift in frequency and potential variations in phase before summation.
15N spectra were acquired using a new pulse sequence based on the previously published Single-shot Inversion Recovery based Non-Echo (SIRENE) sequence (Choi et al, 2000). Briefly, in the conventional SIRENE sequence adiabatic pulses (HS8 modulation) are applied to invert the Z magnetization in two x-slices adjacent to the VOI. Then, the magnetization in these two slices follows an inversion recovery trajectory and is minimized by adjusting the inversion time. Residual magnetization outside the VOI was further suppressed by using six OVS pulses applied with a nominal 90° flip angle. The thickness of the upper and lower saturated y-slices was different to adapt the geometry of the rat head. An adiabatic half passage (AHP) pulse was then applied for excitation. In addition, bilevel WALTZ-16 was applied on the 1H channel for Nuclear Overhauser Effect (NOE) and decoupling during acquisition. Due to the large chemical shift difference between [5-15N]Gln and [2-15N]Glu + Gln (~70 p.p.m.) in 15N spectra, when using the conventional sequence with the carrier frequency placed on the [5-15N]Gln, the second signal of interest ([2-15N]Glu + Gln) was only partially excited by the AHP RF pulse. Consequently, conventional SIRENE sequence was modified in our study for 15N nuclei by adding a second AHP RF pulse. The two 15N signals of interest were acquired separately in an interleaved mode using two adiabatic excitation pulses with opposite frequency modulations. Figure 1A shows the evolution of the Z magnetization after the first AHP RF pulse with the carrier frequency placed on the [5-15N]Gln. As can be seen, after the AHP RF pulse, [5-15N]Gln was fully excited (no longitudinal magnetization left), but the reduction of the Z magnetization of [2-15N]Glu + Gln was <10%. After 3 seconds, the second AHP RF pulse was applied with the carrier frequency on [2-15N]Glu + Gln (Figure 1B). Similarly, the second AHP RF pulse flipped the magnetization of [2-15N]Glu + Gln into the transverse plane, whereas the Z magnetization of [5-15N]Gln was only slightly reduced by this pulse. This interleaved excitation scheme allows to selectively excite the two resonances of interest in the same effective TR. In addition, in our new sequence the adiabatic pulses (HS8 modulation) used to invert the Z magnetization in two x-slices adjacent to the VOI were eliminated; and consequently, the localization was performed by using only the OVS modules. Radio frequency power for excitation, NOE, and decoupling was carefully calibrated using a small sphere (3 mm diameter) containing 99% 15N-enriched glycine (Gly, Cambridge Isotopes) placed at the center of the 15N linear coil as an external reference as described previously (Gruetter et al, 1994, 2003). These calibrations were used to establish minimal power necessary for decoupling. Unlocalized 15N spectra were acquired in the first hours of infusion (256 scans, TR = 6 seconds), followed by a localized spectrum (VOI = 5 × 7 × 7 mm3, 256 scans) used for quantification. The robustness of localization was verified from the absence of the Gly signal in the in vivo spectra.
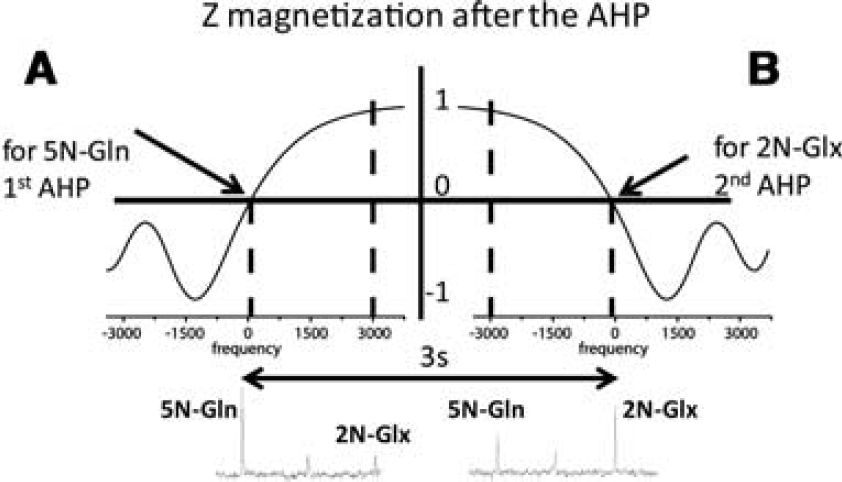
Description of the Z magnetization after the two AHP RF pulses with opposite frequency modulations used interleaved in the new sequence. (
15N-enriched compounds are characterized by a relative long T1 relaxation time (longitudinal relaxation time). To optimize the TR in the 15N experiments, the in vitro T1 relaxation time of [2-15N]Glu was measured using an adiabatic inversion recovery experiment. The inversion time was varied in the range from 0.1 to 20 seconds. To minimize effects of partial saturation, spectra acquired with different inversion time were collected with the same relaxation delay. The T1 relaxation curves were fitted with nonweighted two-parameter single exponential functions based on the Levenberg-Marquardt algorithm, fitting M(0) and T1. For each fit, the correlation coefficients reflecting the quality of the least squares fit versus the original data were computed. A typical standard error of the fitted T1 was ~5%. The in vitro T1 relaxation time of [2-15N]Glu was 4.0 ± 0.3 seconds.
Brain Extraction and In Vitro Nuclear Magnetic Resonance Spectroscopy
At the end of each MRS experiment, the animals were killed by focused microwave irradiation within 2 seconds (4 kW, Gerling Applied Engineering, Modesto, CA, USA), which inactivates brain enzymes before extraction (Morgenthaler et al, 2006). The dissected brain was immediately frozen in liquid nitrogen and then stored at −80°C until extraction. The frozen brain was powdered in liquid nitrogen with a mortar and pestle and the water-soluble metabolites were extracted with 0.9 mol/L perchloric acid, as previously described (Duarte et al, 2007). After vigorous mixing, the preparation was centrifuged at 21,000 g for 15 minutes at 4°C. The supernatant was then neutralized with potassium hydroxide (KOH), filtered (Ultrafree-CL filters; Millipore Corporation, Bedford, MA, USA) to remove high molecular weight molecules and dried in a concentrator (SpeedVac Concentrator DNA 120; Thermo Electron Corporation, Milford, MA, USA, PLACE). Afterwards, extracts were resuspended in 500 μL D2O (99.9% atom D, Sigma-Aldrich, Steinheim, Germany). The pD of the solution was adjusted to ~9 to resolve the [2-15N]Gln peak from the [2-15N]Glu peak in high-resolution 15N spectra. The brain extract measurements were performed on a 600-MHz vertical-bore DMX-600 spectrometer (Bruker, Fallanden, Switzerland). One-dimensional pulse-and-acquire 15N spectra were measured with NOE, under fully relaxed conditions (TR= 100 seconds) and with 1H decoupling to measure the [2-15N]Gln and [2-15N]Glu peaks and the corresponding fractional enrichment (FE) ratio (([2-15N]Gln)FE/([2-15N]Glu)FE).
Ammonia concentration in the brain extracts was measured with the Analox GM7 Analyzer as described above for plasma samples.
Spectra Quantification
1H spectra were quantified using LCModel (http://s-provencher.com/pages/lcmodel.shtml) combined with a quantum mechanics simulated basis-set of metabolites based on the density-matrix formalism (Mulkern and Bowers, 1994), using published values of J-coupling constants and chemical shifts (Govindaraju et al, 2000), and containing the spectrum of macromolecules measured in vivo as described previously (Mlynarik et al, 2008; Pfeuffer et al, 1999). Absolute quantification was based on the water signal as an internal reference. The Cramér-Rao lower bounds were used as reliability measure of the metabolite concentration estimates.
In vivo and in vitro 15N spectra were analyzed using the jMrui software (http://www.mrui.uab.es/mrui/). The signals were fitted using AMARES (Advanced Method for Accurate, Robust, and Efficient Spectral fitting) (Vanhamme et al, 1997). For each in vivo signal, two Lorentzian spectral components were selected to fit the major contributions of the metabolites ([5-15N]Gln and [2-15N]Gln + Glu), the zero-order phase was estimated and the first-order phase was fixed to zero. The precision of the amplitude estimates was assessed using the Cramér-Rao lower bounds. Absolute quantification was performed using an external reference method described previously for 13C data (Gruetter et al, 2003). Briefly, the amplitudes of the localized in vivo signals were compared with those obtained under identical experimental conditions from a phantom solution containing 15N uniformly labeled glutamine and glutamate. The effect of variable coil loading on sensitivity was assessed by measuring in vivo and in the phantom the signal of the sphere placed at the center of the 15N coil containing an aqueous solution of 15N-labeled Gly. Both measurements of coil loading effects on sensitivity were within 10% to 15% of each other. The NOE and T1 effects were corrected in vivo and in vitro by performing each time two different acquisitions: one performed with NOE using the parameters of the in vivo experiment and the second using fully relaxed conditions in absence of NOE (Gruetter et al, 1994, 2003).
Metabolic Modeling
The neuroglial two-compartment metabolic model used in the present study is shown in Figure 2. Ammonia (NH3+NH4+) passes the blood—brain barrier and enters glial cells at a rate Vin. In astrocytes, ammonia and glutamate are converted to glutamine through GS, thereby labeling the Gln at the position 5N (Figure 2A). Gln is released by the astrocytes and transported into the neurons where it is converted to glutamate by glutaminase, which completes the glutamate—glutamine cycle (Figure 2A). For the labeling of [2-15N]Glu + Gln (Figure 2B), ammonia is incorporated in glial glutamate through GDH, then glutamate is converted to glutamine by GS. Glutamine is transported into neurons and converted to glutamate by neuronal glutaminase. Since most ammonia is detoxified by the GS reaction (Du Ruisseau et al, 1957), which is restricted to astrocytes (Martinez-Hernandez et al, 1977; Norenberg and Martinez-Hernandez, 1979), and little by GDH (Cooper and Plum, 1987), in the present study we assumed that the astrocyte rather than the neuron is uniquely responsible for ammonia detoxification in the brain.
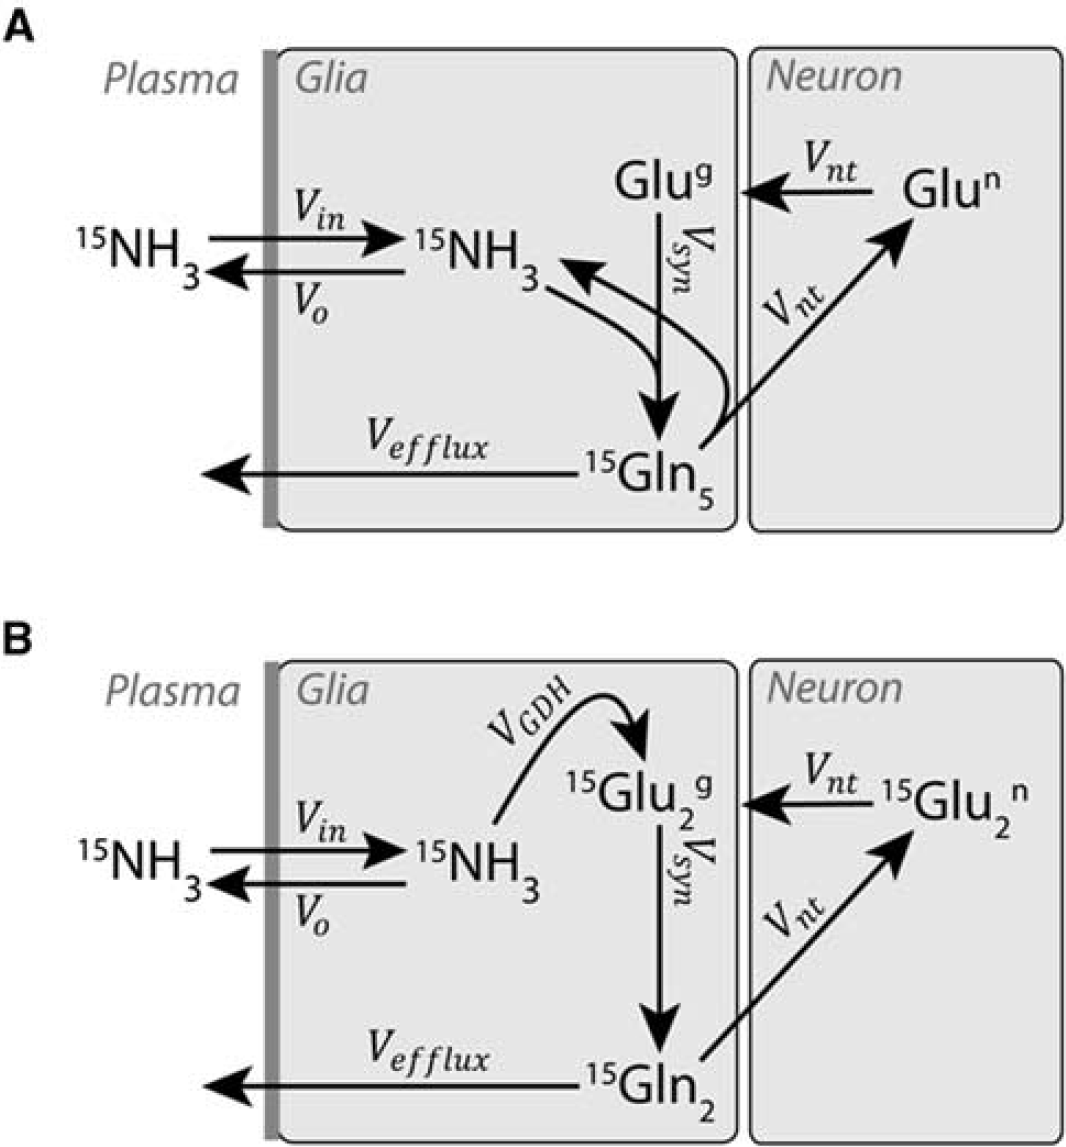
Neuroglial two-compartment metabolic model: (
In neurons, the exchange of 15N from glutamate in interaction with the tricarboxylic acid cycle happens through transamination reactions, while GDH is essentially taking place in the astrocytes (Aoki et al, 1987; Zaganas et al, 2001). We modeled the exchange of 15N from the position 2 of neuronal glutamate to the position 2 of aspartate through transamination, assuming a neuronal aspartate pool of 2 μmol/g, as measured by 1H NMR spectroscopy and in agreement with previous reports (Kunz et al, 2010; Xin et al, 2010). This interaction has the role of a transient dilution of the neuronal [2-15N]Glu pool. We further varied the exchange flux Vx between glutamate and the neuronal tricarboxylic acid cycle through transamination from 0 to 1 μmol/g per minute, which represents a typical range for this chemical exchange in the anesthetized rat brain (Duarte et al, 2011). Varying Vx in this range did not affect the labeling curves of [2-15N]Glx significantly and had very low impact on the other determined metabolic fluxes. The model was therefore simplified and the exchange with the neuronal tricarboxylic acid cycle was neglected. We failed to observe any other amino acids to become enriched. A substantial enrichment of aspartate that occurs at ~2 mmol/L (almost exclusively in neurons) would be observable in the 15N spectra.
The time courses of total Gln measured by 1H MRS, [5-15N]Gln, and [2-15N]Glu + Gln were used as experimental data to which the model was fitted as follows. The differential equations derived for [Gln], [5-15N]Gln, and [2-15N]Glu + Gln (see Appendix) were fitted simultaneously using SAAM II environment (The SAAM Institute, Seattle, WA, USA). Since no direct measurement of the dynamic labeling of brain ammonia was possible, Vin was assumed 0.23 μmol/g per minute (Cooper et al, 1979; Cooper and Plum, 1987; Shen et al, 1998). In addition, we assumed a negligible efflux from the Gln pool compared with Vsyn (Kanamori and Ross, 1993; Kanamori et al, 1996; Shen et al, 1998). For the fit of [2-15N]Glu + Gln, we assumed that VGDH was mainly in the glial compartment. This assumption was verified by measuring the FE ratio (([2-15N]Gln)FE/([2-15NGlu])FE) in high-resolution 15N brain extract spectra at a pH of ~9. The time evolution of the total Gln, [5-15N]Gln, and [2-15N]Glu + Gln was fitted simultaneously. The linear fit of the time evolution of the total Gln provided a measure of the net glutamine accumulation (Vsyn–Vnt) as well as the initial Gln concentration (Gln(0)). In addition, from the fit of the time evolution of [5-15N]Gln we obtained Vsyn and from these two fluxes (Vsyn–Vnt and Vsyn) the neurotransmission rate (Vnt) was calculated. Finally, using our model the fit of [2-15N]Glu + Gln enabled the measurement of VGDH (see Appendix, equations (18), (19) and (23)). Results were generally presented as mean ± s.d. (n = 6).
In addition, using the values obtained for the different fluxes, the FEs of [2-15N]Glu and [2-15N]Gln were simulated for the end of the experiment and their ratio was compared with the high-resolution NMR measurements obtained on brain extracts.
Results
During the in vivo experiments, the physiological variables were maintained within normal physiology (pH= 7.41 ± 0.04; PaC
In general, 1H spectra exhibited excellent signal-to-noise ratio allowing easy separation of Gln from Glu. The increase in the total Gln pool at different time points during infusion was thus apparent in the 1H spectra (Figure 3). The total Gln (0) concentration (before starting the infusion) was 2.3 ± 0.4 μmol/g, which increased to 17.7 ± 4.0 μmol/g at the end of the infusion. As can be seen in Figures 3B and 3C, the increase of total Gln started immediately after the infusion and continued to increase linearly over time. The total concentrations of all other metabolites remained within < 10% fluctuation in standard deviation of the mean concentration over the ammonium chloride infusion (i.e., the N-acetylaspartate concentration before the ammonium chloride infusion was 7.1 ± 0.5 μmol/g and at the end of infusion was 7.6 ± 0.5 μmol/g). Although lactate concentration was observed to correlate with the total Gln increase (R2 = 0.90), it never exceeded the physiological range of 2.5 to 3 μmol/g.
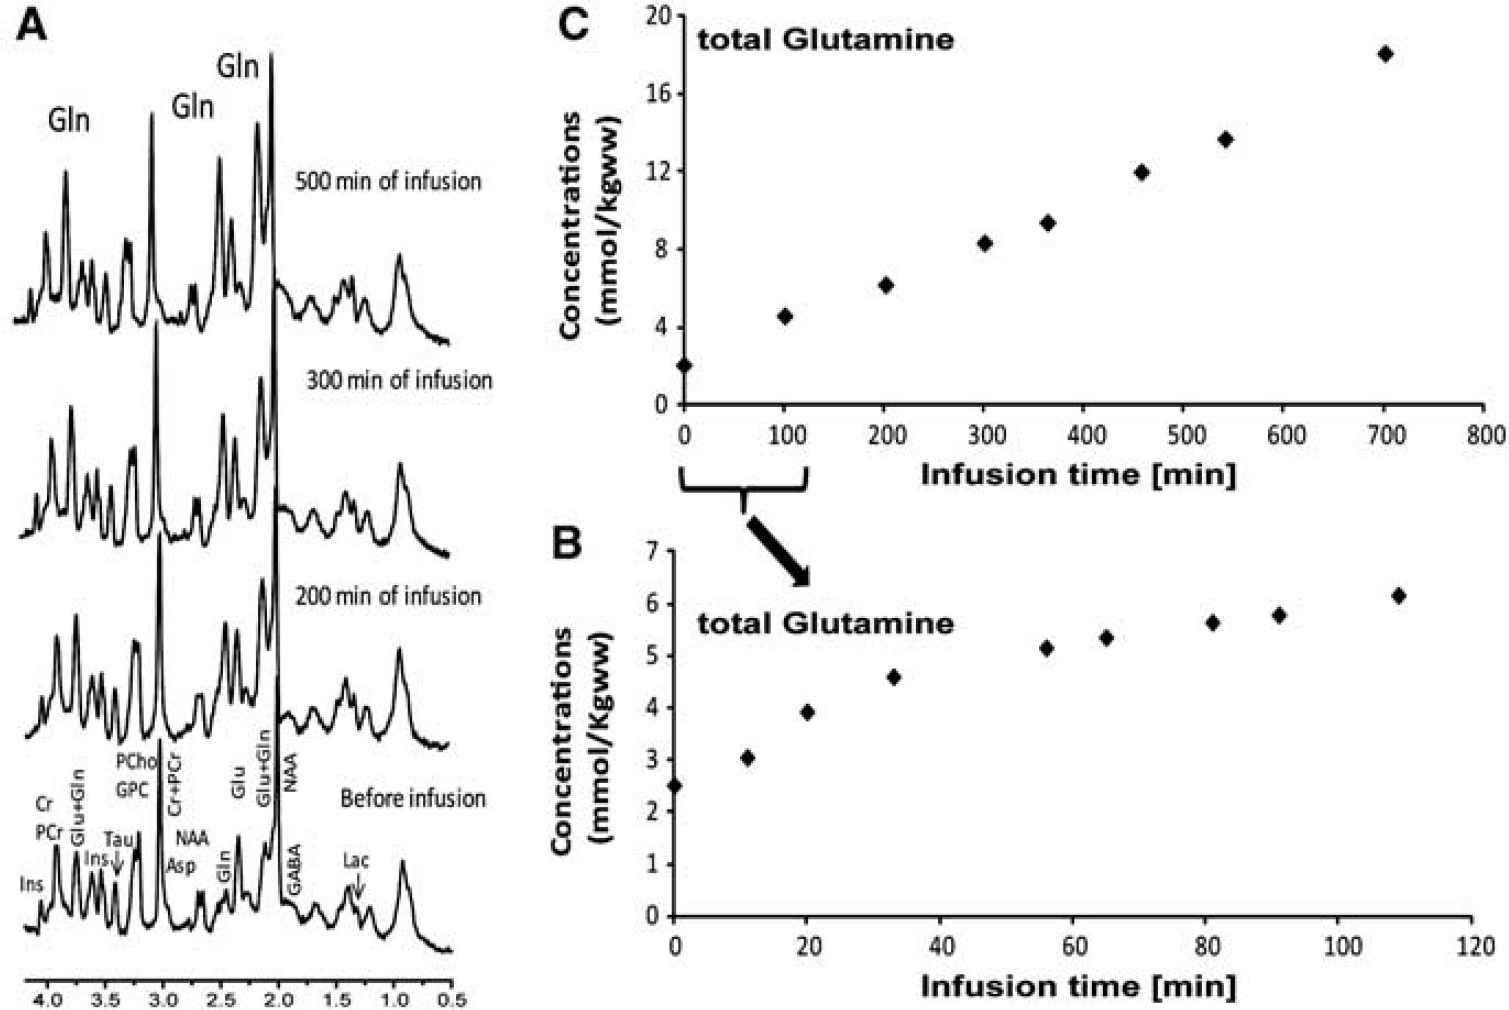
(
To compare the new acquisition sequence with the conventional SIRENE sequence, Figure 4A shows a series of in vivo unlocalized 15N spectra acquired in the rat brain during ammonium chloride infusion using the new pulse sequence. It can be observed that the [5-15N]Gln peak (–271 p.p.m.) was detected within 25 minutes, whereas the [2-15N]Gln + Glu peak (–342 p.p.m.) was detected during the second scan (i.e., after 25 minutes of ammonium chloride infusion). With the conventional pulse sequence (Figure 4B), the [5-15N]Gln peak was also visible in the first and all subsequent scans; however, the [2-15N]Gln + Glu peak started to appear only from the fourth scan. Compared with the conventional SIRENE sequence, the new pulse sequence using the two AHP RF pulses allowed the detection of [2-15N]Gln + Glu peak ~ 50 minutes earlier due to a better excitation and consequently an increased signal-to-noise ratio.
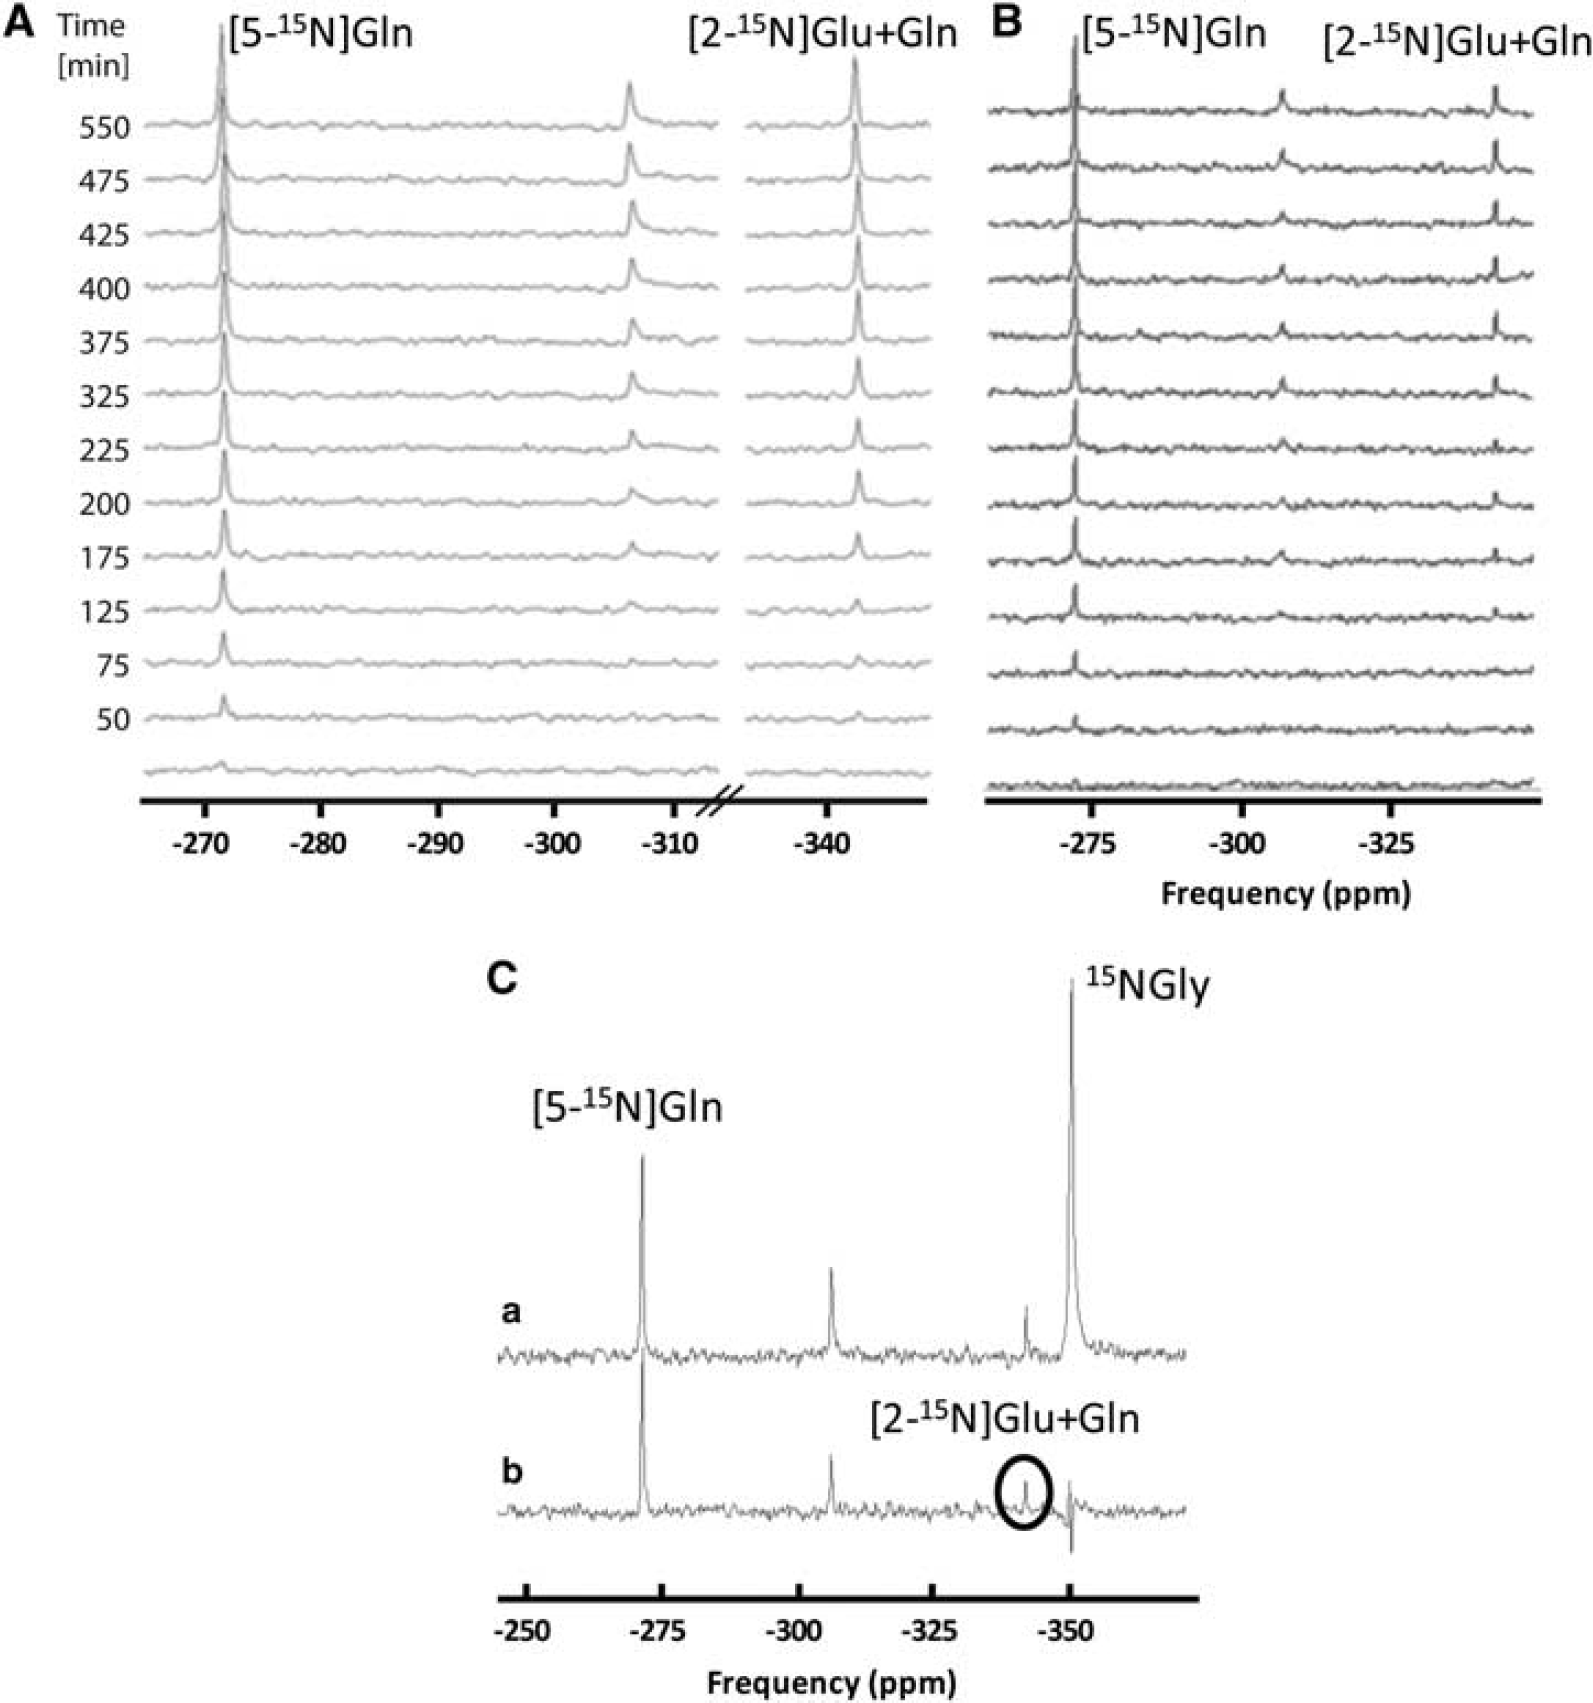
(
To assess the performance of the OVS localization technique, Figure 4C shows an example of a localized (a) in vivo 15N spectrum versus an unlocalized one (b) acquired at 25 minutes of interval in the same rat during ammonium chloride infusion. As can be seen from the Figure, the performance of the OVS-based localization is proved by the suppression of the 15N Gly signal, which originates from the sphere placed in the center of the 15N coil. In addition, by comparing the two resonances of [5-15N]Gln we can notice that there are very small differences, suggesting that almost the entire [5-15N]Gln signal comes from the brain and not from surrounding tissues.
Using the external reference method described previously for 13C data (Gruetter et al, 2003), we were able to perform a direct in-vivo absolute quantification for [5-15N]Gln and [2-15N]Gln + Glu. Consequently, at the end of infusion absolute concentrations of [5-15N]Gln and [2-15N]Gln + Glu were 13.3 ± 2.9 and 9.6 ± 3.5 μmol/g, respectively, in accordance with reported in vitro brain extracts determinations (biochemical assays or high-resolution NMR; Kanamori et al, 1993, 1996; Kanamori and Ross, 1993; Shen et al, 1998).
The time courses of total Gln, [5-15N]Gln, and [2-15N]Gln + Glu were highly reproducible in all six rats. The application of the model to the in vivo data showed an excellent fit (Figure 5). Using the model presented (Figure 2), we obtained from the 1H data a net Gln accumulation (Vsyn– Vnt) of 0.033 ± 0.001 μmol/g per minute (Figure 5A). By fitting in vivo [5-15N]Gln and [2-15N]Glu + Gln time courses (Figure 5B), Vsyn was 0.30 ± 0.050 μmol/g per minute, VGDH was 0.029 ± 0.002 μmol/g per minute, and the plasma NH3 FE was 91 ± 5%. Finally, the apparent neurotransmission rate, Vnt, was 0.26 ± 0.030 μmol/g per minute.
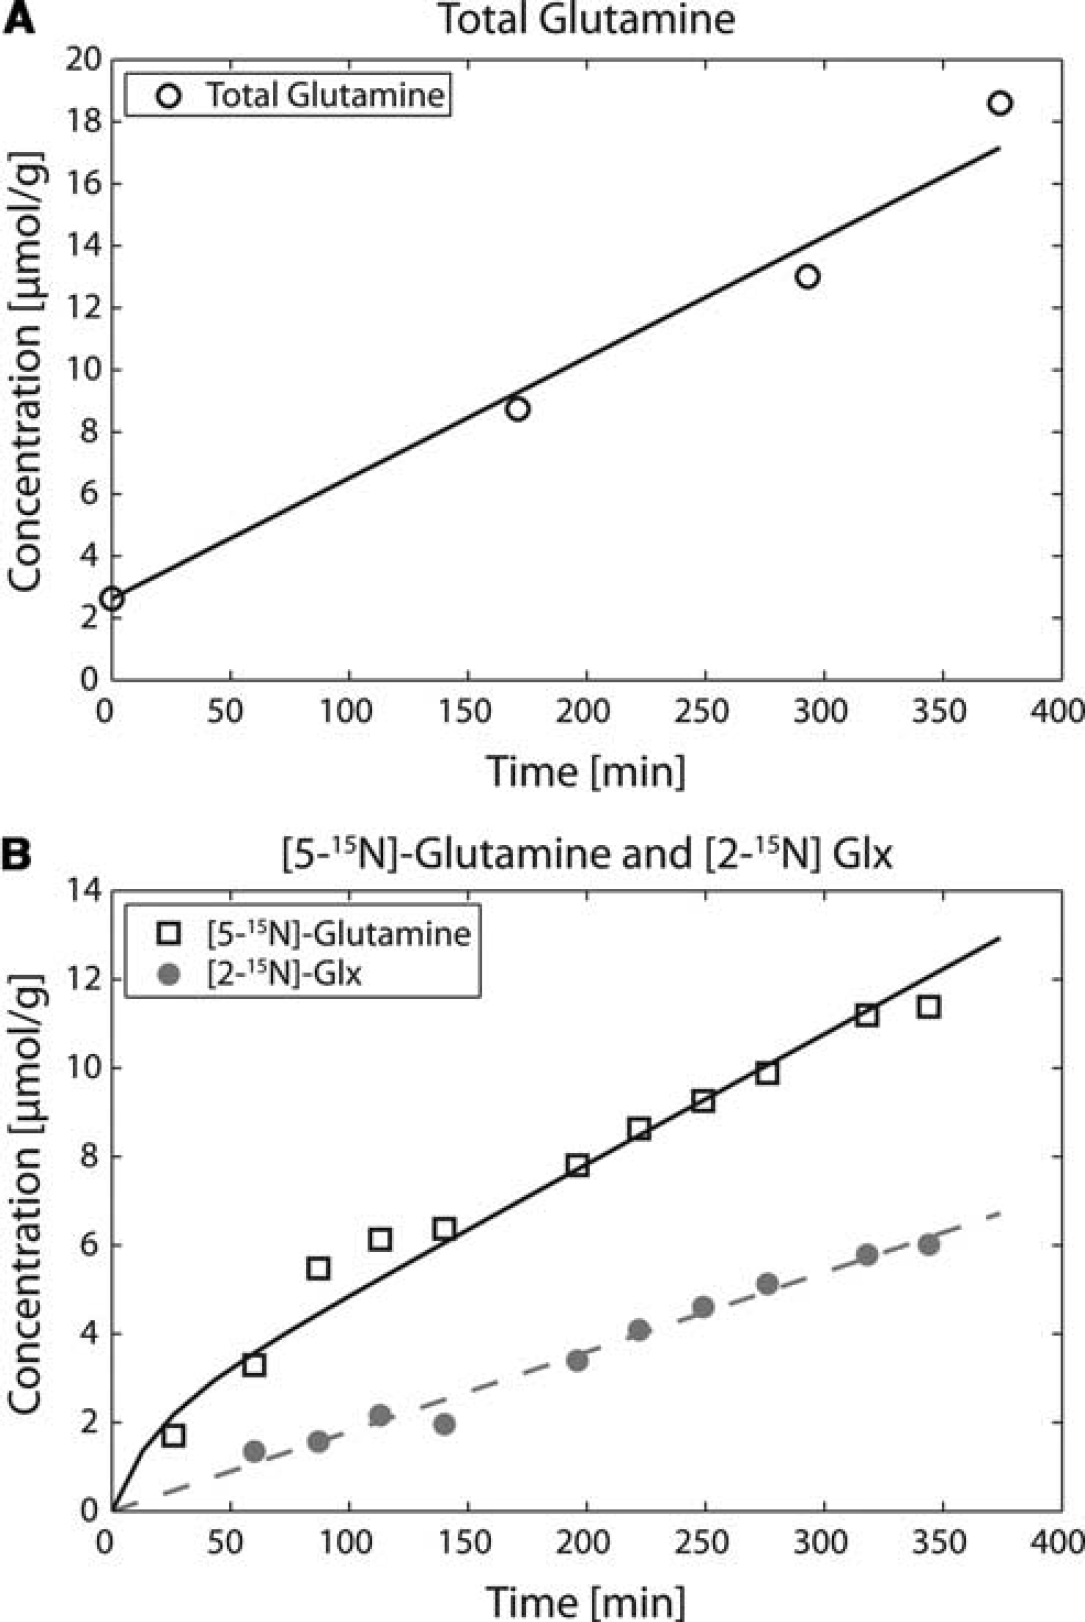
The time courses and corresponding fits of total Gln (
To determine the predominant cellular localization of GDH, we measured the ratio between the FEs of [2-15N]Gln and [2-15N]Glu in brain extracts. From high-resolution measurements on brain extracts, we calculated ([2-15N]Gln)FE/([2-15N]Glu)FE = 1.48 ± 0.04 which was in agreement with the simulations done for the FEs of [2-15N]Glu and [2-15N]Gln based on the values obtained for the different fluxes.
Discussion
In the present study, we directly and simultaneously measured for the first time Vsyn, Vnt, VGDH, and the net Gln accumulation under 15N-labeled ammonium chloride infusion in the rat brain. This was possible by using a new acquisition strategy: in vivo localized 15N MRS interleaved with in vivo 1H MRS. In this context, from the modeling point of view this new acquisition strategy required fewer assumptions to determine metabolic rates.
By acquiring in vivo 1H spectra, we followed the total Gln accumulation during ammonium chloride infusion. Unlike to previous studies, we directly measured for the first time the net Gln accumulation without any assumptions. Previous measurements of net Gln accumulation (i.e., de-novo glutamine synthesis; Shen et al, 1998) assumed that the increase of glutamine pool size during hyperammonemia is attributed to increased pyruvate carboxylase and GDH activities. Moreover, these studies assumed that pyruvate carboxylase is equal to GDH under hyperammonemia and that together these fluxes account for the net transport of ammonia.
In addition to the acquisition of in vivo 1H spectra, we now simultaneously measured, for the first time, in vivo [5-15N]Gln and [2-15N]Gln + Glu time courses during infusion of 15N-enriched ammonium chloride. The new 15N pulse sequence proposed in the present study, which uses the two AHP RF pulses, allowed the detection of [2-15N]Gln + Glu peak ~ 50 minutes earlier compared with the conventional SIRENE sequence, due to a better excitation and consequently an increased signal-to-noise ratio. Moreover, by acquiring localized 15N spectra and by using the external reference method, we performed a direct in vivo absolute quantification for [5-15N]Gln and [2-15N]Gln + Glu. Finally, we directly quantified total Gln, [5-15N]Gln, and [2-15N]Glu + Gln in the same experiment in vivo without the need of in vitro brain extracts.
The linear and continuous increase of total Gln during the period of ammonium chloride infusion observed in our in vivo 1H MRS data implies increased anaplerosis (Berl et al, 1962; Shen et al, 1998; Zwingmann, 2007), which appears to be coupled to the ammonia detoxification pathway. As can be seen in Figures 3B and 3C, the increase of total Gln started immediately after the infusion and was linear over the infusion time, in contrast to previous studies (Rothman et al, 1999; Shen et al, 1998), suggesting that no delay in Gln accumulation was observed. The total Gln concentration measured at the end of the infusion is comparable to previous studies based on in vitro brain extract determinations (Kanamori et al, 1993, 1996; Kanamori and Ross, 1993; Shen et al, 1998). Using our metabolic model, Gln(0) (initial total glutamine concentration measured under standard physiological conditions) was also fitted and the obtained value (2.4 ± 0.3 μmol/g) is in agreement with the measured concentration of 2.3 ± 0.4 μmol/g. Contrary to previous studies under ammonia infusion, we continuously quantified the total Gln increase over time, which allowed us to directly measure net Gln accumulation without any assumptions. The obtained Vsyn–Vnt of 0.033 ± 0.001 μmol/g per minute was twofold lower than the previously reported value under hyperammonemia measured indirectly by extrapolation using 15N MRS (Shen et al, 1998). The main source of discrepancy between our study and the previous one may be related to the fact that the previous study required modeling extrapolation to estimate net Gln accumulation.
The pyruvate carboxylation flux measured using 13C MRS under normoammonimic conditions is well known to be high in the conscious rat (Oz et al, 2004) and nearly absent under isoelectricity (Choi et al, 2002; Sibson et al, 1998), whereas under light α-chloralose anesthesia was measured to be 0.07 μmol/g per minute (Duarte et al, 2011). In the present study, the measurement of the pyruvate carboxylation flux gave a lower limit, which is likely to be higher due to pyruvate recycling and glutamine efflux. Consequently, the de-novo glutamine synthesis measured in our study under hyperammonemia might be assumed to be equal to the sum of the pyruvate carboxylation flux measured under normoammonimic conditions (Duarte et al, 2011) and the net Gln accumulation measured in our study under hyperammonemia, i.e., 0.07 + 0.033 = 0.103 μmol/g per minute. This estimated value under hyperammonemia for the de-novo glutamine synthesis is similar to previously reported unidirectional measurements under hyperammonemia using 13C MRS (Sibson et al, 2001) and indicated a significant increase in anaplerotic flux during hyperammonemia supporting the hypothesis that the anaplerotic flux is coupled to nitrogen removal from the brain (ammonia detoxification) under hyperammonemia conditions (Berl et al, 1962; Sibson et al, 2001; Zwingmann, 2007).
The incorporation of 15N of ammonia into [5-15N]Gln gave a Vsyn of 0.30 ± 0.050 μmol/g per minute, which was higher than previous published data under hyperammonemia ranging from 0.06 to 0.20 μmol/g per minute obtained when using 15N MRS (Kanamori et al, 1993, 1996; Kanamori and Ross, 1993; Shen et al, 1998) and lower than 0.29 to 0.43 μmol/g per minute (Sibson et al, 1997, 2001) obtained when using 13C MRS. As discussed previously, the main source of discrepancy between our study and the previous ones might be related to the increased number of assumptions used for the modeling of the previous studies. Together with Vsyn, we also fitted the plasma NH3 FE which was 91 ± 5%, consistent with experimental measurements (Shen et al, 1998). The apparent GS rate obtained in the present study under hyperammonemia conditions 0.30 ± 0.050 μmol/g per minute (see Results) was higher than the value of 0.18 μmol/g per minute reported under normoammonimic conditions using 13C MRS (Duarte et al, 2011), supporting the role of GS as a detoxification pathway for ammonia in the brain.
From the values of Vsyn–Vnt of 0.033 ± 0.001 μmol/g per minute and Vsyn of 0.30 ± 0.050 μmol/min per gram, we obtained a Vnt of 0.26 ± 0.030 μmol/g per minute. Our results (see Results) indicate that under hyperammonemia conditions the neurotransmission rate represents ~80% of the flux through the GS which is comparable to the values reported previously using 15N MRS or 13C MRS (Shen et al, 1998; Sibson et al, 1997, 2001). Since in the present study, we are assuming a negligible efflux from the Gln pool compared with Vsyn based on previous reports (Kanamori and Ross, 1993; Kanamori et al, 1996; Shen et al, 1998), the obtained neurotransmission rate Vnt represents an upper limit. By considering a Gln efflux of 0.07 μmol/g per minute (Duarte et al, 2011), we obtain a lower limit for Vnt of 0.19 μmol/g per minute which is similar with the value reported under normoammonimic conditions using 13C MRS (Duarte et al, 2011).
Although [2-15N] Glu and [2-15N] Gln cannot be separated in 15N spectra in vivo, the application of the model (Figure 2B; equations (18), (19) and (23) from Appendix) provided a VGDH with a high precision. Consequently, the incorporation of 15N into [2-15N]Gln + Glu alone, provided a VGDH of 0.029 ± 0.002 μmol/g per minute, where Vsyn and Vnt needed to model the exchange between [2-15N] Glu and [2-15N] Gln were obtained from the simultaneous fit of the position 5N and total Gln. To maintain a constant Glu concentration with increasing Gln, glutamate needs to be synthesized from tricarboxylic acid intermediates. To determine the predominant cellular localization of GDH, we performed high-resolution measurements on brain extracts and consequently measured the ratio between the FEs of [2-15N]Glu and [2-15N]Gln (see Results). From these measurements, we obtained ([2-15N]Gln)FE > ([[2-15N]Glu)FE which showed that net glutamate synthesis results from higher GDH activity in the glial compartment. Note that previous studies assumed that this replenishment takes place primarily in the glial compartment in hyperammonemic conditions (Shen et al, 1998). The high glial GDH flux obtained in our study is in agreement with higher specific activity in astrocytes relative to neurons (Schmitt and Kugler, 1999; Zaganas et al, 2001). In the presented model, a unidirectional flux was assumed for GDH in the astrocytes. When including a reversible flux for the GDH reaction, the reversible component of GDH was always converging to zero in the fitting process. In addition, our results also showed that under hyperammonemia VGDH≈ (Vsyn–Vnt), meaning that the rate of breakdown of Glu to glial 2-oxoglutarate was negligible. To our knowledge, there was only one previous study which measured VGDH under 15N ammonia infusion (Kanamori and Ross, 1995) reporting a VGDH value of 0.018 to 0.020 μmol/min per gram for an infusion rate of 3.3 mmol/kg per hour, which is consistent with our results considering that our infusion rate was higher (4.5 mmol/kg per hour) and thus likely to stimulate glutamine synthesis.
The incorporation of 15N of ammonia takes place mainly into [5-15N]Gln through Vsyn and into [2-15N]Glu + Gln through VGDH. Since VGDH obtained in our study represents only 10% from the obtained Vsyn, it supports the concept of GS as a major detoxification pathway for ammonia in the brain.
We conclude that it is feasible to combine localized in vivo 15N with 1H MRS and with an appropriate mathematical model to directly, simultaneously and reliably detect for the first time along with Vsyn, the net glutamine accumulation, Vnt and VGDH under ammonia infusion in the in vivo rat brain. From the modeling point of view, this new acquisition strategy required fewer assumptions to determine metabolic rates. In addition, this new strategy allowed a robust absolute quantification of total Gln, [5-15N]Gln and [2-15N]Gln + Glu in the same experiment. Our results showed an increase of GS and net glutamine accumulation under hyperammonemia, supporting the concept of their implication in cerebral ammonia detoxification. In addition, under hyperammonemia conditions the neurotransmission rate represents ~80% of the flux through the GS. The higher ([2-15N]Gln)FE compared with ([[2-15N]Glu)FE showed that net glutamate synthesis results from higher GDH activity in the glial compartment. Our results also showed that under hyperammonemia the rate of breakdown of Glu to glial 2-oxoglutarate was negligible because VGDH≈ (Vsyn–Vnt). Finally, the role of GS as an important detoxification pathway for ammonia in the brain was also supported by the fact that, in our study, the obtained VGDH was smaller than Vsyn.
Footnotes
Acknowledgements
The authors thank Dr PR Vasos (Laboratory for Biomolecular Magnetic Resonance, Ecole Polytechnique Federale de Lausanne, Lausanne, Switzerland) for this help with the acquisition of high resolution data and Dr N Kunz (Laboratory for Functional and Metabolic Imaging (LIFMET), Center for Biomedical Imaging (CIBM), Ecole Polytechnique Fédérale de Lausanne (EPFL), Lausanne, Switzerland) for providing the Matlab routines for preprocessing of 1H MRS data.
The authors declare no coflict of interest.