
Abstract
The purpose of this study was to develop a two-compartment metabolic model of brain metabolism to assess oxidative metabolism from [1-11C] acetate radiotracer experiments, using an approach previously applied in 13C magnetic resonance spectroscopy (MRS), and compared with an one-tissue compartment model previously used in brain [1-11C] acetate studies. Compared with 13C MRS studies, 11C radiotracer measurements provide a single uptake curve representing the sum of all labeled metabolites, without chemical differentiation, but with higher temporal resolution. The reliability of the adjusted metabolic fluxes was analyzed with Monte-Carlo simulations using synthetic 11C uptake curves, based on a typical arterial input function and previously published values of the neuroglial fluxes
Introduction
The brain meets its energetic demands at rest and during activation largely, if not exclusively by oxidative combustion of fuels. The tricarboxylic acid (TCA) cycle is central to oxidative cerebral metabolism and its metabolic rate is thus particularly important to measure when studying brain energetic needs under different physiological conditions. In addition to the generation of energy for brain cells ultimately in the form of high-energy phosphates such as ATP, the TCA cycle is involved in the metabolism of amino acids, such as the major excitatory neurotransmitter glutamate.
The major substrate for brain metabolism is glucose. However, a limitation in the use of labeled glucose or analogs to study brain metabolism is that these tracers must pass through the glycolysis before reaching the TCA cycle and do not reflect directly TCA cycle activity. Deoxyglucose derivates, such as the most frequently used fluorodeoxyglucose (FDG) do not even enter the glycolysis. They are trapped after phosphorylation by hexokinase to (fluorodeoxy)-glucose-6-phosphate and thus cannot reflect oxidative metabolism. A solution is to use a direct TCA cycle precursor, entering the metabolic pathway after the glycolytic branch point. Acetate, which is metabolized to acetyl-CoA and enters the TCA cycle through citrate synthetase, similarly to pyruvate, is an example of such a precursor.
Moreover, the compartmentation of glutamate metabolism in brain opens the way to
Materials and methods
Beta-Probe Measurements
The metabolic model presented in this study was developed and tested with
To measure the arterial input function (AIF) after bolus injection of 230 to 260 MBq of [1-11C] acetate, an arteriovenous shunt from the right femoral artery to the right femoral vein was used in conjunction with a γ coincidence counter to measure whole blood radioactivity. Data were acquired during a minimum of 20 minutes, both for the AIF and the brain tissue activity. The input function had a time resolution of 2 seconds, while each beta-probe measurement was averaged over 50 seconds.
Standard One-Tissue Compartment Model
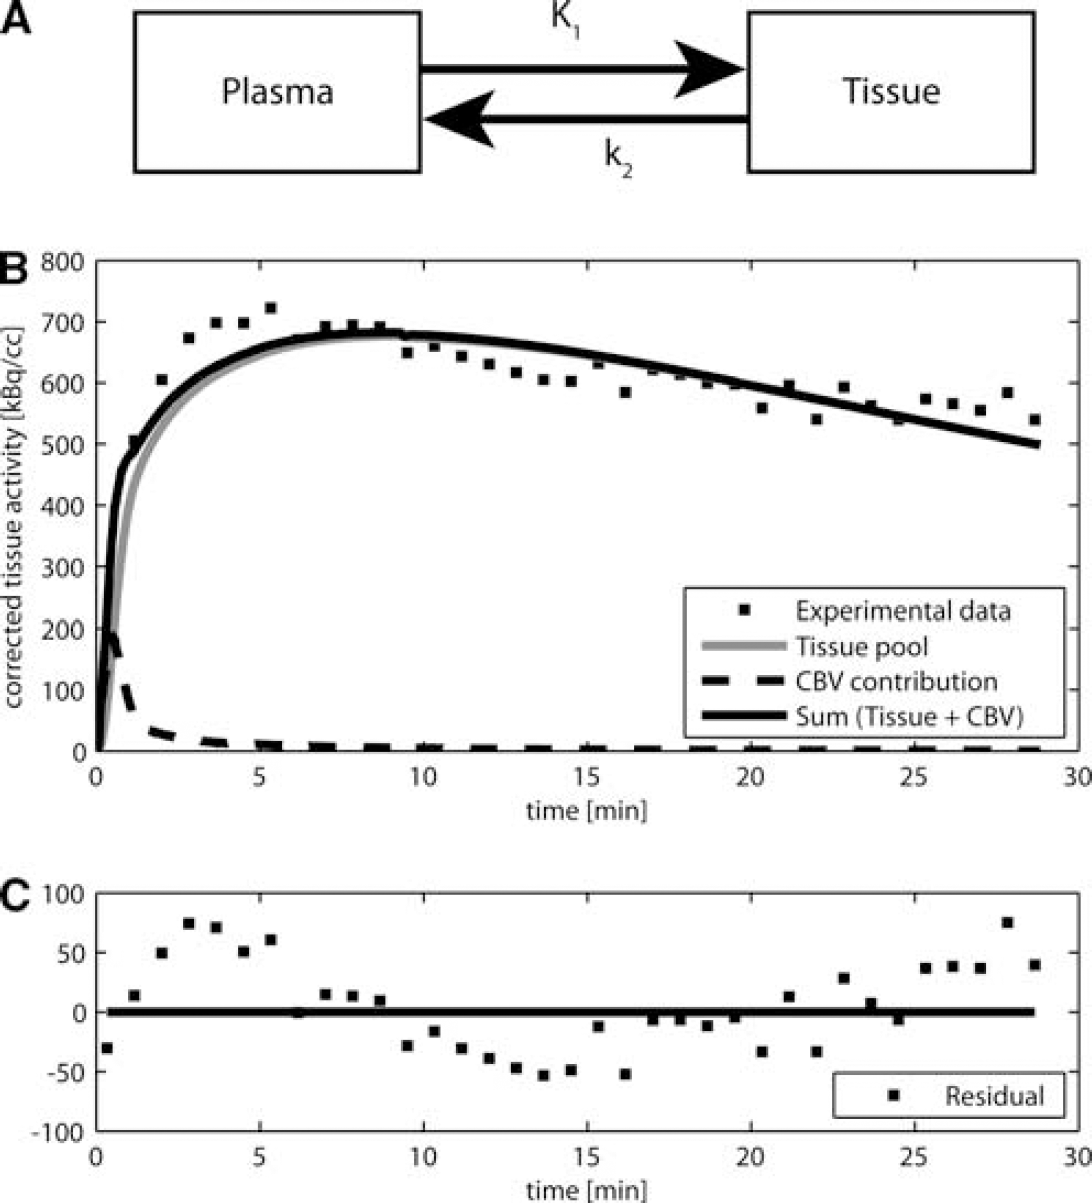
A previous model for brain studies is the one-tissue compartment model originally developed for 11C-acetate cardiac studies (Buck et al, 1991). This model, composed of two pools, is provided for completeness in Figure 1A. The first pool represents acetate radioactivity concentration in the plasma, known as AIF. The second pool represents the total brain tissue activity. This pool is the sum of the activity concentrations of all labeled metabolites. The rate of label transfer between the two pools is typically calculated from the first-order rate constants
(
The measured total activity curve includes the tissue compartment and the vascular compartment. The vascular volume fraction or cerebral blood volume (CBV) in the rat cerebral cortex is on the order of 2% to 3% (Todd et al, 1993a; Weeks et al, 1990). The experimental curve is, therefore, fitted to a linear combination of the two pools:

where α corresponds to the relative CBV. Using the measured AIF, the model was fitted to the tissue-activity curve by varying the three parameters
Neuroglial Model
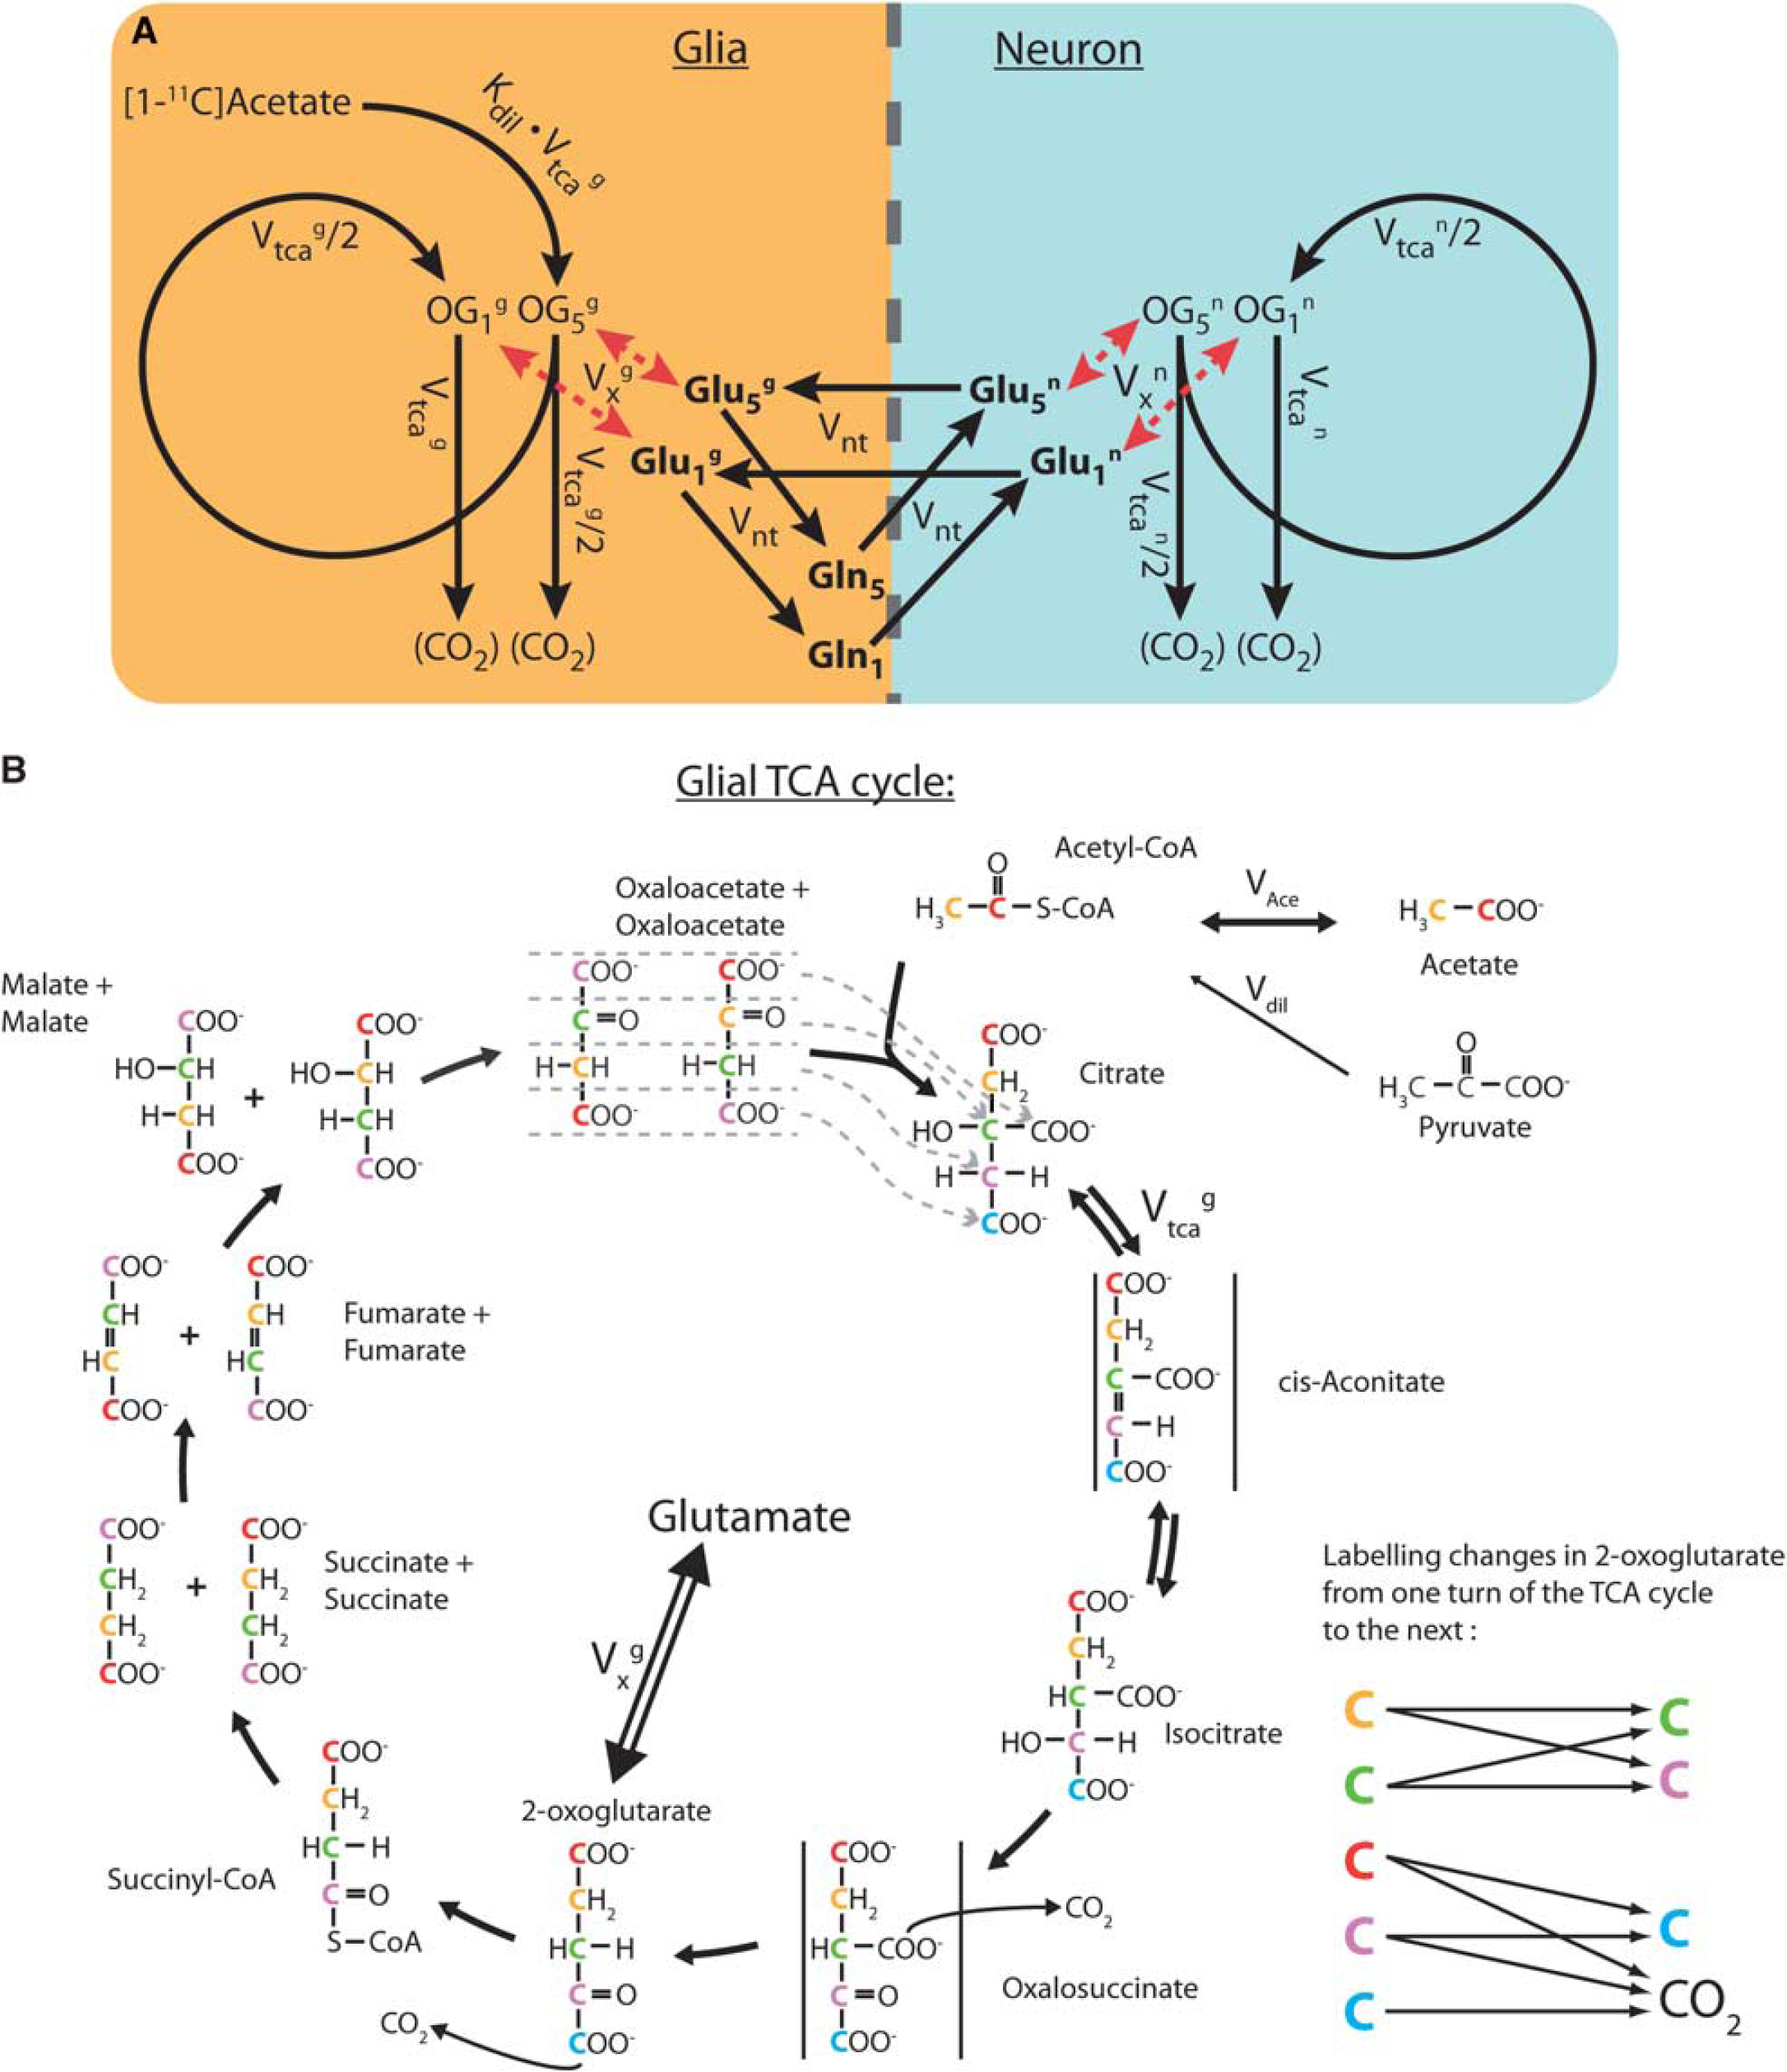
In this study, metabolic modeling was developed using a compartmentalized neurotransmitter approach previously applied in 13C Nuclear Magnetic Resonance studies (Gruetter et al, 2001). Brain tissue is mainly composed of glial and neuronal cells. It is now well accepted that glial cells are actively involved in excitatory neurotransmission, e.g., through the uptake of the neurotransmitter glutamate from the synaptic cleft (Arriza et al, 1994). The model, therefore, consists of two main metabolic compartments corresponding to the two cell types. Each compartment consists of the respective TCA cycle as well as of the glutamate-glutamine cycle, linking the metabolism of both compartments.
Acetate is almost exclusively metabolized in astrocytes (glial compartment) (Lebon et al, 2002; Waniewski and Martin, 1998). As a consequence, the inflow of new label from the substrate is occurring only through the glial TCA cycle. Nevertheless, the neuronal TCA cycle rate was accounted for, since it provides unlabeled carbons originating from neuronal pyruvate metabolism to the glutamate-glutamine cycle, which affects overall tissue activity.
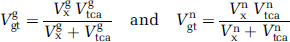
The resulting model is presented in Figure 2A. To illustrate how label is transferred within a molecule in the TCA cycle, we added the detailed scheme in Figure 2B. 11C from [1-11C] acetate enters the glial TCA cycle at the position 5 of citrate. Pyruvate metabolism in the glial compartment dilutes the acetyl-CoA pool. In the first turn of the TCA cycle, 11C reaches the position 5 of 2-oxoglutarate with a total net flux
(
On the neuronal side, label entering the TCA cycle in the first turn from acetate is neglected, consistent with the glial-specific uptake of acetate. Nevertheless, once neuronal glutamate is sufficiently labeled by the action of the glutamate-glutamine cycle (
Carbon Dioxide Labeling
In radiotracer experiments, the measured radioactivity curve represents all labeled compounds. Therefore, the contribution to the total tissue activity of labeled CO2, present in high concentrations of ∼13.8 to 15.1 μmol/g in the brain (Thompson and Brown, 1960; Thompson et al, 1980), needs to be additionally taken into account. For the modeling of CO2 labeling, we assumed a typical value of 15 μmol/g of total brain CO2, which includes bicarbonate, in rapid exchange with CO2 due to the action of carbonic anhydrase.
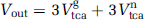
The input of label into the CO2 pool originates from both glial and neuronal TCA cycles. In fact, two CO2 molecules are released per turn in the TCA cycle (Figure 2B). An additional CO2 molecule is produced in the glycolysis for both compartments. Using the metabolic steady-state assumption for CO2, the efflux of the CO2 pool
When infusing C1-labeled acetate, the first release of label to CO2 occurs in decarboxylation of oxalosuccinate in the second TCA cycle turn. Since 2-oxoglutarate can exchange its carbon chain with glutamate, this label loss originates either from acetate or from glutamate C5. The second loss of labeled carbon to CO2 occurs in decarboxylation of 2-oxoglutarate, also in the second TCA cycle turn. This labeled carbon can originate directly from an exchange with glutamate C1, from glutamate C5 or acetate. Thus, CO2 can also be labeled from the neuronal TCA cycle, but only from neuronal glutamate C5 and C1, which both are likely to be only weakly labeled, since acetate does not directly enter neurons. The third CO2 molecule produced in the glycolysis is unlabeled in both compartments. The relative contribution of each of these pools to CO2 labeling is elaborated in Supplementary Appendix B.
CO2 diffuses almost freely across the blood—brain barrier. It was estimated (Supplementary Appendix B) that the total amount of CO2 in blood, considering all the transport modes (dissolved, buffered with water as bicarbonate, bound to proteins, particularly hemoglobin), is similar to brain CO2 concentration (Pocock and Richards, 2004). Assuming a fast exchange between these modes compared with brain metabolism (Geers and Gros, 2000) and a cerebral blood flow in the range of 1.3 mL/g per minute (Todd et al, 1993a, 1993b), an influx of 20 μmol/g per minute of unlabeled CO2 is estimated. This flux is large compared with the TCA cycle fluxes and reduces the 11CO2 activity and, therefore, its contribution to the total tissue-activity curve. Including the 11CO2 pool introduces an additional differential equation to the existing differential system, but no extra parameter (flux) to adjust.
Units of the Data and Derived Fluxes
Positron emission data are measured in kBq/mL and not directly as a concentration (in μmol/g). They are corrected for radioactive decay and delay between the plasma measurement and brain measurement due to blood circulation. The Nuclear Magnetic Resonance metabolic modeling approach expresses the total concentration of metabolites (labeled or not) in μmol/g and the labeling of each chemical pool in terms of fractional or isotopic enrichment (Uffmann and Gruetter, 2007). For this study, standard total concentrations of 3.5 μmol/g for glutamine, 1 μmol/g for glial glutamate, and 8 μmol/g for neuronal glutamate were assumed (Kunz et al, 2010; Xin et al, 2010).
However, a conversion of the data from kBq/mL to μmol/g was not necessary, since we are dealing with linear differential equations (see Supplementary Appendix A) in which both beta-probe data and AIF are given in kBq/mL.
Using absolute concentrations in μmol/g for the chemical pool sizes allows determining metabolic fluxes between the pools in μmol/g per minute from the adjusted rate constants. To solve the differential system, the fractional enrichment of plasma acetate (AIF) was calculated assuming a typical blood acetate concentration of 1 μmol/g in the rat (Cetin et al, 2003).
Model Analysis
First, the standard one-tissue compartment model (Figure 1A) was applied to different tissue-activity time courses acquired
To assess the validity of the suggested new modeling approach, the two-compartmental (neuroglial) model was then implemented and studied under four different sets of assumptions, further described below.
A system of linear differential equations was derived for the neuroglial model, assuming metabolic steady-state (i.e., no net metabolite concentration changes are occurring). As previously shown (Uffmann and Gruetter, 2007), the temporal change of the labeling of the TCA intermediates, present in low concentrations, can be eliminated from the mathematical model without modifying the dynamics of the labeling of glutamate, resulting in a 7-pools model (Glu5g, Glu1g, Gln5, Gln1, Glu5n, Glu1n, and CO2) characterized by five fluxes (
The models were developed using Matlab (MathWorks, Natick, MA, USA). To assess the precision and accuracy of the different parameters, Monte-Carlo simulations of the neuroglial model were undertaken, based on the simulated time courses created with the complete model and generated with the following flux values (
The following four scenarios were investigated:
as Case 2 but with 5% CBV and 11CO2 contribution added to the simulated experimental curve. A zero weight was given to the data points from the first 2 minutes.
as Case 3, but the pool of CO2 was added to the fitted model.
In Case 3, 11CO2 production and CBV contribution were added to the simulated tissue-activity curves but not to the model used to fit the data. In this way, the impact of these two additional labeling pools on the estimated fluxes could be investigated.
In Case 4, a sensitivity analysis was also performed to visualize the effect on the tissue curve of varying
The neuroglial model with the assumptions used in Case 4 was finally fitted to nine sets of AIFs and tissue measurements obtained on different rats in resting conditions, under urethane anesthesia (Wyss et al, 2009). Mean value and uncertainty of
Results
Standard One-Tissue Compartment Model
First, the standard one-tissue compartment model (Figure 1A) was fitted to the measured
Neuroglial Model
In each case, the mean value of the different fluxes (
Flux values and uncertainties determined by Monte-Carlo simulation
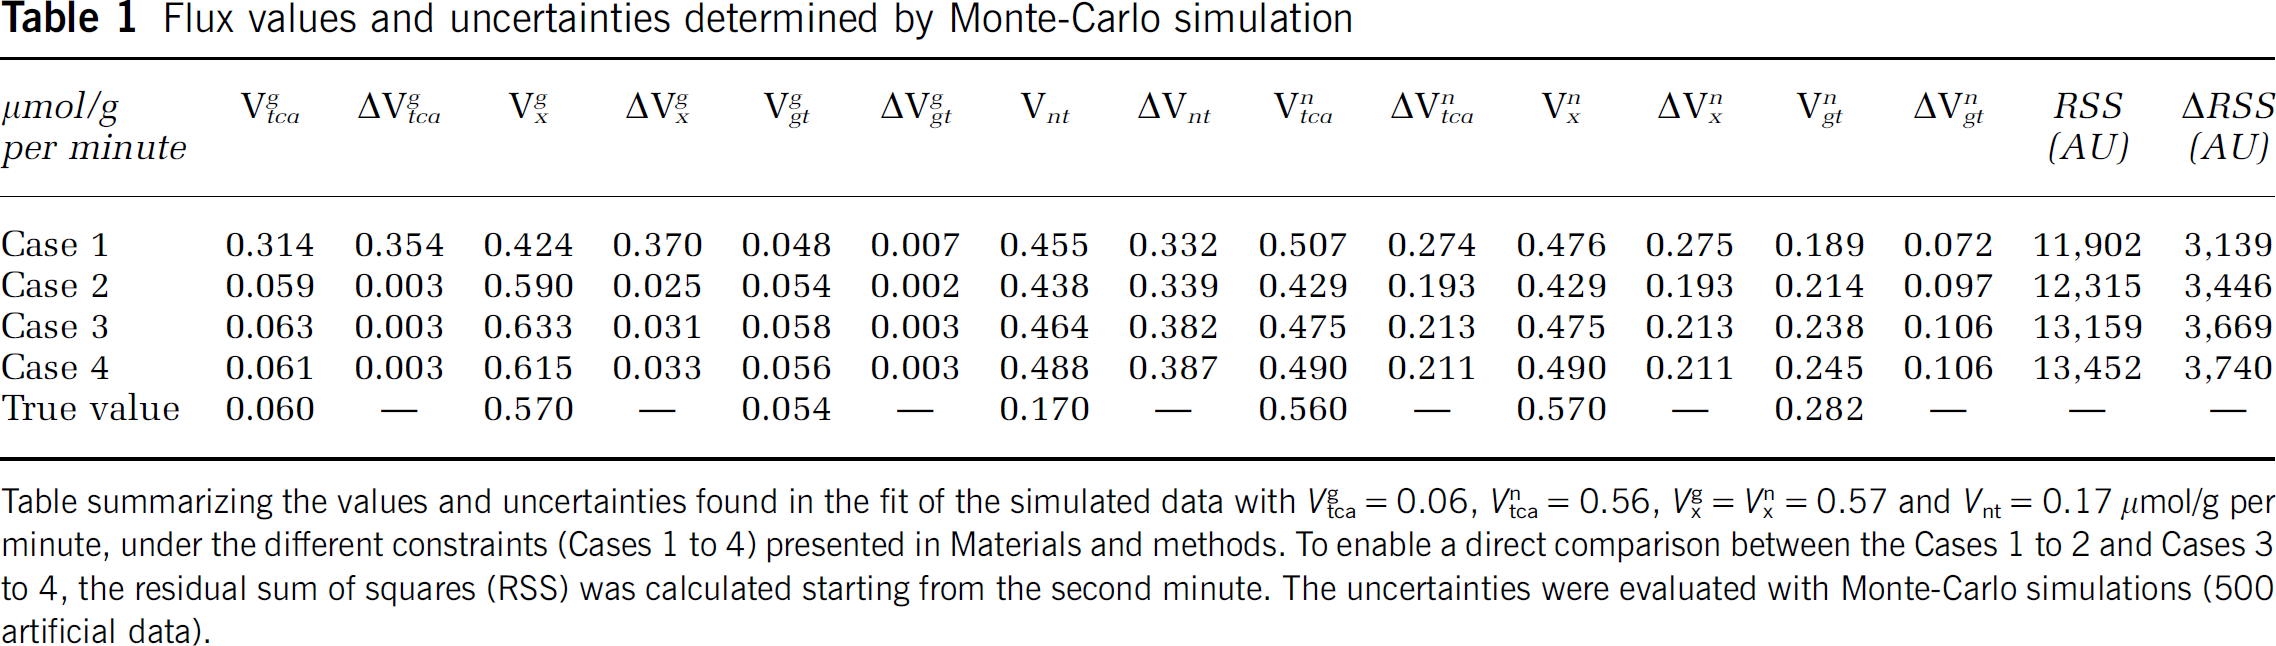
Table summarizing the values and uncertainties found in the fit of the simulated data with
Table 2 shows the average correlations found for the estimated fluxes in the Monte-Carlo procedure for each case of the four.
Correlation between the adjusted metabolic fluxes
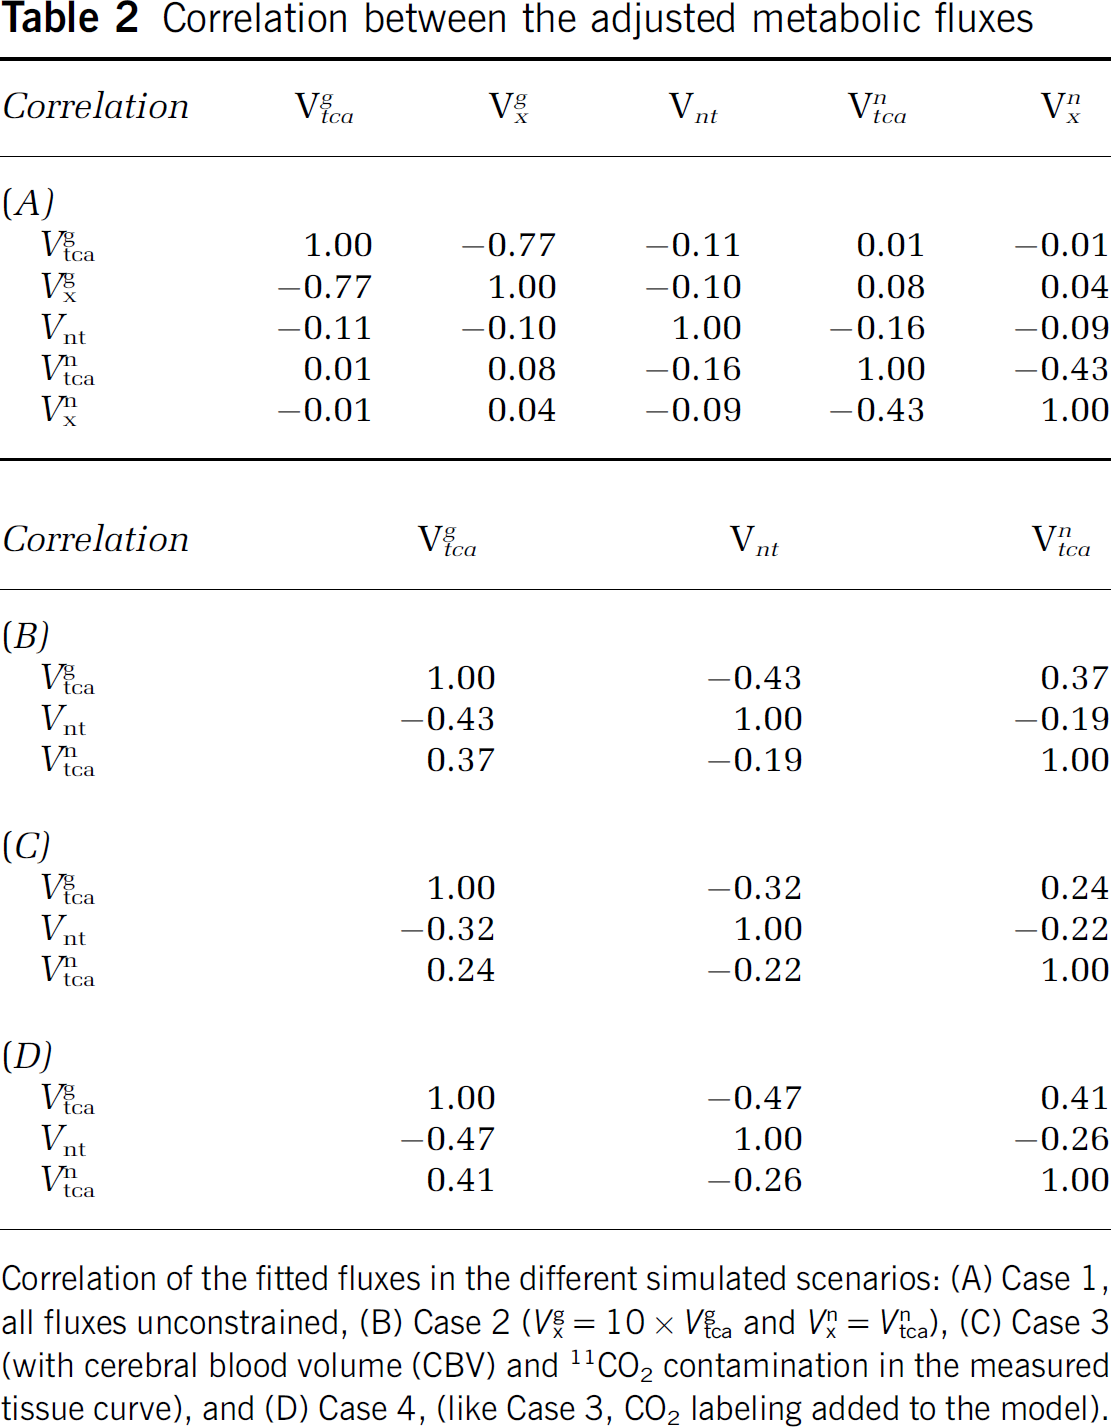
Correlation of the fitted fluxes in the different simulated scenarios: (A) Case 1, all fluxes unconstrained, (B) Case 2 (
In the following section, we describe the results summarized in Tables 1 and 2 for each different set of assumptions (Cases 1 to 4).
Analysis of the Monte-Carlo Simulation for the Four Different Cases
Case 1 (All Five Parameters Unconstrained)
The model with five free parameters presented a significant correlation between
Case 2 (V xg=10 × V tcag and V xn=V tcan)
Constraining
In Case 2, the fitted fluxes were close to the ‘true’ values (on which the Monte-Carlo simulation is based), except for
Case 3 (with Cerebral Blood Volume and 11CO2 Contamination in the Measured Tissue Curve)
In Case 3, where CBV and CO2 contributions were added, the three fitted fluxes showed low correlations <0.32 in absolute value (Table 2C). The uncertainty of
Case 4 (like Case 4, CO2 Labeling Added to the Model)
In Case 4, the activity of the CO2 pool was added to the fitted curve. A very similar fit residual (residual 9% worse compared with Case 2), flux values and uncertainties were found in Case 4 compared with Case 3.
Sensitivity Analysis
Figure 3 shows the sensitivity analysis of the neuroglial model to the fitted fluxes, using the assumptions of Case 4. A typical [1-11C] acetate bolus injection curve was considered as AIF. The analysis was made starting from the typical flux values already used before (
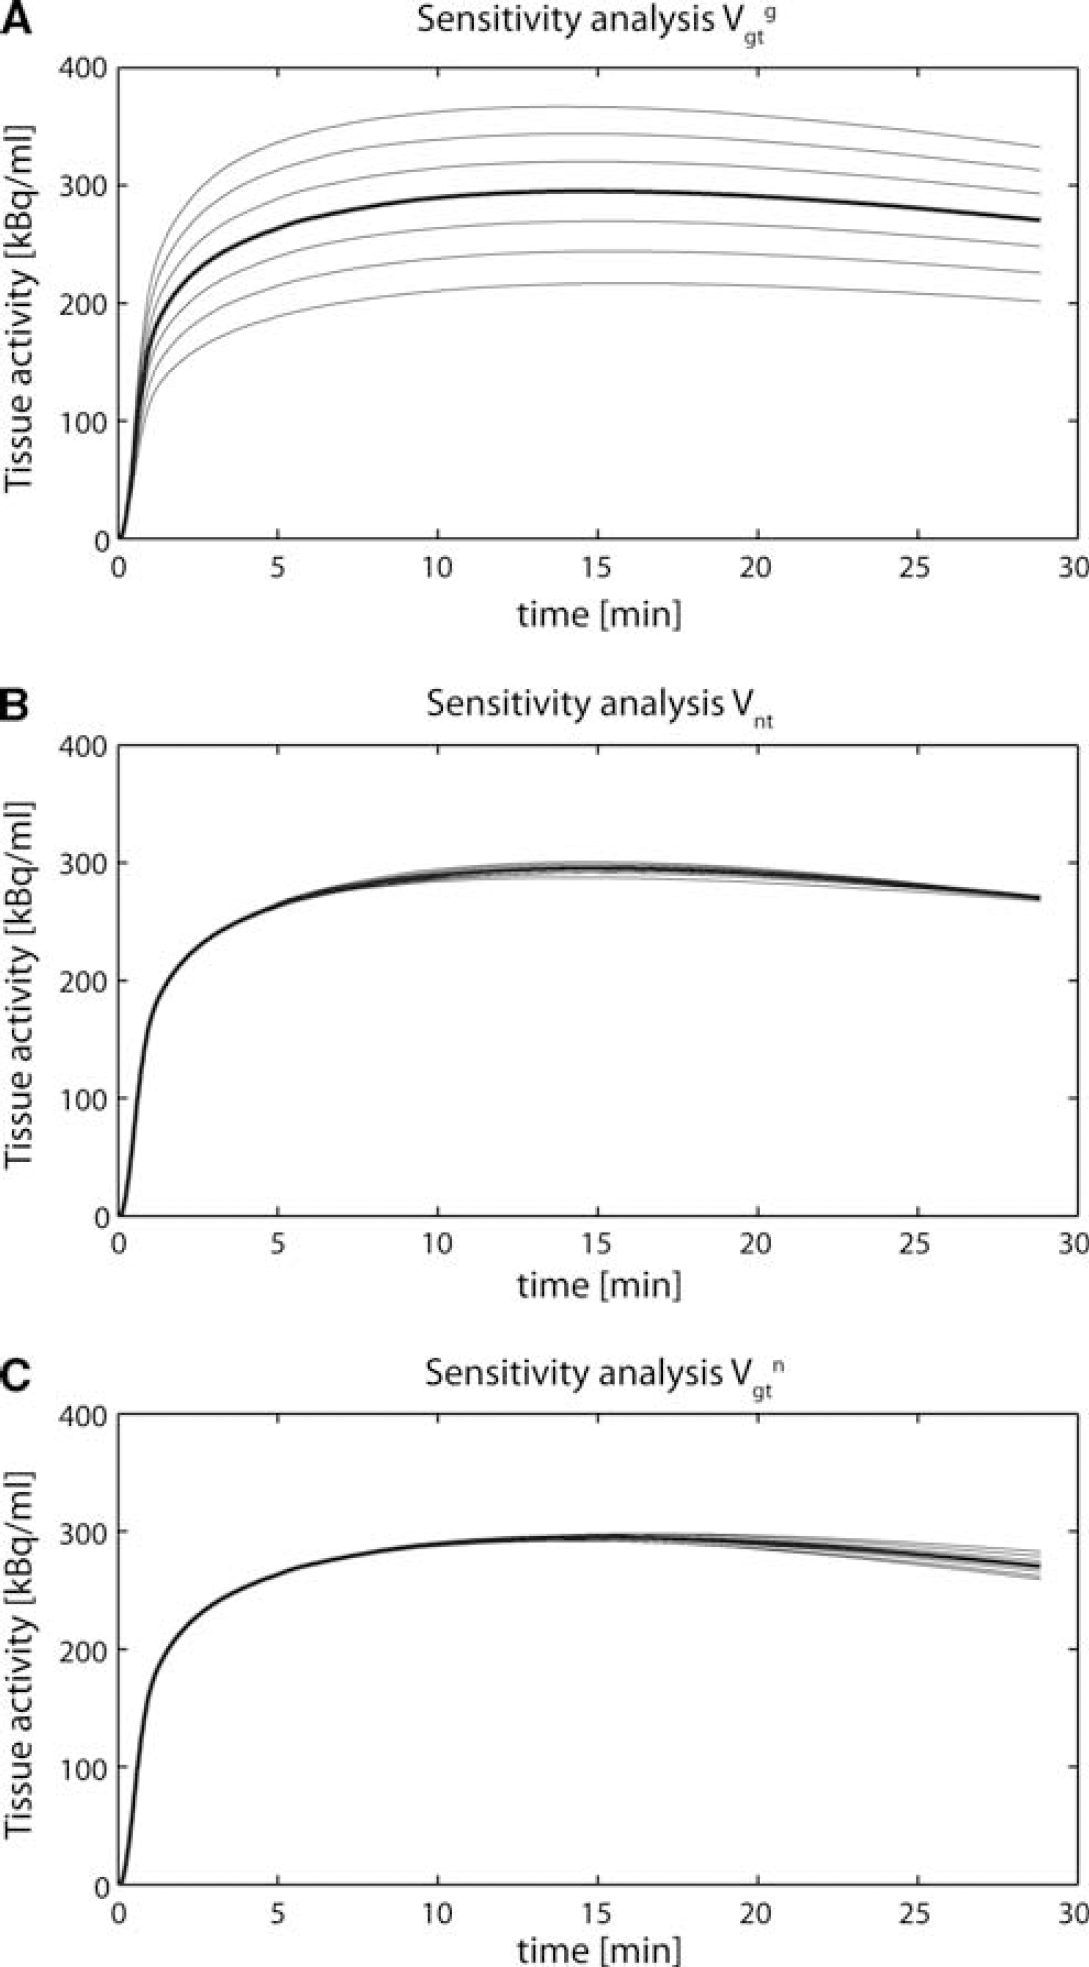
Sensitivity analysis of the model relatively to the parameters
Experimental Data
Figure 4 shows a typical fit of an experimental tissue-activity curve obtained with the beta-probe. The assumptions used were those of Case 4, i.e.,
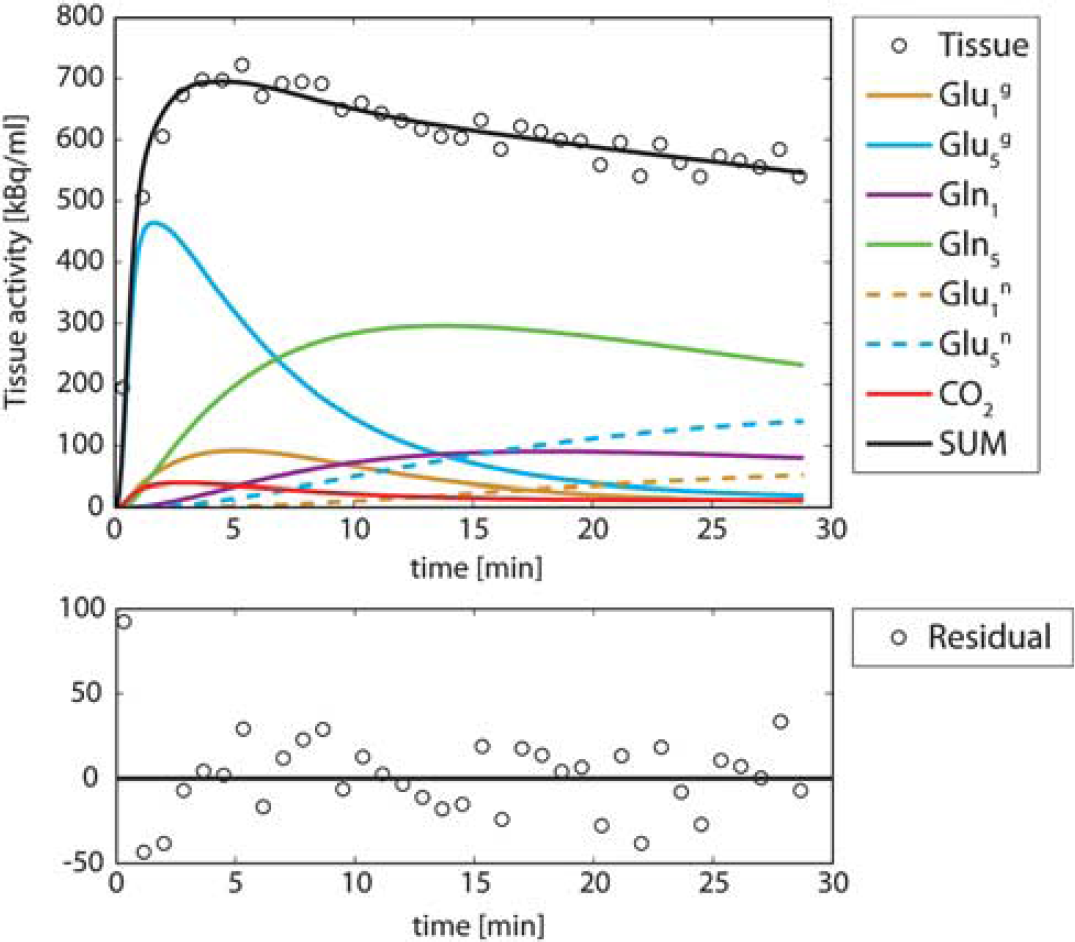
Fit of the same experimental data as in Figure 3, but using the neuroglial model with the assumption exposed in Case 4. The fit residuals are uniformly distributed around zero. The higher experimental values at the beginning compared with the fit are due to the contamination of the blood activity in brain tissue. However, thanks to the bolus injection of [1-11C] acetate, this problem can be solved by fitting the curve starting only from minute 2.
The neuroglial model was able to characterize the time course, as no discrepancy between experimental data and model was visible. This observation was consistently made for all nine fitted experimental curves.
Figure 5 summarizes the group average and s.d. of fluxes obtained on nine rats in resting conditions. The mean values for
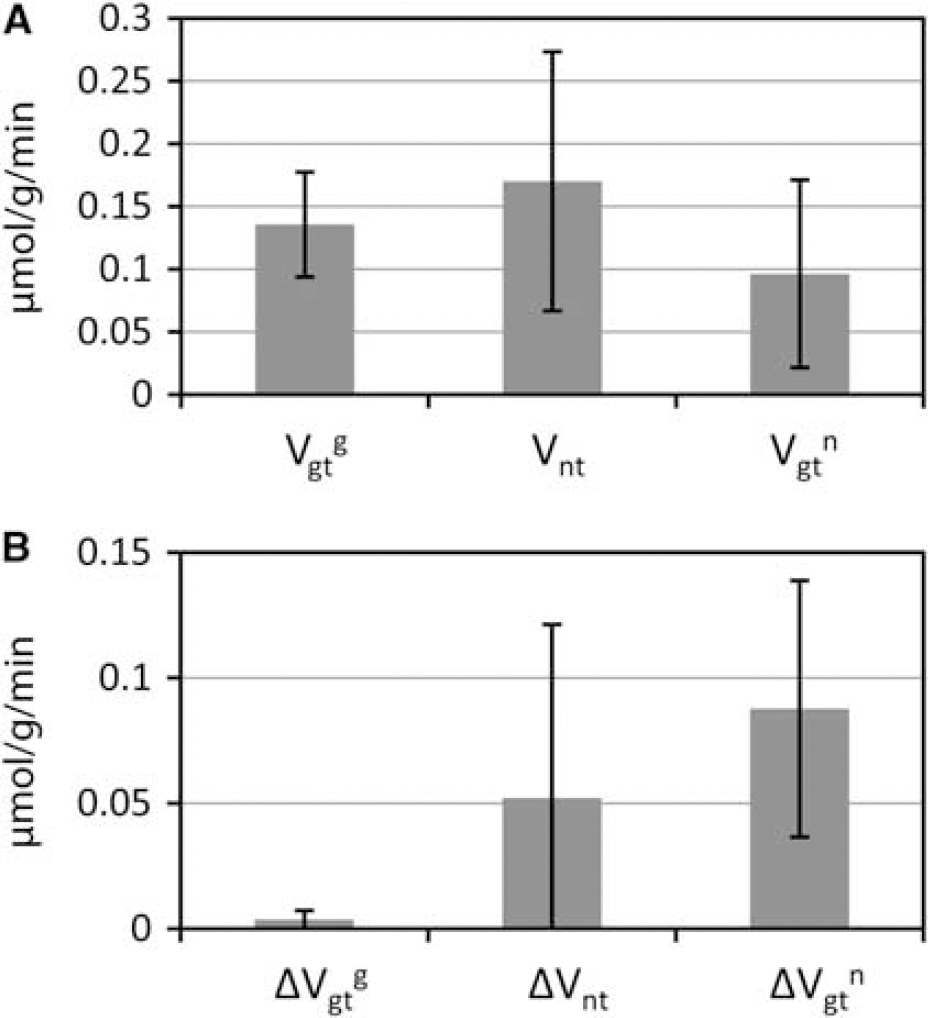
(
Discussion
In this study, we built a brain metabolic model for [1-11C] acetate infusion experiments based on the radiotracer techniques to measure tissue-activity curves. The modeling approach was based on a two-compartment model typically used in brain 13C-labeling studies. The sensitivity of the model to the involved biochemical fluxes was assessed by fitting an artificial tissue-activity curve, based on a typical AIF and standard metabolic fluxes. This Monte-Carlo approach based on the simulated data, in which the ‘true’ flux values are known, allowed a direct assessment of the accuracy and precision of the model under different assumptions. Finally, using the more suitable working assumptions, the model was successfully fitted to nine experimental data sets acquired
Measurable Fluxes: Unreliability of the Separate V xg and V tcag Estimation
The dynamics of glial glutamate C5 labeling is affected by the composite flux
However, in radiotracer experiments, the information on C1-labeled metabolites cannot be acquired separately. It is added to the activity from all other labeled metabolites in the tissue. The contribution of the C1 positions to the total tissue activity is low (Figure 4), typically <10%. The separate measurement of
As a consequence, it was more appropriate to fit the experimental data by adjusting
The affinity of glial metabolism to acetate, represented by
Glial Fluxes
With the aforementioned assumptions for
The accuracy of
Neuronal Fluxes
Using the assumptions that
In the experimental cases, the value of
To analyze the impact of neglecting completely the neuronal dilution in the fit, the simulated data were fitted with neuronal fluxes fixed to 0 μmol/g per minute (data not shown). The fit residual was clearly increasing (by 110% compared with Case 2, where
Neurotransmission Flux
As a consequence, the fitted value of
Blood Partial Volume
As shown in the decomposition of the total tissue-activity curve in Figure 4, the tissue pool dominating the total labeling in the first minutes is glutamate C5. From its labeling equation (Supplementary Appendix A, eq. 9), it can be seen that the slope of glutamate C5 labeling at early time points is equal to
Therefore, it was preferred to neglect the first 2 minutes of data following the 11C bolus injection and to neglect the blood partial volume contribution. As a matter of fact, in the simulations of Cases 3 and 4, a 5% blood partial volume contribution was added to the simulated total tissue curve, while the model was fitted starting after the second minute without taking into account the blood contamination. Table 1 Case 3 (with CBV contamination) compared with Case 2 (without CBV contamination) shows that blood contamination of the signal resulted in a slight increase in the fit residual, while this working assumption minimally affected the value and precision of the adjusted fluxes (<8% for
Inclusion of the CO2 Labeling in the Model
In Case 3, the labeling of CO2 was also added to the simulated tissue-activity curve but not to the model used. As discussed above regarding the CBV contribution, the fitted flux values were minimally affected by this additional contribution. Adding the CO2 pool without the CBV contribution to the simulated tissue-activity curve led to the same observation (not shown). This is consistent with the low activity of 11CO2 compared with the total tissue activity observed in the fits of the experimental data (Figure 4). As a consequence, the contribution of CO2 to total tissue activity can be considered negligible.
Adding the CO2 pool to the fitted model (Case 4) had a positive impact especially on
Fluxes Derived from the Experimental In Vivo Data
The model was fitted to nine tissue-activity curves with corresponding AIFs (Figure 4). The consistently uniform distribution of the residuals around zero reflects the good quality of the fit of the model. The precision on
In the experimental results, the group average
The experimental precision on
In the glial compartment, pyruvate carboxylation affects the position C1 of glial glutamate, as an additional dilution flux, in the second turn of the TCA cycle. However, the C1-labeling positions have a low contribution to the total tissue-activity curve (Figure 4); and therefore, pyruvate carboxylation affects marginally the 11C tissue uptake curves. Fitting a tissue-activity curve generated with the inclusion of pyruvate carboxylation, but fitted with the presented model had negligible impact on the derived metabolic fluxes
The flux
Compared with 13C MRS, the determination of glial oxidative metabolism with [1-11C] acetate infusion and positron emission measurements has several advantages. First, the high sensitivity of radiotracer detection enables measuring glial metabolism under physiological conditions due to trace amounts of [1-11C] acetate infusion (∼0.5 nmol). Second, the experiment can be realized in only 20 to 30 minutes, while 13C MRS studies, with a typical time resolution of 10 minutes, need at least 2 to 3 hours of acquisition. The spatial resolution of this technique (∼8 μL with beta-probe) is higher than what can be achieved with 13C MRS, thanks to the high sensitivity of positron emitter detection.
Using a PET scanner instead of the beta-probe would allow whole brain coverage in a single experiment with less impact on brain tissue, while obtaining similar or better spatial resolution. A cerebral mapping of
However, the absence of chemical information on the molecule emitting the positron reduces the number of determined metabolic fluxes compared with 13C MRS. The precise measurement of the AIF and its correction is an important step of the measurement to obtain accurate results and is probably the most limiting factor.
Like in 13C MRS studies, a measurement of the total plasma acetate is also necessary to further extract the fractional enrichment of acetate, the precursor of all the modeled pools. However, in [1-11C] acetate studies, one single measurement should be enough since the injection of the tracer is negligible compared with the natural plasma acetate concentration, which should therefore not vary significantly during the experiment. The requirement is thus similar to an 18FDG study, in which the plasma glucose concentration is needed for quantification.
Conclusion
We conclude that the presented new model for
We further conclude that radiotracer experiments using [1-11C] acetate infusion can be used for the study of local glial oxidative metabolism. Minimal invasiveness and short acquisition periods make it an interesting method for human—possibly clinical—PET applications.
Footnotes
Acknowledgements
The authors would like to thank Dr Philippe Millet from the HUG, Geneva, for his helpful suggestions concerning the implementation of the metabolic model in Matlab.
The authors declare no conflict of interest.
References
Supplementary Material
Please find the following supplemental material available below.
For Open Access articles published under a Creative Commons License, all supplemental material carries the same license as the article it is associated with.
For non-Open Access articles published, all supplemental material carries a non-exclusive license, and permission requests for re-use of supplemental material or any part of supplemental material shall be sent directly to the copyright owner as specified in the copyright notice associated with the article.