
Abstract
Tc-99m ethyl cysteinate diethylester (ECD) and Tc-99m hexamethyl propylene amine oxime (HMPAO) are commonly used for single-photon emission computed tomography (SPECT) studies of a variety of neurologic disorders. Although these tracers have been very helpful in diagnosing and guiding treatment of neurologic disease, data describing the distribution and laterality of these tracers in normal resting brain are limited. Advances in quantitative functional imaging have demonstrated the value of using resting studies from control populations as a baseline to account for physiologic fluctuations in cerebral perfusion. Here, we report results from 30 resting Tc-99m ECD SPECT scans and 14 resting Tc-99m HMPAO scans of normal volunteers with no history of neurologic disease. Scans were analyzed with regions of interest and with statistical parametric mapping, with comparisons performed laterally (left vs. right), as well as for age, gender, and handedness. The results show regions of significant asymmetry in the normal controls affecting widespread areas in the cerebral hemispheres, but most marked in superior parietotemporal region and frontal lobes. The results have important implications for the use of normal control SPECT images in the evaluation of patients with neurologic disease.
Introduction
Cerebral perfusion is commonly studied using a variety of isotopes and tracer molecules in singlephoton emission computed tomography (SPECT), including Tc-99m ethyl cysteinate diethylester (ECD), Tc-99m hexamethyl propylene amine oxime (HMPAO), I-123 isopropyl n-iodoamphetamine. These radiotracers are absorbed and bound in cortical tissues with a limited amount of back-diffusion, providing the advantage that a high-quality image can be acquired of the cerebral blood flow patterns even after a delay of several hours after the tracer injection. This is particularly advantageous for obtaining images of the blood flow patterns during a seizure, i.e., ‘ictal SPECT’. Positron emission tomography (PET) is capable of mapping cerebral perfusion with higher spatial resolution than SPECT using O-15-labeled water, although PET isotopes are expensive, not available to many centers, and have short half-lives. O-15 PET images represent the immediate perfusion state of the brain at the time of image acquisition and are essentially limited to interictal (between seizures) studies because of the logistical challenge of injecting and immediately scanning the patient during a seizure. Cerebral blood flow is an important diagnostic metric in stroke (Liebeskind, 2009), neurodegenerative disease (Josephs et al, 2006), movement disorders (Takahashi et al, 2010), and epilepsy (Duncan, 2009; O'Brien et al, 2000; Kazemi et al, 2009), and is frequently used as a surrogate estimation of neural activity in clinical neurology and research studies of cerebral function.
In many cerebral perfusion studies, the homologous contralateral brain region is used as a reference to estimate the magnitude of perfusion abnormalities, or brain regions are laterally averaged to reduce noise and increase statistical sensitivity. Lateral differences in SPECT tracer uptake have been used to identify the abnormal brain regions in temporal lobe epilepsy (Rowe et al, 1991; Newton et al, 1994; Devous et al, 1998), stroke (Mountz et al, 2003), and Parkinsons disease (Felicio et al, 2009). In many studies where activity changes are statistically analyzed or mapped, it is not uncommon for investigators to laterally mirror images to align the clinically affected side or effect of interest to increase statistical power (Chassagnon et al, 2009). This approach assumes that the normal pattern of cerebral perfusion is sufficiently symmetric that direct left-right comparisons offer a valid, unbiased estimate of deviation from normal resting perfusion.
However, it is well known that the normal human brain exhibits significant asymmetry in structure and function (Toga and Thompson, 2003). The physical shape of brain exhibits a characteristic Yakovlevian torque (LeMay, 1976; Galaburda et al, 1978), or petalia, where the right frontal lobe is wider and protrudes more anteriorly than the left, whereas the left occipital lobe is wider and extends farther posteriorly than the right. Many structural asymmetries of the brain center around the perisylvian area and are correlated with handedness (Toga and Thompson, 2003). The superior curvature of Sylvian fissure occurs more anteriorly on the right side than on the left (LeMay, 1976), resulting in a more anterior and superior termination point for the Sylvian fissure on the right side. The planum temporale, a triangular region of cortex located just below the posterior Sylvian fissure involved in auditory and language perception, is up to 10 times greater in volume on the left side compared with the right, particularly in righthanded individuals (Geschwind and Levitsky, 1968; Pieniadz and Naeser, 1984; Steinmetz et al, 1991; Shapleske et al, 1999; Watkins, 2001), although one study found an overall increase in gray matter density on the right side (Good et al, 2001). Hippocampal volumes have also been shown to be asymmetric, with the right side larger (Jack et al, 1989).
Functional lateralization is one of the foundations of brain organization, and is well documented through lesion studies (Brain, 1941; Rasmussen and Milner, 1977), direct electrical stimulation of cortex (Penfield and Jasper, 1954), and intracarotid sodium amytal testing (Wada et al, 1975), with language functions typically residing in the left hemisphere and showing a strong correlation with planum temporale size and right handedness (Foundas et al, 1995). Prior studies investigating lateral asymmetry in SPECT images of normal brain have used visual comparison (Aubert-Broche et al, 2005), manually placed or drawn region of interest (ROI) measurements (Markus et al, 1993; Catafau et al, 1996; Baird et al, 1999; Grova et al, 2003; Aubert-Broche et al, 2005), template-based ROI measurements (Krausz et al, 1998; Van Laere, 2001et al) or a two-compartment model (Risberg et al, 1975) to assess asymmetry. Prior studies have not, however, provided a comprehensive picture of the patterns of SPECT asymmetry. Although differences have been shown between perfusion tracers (Koulibaly et al, 2003; Ito et al, 2006; Inoue et al, 2003), prior studies of normal resting asymmetry have not directly addressed the influence of the tracer. This information is important in providing a context for perfusion asymmetry measured in pathologic states, as well as in assessing the validity of left-right averaging in perfusion experiments.
The purpose of the present study was to measure and analyze asymmetries in baseline SPECT tracer uptake patterns in normal volunteers using semiautomated ROI analysis and statistical parametric mapping (SPM; Frackowiak et al, 1997). The two methods are complementary, as the ROI approach lends itself to a quantitative presentation of statistical results, whereas the SPM analysis provides a spatial map of statistically significant asymmetry.
Materials and methods
Volunteer Selection and SPECT Imaging
For SPECT statistical analysis and mapping, a control group of SPECT images from 30 volunteers without any history of neurologic disease were acquired. The median age of the normal volunteers was 27.75 years (range 18.13 to 39.68 years). The group contained 15 males and 15 females, and 16 right-handed and 3 left-handed individuals, with hand preference unknown in 11 individuals. Volunteers were recruited through the Department of Nuclear Medicine at Mayo Clinic in accordance with an institutional review board-approved protocol, and all volunteers gave informed written consent to participate. The injected isotope, ambient conditions, and imaging protocol were identical to that used for a routine clinical SPECT brain imaging study. In the protocol, 20 mCi of Tc-99m ECD were injected intravenously with ambient room lighting and the subject's eyes open and ears unplugged. Isotope injections were performed in either the left or right arm, with the technologist delivering verbal instructions during the injection. Images were acquired on a dualheaded Elscint Helix gamma camera system (Elscint, Haifa, Israel) with ultrahigh-resolution fan beam collimators. Projections were acquired on a 128 × 128-pixel matrix over a 360° circular orbit, with 120 views obtained at 3° intervals. For all studies, the gamma camera performed five 360° orbits at 3 seconds per view at an energy setting of 140 keV with a 15% to 20% window. Images were reconstructed with ordered subset expectation maximization and a Metz filter (power, 3, full-width at halfmaximum (FWHM), 6 mm) rebinned into a 64 × 64 matrix with a × 2 zoom. Chang attenuation correction (0.12 cm) was applied (Chang, 1978), and a standard series of contiguous images was created in the transaxial, coronal, sagittal, and transtemporal planes.
Region of Interest Analysis
Post-acquisition image processing for ROI analysis was performed using AnalyzeAVW 10.0 (Biomedical Imaging Resource, Mayo Foundation, Rochester, MN, USA). Cerebral pixels were identified in each subject's SPECT by interactive thresholding. The anterior temporal lobes were segmented using a semi-automated seeded-region-growing algorithm using the global cerebral threshold value. Mean pixel intensities within each temporal ROI were measured and recorded, and the mean temporal pixel intensities were normalized to the cerebral extratemporal pixel mean. Hemispheric ROI's were determined by dividing the thresholded brain along the interhemispheric fissure. A paired t-test was performed comparing the left and right normalized intensities for the temporal lobes and cerebral hemispheres using the statistics package in Matlab r2008a (The MathWorks, Natick, MA, USA). An asymmetry index was calculated using the following formula:
Unpaired t-tests were performed to compare the temporal and hemispheric asymmetry indices for the gender and handedness groups.
The ECD and HMPAO images were spatially normalized to a high-resolution Montreal Neurological Institute (MNI) brain atlas (Montreal Neurological Institute, Montreal, Quebec, Canada), and SPECT signal intensity was measured in regions of interest defined by the anatomical automatic labeling template (Tzourio-Mazoyer et al, 2002) using the MarsBar toolbox (http://marsbar.sourceforge.net/).
Statistical Parametric Mapping
Normal volunteer HMPAO SPECT images were obtained in Analyze 7.5 format, whereas volunteer ECD images were converted from Dicom to Analyze format for compatibility with SPM. Images were copied and flipped laterally using Analyze 10.0. The original and mirrored copy of each image were spatially normalized to a symmetric SPECT template using a nonlinear image registration algorithm implemented as part of the SPM-2 package (Wellcome Institute of Neurology, University of London, UK, http://www.fil.ion.ucl.ac.uk/spm/) running under MATLAB 7.1 (Mathworks, Sherborne, MA, USA). The symmetric SPECT template was constructed from three of our normal ECD subject images by first smoothing with an 8 × 8 × 8 Gaussian kernel, spatially normalizing them to the standard SPM-2 SPECT template, and averaging the normalized images. A copy of this spatially normalized mean image was then flipped laterally using ImageJ (Rasband, 2011), and averaged with the original mean image. Once normalized to this composite, symmetric template all volunteer SPECT images were visually inspected. Images were then smoothed in SPM2 using a three-dimensional 16 mm Gaussian kernel before statistical analysis. A paired t-test was then performed in SPM-2 between the original and flipped copies of the normalized and smoothed SPECT images. Proportional scaling to a global mean value of 50 was used, with a gray matter mask threshold of 0.8 times the mean and a mean voxel value global calculation. Nonsphericity correction was not used. T-contrasts were defined, and results displayed with a significance threshold of P < 0.001 (not corrected for multiple comparisons), and a cluster-level threshold of 125 contiguous voxels (1 cm3) was used (McNally et al, 2005).
Prior studies have shown some differences in the uptake patterns of Tc-99m ECD, Tc-99m HMPAO, and other tracers (O'Brien et al, 1999; Inoue et al, 2003). To assess differences in observed asymmetry between different SPECT tracers, we obtained 14 sets of paired resting HMPAO SPECT images of normal volunteers from the Yale University Epilepsy Research Group (http://spect.yale.edu/; McNally et al, 2005). We repeated the mirror image SPM paired t-test analysis using only the initial scan from each subject. Gender, handedness, and age information were not available for the HMPAO scans, and hence these analyses were not repeated on this image set.
Results
Statistical Parametric Mapping
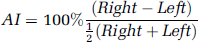
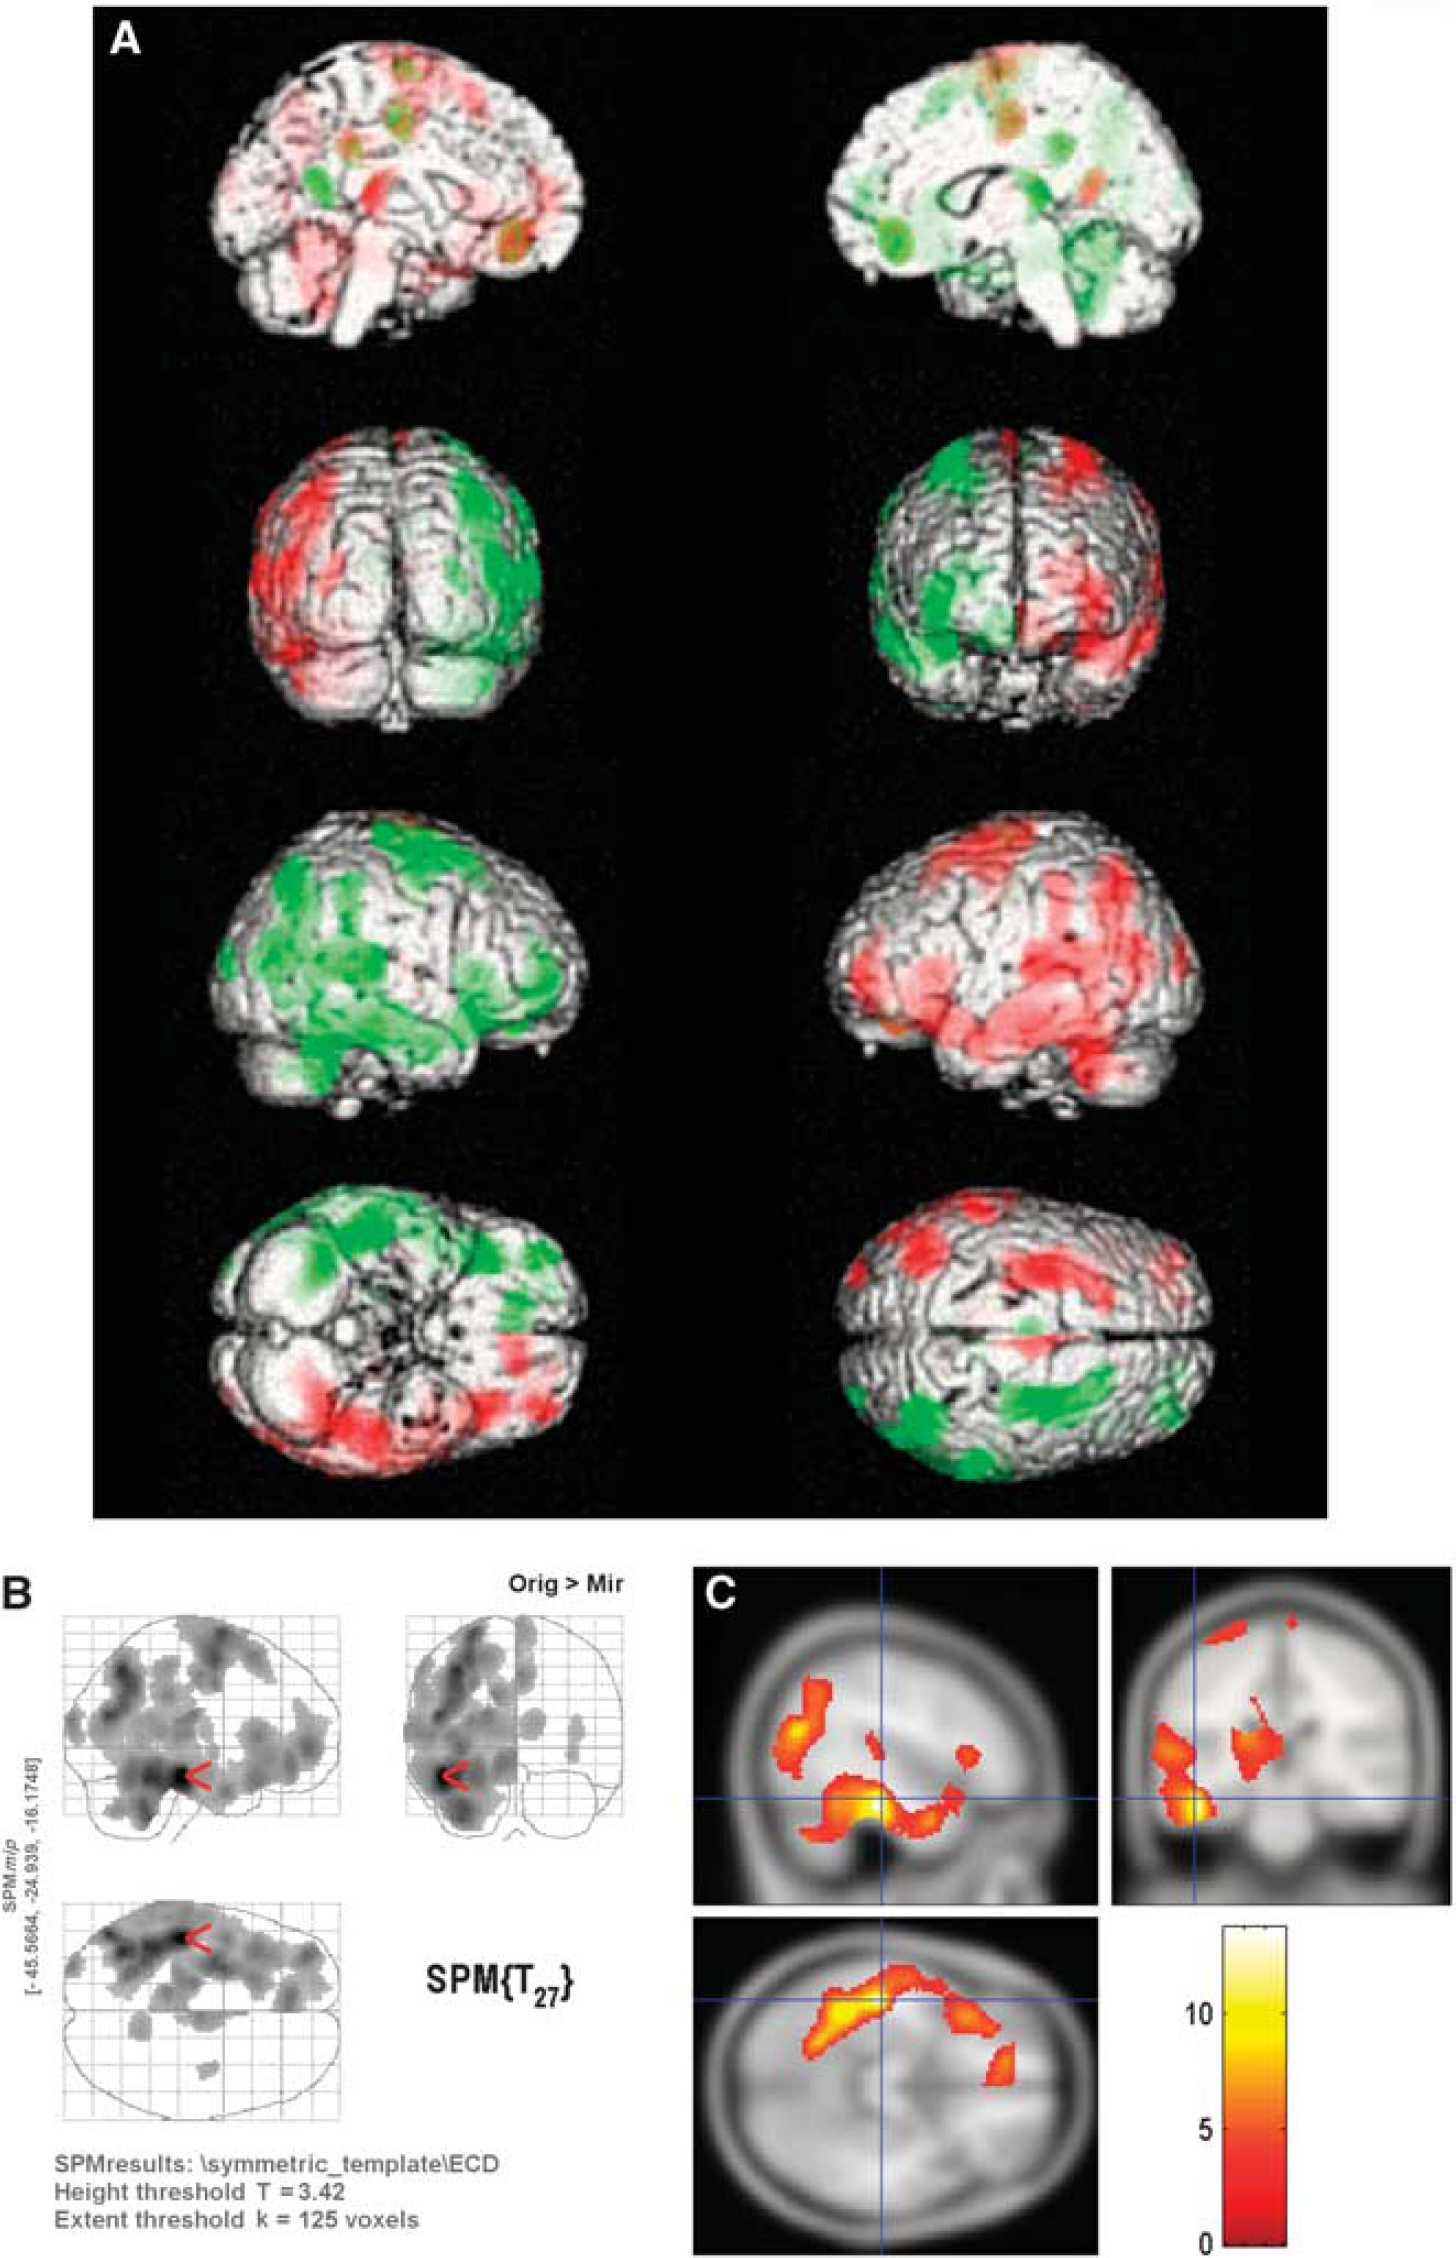
Results of SPM analysis of the original and mirrored images from the 30 normal subjects injected with Tc-99m ECD are shown in Figure 1. In widespread areas of the cerebral hemispheres the tracer uptake was lower on the right side compared with the left, with the most marked areas of asymmetric SPECT signal in the frontal lobes, and parietotemporal region near the vertex. Analysis of the 14 normal Tc-99m HMPAO SPECT images shows a similar pattern of asymmetry (Figure 2).
Lateral comparison performed in statistical parametric mapping (SPM) using a paired t-test between the original and mirrored normal ethyl cysteinate diethylester single-photon emission computed tomography (SPECT) images at a significance level of P < 0.001 shown (
Lateral paired t-test result for the 14 hexamethyl propylene amine oxime normal single-photon emission computed tomography (SPECT). Analysis was performed at a significance level of P < 0.001 with a cluster-level threshold of 125, and are shown (
Region of Interest Results
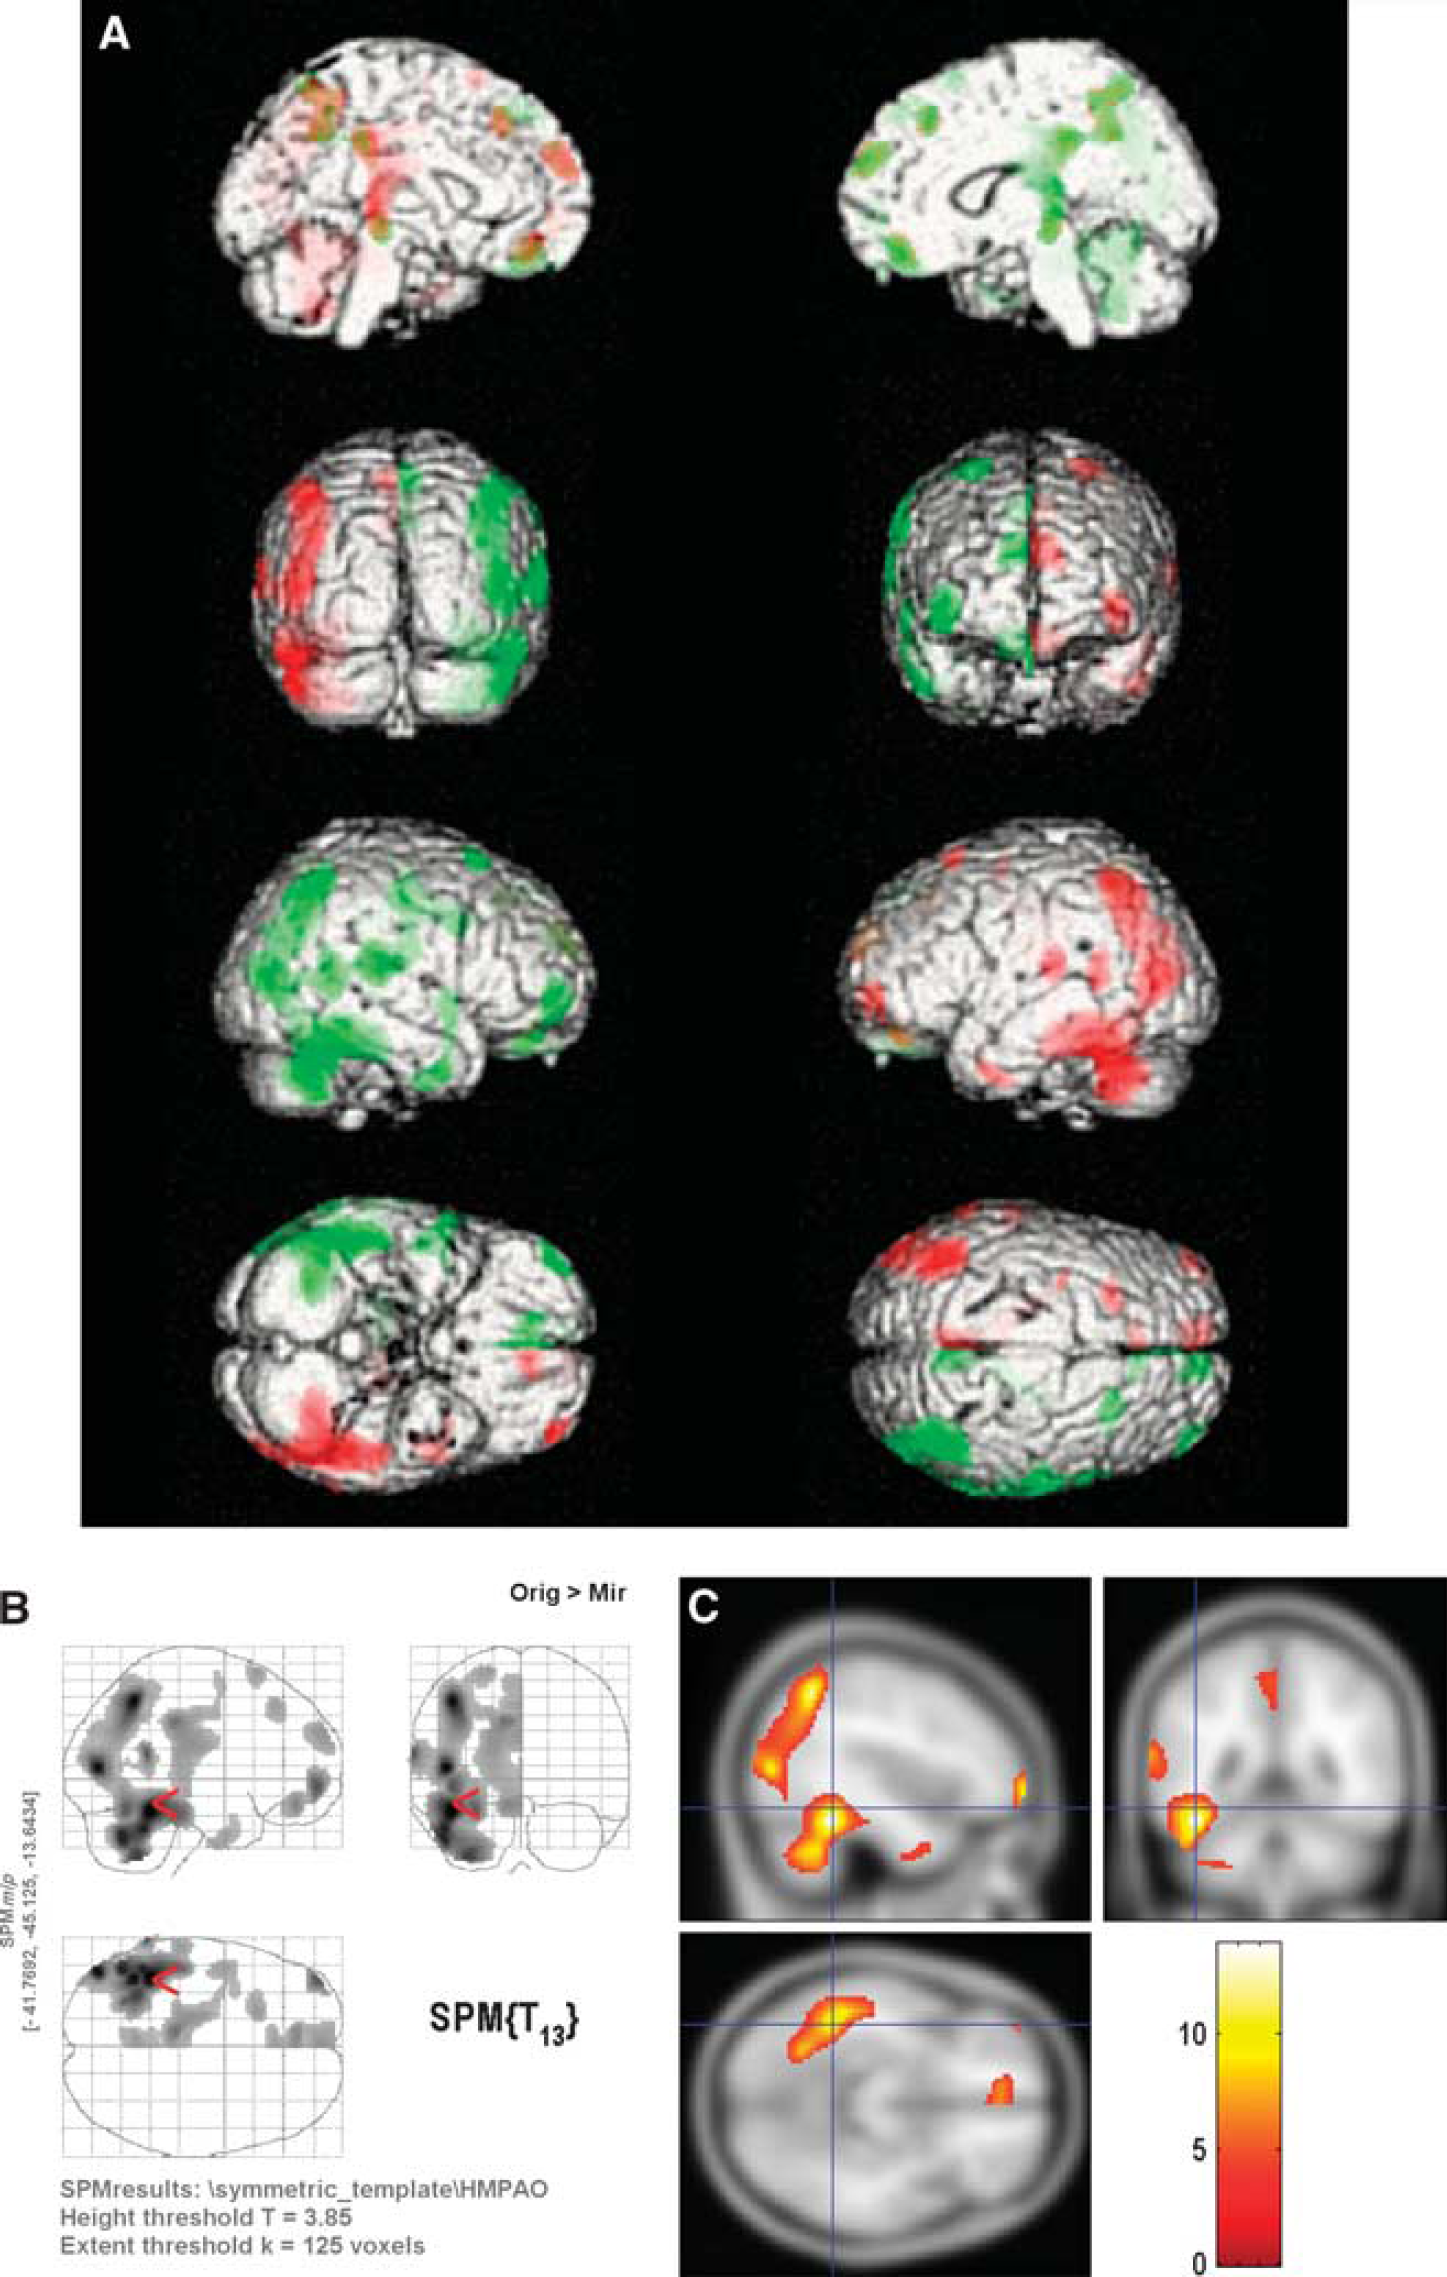
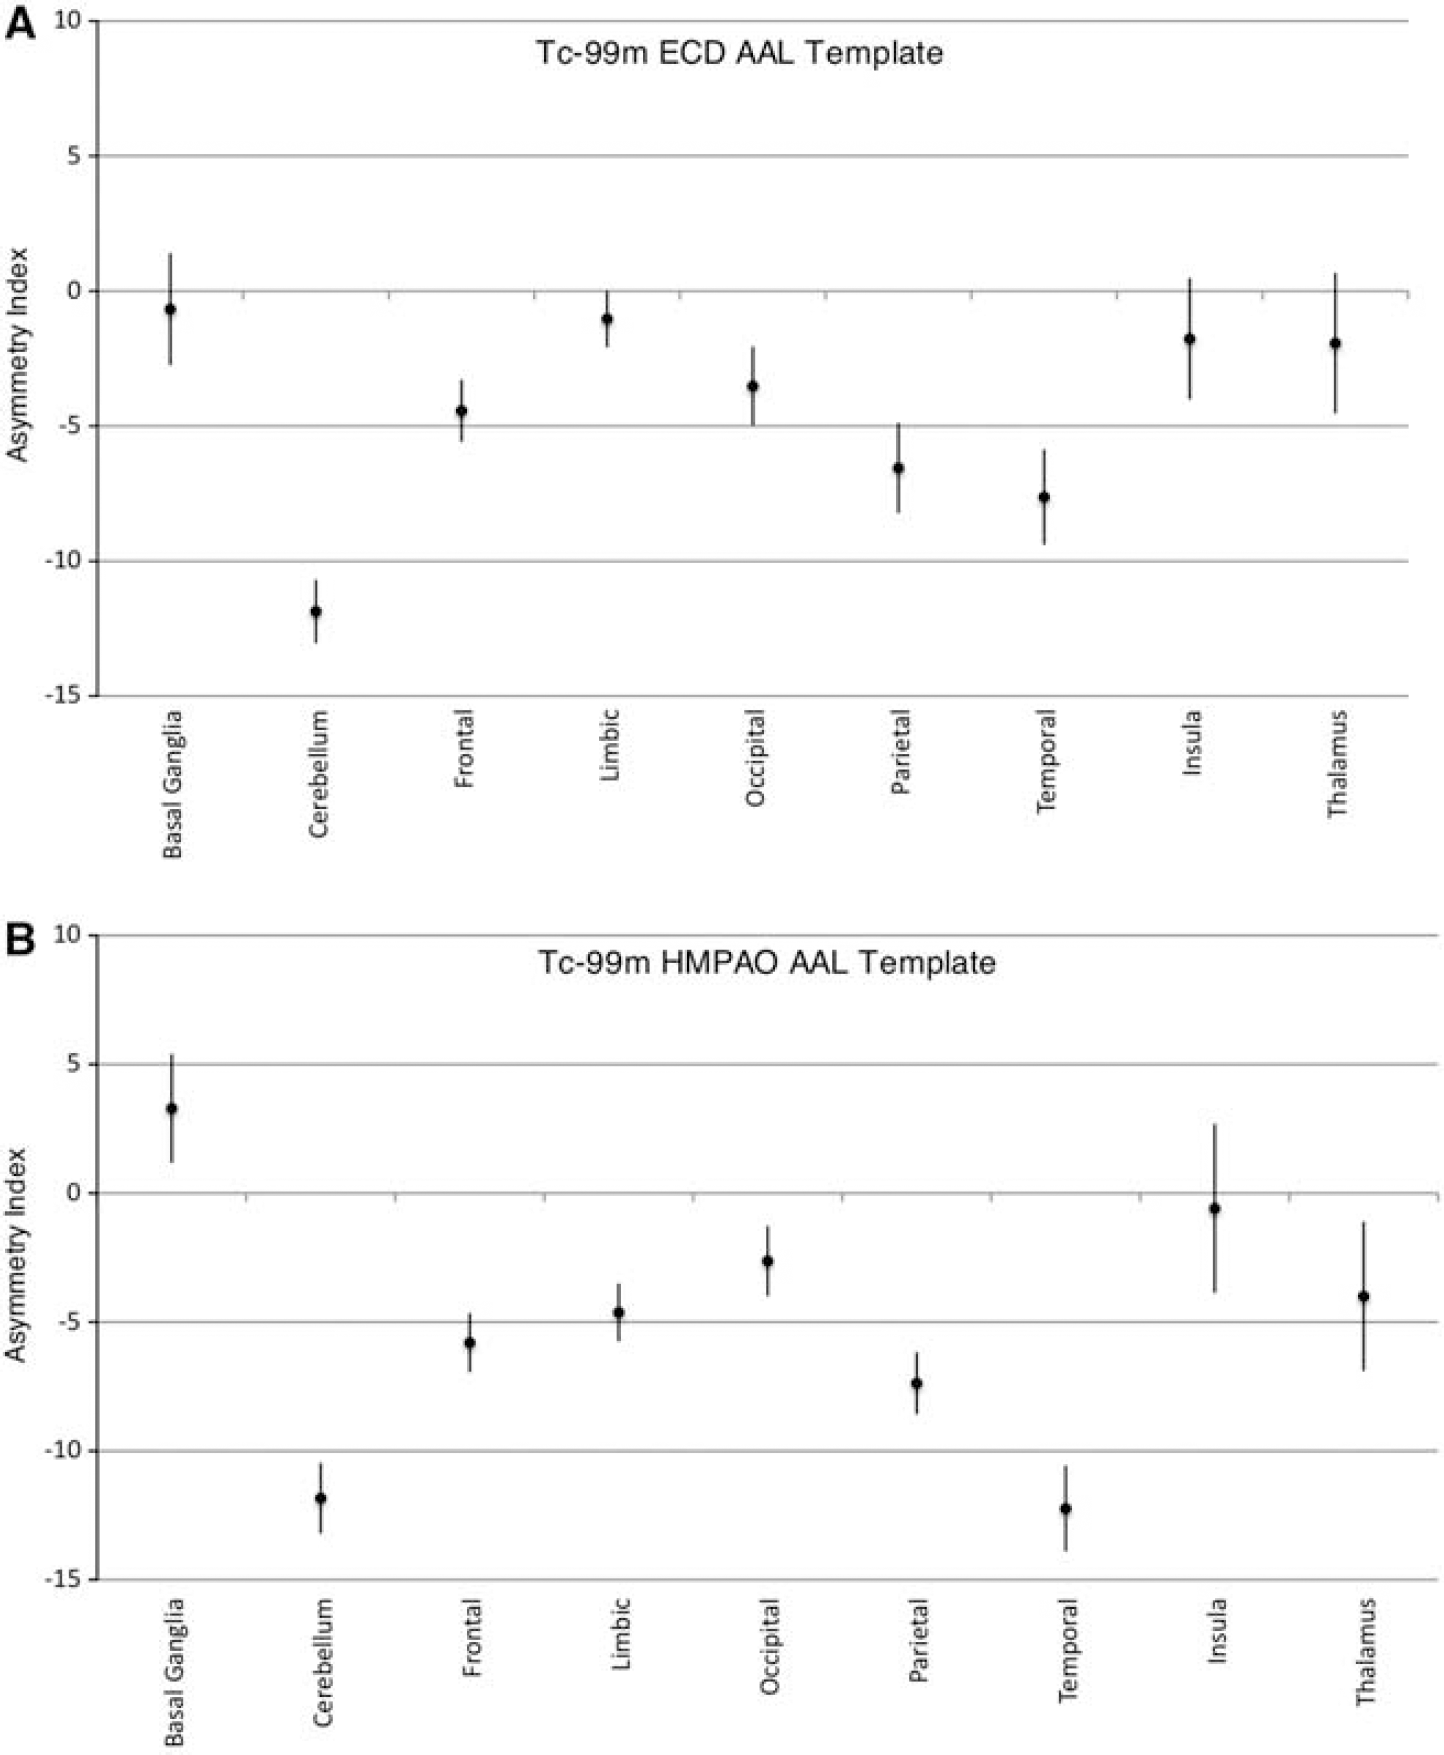
Region of interest results for the left-right comparison are shown in Table 1. The mean (± s.d.) asymmetry index overall for the Tc-99m ECD group was −2.689% (2.227) for the temporal lobes (significant with P = 2.992 × 10⁻⁷, one-sample t-test) and −1.362% (0.9365) for the left and right hemisphere comparison (significant with P = 8.735 × 10⁻⁹). The mean (± s.d.) asymmetry index for the temporal lobes for males was −2.085% (2.011) compared with −3.294% (2.332) for females, which was not statistically significant (two-sample student's t-test). The mean (± s.d.) asymmetry index for the left-right hemisphere comparison was −1.373% (0.789) for males compared with −1.351% (1.092) for females (not statistically significant, two-sample t-test). The mean (± s.d.) asymmetry index for right-handed subjects was −1.221% (0.652) and −0.294% (0.359) for left-handed subjects (not statistically significant, two-sample t-test). Asymmetry index values for regions defined in the anatomical automatic labeling template are plotted in Figures 3A and 3B for the 30 Tc-99m ECD normals and the 14 Tc-99m HMPAO normals, respectively. Asymmetry index values from aggregated regions (lobes) in the anatomical automatic labeling template for the ECD and HMPAO groups are shown in Figures 4A and 4B, respectively. Note that in contrast to the results presented in Table 1, these measurements do not include white matter areas, and the hippocampal and parahippocampal regions were grouped with the limbic aggregation.
There is significant heterogenity in the laterality of the single-photon emission computed tomography (SPECT) signal at the spatial scale generated by the automated anatomical labeling (AAL) template. (
(
Asymmetry index values from ROI-measured pixel counts normalized to mean cerebral counts for the 30 normal volunteer Tc-99m ECD scans and the 14 normal volunteer Tc-99m HMPAO scans
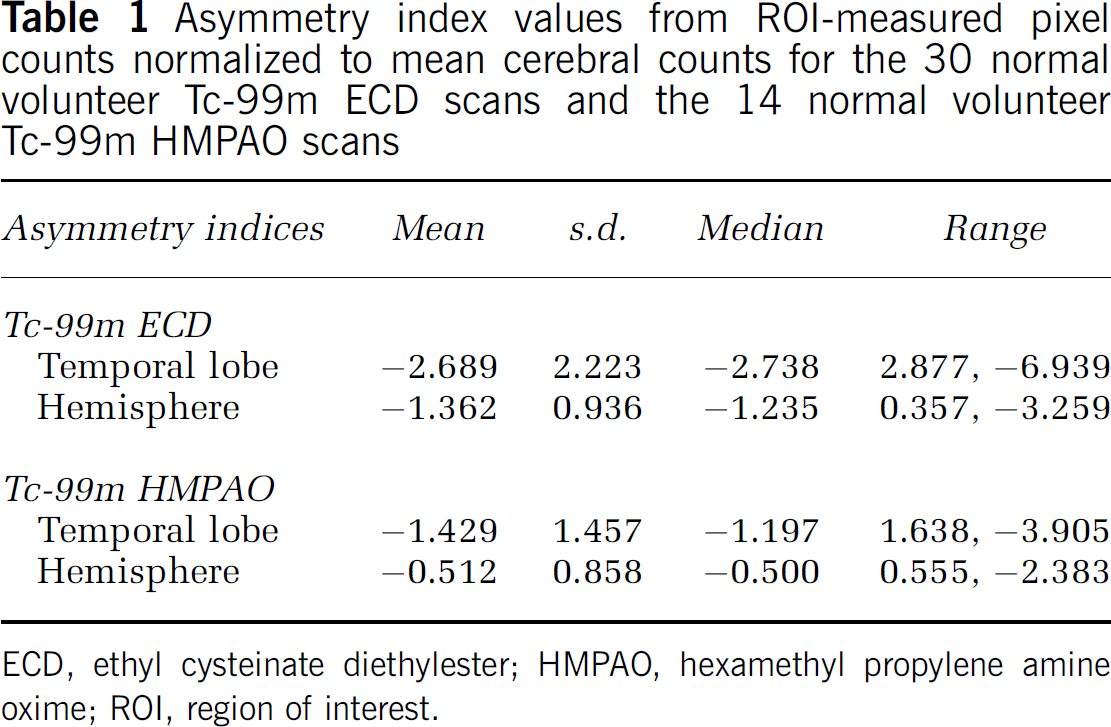
ECD, ethyl cysteinate diethylester; HMPAO, hexamethyl propylene amine oxime; ROI, region of interest.
Linear regression analysis of age effects on the asymmetry index for the temporal lobe and interhemispheric comparisons are plotted in Figure 5. Neither the regression for the temporal lobe nor the hemisphere asymmetry achieved statistical significance. Temporal lobe R2 = 0.0279, cerebral hemispheres R2 = 0.0109.
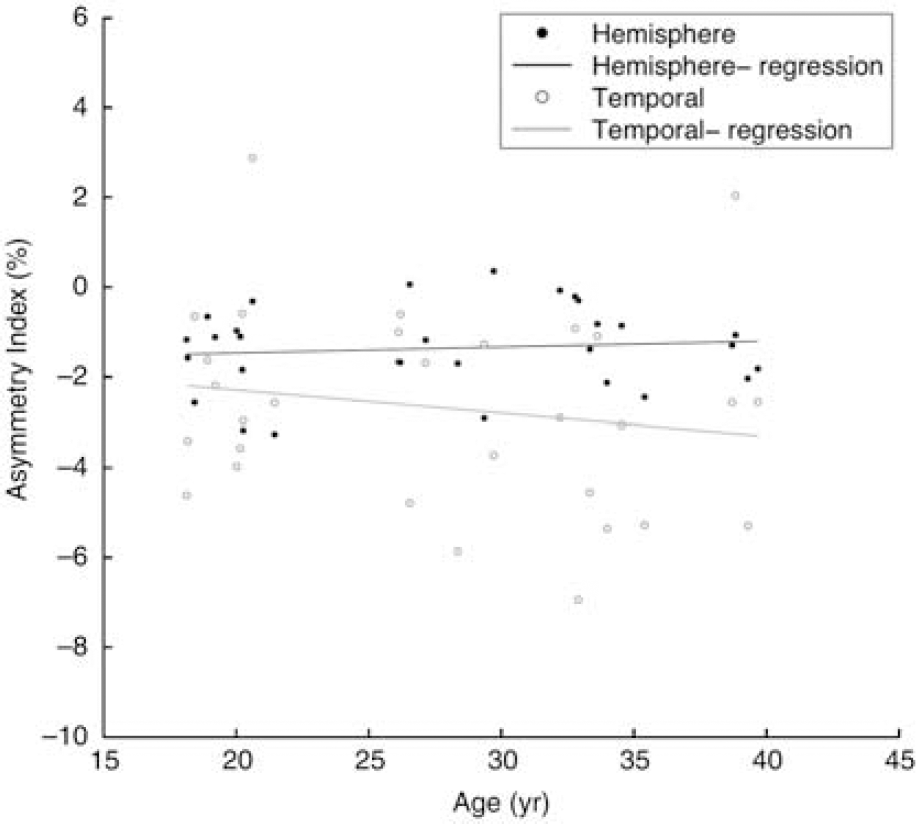
Regression analysis of age effects on temporal and hemispheric perfusion asymmetry for the Tc-99m ethyl cystei-nate diethylester normals.
Similar findings were obtained for the ROI analysis of the Tc-99m HMPAO SPECT image group, with the overall mean (± s.d.) asymmetry index for the temporal lobes being −1.429% (1.457) (significant with P =0.00283, one-sample t-test) and for the interhemispheric comparison −0.512% (0.858; significant with P = 0.0438, one-sample t-test).
Discussion
The results of this study show that there are significant regional asymmetries between the cerebral hemispheres in SPECT images of neurologically normal volunteers at rest. The similarities in the pattern of asymmetry between the Tc-99m ECD and Tc-99m HMPAO groups suggest that the observed laterality in SPECT tracer uptake reflects differences in anatomy or physiology between the brain hemispheres rather than particular factors related to retention of the individual tracers. To provide an objective measure of the similarities between the laterality of the two tracers, cluster locations were measured at peak intensity in the SPM-2 brain atlas, coordinates were transformed from MNI space to the Talairach coordinate system using a standard nonlinear transformation (Brent, 2002), and Brodmann areas were identified using the Talairach Applet (Lancaster et al, 2000). Numerous clusters for the two tracers mapped to identical or adjacent Brodmann areas, including the frontoparietal border (Brodmann area 6), the prefrontal cortex (Brodmann area 10), the inferoposterior temporal lobe (Brodmann 20 for ECD, 37 for HMPAO), and parietal cortex (Brodmann 42 for ECD, and 40 for HMPAO).
Prior studies that have analyzed laterality in Tc-99m HMPAO and ECD SPECT brain images have found significant lateral variation in tracer uptake. Many prior studies have shown greater SPECT signal on the right side than on the left, though with a large degree of regional variation between studies. Catafau et al (1996) showed a mixed left-right pattern of asymmetry in a cohort of control subjects of similar age to our ECD group, and a stronger rightward pattern in a much older cohort, suggesting that SPECT laterality becomes progressively rightward with increasing subject age. Other prior reports of rightward laterality with HMPAO or ECD SPECT tracers used subjects significantly older than (Baird et al, 1999; Lobaugh et al, 2000), or spanning a larger age range (Van Laere et al, 2001; Markus et al, 1993; Grova et al, 2003) than our cohort. Krausz et al (1998) showed a mixed pattern of laterality in a group of subjects spanning a wide range of ages. A number of these prior studies relied upon manual ROI placement, which is prone to operator variability, and offers too limited a sampling to reconstruct a comprehensive picture of tracer asymmetry. Although one study (Van Laere et al, 2001) used SPM to analyze changes in uptake pattern with age, no prior study to our knowledge has used SPM to directly examine lateral SPECT asymmetry. In addition, this is the first study to our knowledge to examine lateral asymmetry in SPECT scans reconstructed without ramp-filtered back projection (the Tc-99m ECD group was reconstructed with ordered subset expectation maximization). The present study did not find a significant dependence of asymmetry with hand preference, which has been observed in prior anatomical studies (Steinmetz et al, 1991). However, the limited availability of left-handed subjects in our cohort limited the statistical power for this analysis, and future studies with additional left-handed subjects might show such an effect. Factors such as the presence of ambient noise, ambient light, verbal instructions by the technician, the choice of tracer injection site and side, and whether the subject's eyes were open or closed could potentially affect the baseline pattern of tracer uptake, and these factors should be tightly controlled in the experimental setup, as well as in clinical practice.
This study has shown a pattern of asymmetric cerebral uptake of Tc-99m HMPAO and Tc-99m ECD SPECT in two groups of neurologically normal adults, with greater SPECT signal on the left than on the right. This asymmetry was identified via semiautomated and automated region-based analyses, as well as voxel-based SPM analysis, and was observed in SPECT scans of normal subjects from two different imaging centers with two different tracers. Lateral SPECT differences have an important role in diagnosis of epilepsy, stroke, and neurodegenerative disorders, and the results of this study indicate that these clinical SPECT image interpretations should be made using an appropriate baseline taking into account the normal pattern of hemispheric asymmetry.
Footnotes
Acknowledgements
We are grateful for the technical assistance of Royce Ruter, Cindy Nelson, and Karla Crockett.
The authors declare no conflict of interest.