
Abstract
The blood–brain barrier (BBB) is a multicellular vascular structure separating blood from the brain parenchyma that is composed of endothelial cells with tight intercellular junctions, surrounded by a basal lamina, astrocytes, and pericytes. Previous studies have generated detailed databases of the microvessel transcriptome; however, less information is available on the BBB at the protein level. In this study, we specifically focused on characterization of the membrane fraction of cells within the BBB to generate a more complete understanding of membrane transporters, tight junction proteins, and associated extracellular matrix proteins that are functional hallmarks of the BBB. We used Multidimensional Protein Identification Technology to identify a total of 1,143 proteins in mouse brain microvessels, of which 53% were determined to be membrane associated. Analyses of specific classes of BBB-associated proteins in the context of recent transcriptome reports provide a unique database to assess the relative contribution of genes at the level of both RNA and protein in the maintenance of normal BBB integrity.
Introduction
The blood–brain barrier (BBB) is a multicellular structure that primarily consists of endothelial cells and astrocyte endfeet separated by a basal lamina (Abbott et al, 2006). The hallmark of this multicellular structure, based on anatomic and physiologic studies, is the neurovascular unit in which multiple cell types (i.e., astrocytes, pericytes, and neurons) have been identified in association with the vascular endothelium depending on the location within the brain (Abbott et al, 2006; Enerson and Drewes, 2006; Wolburg et al, 2009). The function of these specialized endothelial-associated cells, their secreted proteins, the tight interendothelial barrier itself, the unique transcellular transport, and active efflux pumps combine to yield a unique vascular barrier (Agarwal et al, 2009; Daneman et al, 2010; Enerson and Drewes, 2006). Breakdown of the BBB is associated with many different pathologies of the brain, including stroke and brain tumor invasion, leading to changes in the expression of intracellular and extracellular proteins that mediate integrity (Pottiez et al, 2009a). This study focuses on the identification of BBB protein components, especially membrane and extracellular components, at the protein level from freshly isolated microvessels. This procedure eliminates potential fixation, cell culture, and cell suspension artifacts, thus obtaining the most complete resource of BBB-associated proteins to date.
Previous studies have examined the gene and protein expression profiles of cultured brain endothelial cells, which have yielded important expression profile data cataloging gene families using
On the basis of our interest in developing a resource identifying ECM components and BBB membrane proteins that contribute to ECM interactions, we focused on a membrane-enrichment strategy for mass spectrometry-based protein profiling. Historically, BBB protein analyses have relied on various gel electrophoretic-based techniques for protein separation, followed by antibody or mass spectrometry for protein identification. However, protein separation is limited because of the insolubility of membrane/ECM proteins and gel electrophoretic resolution. The use of Multidimensional Protein Identification Technology (MudPIT) enables the discrete identification of a large number of proteins from complex protein mixtures obtained from freshly isolated tissues and does not require fixed/frozen samples or single cell suspension-based isolation techniques, i.e., flow cytometry or magnetic beads (Aebersold and Mann, 2003; Pottiez et al, 2009a; Washburn et al, 2001; Wu et al, 2003). Moreover, a recent study has used mass spectrometry with the addition of isotope-labeled peptide standards to provide quantitation for known proteins (Uchida et al, 2011).
In our study, freshly isolated normal mouse brain microvessels were disrupted, membranes fractionated, which then underwent proteolysis, and was followed by protein profiling using MudPIT. We have performed multiple MudPIT runs to maximize coverage of membrane proteins of low and high abundance and to establish standards for technical replicates within the same samples and between different tissue collections. Identified proteins were assigned to various BBB classes, based on classical markers for specific cell types, as well as recent proteomic and transcriptome studies (Daneman et al, 2010; Enerson and Drewes, 2006). Our strategy enabled the identification and classification of BBB membrane transporters, tight junction proteins, integrins, ECM proteins, and proteoglycans. We discuss the classes of proteins identified and their relative abundance for the purpose of providing new information on membrane protein constituents of the normal BBB.
Materials and methods
Mouse Brain Microvessel Isolation
Mouse brain microvessels were isolated using a modified protocol based on previously published studies (Hartz et al, 2006; Yousif et al, 2007). All animal studies were IACUC (Institutional Animal Care and Use Committee) approved by the University of California San Diego and The Scripps Research Institute. For each preparation, mice (
Endothelial Cell Lysis
At 4°C, ∼40
Endothelial Cell Lysate Fractionation and Protein Digest
At 4°C, the lysate was placed in a microfuge tube and spun at 750 ×
Multidimensional Liquid Chromatography: Mass Spectrometry (Multidimensional Protein Identification Technology)
Samples in 1.5 mL microfuge tubes were diluted 1:2 with 5% acetonitrile 0.1% formic acid (buffer A), centrifuged at 13,000 ×
Bioinformatic Analyses
Spectra were searched using SEQUEST, and filtered using DTASelect2 (http://fields.scripps.edu). Spectral count data were then processed using PatternLab for Proteomics (Carvalho et al, 2008). The spectral count information stored in the DTAselect-filter.txt files was extracted using the Perl script dtarray2.pl (Kaschani et al, 2009). The resulting dtarray2.txt file was loaded into Excel (Microsoft Corp., Redmond, WA, USA) and further ordered. This arrangement is the source for the master list of protein identifications in Supplementary Table 1. Information for IPI is located at http://www.ebi.ac.uk/IPI/IPIhelp.html. Information on Uniprot Knowledgebase is located at http://www.uniprot.org/help/uniprotkb. For SEQUEST searches followed by DTASelect2 processing, the following criteria were used: (1) a 1% false positive discovery rate; (2) a minimum of two unique tryptic peptides per identification were required; (3) oxidation of methionine (+16Da) was allowed as a differential modification; and (4) cysteines were required to be carbamidomethylated (+57 Da).
Statistical validation was performed for every protein hit using statistical functions and parameters set within the SEQUEST search as we have previously described in detail (Tabb et al, 2002). Additional information on the use of DTASelect2 is available at http://www.scripps.edu/chemphys/cravatt/protomap/dtaselect_instructions.html, along with additional information on data analysis of shotgun proteomics (Cociorva et al, 2006).
Results
Microvessel Isolation and Validation
The cortices of normal mouse brains were dissected, tissues pooled, and subjected to a multistep isolation protocol (see overview in Figure 1A) that has been previously described and used for transcriptome analysis, BBB transporter, and signaling studies (Enerson and Drewes, 2006; Hartz et al, 2006; Yousif et al, 2007). To verify the enrichment of brain microvessel material, we first examined the integrity of the microvessel lumens by staining the vasculature before harvest. Mice were subjected to an intravenous injection of the fluorescently labeled endothelial cell-binding lectin, Griffonia simplicifolia (Figure 1B). After harvest of labeled brains, and purification of the microvessels on a Ficoll gradient (termed ‘S1’ as described by Yousif
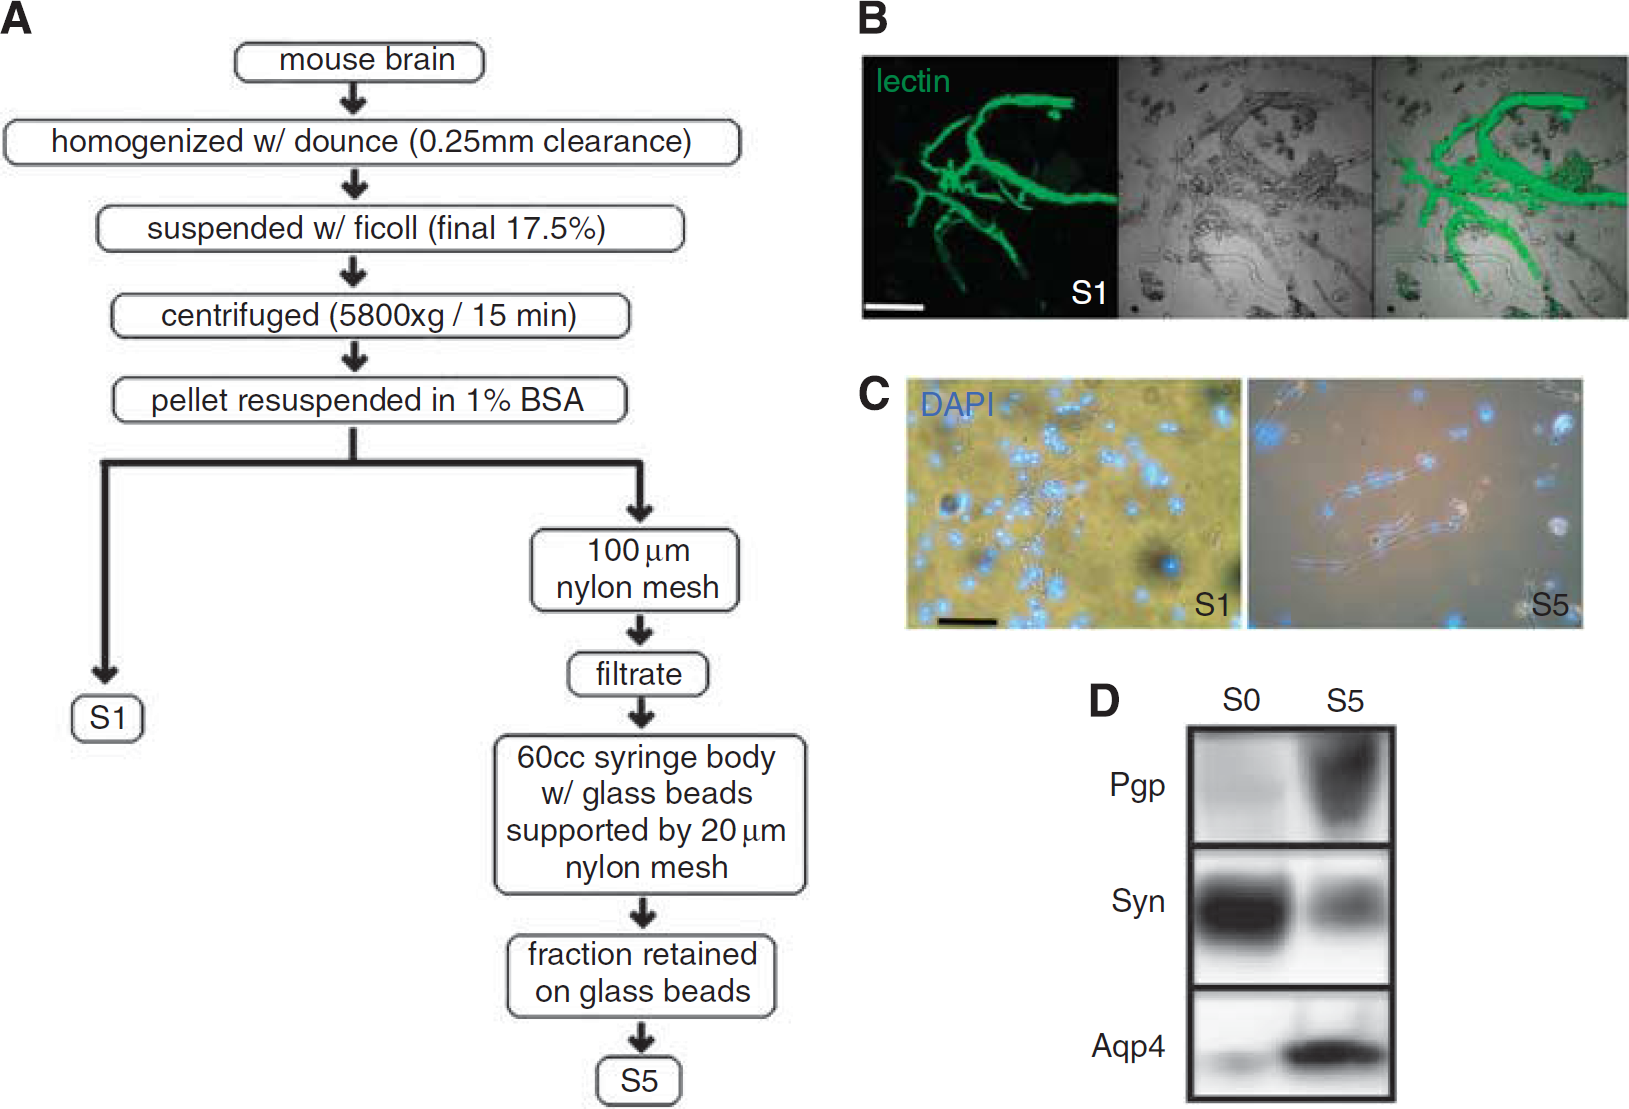
Scheme of brain microvessel enrichment. (
Proteomic Profile of Brain Microvessel Membranes
Enriched S5 fraction microvessels were subjected to nitrogen cavitation lysis, membrane isolation, tryptic digestion, and prepared for mass spectrometry analysis as described in the ‘Materials and methods’ section. Digested proteins were separated by liquid chromatography using microcapillary columns followed in-line by tandem mass spectrometry as described previously (i.e., MudPIT (Chen et al (2006)). Using the three distinct, S5 microvessel membrane fractionation samples, independent mass spectrometry runs enabled the identification of 1,645 microvessel proteins, which were operationally termed ‘BBB proteins’. The standards and settings used for data acquisition (Taylor et al, 2007) (i.e., MIAPE data) for these studies are found in Supplementary Table 1 along with a complete list of proteins and their spectral counts from all mass spectrometry runs.
Mass spectrometry is a sampling technique in which probability of detection is a function of protein abundance. By counting the numbers of spectra that map to identified proteins, spectral counting can be used as a surrogate for protein abundance (Liu et al, 2004). The criteria used for protein inclusion for the study was that proteins must be identified by MudPIT in three technical replicates (i.e., the same sample analyzed at three different times: 153-1, 153-2, and 153-3), which was considered as a single biologic sample, and then in an additional two biologic samples (118 and 153). Moreover, the average of the spectral counts from the three technical replicates and the two biologic samples must be 5 (Figure 2 and Supplementary Table 1). In some cases, proteins were found in technical replicates, but not in biologic replicates, as well as the converse (Supplementary Table 1). Each protein sample, 118, 153, and 155, was extracted from isolated, pooled microvessels obtained from different mice.
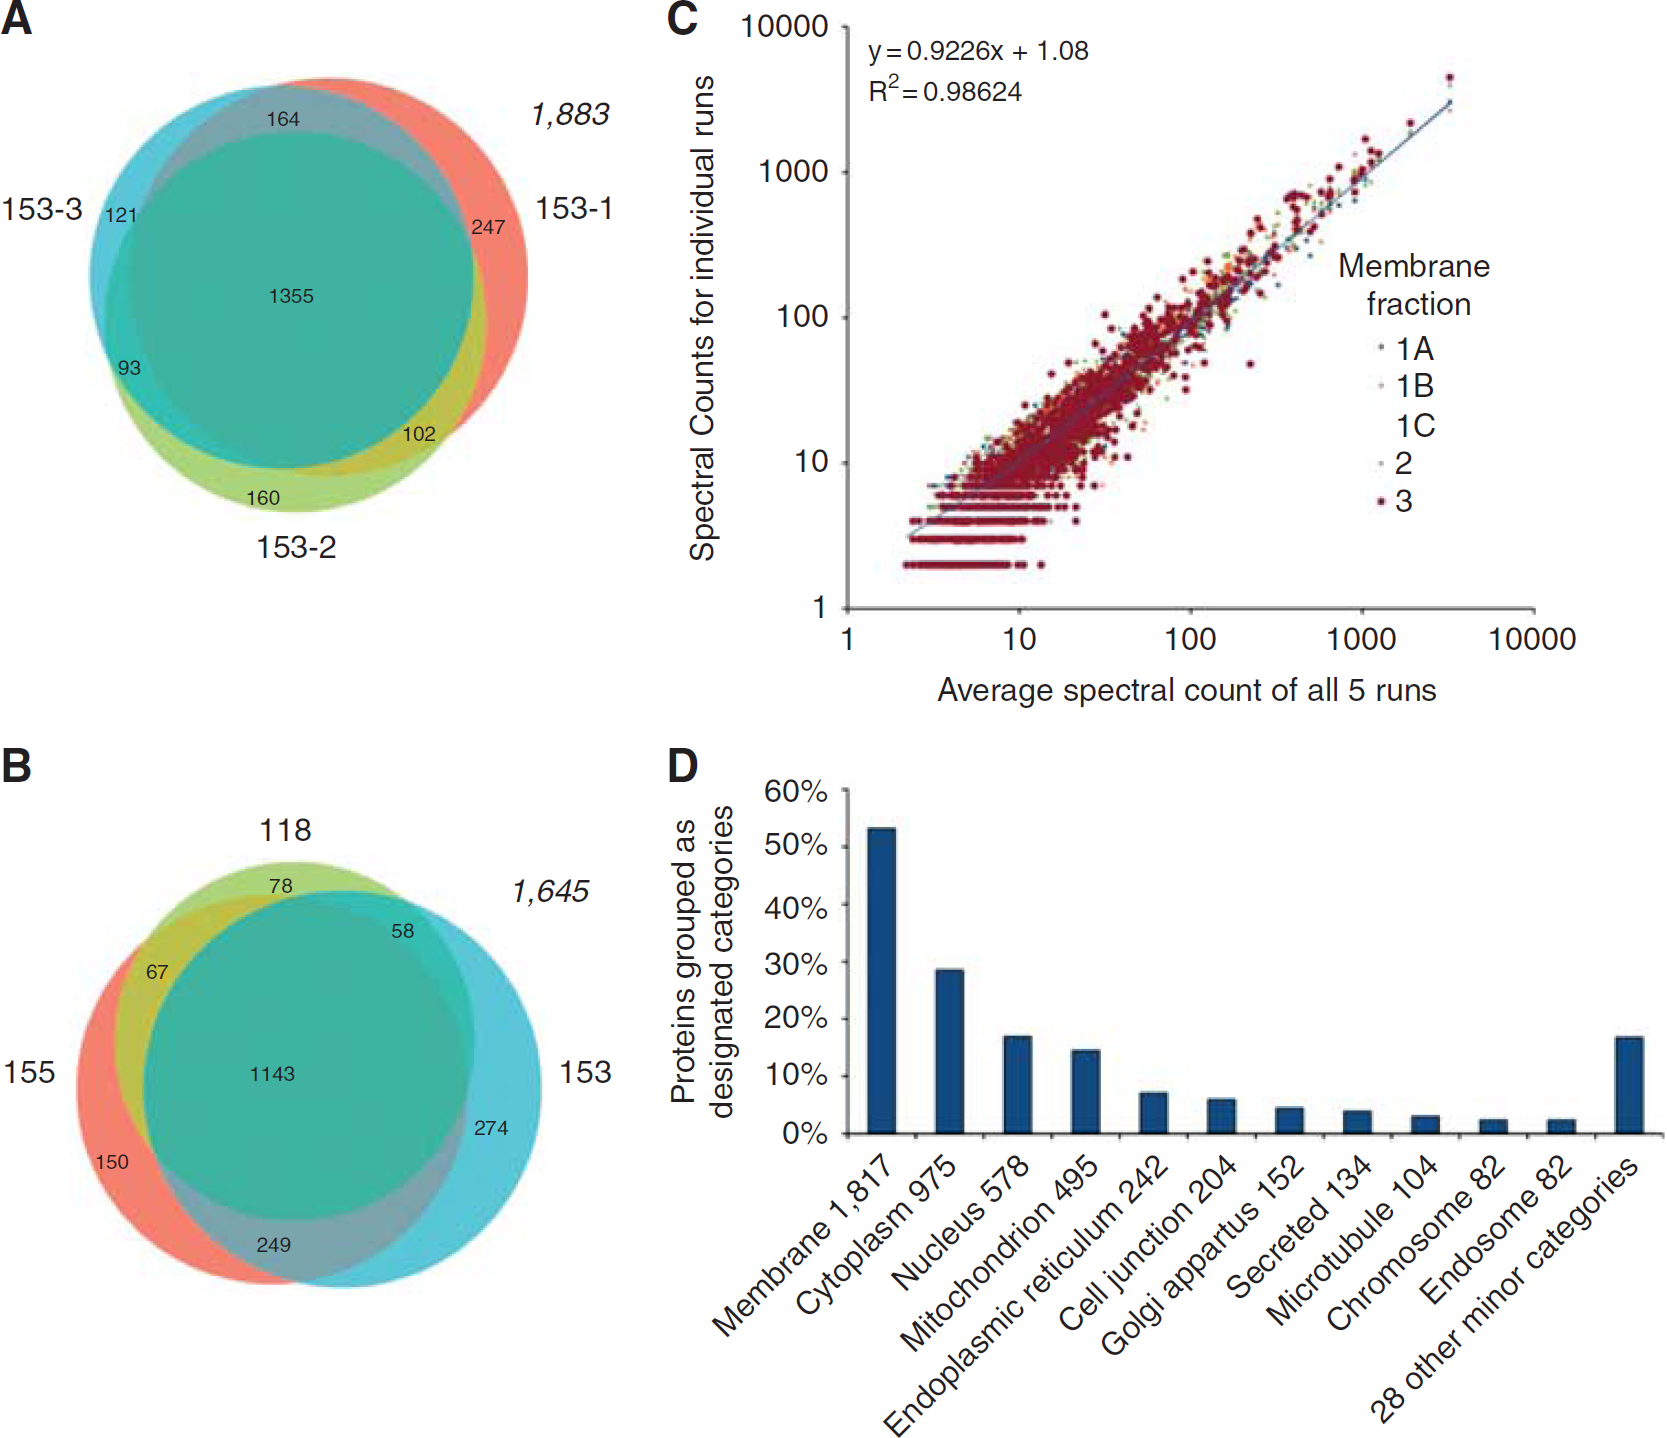
Information on proteins identified by MudPIT from technical or biologic replicates from the S5 microvessel fraction samples. (
To first determine the intrasample variation of proteins identified by MudPIT, three samples from the same S5 microvessel fraction preparation were analyzed (i.e., technical replicates), and then the distribution of the proteins identified was compared (Figure 2A). For technical replicates (i.e., 153-1, 153-2, and 153-3), we found 1,355 proteins (74% of all proteins identified) common to all three samples, with 247 proteins unique to replicate 153-1, 160 proteins unique to replicate 153-2, and 121 proteins unique to replicate 153-3 (Figure 2A). The distribution of proteins common to any two samples was found to be 102 proteins within 153-1 and 153-2, 93 proteins within 153-2 and 153-3, and 164 proteins within 153-1 and 153-3. Thus, a significant degree of protein overlap exists, 74%, between all replicates from the same starting microvessel preparation.
Next, we assessed the distribution of proteins identified among the three different S5 fraction microvessel samples, 118, 153 (proteins common to 153-1, 153-2, and 153-3), and 155, in which each sample was from pooled tissues of different mice, which we termed ‘biologic replicates’ (Figure 2B). A total of 1,143 proteins (69% of all proteins identified) were common to all three samples, whereas 78 proteins were unique to 118, 274 proteins were unique to 153, and 150 proteins were unique to 155. The distribution of proteins common to any two samples was found to be 67 proteins within 118 and 153-3, 249 proteins within 153-3 and 155, and 58 proteins within 155 and 118. As found with technical replicates, a significant portion of the proteins identified for biologic replicates, 69%, was common to all three samples and was only slightly less than that identified from technical replicates. Moreover, a scatter plot comparison of the proteins identified following the parallel analyses of replicate samples established a significant degree of overlap (Figure 2C).
Finally, Figure 2D, a summary of the bioinformatic analysis of BBB proteins identified from the three samples obtained from different groups of mice (Figure 2B) provides insights as to the number of membrane proteins recovered (53%), as well as mitochondrial (15%) and cell junction proteins (5%) recovered. A complete listing of all proteins identified is found in Supplementary Table 1 and the proteins are grouped in Tables 1, 2, 3 and 4 based on previously published reports and a classical understanding of their function.
Transporter and channel proteins
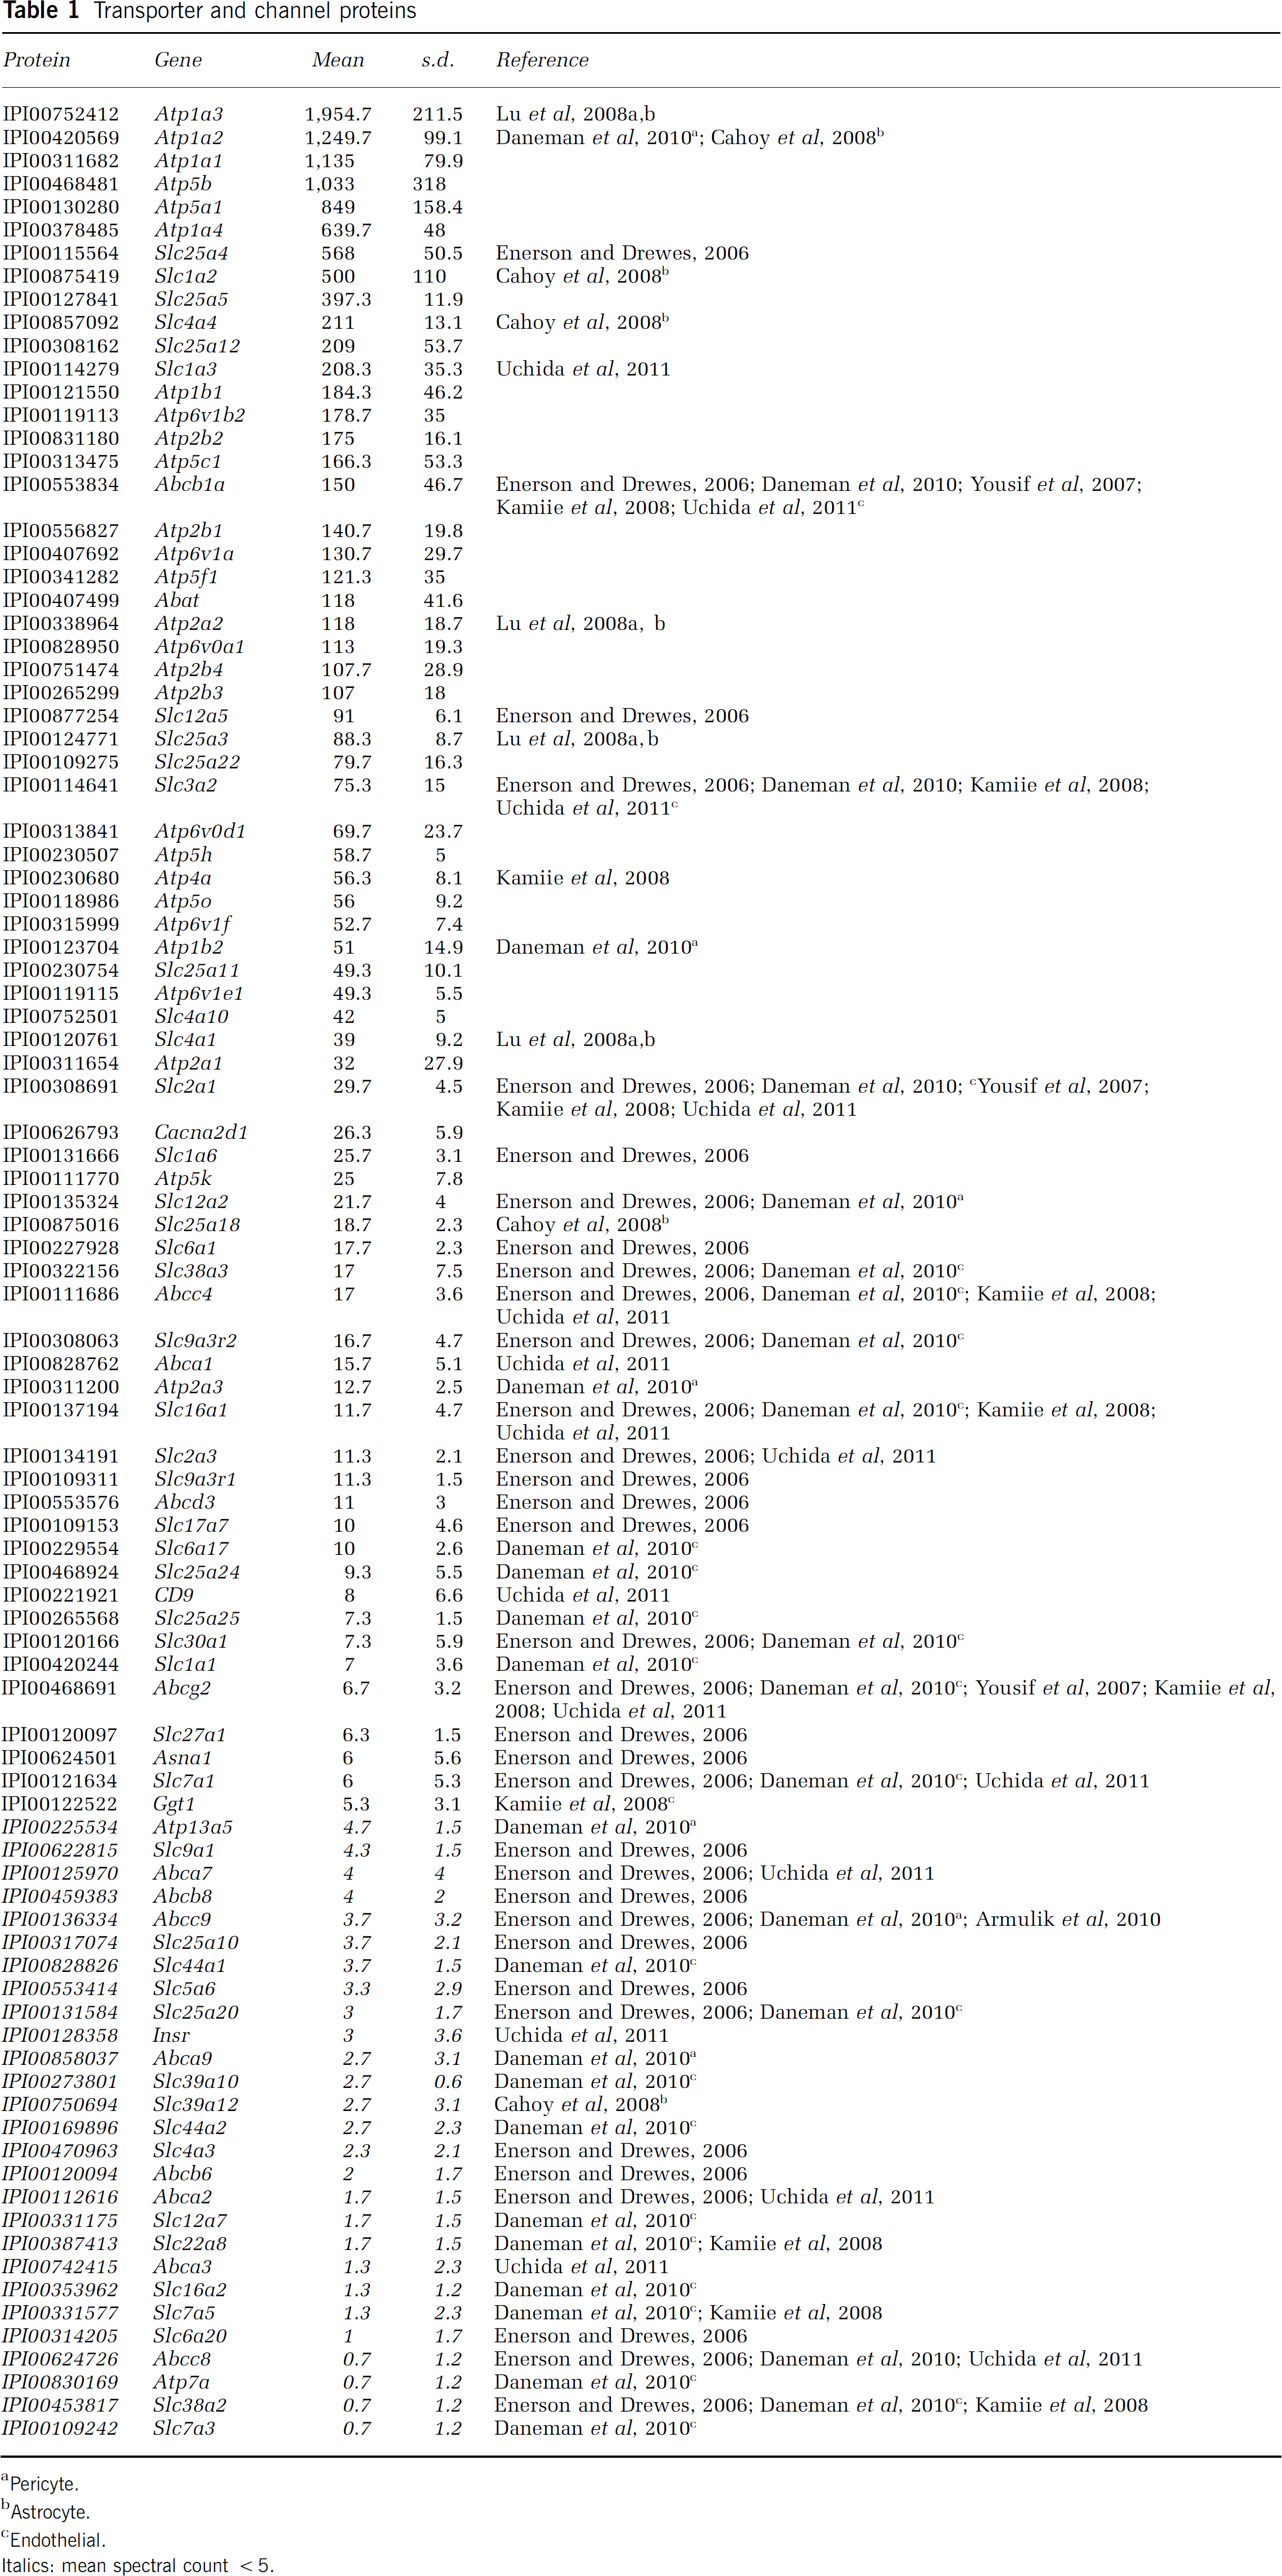
Pericyte.
Astrocyte.
Endothelial.
Italics: mean spectral count <5.
(A) Tight junction transmembrane and cytoplasmic adapter proteins and integrins, (B) tight junction cytoplasmic adapters, and (C) integrins
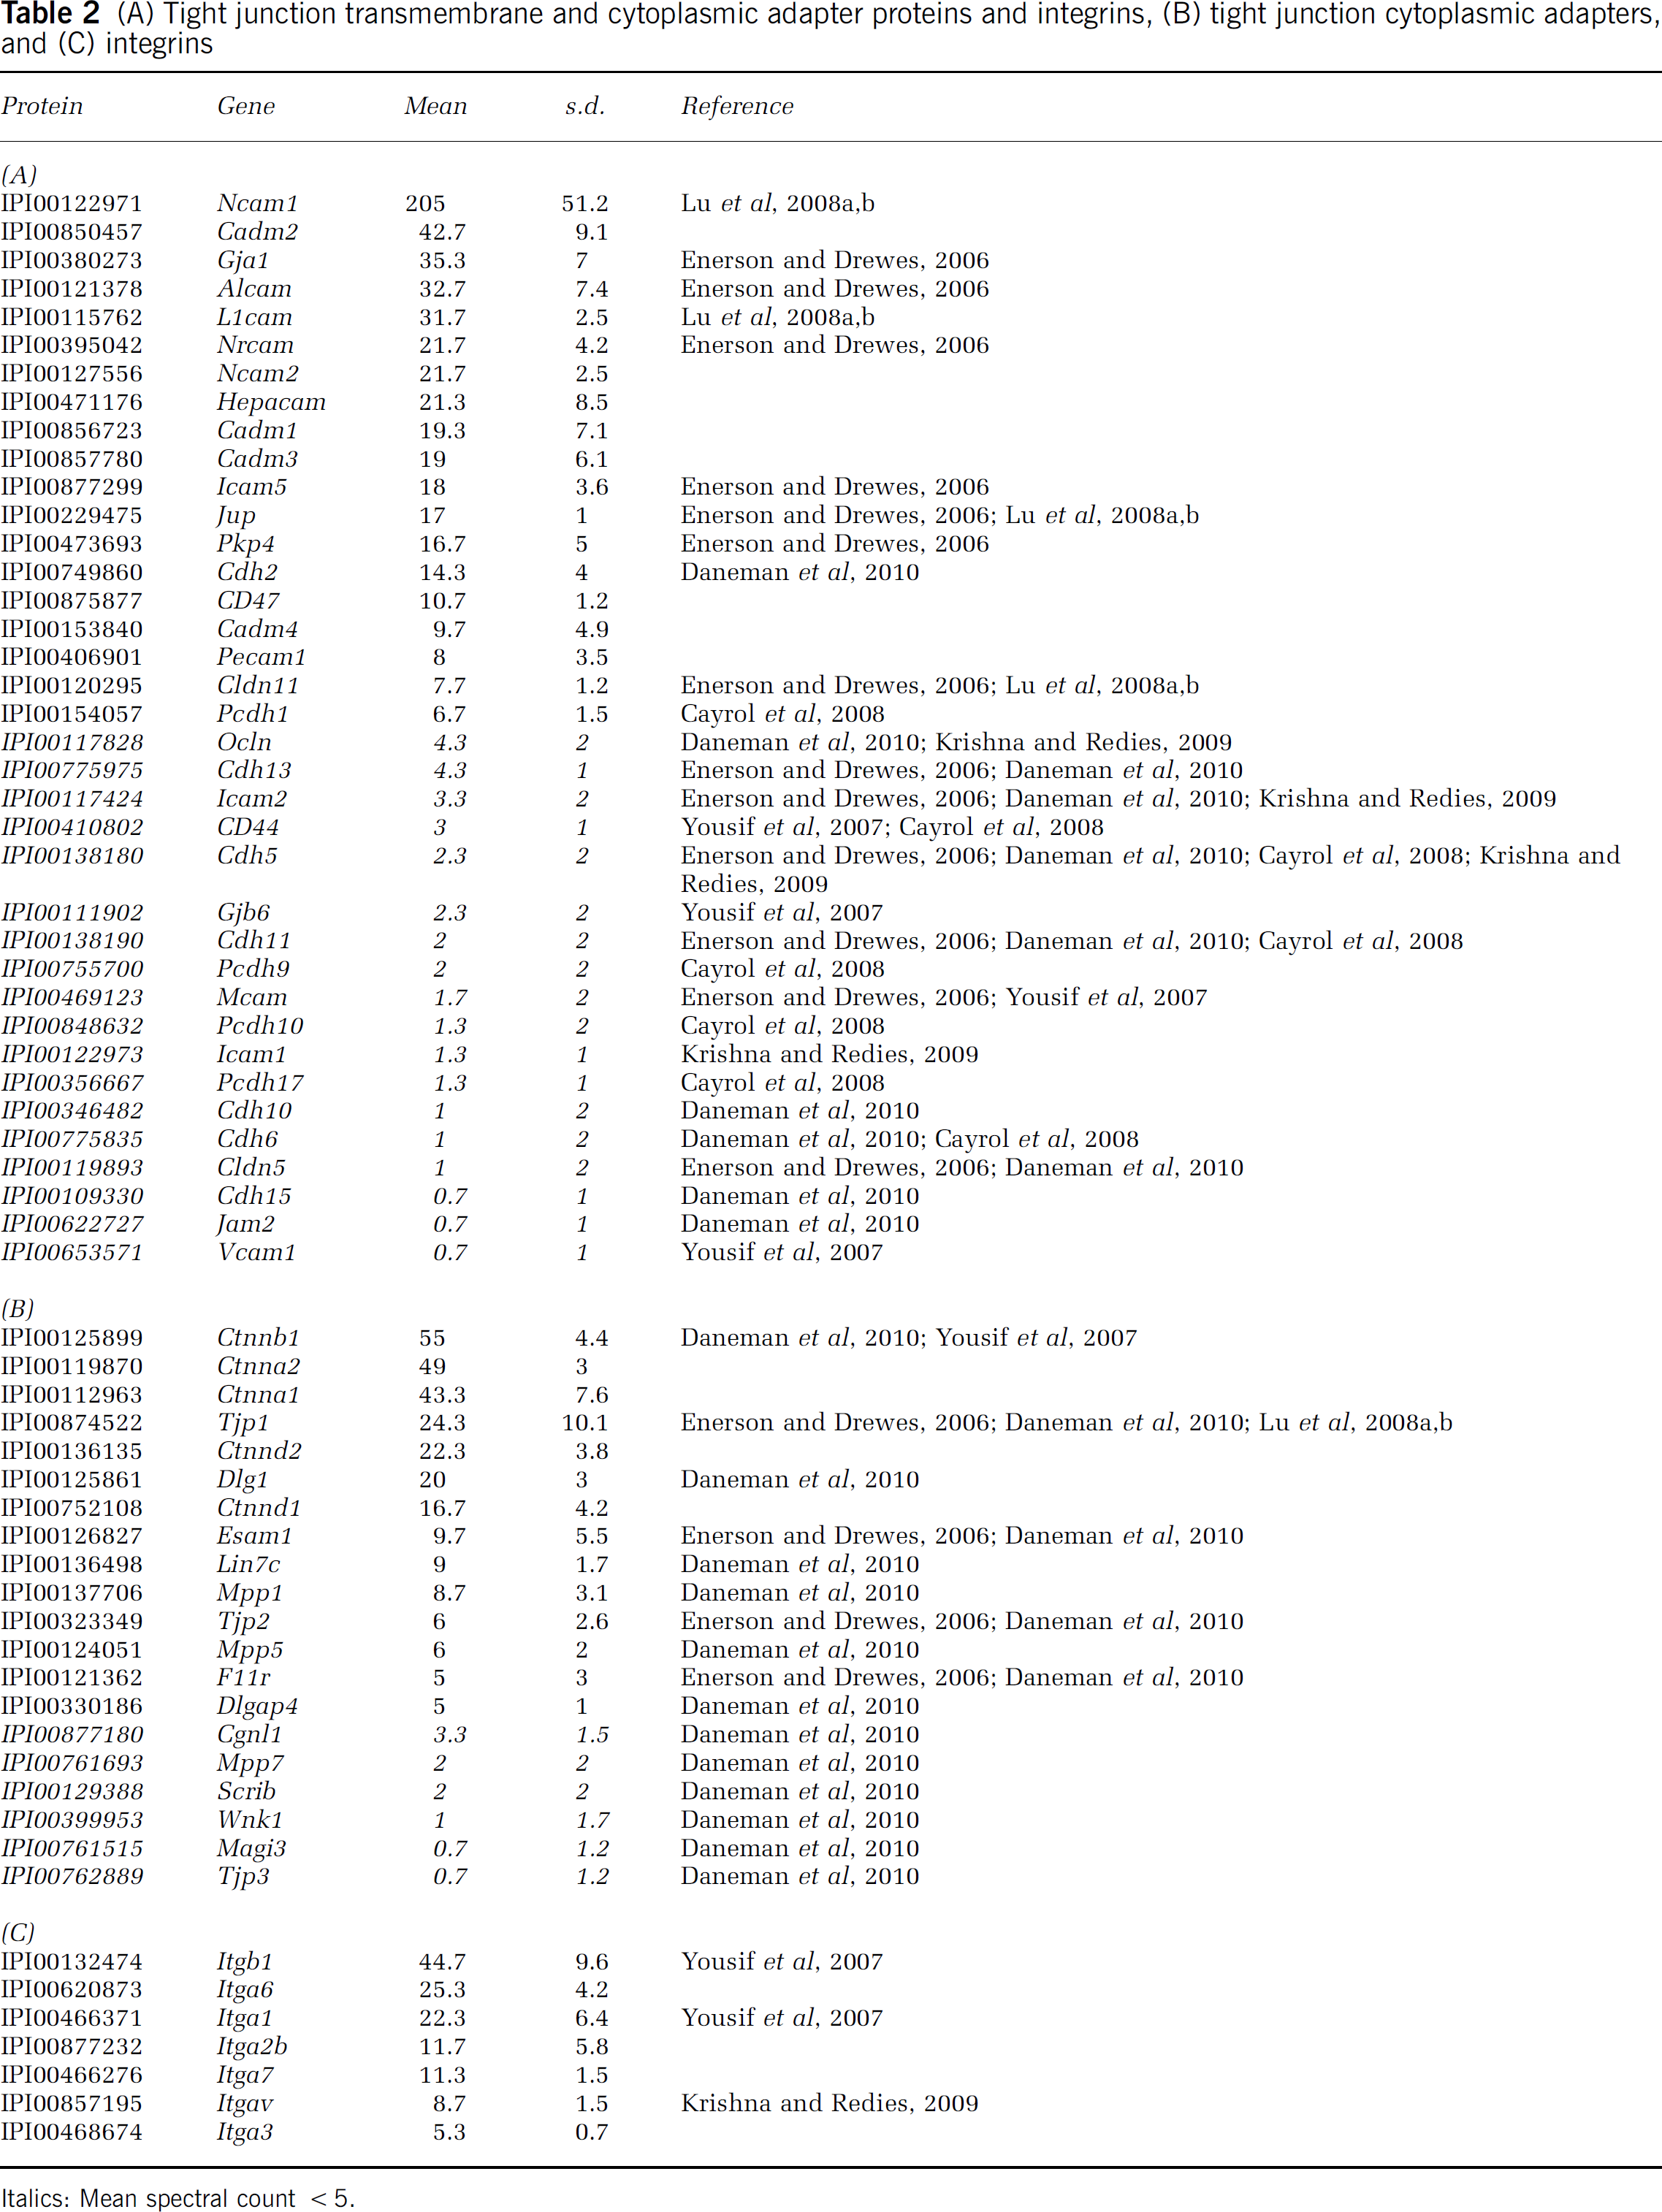
Italics: Mean spectral count <5.
Extracellular matrix proteins
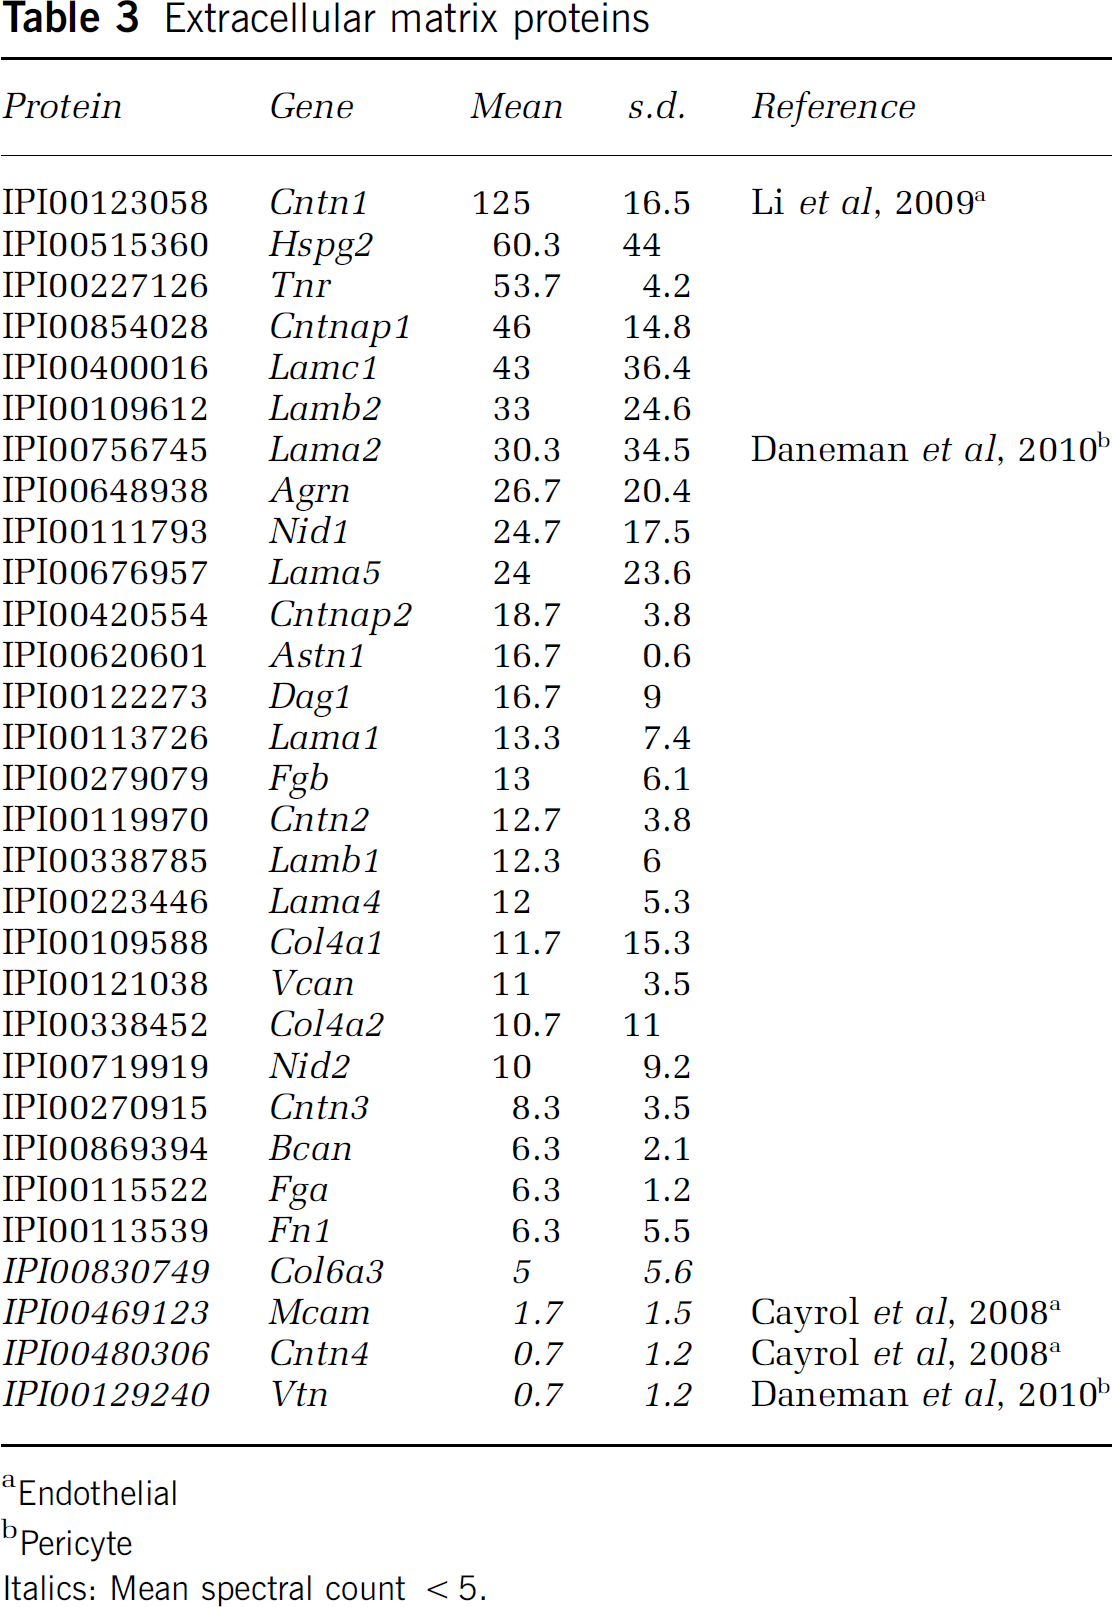
Endothelial
Pericyte
Italics: Mean spectral count <5.
(A) Endothelial proteins, (B) astrocyte proteins, and (C) pericyte proteins
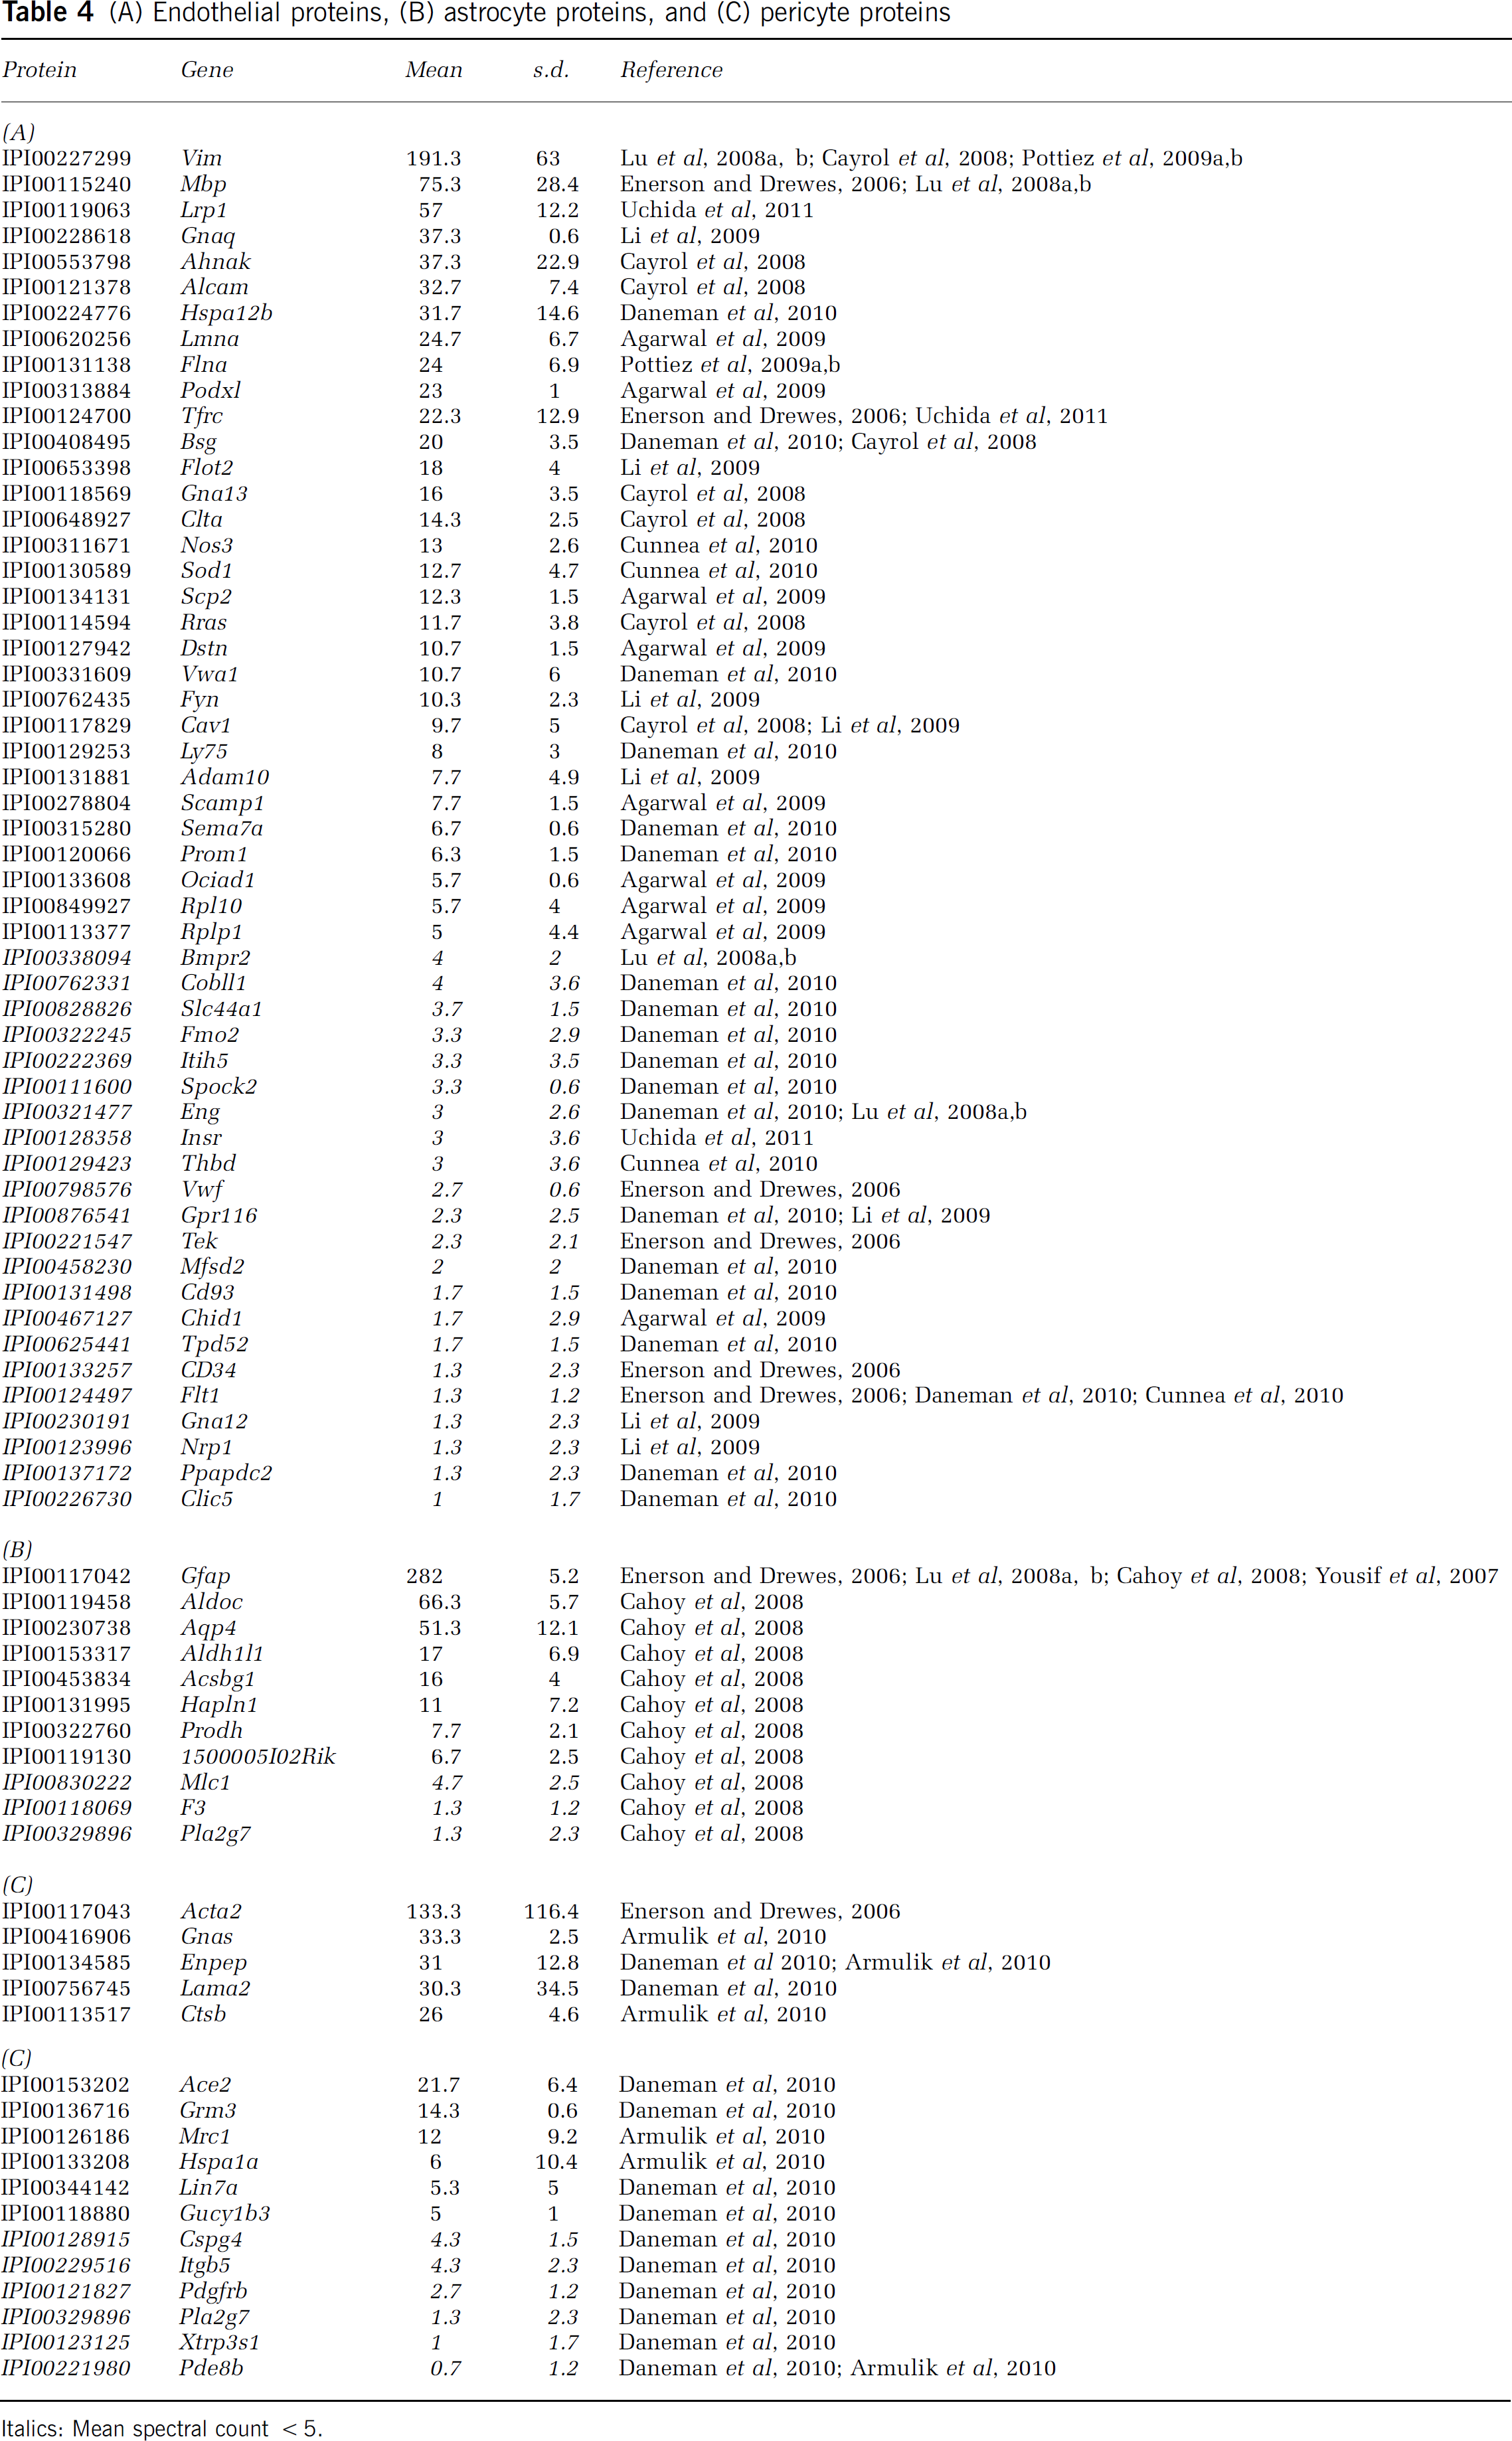
Italics: Mean spectral count <5.
Membrane Transporter and Channel Proteins
The BBB is characterized by the expression of a complex range of solute carrier proteins (SLCs), ATP-binding cassette (ABC) proteins, voltage-gated channel proteins, and other transmembrane proteins that are essential for normal function of the brain, i.e., import of nutrients and export of metabolites across the endothelium. SLC/ABC proteins were ranked based on the number of spectral counts. We identified 84 SLC/ABC transmembrane proteins by MudPIT, with proteins having a spectral count of <5 peptides indicated in italics below the dashed line. All of the detailed supporting spectral count data are provided in Supplementary Table 1. Of these microvessel-derived membrane proteins identified, we noted that 21 of these proteins (i.e., Slc25a4, Abcb1a, Slc12a5, Slc3a2, Slc2a1, Slc1a6, Slc12a2, Slc6a1, Slc38a3, Abcc4, Slc9a3r2, Slc16a1, Slc2a3, Slc9a3r1, Abcd3, Slc17a7, Slc30a1, Slc27a1, Asna1, Abcg2, and Slc7a1) were identified in an earlier study based on mRNA expression profiling in rat brain microvessels (Enerson and Drewes, 2006). An additional 13 SLC/ABC proteins (i.e., Slc9a1, Abca7, Abcb8, Abcc9, Slc25a10, Slc5a6, Slc25a20, Slc4a3, Abcb6, Abca2, Slc6a20, Abcc8, and Slc38a2) were detected in mouse microvessels with a spectral count of <5 that were also present at the mRNA level in rat microvessels (Enerson and Drewes, 2006). Moreover, five out of six ABC proteins recently quantified in a study of human BBB transporters (Uchida et al, 2011) were also identified in our study, some with spectral counts 5 (i.e., Abcb1a, Abcc4, and Abcg2) and others with <5 spectral counts (i.e., Abca2 and Abcc8). In a similar comparison, 7 out of 10 SLC proteins had spectral counts 5 (i.e., Slc1a3, Slc3a2, Slc2a1, Slc2a3, Slc16a1, and Slc7a1), whereas Slc7a5 had a spectral count <5 (see Table 1 and Supplementary Table 1). An additional 37 transmembrane proteins identified by MudPIT in our study were also detected at the mRNA level from isolated mouse endothelial cells (i.e., Abcb1a, Slc3a2, Slc2a1, Slc38a3, Abcc4, Slc9a3r2, Slc16a1, Slc6a17, Slc25a24, Slc25a25, Slc30a1, Slc1a1, Abcg2, Slc7a1, Slc44a1, Slc25a20, Slc39a10, Slc44a2, Slc12a7, Slc22a8, Slc16a2, Slc7a5, Atp7a, Slc38a2, and Slc7a3; see Table 1), pericytes (i.e., Atp1a2, Atp1b2, Slc12a2, Atp2a3, Atp13a5, Abcc9, and Abca9; see Table 1), and astrocytes (i.e., Atp1a2, Slc1a2, Slc4a4, Slc25a18, Slc39a12; see Table 1) (Cahoy et al, 2008; Daneman et al, 2010). Prototypic examples of BBB proteins in the endothelium, such as Abcb1a (i.e., PgP), insulin receptor, the transferrin receptor, and
Tight Junction Proteins and Integrins
The physical integrity of the endothelial component of the BBB is generally defined by the expression of tight junction proteins; therefore, we examined their relative abundance following MudPIT of mouse brain microvessels (Table 2). In our analyses, 19 tight junction proteins were identified with a spectral count 5 (Table 2A), including Pecam1 (i.e., CD31), occludin, cadherins (types 2 and 13), and claudin (type 11). An additional 18 tight junction proteins were identified including Vcam1, Jam 2, and claudin 5, although having limited representation among recovered sequences (i.e., <5 spectral counts). Cytoplasmic tight junction adapter proteins were also found (14 protein hits with 5 spectral counts; Table 2B) and included 5 catenins (types
ECM and Basal Lamina Proteins
To better characterize the ECM microenvironment and basal lamina proteins, we examined the MudPIT proteomic profile from microvessels. We identified 27 ECM proteins including tenascin-R, fibrinogen
Blood–Brain Barrier-Specific Cell Types
The analysis of microvessel proteome included the identification of proteins associated with endothelial cells and their associated astrocytes and pericytes. A total of 24 proteins were associated with endothelial cells based on previously published studies of the RNA expression in isolated cells (Daneman et al, 2010). Of these, the ABC transporter Abcb1a was the most abundant, along with several SLC proteins (Slc2a1, Slc1a1; see Table 1), von Willebrand factor-related proteins (Vwf and Vwa1, see Table 4A), as well as CD31 and Occludin (Pecam1 and Ocln, see Table 2A). A total of 31 endothelial proteins were identified (Table 4A), in addition to the 36 transmembrane endothelial transporter/channel proteins annotated in Table 1. Vascular endothelial growth factor receptors (Flt1 and Kdr), were also detected, although below the 5 spectral count threshold. Also present were the prototypic astroycte markers such as glial fibrillary acidic protein and Aqp4, as well as the more recently characterized astrocyte marker, Aldh1L1. Similarly, recovery of pericyte markers such as Slc1a2, Slc4a4, and laminin
Discussion
In this study, we validated a combination of brain microvessel isolation, membrane fractionation, proteolytic digestion, liquid chromatography, mass spectrometry, and bioinformatic techniques to identify and catalog the protein expression profile in the BBB. The specific strategy enabled the profiling of transmembrane and membrane-associated markers of the BBB at the protein level (Kamiie et al, 2008; Ohtsuki and Terasaki, 2007). We focused on the identification of the canonical classes of membrane-associated BBB proteins that are associated with solute transport functions and normal brain physiology (e.g., SLC/ABC transporters and voltage-gated channel proteins), tight junction proteins maintaining integrity (i.e., transmembrane proteins and associated cytoplasmic adapters), and basal lamina extracellular proteins that constitute the ECM microenvironment and indirect intercellular contacts (i.e., integrin-mediated interactions with the basal lamina) (Hawkins and Davis, 2005). For ECM proteins in particular, we were interested in an approach to identify basal lamina proteins from intact microvessels to provide the most physiologically relevant
The intent of our studies was to generate a BBB protein database using MudPIT, which provides a reference for identification of BBB membrane proteins, ECM, and basal lamina. Membrane fractionation of the microvessels followed by a urea-assisted, acid-labile, surfactant-mediated protease digestion was used to identify: (1) the most abundant proteins (i.e., a standard of comparison for proteomic analysis and a measure of contaminants from other cellular compartments); (2) the profile of classical transmembrane transport proteins; and (3) the profile of tight junction and ECM proteins associated with microvessels (i.e., a measure of proteins that define the physical barrier properties of the neurovascular unit (Wolburg et al, 2009)).
Previous studies by Enerson and Drewes (2006) examined the mRNA expression of isolated rat microvessels and validated the techniques to isolate intact fresh microvessels . We used a similar isolation strategy as described by several laboratories to isolate BBB components, and then interrogated which proteins were associated with the BBB membrane fraction using MudPIT. We annotated our proteomic findings for comparison with mRNA expression profiling of SLC/ABC transporters (Table 1), tight junction proteins (Table 2), and endothelial genes (Table 4A) leading to the observation that as expected, many of the genes expressed at the mRNA level in the rat brain were also expressed in membrane protein-focused proteomic profiling. For example, 62% of the SLC/ABC transporters expressed at the RNA level by Enerson and Drewes were also detected in our proteomic study. Although a total of 217 SLC/ABC transporters and voltage-gated channel proteins were detected by our MudPIT approach, only 58% of these proteins satisfied our selection threshold for identity in three different biologic samples and with the average spectral count 5. Although additional membrane transporters were identified, further investigation will be necessary to validate the expression and biologic relevance of the less abundant proteins that did not meet the stringent spectral count cutoff criteria. We have compiled a complete listing of all peptides identified with accompanying spectral data (Supplementary Table 1). Similarly, 53% of the tight junction proteins identified by Enerson and Drewes were also detected by MudPIT, whereas an additional 21 tight junction proteins/adapters (Daneman et al, 2010) were identified along with 7 integrins that have not been previously identified through microvessel proteomics. Tables 1, 2, 3 and 4 are further annotated with gene expression data based on protein (Agarwal et al, 2009; Cayrol et al, 2008; Cunnea et al, 2010; Krishna and Redies, 2009; Li et al, 2009; Lu et al, 2008b; Ohtsuki and Terasaki, 2007; Pottiez et al, 2009b; Yousif et al, 2007) and mRNA (Cahoy et al, 2008; Daneman et al, 2010; Enerson and Drewes, 2006) detection strategies. A recent quantitative targeting proteomics strategy, reported as sensitive to the fmol range, for human blood–brain transporters and receptors yielded a similar ABC/SLC transporter profile, with 5 of 6 ABC proteins and 7 of 10 SLC proteins identified by MudPIT present in the reported human study (Uchida et al, 2011). Interestingly, Uchida
The recent mRNA gene profiling report (Daneman et al, 2010) on isolated endothelial cells, pericytes, and astrocytes provided an opportunity to compare and annotate our protein-based findings. We observed that by focusing on the membrane fraction for proteomic analyses, we were able to obtain an unexpectedly large number of SLC/ABC transporters present in microvessels, of which the mRNA expression of specific family members of transporters was similar, but not identical to that observed in isolated cells (Daneman et al, 2010). For example, 5 of the 6 transporters Apcdd1, Abcb1a, Slco1a4, Slc22a8, Slc7a5, but not Slc01c1 were highly expressed at the mRNA level by Daneman et al (2010) and were also identified by proteomics, although with low spectral counts. Similarly, although we obtained a large number of transporters as identified by RNA-based expression studies, the exact expression profile of transporters varied. We recognized the inherent difficulty of protein isolation from complex tissue sources and identification of low abundance proteins, as compared with RNA transcript analysis of low-abundance mRNAs. However, the identification of proteins with low spectral counts provides a starting point for further studies. Most importantly, further understanding of the interdependent roles of the ∼120 transporters recovered with the most abundant spectral counts will provide insights into BBB integrity and function.
Interestingly, among the most abundant transmembrane transporter/channel proteins was Atp1a2, the gene expression of which was detected in both isolated pericytes (Daneman et al, 2010) and astrocytes (Cahoy et al, 2008). The expression of other pericyte markers such as platelet-derived growth factor receptor-
Although transcriptome profiling provides a standard from which to assess mRNA expression levels in microvessels or isolated primary cells, the generation and characterization of a BBB gene expression profile at the protein level is essential for comparative purposes. Therefore, developing techniques to better analyze unknown constituents of the BBB proteome is essential as shown by the laser capture microdissection of microvessels from mouse brain slices using cryopreservation, fixation, and immunostaining followed by gel electrophoresis and then mass spectrometry for protein identification (Lu et al, 2008b). In a comparison with our MudPIT strategy of using fresh intact microvessels, 58% of BBB-enriched/endothelial proteins identified by laser capture microdissection/gel electrophoresis were also evident in our studies as indicated in Tables 1, 2, 3 and 4. Quantification of the relative abundance of known membrane transporters from human and mouse microvessels (Uchida et al, 2011), along with our results identifying proteins shows that a MudPIT approach is highly appropriate for proteomic identification from isolated BBB membranes and provides increased protein identification coverage. Each spectral count is a selected peptide precursor ion selected for fragmentation that is subsequently assigned for protein identification. For spectral counts between 5 and 500, abundance is linearly proportionate to spectral count (Collier et al, 2010; Cooper et al, 2010; Liu et al, 2004). Therefore, although there are limitations with relying exclusively on spectral counts for relative quantitation, once protein identifications have been made using a procedure such as MudPIT, other techniques can be deployed to quantify known proteins (Uchida et al, 2011). The identification of ECM proteins and transmembrane integrins in our study using freshly isolated tissues provides a profile of the membranes in contact with the extracellular microenvironment is not influenced by potential tissue culture-induced artifacts (McCarty, 2009). Although many ECM proteins were identified by MudPIT (i.e., six different specific laminin subtypes and five different proteoglycans), the mRNA encoding these and other ECM proteins seemed to be underrepresented in transcriptome studies, suggesting the possibility that ECM proteins with a long half-life may help explain the low abundance of their coding mRNAs. Therefore, to better understand the ECM microenvironment in the BBB, a MudPIT strategy may provide the most complete protein expression profile to date of ECM proteins.
In contrast to classical two-dimensional isoelectric focusing/SDS-PAGE, in which solubilization and resolution of hydrophobic proteins are limited, our solubilization and enzymatic fragmentation yielded experimental material sufficient for a relatively high-content analyses of a large number of peptide fragments. This was due, in part, to the use of: (1) a cell membrane lysis approach that minimized nuclear lysis; (2) a relaxation buffer to better unfold membranes (Borregaard et al, 1983) before lysis and centrifugal fractionation; and (3) use of urea as a solubilizing agent and ProteaseMAX acid-labile surfactant to increase the efficiency of tryptic digestion. Similar approaches applied to the analysis of membrane proteins in yeast, heart, and human parotid exosomes have led to the identification of high-content membrane protein data sets (Gonzalez-Begne et al, 2009; Lu et al, 2008a; Washburn et al, 2001). As with most sensitive analytical tools such as MudPIT, an important consideration is the purity of the starting material (i.e., microvessels versus other cell types) and the quality of membrane fractionation (i.e., the yield of membrane proteins). Therefore, we have relied on validation techniques consistent with DeCleves and colleagues (Yousif et al, 2007) and our own immunoblotting of starting microvessel material to validate the expression of membrane proteins, enrichment of endothelium/astrocyte endfeet, and a decrease in neuronal proteins.
In a comparison of proteins identified in this study of mouse brain blood vessels by MudPIT versus RNA gene profiling and immuohiostochemistry, it remains a challenge to determine how source, isolation, and analytical techniques may influence the conclusions (Uchida et al, 2007). For example, in the study of the BBB, expressions of claudin 5 and cadherin 11 are widely described (Hawkins and Davis, 2005; Nitta et al, 2003), and yet neither was a major component of the mass spectrometry spectral counts analyzed. In contrast, cadherins 1 and 2 and cadherin 11 predominated in our analysis suggesting that if extraction techniques affect different members of the same family, then such differences in apparent abundance may have other unknown explanations. These differences may reflect the limitations recovery techniques, the source of the lysate (i.e., heterogeneity of brain microvessels), the posttranslational status,
It has become increasingly clear that a better understanding of the BBB requires a more comprehensive knowledge of the protein constituents of this important biologic barrier (Czeisler and Janigro, 2006; Neuwelt et al, 2008; Pardridge, 2010; Soni et al, 2010). In our study, we have used MudPIT on fresh unfixed microvessels to provide a comprehensive database resource for membrane transporter, tight junction and ECM proteins of the BBB. Our microvessel-based analysis of proteome provides a novel bioinformatic resource to help place into perspective transcriptome and proteomic findings from intact microvessels and isolated cells of the BBB.
Footnotes
Acknowledgements
This is publication MEM no. 20592 from The Scripps Research Institute. The authors thank Dr Sergio Catz (The Scripps Research Institute, La Jolla, CA, USA) for his suggestions and support regarding cell lysis and the use of relaxation buffer with cell membranes. They are also grateful to Dr Gabriel Simon (Washington University, Saint Louis, MO, USA) for providing dtarray2.pl.
The authors declare no conflict of interest.
References
Supplementary Material
Please find the following supplemental material available below.
For Open Access articles published under a Creative Commons License, all supplemental material carries the same license as the article it is associated with.
For non-Open Access articles published, all supplemental material carries a non-exclusive license, and permission requests for re-use of supplemental material or any part of supplemental material shall be sent directly to the copyright owner as specified in the copyright notice associated with the article.