
Abstract
DAR-0100A, the active enantiomer of dihydrexidine, is a potent dopamine D1 agonist under investigation for treatment of cognitive impairment and negative symptoms of schizophrenia. We measured the dose–occupancy relationship for DAR-0100A at D1 receptors using positron emission tomography (PET) imaging in baboons with [11C] NNC112 and its binding to D2 with [11C] raclopride. Two baboons were scanned with [11C] NNC112 at baseline and after three different doses of DAR-0100A. Two baboons were scanned with [11C] raclopride at baseline and after one dose of DAR-0100A. Occupancy (ΔBPND) was computed in the striatum and cortex. A clear relationship was observed between plasma concentration of DAR-0100A and ΔBPND. ΔBPND was larger in the striatum than in the cortex, consistent with reports showing that 25% of [11C] NNC112 BPND in the cortex is attributed to 5-HT2A. Plasma EC50 estimates ranged from 150 to 550 ng/mL according to the constraints on the model. There was no detectable effect of DAR-0100A on [11C] raclopride BPND. These data suggest that at doses likely to be administered to patients, occupancy will not be detectable with [11C] NNC112 PET and binding of DAR-0100A to D2 will be negligible. This is the first demonstration with PET of a significant occupancy by a full D1 agonist
Introduction
A large number of effective pharmacological interventions have been introduced over the past five decades for the treatment of the positive symptoms of schizophrenia, but efforts to treat the cognitive and negative symptoms have been less successful. Several lines of research in preclinical species and in laboratory preparations have led to the suggestion that dopamine D1 receptor agonists may improve working memory in patients with schizophrenia, a function performed poorly by many patients (Aleman et al, 1999). For example, Goldman-Rakic et al (2004) assembled an extensive body of work showing the importance of adequate prefrontal cortical D1 receptor stimulation for optimal performance of spatial working memory tasks by nonhuman primates. Studies have shown working memory improvement by administration of D1 agonists in primate models of cortical dopaminergic hypofunction (Arnsten et al, 1994; Schneider et al, 1994; Castner et al, 2000). Seamans and colleagues have suggested a model of cortical working memory in which there are D1 and D2 dominated states, with the D1 state having an essential role in optimal working memory function (Seamans et al, 2001; Durstewitz and Seamans, 2002, 2008; Seamans and Yang, 2004; Trantham-Davidson et al, 2004). Patients with schizophrenia have been hypothesized to have low dopamine function in the prefrontal cortex, and thus there is considerable interest in exploring the potential of D1 agonists as cognitive enhancers in schizophrenia.
DAR-0100 (dihydrexidine) is a potent D1 agonist (Mottola et al, 1992). The safety of acute doses has been shown in patients with schizophrenia (George et al, 2007). DAR-0100A is the active (+) enantiomer of the racemic mixture DAR-0100 (Knoerzer et al, 1994).
There are two PET radioligands in the widespread use for imaging D1 receptors: [11C] NNC112 and [11C] SCH 23390. We have shown that ∼25% to 30% of the specific binding in the cortex of anesthetized baboons of both of these ligands is attributable to 5-HT2A receptors, whereas virtually all detectable specific binding in the striatum is attributed to D1 (Ekelund et al, 2007). We have also shown that a similar binding profile occurs for [11C] NNC112 in awake human subjects (Slifstein et al, 2007). As DAR-0100A has negligible affinity for 5-HT2A, we predicted that 20% to 30% of specific binding by [11C] NNC112 in the cortex would be inaccessible to competition from DAR-0100A, so that the percentage decrease in binding observed in the cortex during DAR-0100A administration compared with baseline would be less than that in the striatum by this factor.
Materials and methods
Subjects
Three adult male baboons (baboons A, B, and C,
DAR-0100A Preparation and Administration
In each experiment, DAR-0100A was dissolved in 60 mL of saline vehicle. DAR-0100A was administered as a constant intravenous infusion starting 10 minutes before the start of the drug condition scan. The solution was delivered using a programmable syringe pump (Harvard Apparatus, Holliston, MA, USA). The infusion rate was set such that delivery of the entire 60 mL volume coincided with the duration of the scan, i.e., the rate was 60 mL/(scan duration + 10 minutes).
Radiochemistry
[11C] NNC112 was prepared as described in the study by Abi-Dargham
Positron Emission Tomography Procedures
Fasted animals were initially immobilized with ketamine (10 mg/kg intramuscularly). Anesthesia during preparation and scans was maintained with 2% isoflurane through an endotracheal tube. An intravenous catheter was inserted for radioligand administration, drug administration, and hydration. An arterial catheter was placed in a femoral artery for arterial blood sampling and continuous blood pressure monitoring. Vital signs (blood pressure, pulse, electrocardiograph, temperature, and respiration) were monitored continuously using a patient monitoring system (DataScope Corp, Paramus, NJ, USA). Temperature was maintained at 37°C with a heated water blanket. All scanning was performed on an HR+ scanner (Siemens, Knoxville, TN, USA), operating in a three-dimensional mode. The animal's head was placed in the center of the field of view. A 10-minute transmission scan was acquired before tracer injection for attenuation correction. Radioligands were administered as a 30-second intravenous bolus. Emission data were binned into a sequence of frames of increasing length. Total scan durations were 90 minutes for [11C] NNC112 and 60 minutes for [11C] raclopride. On each study day, two scans were acquired: a baseline scan, followed by a second scan during DAR-0100A infusion as described above. Positron emission tomography data were corrected for attenuation, scatter, and randoms and reconstructed using filtered back-projection with a Shepp filter (cutoff 0.5 cycles per projection ray).
Arterial plasma samples were collected using an automated sampling system during the first 4 minutes (11 samples), and manually thereafter at longer intervals. A total of 21 ([11C] NNC112) or 20 ([11C] raclopride) arterial samples were collected for input function measurement. Five additional samples were collected during each scan for high-performance liquid chromatography analysis of the unmetabolized fraction of radiotracer. During the DAR-0100A condition, five additional samples were collected (at 2, 4, 8, 16, and 60 minutes after injection for [11C] NNC112 and at 2, 4, 12, 20, and 40 minutes after injection for [11C] raclopride) for high-performance liquid chromatography analysis of the plasma concentration of DAR-0100A.
Data Analysis
Plasma data:
Arterial plasma input functions were formed as described previously (Abi-Dargham et al, 2000a). Briefly, centrifugation was performed to separate the plasma from whole blood, and the activity in plasma was counted on a gamma counter (Wallac 1480, Perkin-Elmer, Boston, MA, USA). The unmetabolized fraction of the radioligand was measured in the five samples collected for this analysis by high-performance liquid chromatography using a fraction collection method. A C-18 Phenomenex analytical column (Phemomenex, Torrence, CA, USA) was eluted with a solvent mixture of 35% acetonitrile and 65% 0.1 mol/L ammonium formate at a flow rate of 2 mL/min for both radiotracers. The eluate was collected in 5 equal-duration fractions over 10 minutes. Parent fraction was computed as the ratio of the activity in fractions 4 and 5 to the sum of activity from all fractions. The peak retention time for the unmetabolized radioligand was 7 minutes and all labeled metabolites eluted earlier than the parent. The measured fractions were fitted to a Hill equation:
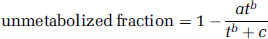
with fitted parameters
Whole-blood activity was multiplied by this parent-fraction curve to obtain an empirical estimate of the unmetabolized radiotracer concentration in arterial plasma. The empirical curve was fitted to a sum of three exponentials starting at the time of peak concentration. This modeled curve was used as the input function for compartment analysis. Peripheral clearance of radiotracer (L/h) was computed as the injected activity divided by the area under the curve of the input function. In addition, three aliquots of arterial plasma collected before radiotracer injection were spiked with radiotracer, and
Positron emission tomography data:
Decay-corrected reconstructed data were coregistered to T1-weighted anatomic magnetic resonance images acquired for each animal, using maximization of mutual information as implemented in the SPM2 software environment (Friston et al, 1995). Regions of interest, ROIs, were drawn on the magnetic resonance images and transferred to the coregistered PET images. Regions of interest included the cortical regions for [11C] NNC112 scans (cingulate, frontal, parietal, temporal, and occipital cortices), as well as the striatum and cerebellum as a reference region for both radioligands. Time–activity curves were generated from the mean activity in each region and each frame. Data were fitted to two models: a two-tissue compartment model (2TC) with arterial plasma input, and with the simplified reference tissue method (SRTM, Lammertsma and Hume, 1996) with the cerebellum as the reference region. The two methods are complementary, as they use partially independent measurements (one uses arterial plasma data and one exclusively brain data) so that the agreement between methods would provide more confidence in results. For 2TC modeling, total distribution volume (

BPND is a directly estimated parameter in the SRTM model. Receptor occupancy by DAR-0100A was estimated as –ΔBPND, where ΔBPND is the percentage change in BPND across conditions,
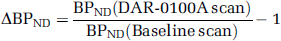
Cortical values were averaged for all subsequent analyses.
DAR-0100A Plasma Concentration and Free Fraction Analyses
Plasma DAR-0100A was determined using liquid chromatography/mass spectrometry with the addition of 2-methyldihydrexidine as the internal standard. After a liquid–liquid extraction with methyl-
The fraction of DAR-0100A in arterial plasma not bound to protein (free fraction) was assessed
Concentration–Occupancy Relationship
The relationship between arterial plasma levels of DAR-0100A and D1 receptor occupancy was fitted to the model
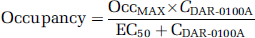
where OccMAX is the modeled maximally obtainable occupancy,
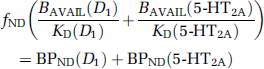
follows from the assumption that 100% of striatal [11C] NNC112 binding is vulnerable to competition from DAR-100A, whereas only the D1 fraction of cortical [11C] NNC112 binding is vulnerable to competition. (This model does not incorporate multiple affinity states of the D1 receptors for agonist binding or other mechanisms that may lead to regionally different affinities; see the ‘Discussion’ section.) Under these circumstances, baseline [11C] NNC112 BPND in the cortex is
where
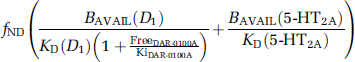
where FreeDAR-0100A and KiDAR-0100A are the concentration and inhibition constants of DAR-0100A, respectively, and the percentage change is therefore
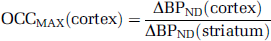
whereas in the striatum, ΔBPND is a direct estimate of D1 occupancy, so that the ratio of ΔBP between regions is an estimate of the fraction of cortical [11C] NNC112 BPND attributable to D1 binding. Under the assumption that DAR-0100A can occupy 100% of D1 receptors but no 5-HT2A receptors, this quantity is the maximal possible decrease, i.e., OCCMAX in the cortex. The models that used all 12 data points (ΔBPND in the cortex and striatum) and the same analysis method (either 2TC or SRTM) were compared for goodness of fit using the small-sample Akaike information criterion (Burnham and Anderson, 1998).
Results
Effects of DAR-0100A
Blood pressure decreased during administration of DAR-0100A (Figure 1). There was an initial dose-dependent sharp decrease at the beginning of DAR-0100A infusion that tended to rebound to a stable value of ∼80% of baseline for the remainder of the infusion without the need for pharmacological intervention.
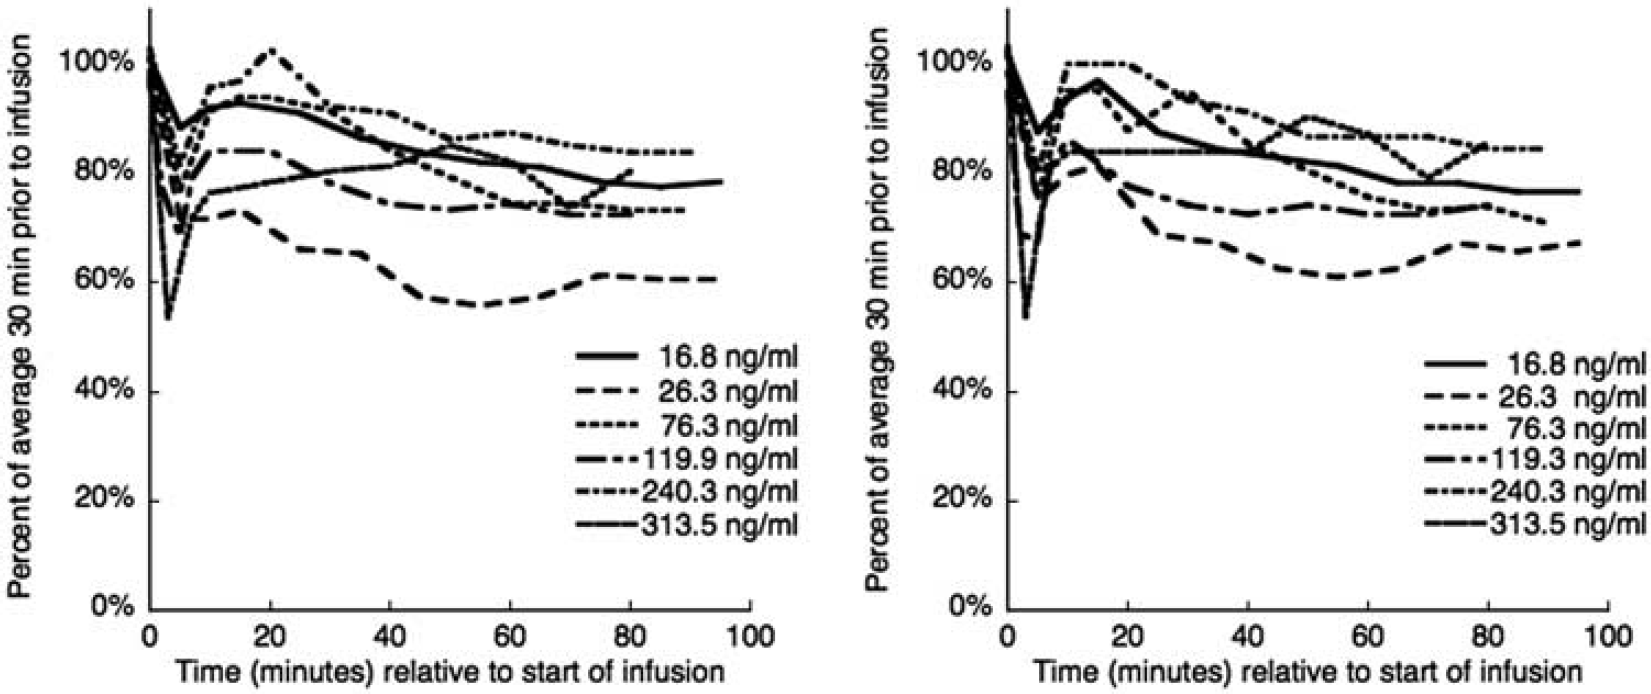
Systolic (left) and diastolic (right) blood pressure during [11C] NNC112 scans with DAR-0100A infusion. In each case, there was a rapid decrease at the start of the infusion, followed (in five of six cases) by a rebound to ∼80% of the baseline value without the need for pharmacological intervention.
DAR-0100A Plasma Concentrations and Free Fractions
DAR-0100A plasma concentrations were well identified in liquid chromatography/mass spectrometry chromatograms. DAR-0100A eluted at 4.56 minutes, whereas 2-methyldihydrexidine eluted at 6.40 minutes. Two additional peaks at 7.74 and 8.28 minutes were seen and were most likely
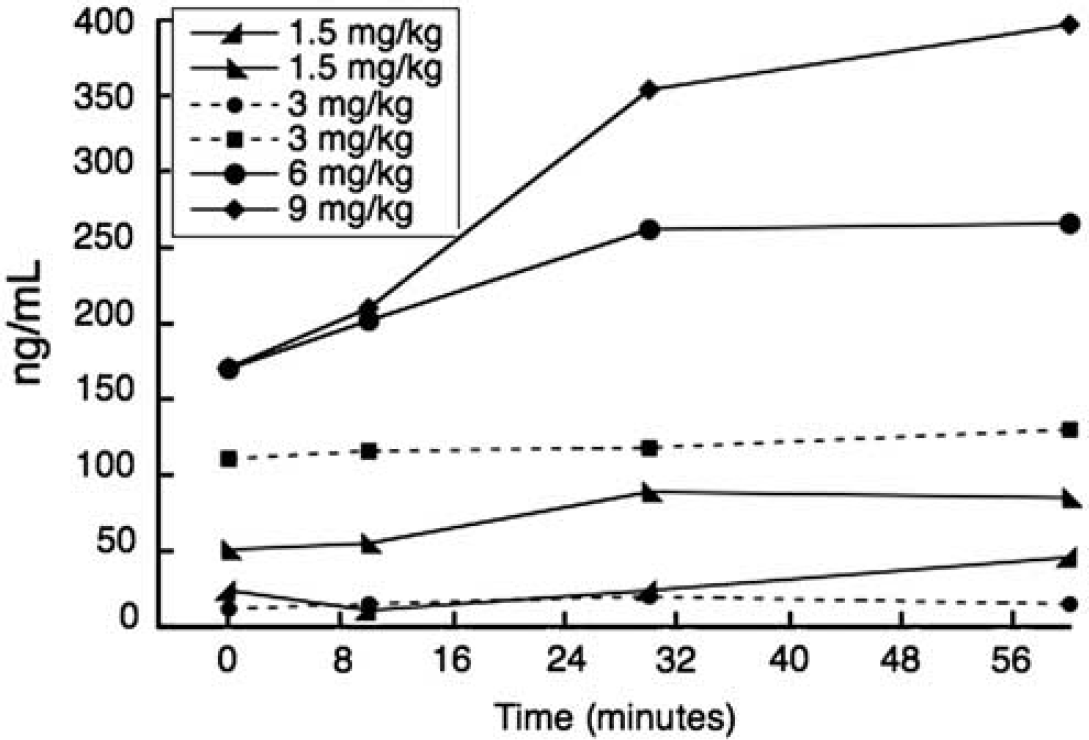
Arterial plasma concentration (ng/mL) of DAR-0100A as a function of time. Plasma concentrations were monotonically related to injected doses in mg/kg, except for one 3 mg/kg dose (− − • − −) for which plasma concentrations were lower than expected.
D1 Receptor Binding
[11C] NNC112 scan parameters (parameters not directly associated with specific binding) are presented in Table 1. There were no statistically significant differences in any of these between baseline and the DAR-0100A condition. However, there was a significant increase in the rate of metabolism of [11C] NNC112 in arterial plasma during the DAR-0100A condition (
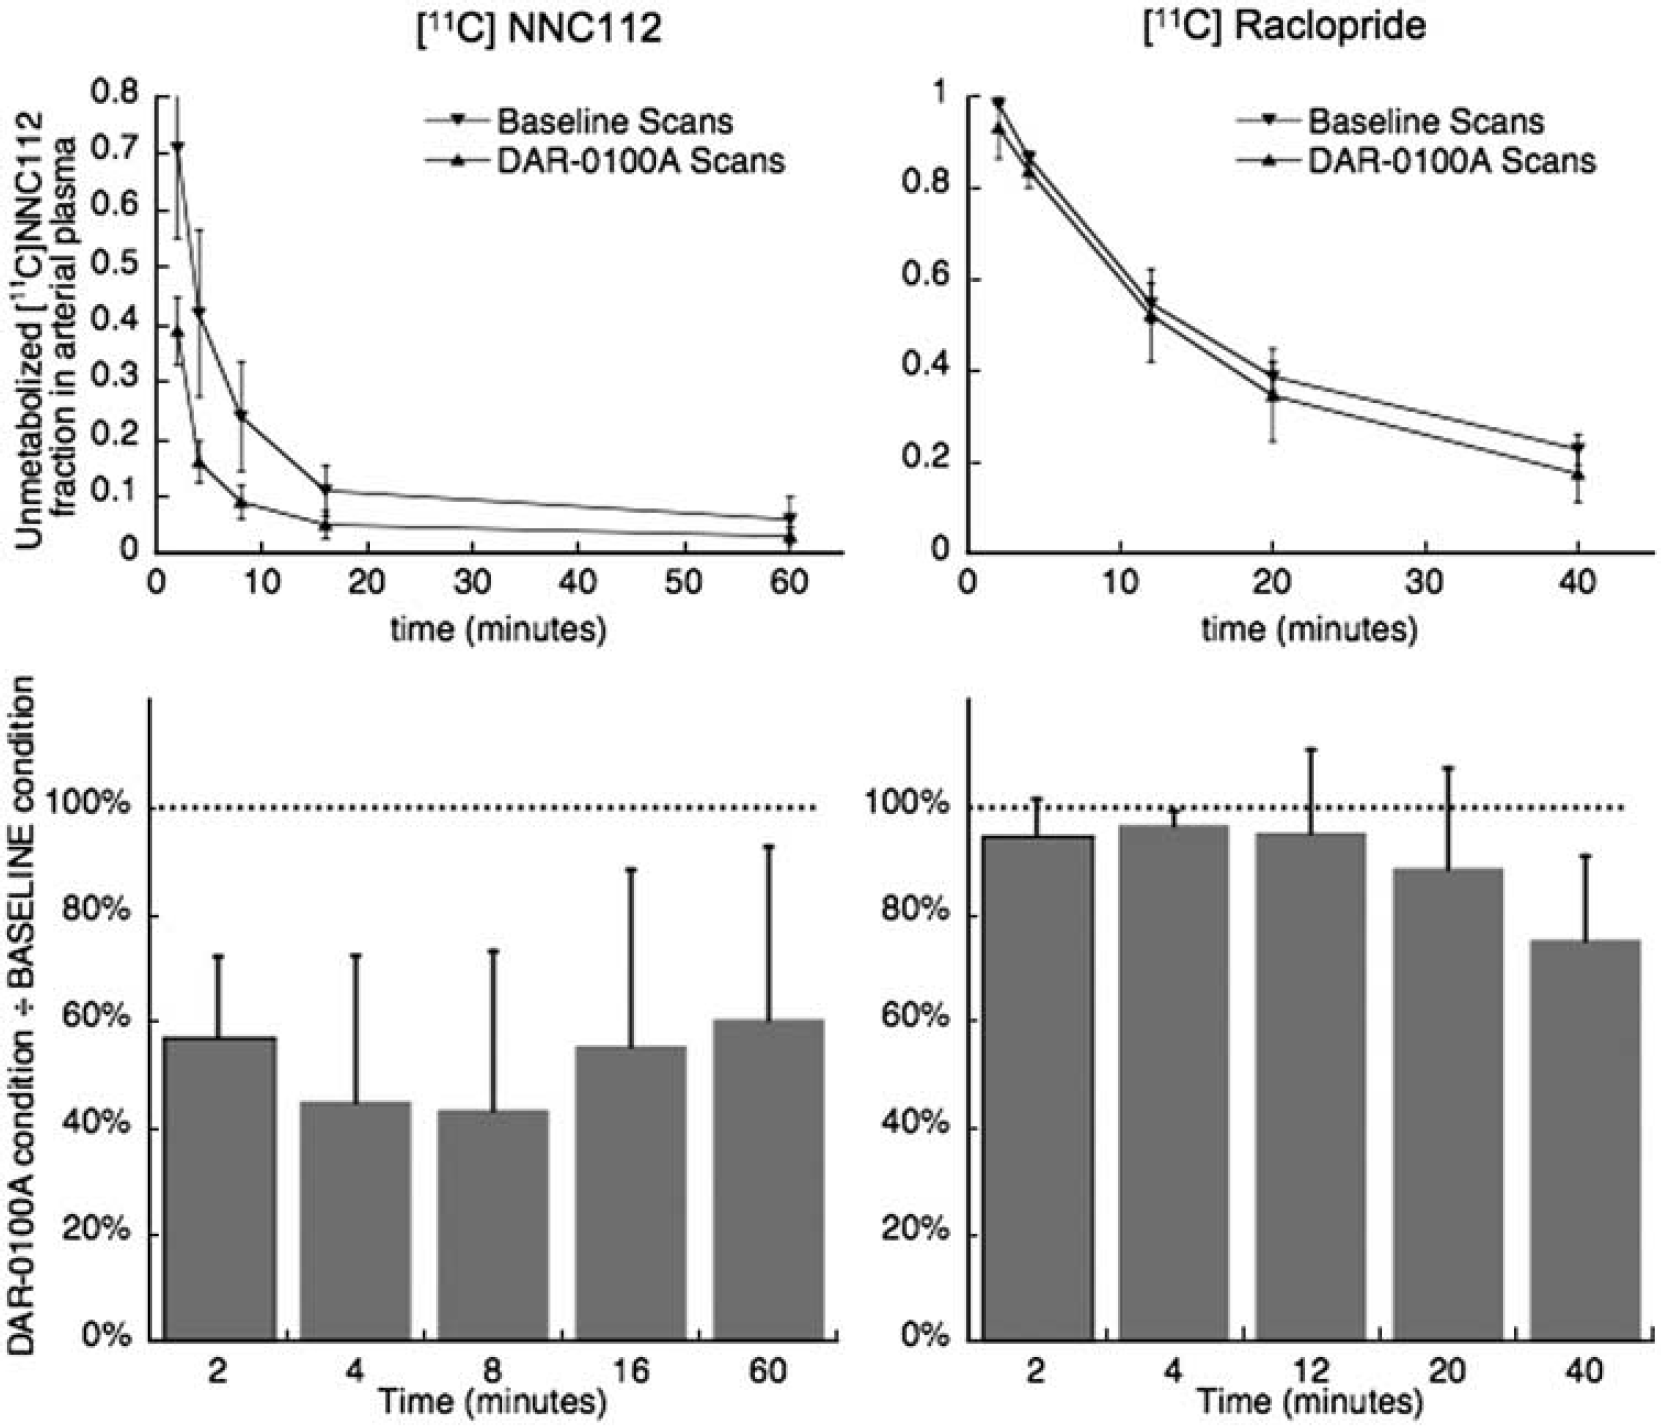
Unmetabolized fraction of radiotracer in arterial plasma as a function of time. DAR-0100A caused a pronounced increase in the rate of metabolism of [11C] NNC112 (left) but only a slight increase for [11C] raclopride (right). Top: markers (▿ = baseline, ▵ = DAR-0100A condition) and error bars are mean ± s.d. across
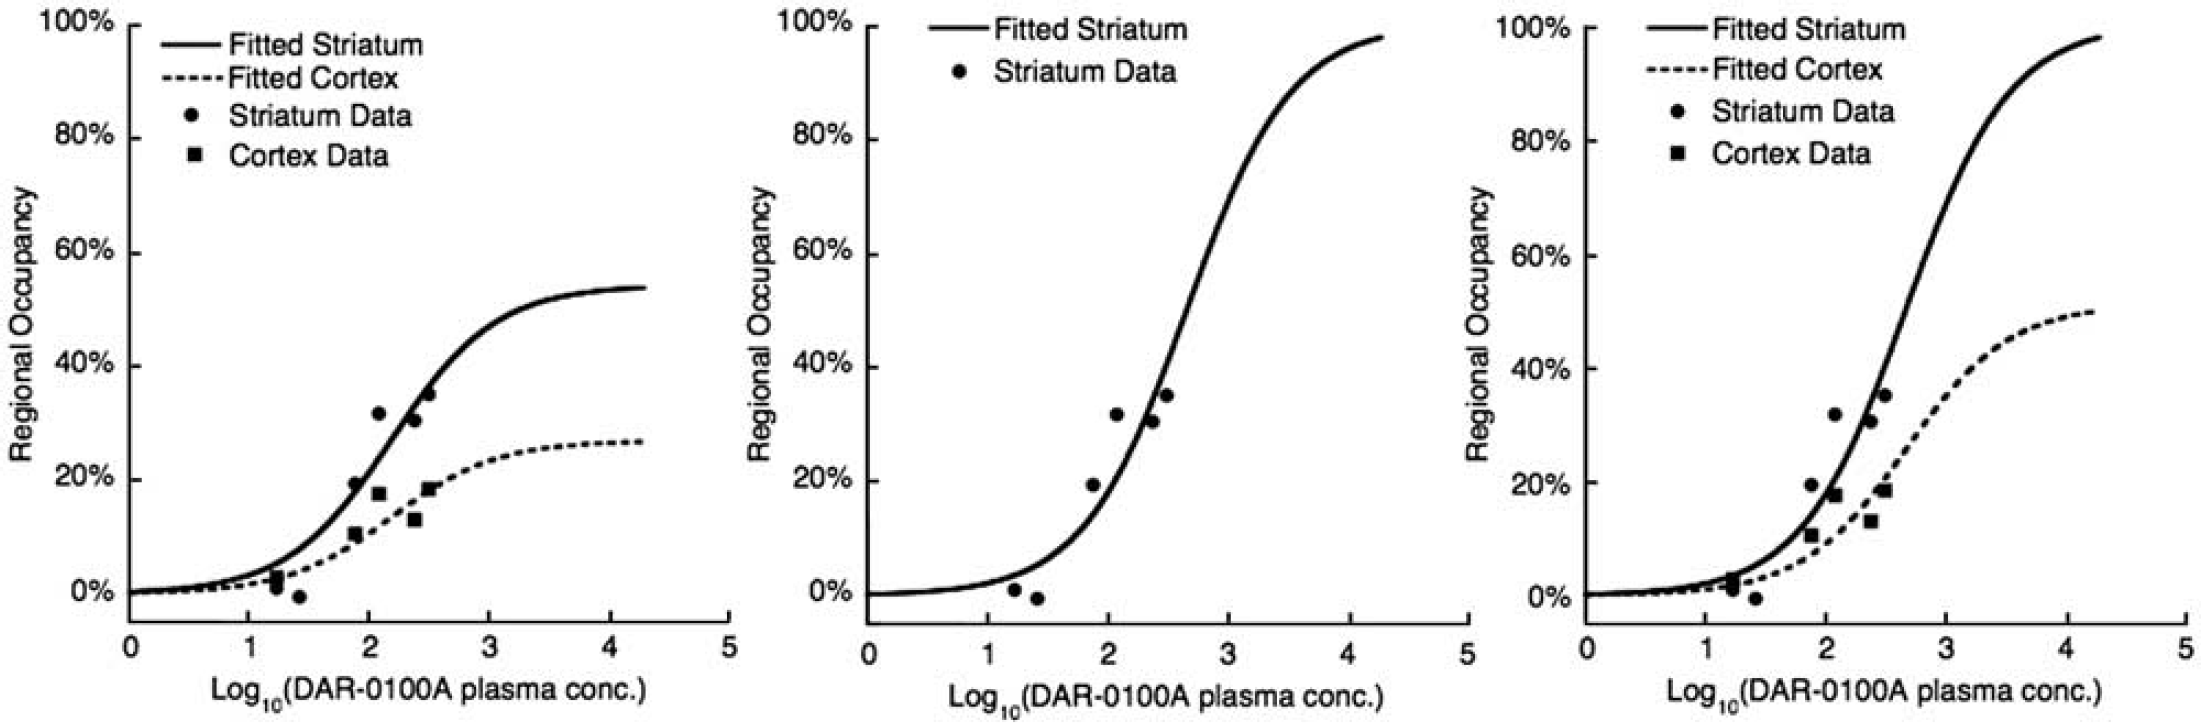
Data fits of the concentration–occupancy relationship between average arterial plasma concentration of DAR-0100A and [11C] NNC112 ΔBPND measured with PET. Data are from all six [11C] NNC112 studies (two subjects, each at three different DAR-0100A doses). Left panel: fitted parameters were maximal occupancy (each region) and EC50 (global). Center panel: EC50 fitted in the striatum only with maximal occupancy constrained to 100%. Right panel: EC50 fitted globally with maximal occupancy constrained to 100% in the striatum and the average ratio of the striatum to cortical occupancy in the cortex. See the section ‘Materials and methods’ for derivation and Table 3 for estimated parameters. PET, positron emission tomography.
Scan parameters
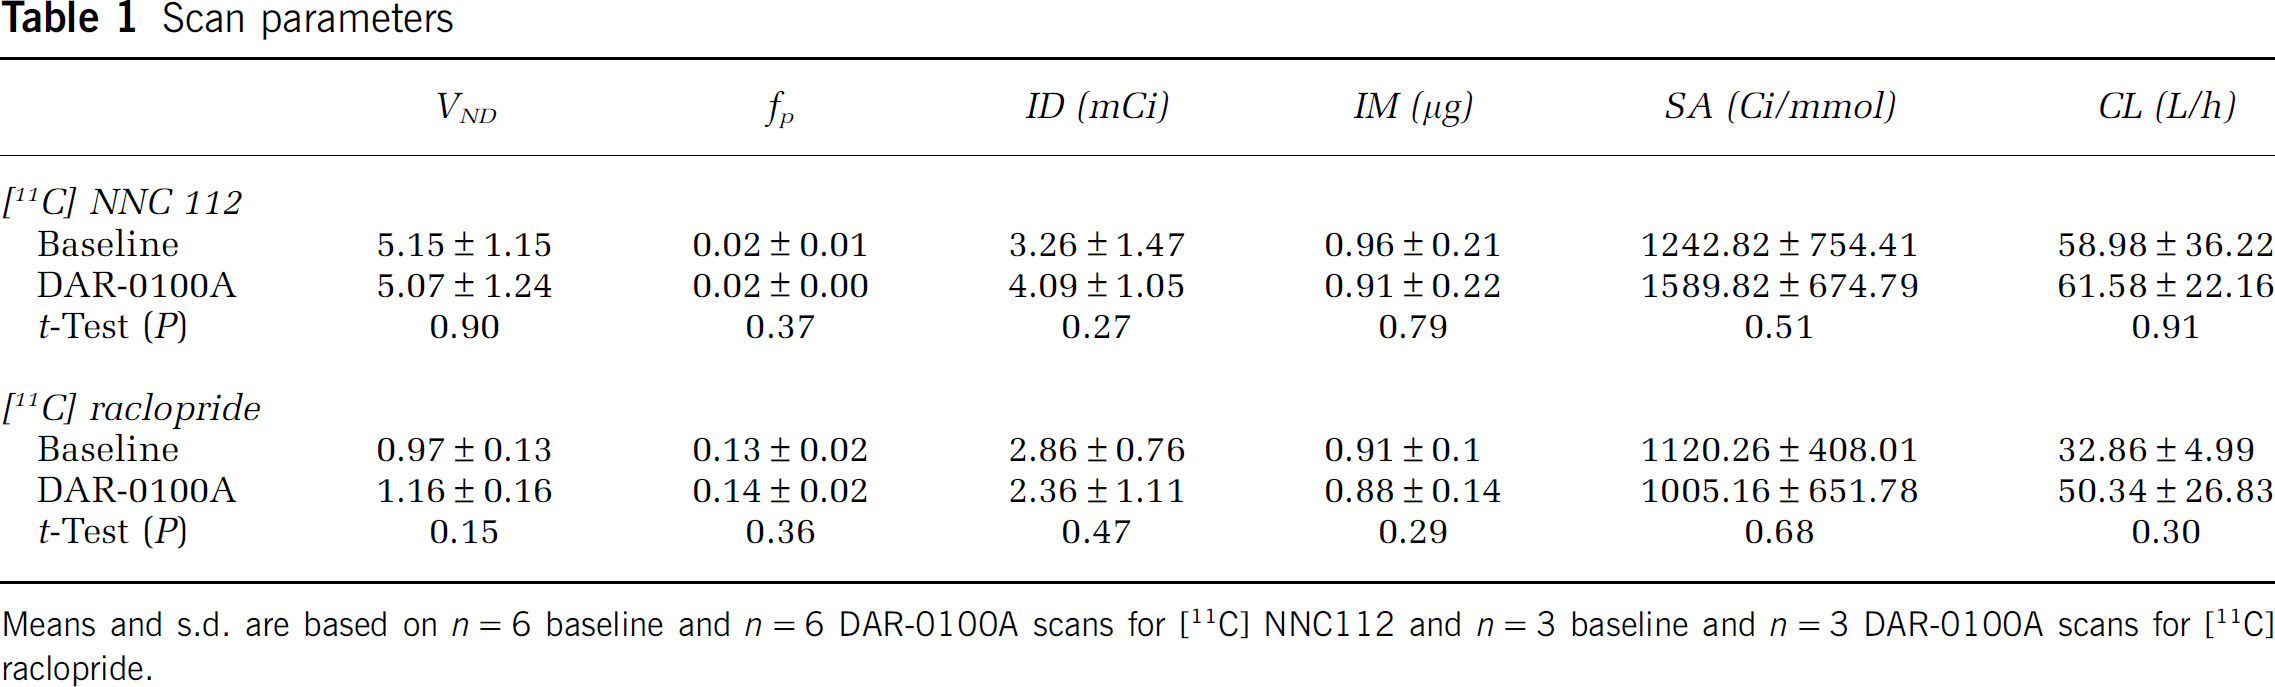
Means and s.d. are based on
[11C] NNC 112 BPND
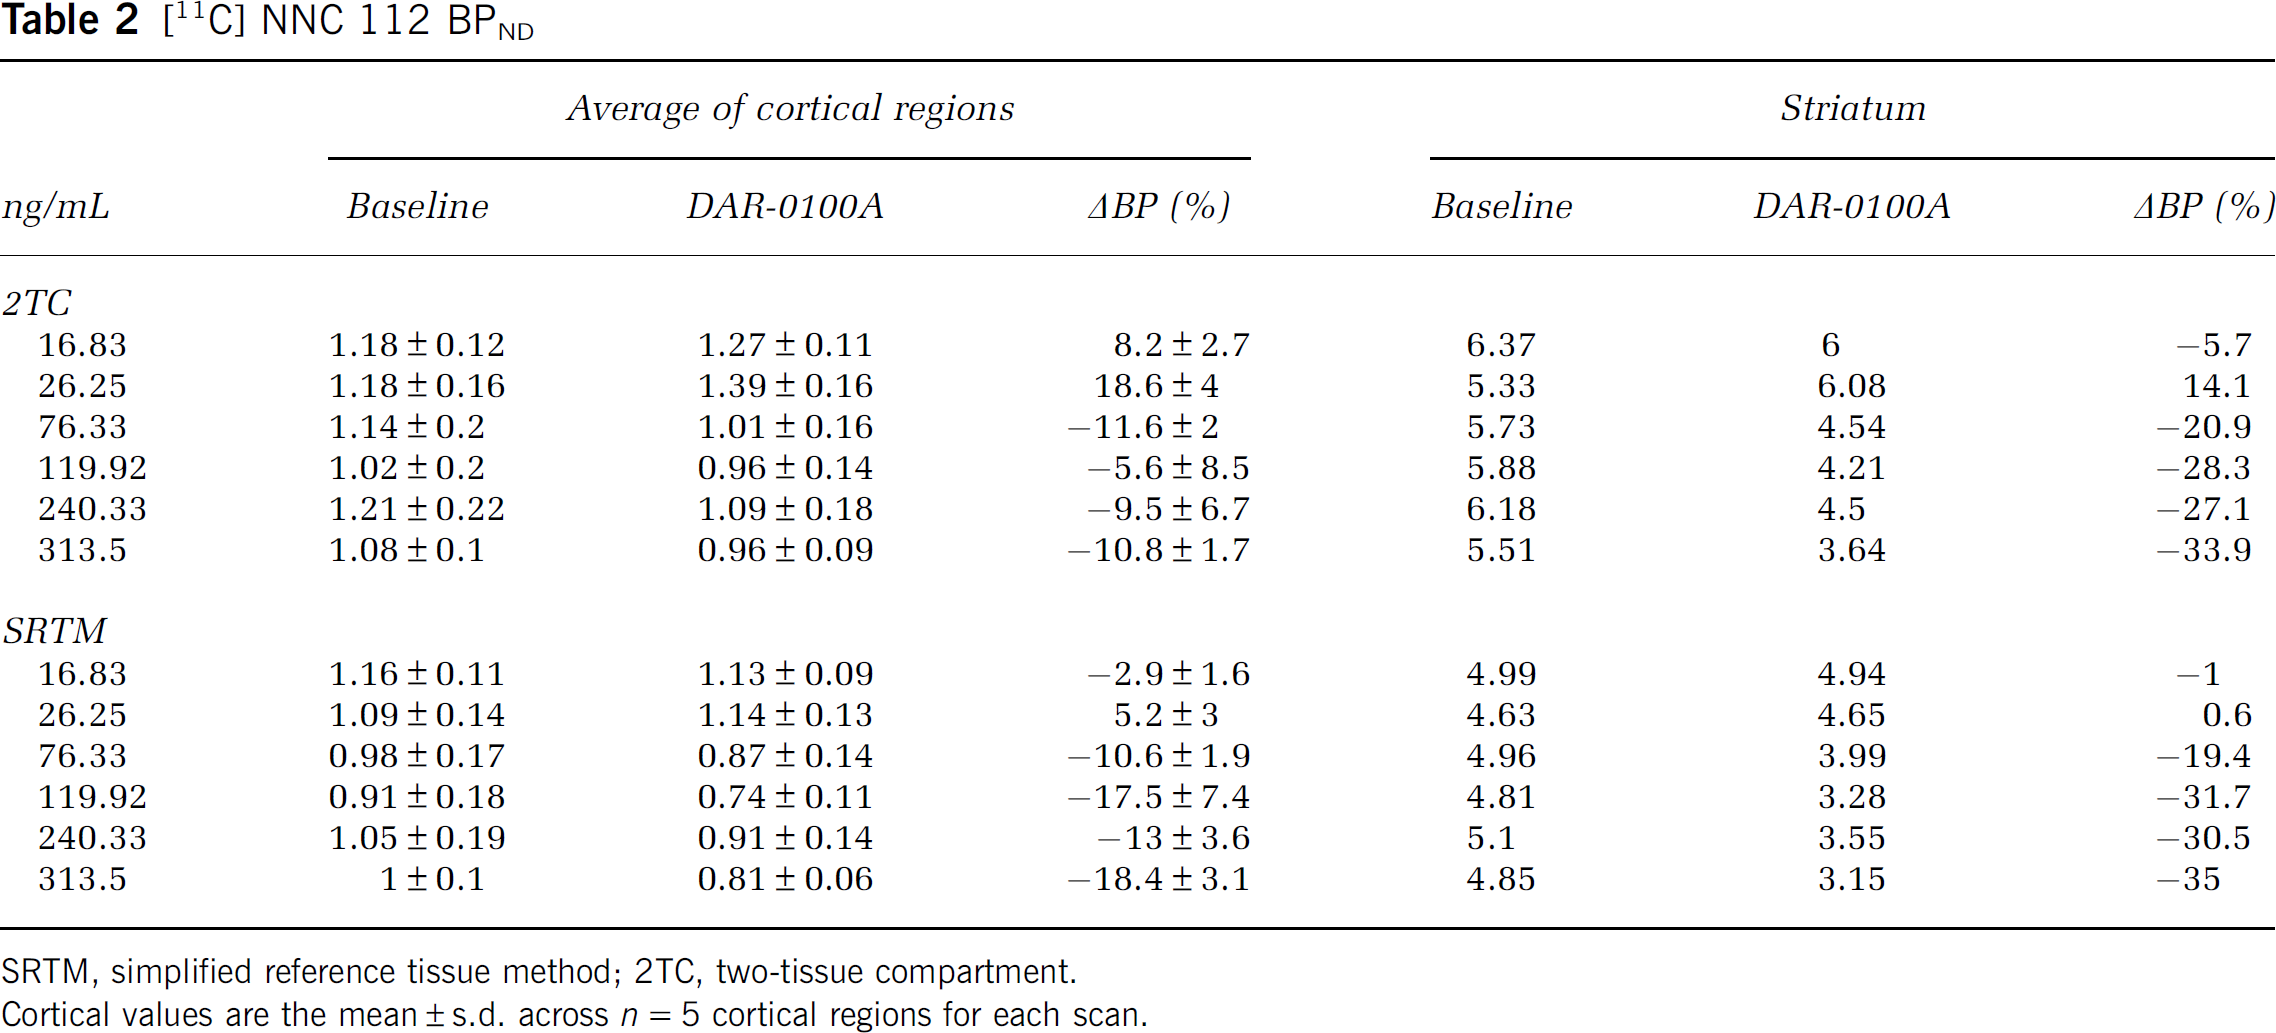
SRTM, simplified reference tissue method; 2TC, two-tissue compartment.
Cortical values are the mean ± s.d. across
Occupancy model estimates
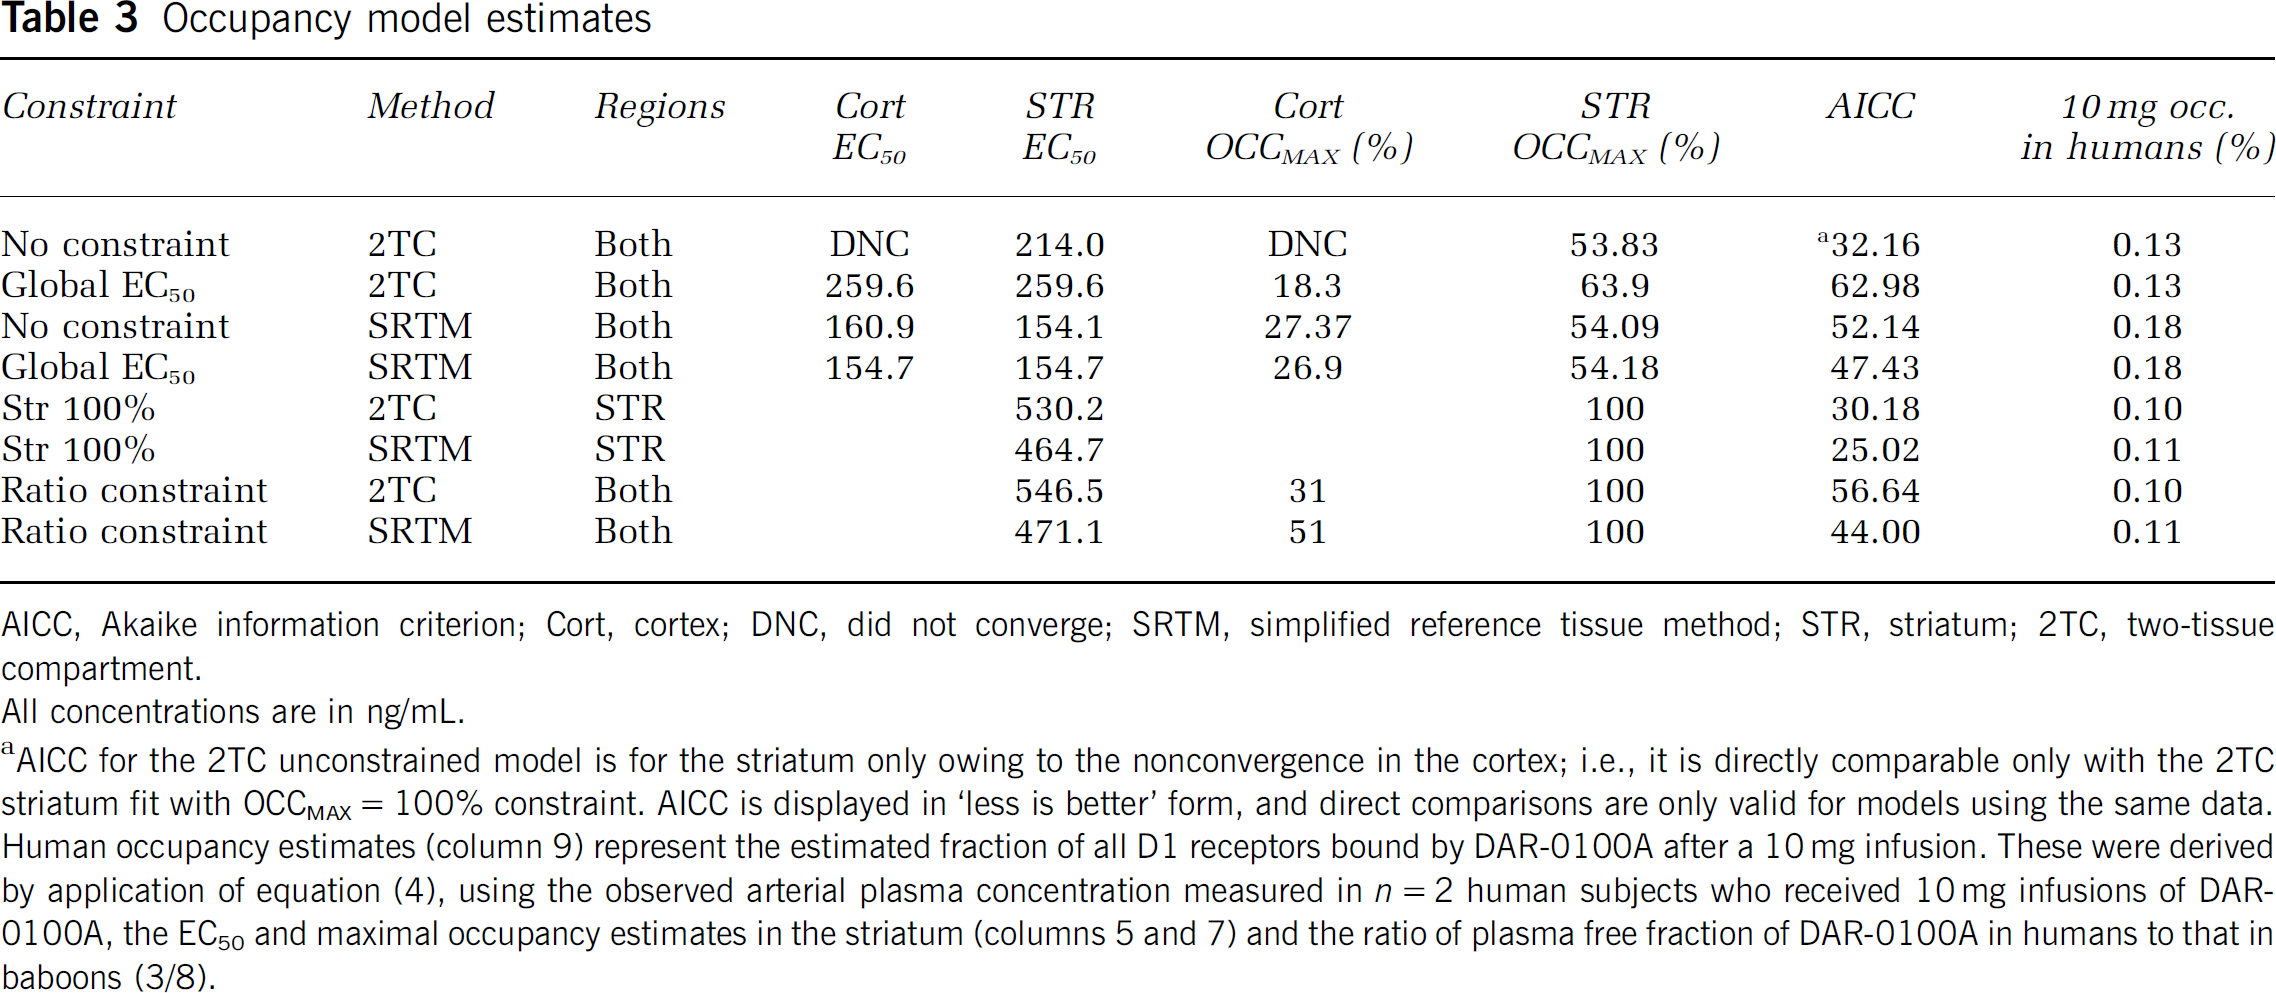
AICC, Akaike information criterion; Cort, cortex; DNC, did not converge; SRTM, simplified reference tissue method; STR, striatum; 2TC, two-tissue compartment.
All concentrations are in ng/mL.
AICC for the 2TC unconstrained model is for the striatum only owing to the nonconvergence in the cortex; i.e., it is directly comparable only with the 2TC striatum fit with OCCMAX = 100% constraint. AICC is displayed in ‘less is better’ form, and direct comparisons are only valid for models using the same data. Human occupancy estimates (column 9) represent the estimated fraction of all D1 receptors bound by DAR-0100A after a 10 mg infusion. These were derived by application of equation (4), using the observed arterial plasma concentration measured in
D2 Receptor Binding
[11C] raclopride scan parameters are presented in Table 1. There were no significant differences in any scan parameter across conditions. The average plasma concentration of DAR-0100A across the three studies was 152 ± 212 ng/mL (range: 16 to 395 ng/mL). This range was unexpectedly wide, given the concentrations observed in the [11C] NNC112 scans after comparable doses. We do not know the cause for this, but in the absence of evidence of experimental or measurement error, we included all data for completeness. In contrast to [11C] NNC112, DAR-0100A had only a small effect on the rate of metabolism of [11C] raclopride in arterial plasma that reached the trend level (
Discussion
The main findings of this study are as follows: (1) A clear concentration–occupancy relationship was observed between DAR-0100A plasma levels and D1 receptor occupancy measured as ΔBPND, but high concentrations, relative to feasible doses for humans, were necessary to reach detectable levels of occupancy; (2) there was no detectable binding of DAR-0100A to D2 receptors at similarly high concentrations; (3) without the application of a constraint to the concentration–occupancy relationship, the estimated maximal occupancy was <100% and the EC50 estimates covered a large range (154 to 547 ng/mL, Table 3) depending on which model was used, suggesting a ‘ceiling effect’ of <100% occupancy of D1 receptors; and (4) finally, although we did expect,
(1) D1 Occupancy
Tables 2 and 3 and Figure 4, especially results in the striatum, show clearly that D1 occupancy was an increasing function of DAR-0100A plasma concentration. To our knowledge, this is the first demonstration
However, plasma concentrations required to reach detectable D1 occupancy were high, and likely to be much higher than those in humans, based on the doses administered to humans to date (George et al, 2007). Low occupancy may be related, in part, to the small plasma free fraction of DAR-0100A measured in this study (< 1%). Free fractions this low are difficult to measure with high precision, but the measurements were of similar order of magnitude in humans and baboons, suggesting that low free fraction would have a similar effect on the concentration–occupancy relationship in both species. Recently, we administered 10 mg infusions of DAR-0100A to two human subjects and observed DAR-0100A plasma concentration of 1.4 ± 0.5 ng/mL (AA, unpublished data). The free fraction of DAR-0100A in human arterial plasma, based on our data, is 3/8 as large as that in baboon arterial plasma. On the basis of EC50 and OCCMAX estimates in Table 3, and assuming similar blood–brain barrier permeability, this plasma level would lead to D1 occupancy in the range of 0.1% to 0.2%. Thus, all models predict a very small fraction of D1 receptor occupancy with human dosing. At present, the level of D1 receptor occupancy by DAR-0100A necessary for cognitive improvements is not known. However, there is some indication from preclinical studies that, at least with some D1 agonists, the necessary occupancy level may be extremely low. Castner et al (2000) administered very small quantities (10−5 to 10−4 mg/kg intramuscularly) of the D1 agonist ABT 431 sub-chronically to monkeys with chronic haloperidol-induced spatial working memory deficits, and detected quantifiable, long-lasting improvements. The appropriate level of receptor binding necessary for a given level of response is a function of the interaction between receptor and ligand and could vary across ligands (Kenakin, 1986; Weiss et al, 1996a); therefore, a direct measurement of cognitive effects will be necessary to determine whether there is a DAR-0100A dose that leads to detectable cognitive improvement in patients with schizophrenia. However, given that test–retest reproducibility of human striatal [11C] NNC112 BPP and BPND are both ∼15% (Abi-Dargham et al, 2000b), PET imaging of DAR-0100A receptor occupancy in humans can be expected to yield effect sizes on the order of 0.01, which cannot be reliably measured.
(2) D2 Occupancy
In this study, [11C] raclopride binding was unaffected by very high doses of DAR-0100A. The mean plasma concentration of DAR-0100A during [11C] raclopride scans was 152 ng/mL, which is 100-fold greater than that observed in humans receiving 10 mg of DAR-0100A. At this concentration, models in Table 3 predict D1 receptor occupancy to be between 24 and 37%. Thus, it can be expected that occupancy of D2 receptors will remain negligible at any dose of DAR-0100A administered to humans, and that even if doses that attain sizable D1 occupancy can be achieved safely, they will still lead to virtually no D2 occupancy.
(3) Ceiling Effects and the Choice of Occupancy Model
The estimates of the pharmacokinetic parameter EC50 varied considerably according to whether the constraint that full occupancy was attainable was invoked. Given the wide range of EC50 estimates, it is important to compare the relative accuracy of the various methods. Statistically, models with maximal striatal binding constrained to 100% were more favored by the Akaike information criterion, indicating more parsimonious explanation of the data (Table 3). Maximal occupancy is difficult to estimate accurately in the absence of measurements showing occupancy close to the putative maximum, i.e., in the upper arm of the curves in Figure 4, over a wide range of ligand concentrations. However, it was not possible to increase DAR-0100A concentrations beyond those used in this study because of the peripheral effects on blood pressure. Although a purely statistical interpretation favors full occupancy models, models predicting a ceiling effect are also consistent with the possibility that a fraction of D1 receptors available for [11C] NNC112 binding are not available to DAR-0100A binding at any concentration. A ceiling effect could be related to the following:
Multiple affinity states and ceiling effect:
As DAR-0100A is an agonist, there are likely to be multiple conformations of the receptor, some of which bind DAR-0100A with higher affinity than others. However, interconvertible affinity states alone should not limit access to these receptors at high enough DAR-0100A concentrations, and in this situation, DAR-0100A occupancy is likely to follow a one-site fit. The cubic ternary complex model provides a thermodynamically comprehensive description of the equilibrium binding of agonists to G protein-coupled receptors having multiple conformations (Weiss et al, 1996b). According to the cubic ternary complex model, the fractional occupancy of receptors by an agonist will follow a one-site fit with an apparent association constant (reciprocal of the apparent dissociation constant) equal to a weighted sum of the association constants of the agonist for various states of the receptors (active conformation or not, G protein bound or not), with weights given by the equilibrium fraction of the total receptor concentration represented by each state (Weiss et al, 1996c). When the G protein is in excess such that unbound G protein concentration is approximately constant independent of the level of agonist binding, the weighted association parameter is constant at all levels of the agonist (see Appendix A) and will tend to favor the affinity for the state that is more prevalent in the native system. When G protein availability is rate limiting, the apparent association constant can be different at each level of agonist, with the balance shifting toward the affinity for the inactive conformation (Appendix A), but because the apparent affinity shifts continuously as a function of DAR-0100A concentration, the resulting curves will be difficult to distinguish from a one-site model (Appendix A). Still, we cannot rule out the possibility that agonist binding has a low affinity component that is not rapidly interconverting and that this leads to a component of antagonist binding that cannot be inhibited without going to much higher concentrations of the agonist.
There is considerable evidence that many G protein-coupled receptors form dimers and oligomers (Lee et al, 2003; Milligan, 2004), including D1 receptors (Kong et al, 2006; Fiorentini et al, 2008). Results consistent with negative cooperativity between agonist (but not antagonist) binding to two protomers in a dimer have been reported (Kara et al, 2010). Such a scenario might also potentially lead to a relative inability of agonist to occupy the second protomer in a dimer, which might also lead to difficulty in inhibiting all antagonist binding.
Receptor internalization and ceiling effect:
It is well documented that agonist binding induces D1 receptors' internalization (Dumartin et al, 1998), and this effect has been shown in cell preparations with dihydrexidine (Ryman-Rasmussen et al, 2005). To cause a ceiling effect, this scenario would require that internalized receptors be available for [11C] NNC112 binding, but not for DAR-0100A binding. To our knowledge, this effect has not been studied in the setting of D1 receptors and DAR-0100A. A recent study examined internalization of D2 receptors and binding of D2 selective ligands (Guo et al, 2010). Five of the six antagonists tested bound to the internalized D2 receptor with relatively small alterations in affinity, whereas the charged hydrophilic antagonist sulpiride and the agonist dopamine had greatly reduced affinity for internalized receptors, consistent with their more limited penetration of the plasma membrane. Although this study was performed in a different receptor system (D2 versus D1), to the degree it can inform the current study, it suggests that many ligands are capable of binding to internalized receptors, and that both DAR-0100A and [11C] NNC112 might readily bind to internalized receptors. The requirement for a ceiling effect would be that the ratio of affinities, KD-DAR-0100A/KD-NNC112, is greatly increased for internalized receptors relative to surface receptors. In the absence of data about DAR-0100A and [11C] NNC112 binding to internalized receptors, this scenario cannot be ruled out.
In summary, although the full occupancy model is favored on statistical grounds, there are scenarios in which a ceiling effect could occur, and currently, there is insufficient experimental evidence to determine how plausible these are. Nonetheless, regardless of which model is invoked, the predicted D1 occupancy for a 10 mg dose in human would be extremely small.
(4) Differences in Regional Occupancy
Measured ΔBPND in the cortex was either 35% (2TC) or 51% (SRTM) of measured striatal ΔBPND. We did expect,
Another potential explanation of the observation of lower than expected binding in the cortex is that it is an artifact of the interaction of the radioligand kinetics with the DAR-0100A kinetics. ΔBPND, or the portion attributable to D1 in this case, can be shown to be a weighted average of the receptor occupancy by drug over the course of the scan with weight at time
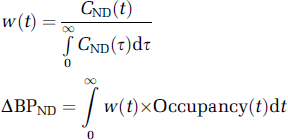
Because, owing to large differences in receptor concentration, the kinetics of the nondisplaceable component of [11C] NNC112 in the brain (
Conclusions
In this study, the dopamine D1 receptor agonist DAR-0100A was shown to compete effectively with the D1 antagonist radiotracer [11C] NNC112. A clear dose–occupancy relationship was observed, especially in the striatum where [11C] NNC112 specific binding is almost exclusively attributed to D1 receptors. Several models were used to estimate the pharmacokinetic parameters of DAR-0100A, all of which indicated that doses in the range of 10 mg will lead to < 1% receptor occupancy in humans. Binding of DAR-0100A to D2 receptors was undetectable using PET imaging with [11C] raclopride at doses that lead to D1 occupancy in excess of 30%. In conclusion, DAR-0100A in arterial plasma enters the primate brain and binds with specificity to D1 receptors, but high concentrations are required to reach quantifiable levels, such that occupancy will likely be undetectable in humans by
Footnotes
Acknowledgements
We gratefully acknowledge the expert technical contributions of Elizabeth Hackett, John Castrillon, Sung A Bae, and Xiaoyan Xu, PhD.
The authors declare no conflict of interest.
Appendix A
One of the main results of the cubic ternary complex model (Weiss et al, 1996c) is the following expression for the apparent association constant of an agonist ligand that binds to a G protein-coupled receptor with multiple affinity states:
where [G] is the surface concentration of the unbound G protein and the parameters are defined as follows:
The assumption that all of these lead to increased affinity is equivalent to
From the form of equation (A1), it is apparent that when [G] is large enough such that it is relatively unchanged at different concentrations of agonist, that
where [A] is agonist concentration and [AR] the agonist-receptor complex. When [G] is rate limiting, say [G] < [
where [
which is an increasing function of [G] when βδ is > 1, which in turn follows from the assumptions that the G protein favors the active conformation and that there is positive synergy when both the G protein and the agonist are bound to the receptor. As [G] decreases as [A] increases, the weight of the overall apparent association constant can be seen to shift toward the inactive form. This latter fact can be shown analytically (d[G]/d[A] < 0 under the stated assumptions) but can also be seen intuitively: as the agonist and the G protein each induce increased affinity of the other for receptor, the more agonist there is bound (the higher [A] is), the more G protein will be bound, and when total G protein is finite, the unbound form [G] will decrease with increasing bound G protein.
References
Supplementary Material
Please find the following supplemental material available below.
For Open Access articles published under a Creative Commons License, all supplemental material carries the same license as the article it is associated with.
For non-Open Access articles published, all supplemental material carries a non-exclusive license, and permission requests for re-use of supplemental material or any part of supplemental material shall be sent directly to the copyright owner as specified in the copyright notice associated with the article.