
Abstract
Contrary to the intense debate about brain oxygen dynamics and its uncoupling in mammals, very little is known in birds. In zebra finches, picosecond optical tomography with a white laser and a streak camera can measure
Keywords
Introduction
Unlike other organs, the brain of mammals and birds is a constant energy sink, consuming energy irrespective of whether it is at rest or active, but on the other side of the coin is its low tolerance to a long list of ‘perturbations’, such as hypoglycemia, hypoxia, hypercapnia, hyperthermia, and mitochondrial diseases (Siesjö, 1978; Mottin et al, 2003). The coupling between transport and metabolism allows the balance between the storage and the production of adenosine triphosphate, despite the very high rate of combustion of glucose with ~5.5 dioxygen molecules per glucose molecule (Siesjö, 1978; Sokoloff, 2001). This steady state is an oscillatory regime that is poorly understood, and low frequencies have been observed in various cerebral parameters reversibly suppressed by hypercapnia (Steinmeier et al, 1996; Biswal et al, 1997; Fox and Raichle, 2007). When activation occurs, step responses are complex (Kasischke et al, 2004; Niven and Laughlin, 2008; Petzold et al, 2008; Vanzetta and Grinvald, 2008) and induce changes in blood flow and oxygen transport (Ress et al, 2009). The coupling of perfusion and oxidative metabolism in the resting brain has been shown to be disrupted in the first minute after the onset of a sudden functional challenge (Kasischke et al, 2004; Niven and Laughlin, 2008; Petzold et al, 2008; Vanzetta and Grinvald, 2008). This uncoupling has also been a major problem for the interpretation of brain imaging (Vanzetta and Grinvald, 2008). To better understand the link between tachymetabolism and this uncoupling, we developed a method for measuring the full time course of oxygen transport in the higher-order auditory region of the telencephalon in the zebra finch,
The reliability of optical measurements of changes in the concentration of hemoglobin in tissues has been a challenge for several years (Vanzetta and Grinvald, 2008; Calderon-Arnulphi et al, 2009). Owing to its noninvasive nature, transcranial optical cerebral oximetry (near infrared spectroscopy, diffuse optical tomography, etc.) has become a source of quantitative or semiquantitative information about brain oxygenation, cerebral blood flow, and volume. However, continuing technical controversies about signal derivation, accuracy, precision, and quantitative ability have limited the application of transcranial optical cerebral oximetry. Clearly, transcranial optical cerebral oximetry still needs developments. Recent ultrafast technological advancements have opened up a new promising avenue in neuroscience (Gibson et al, 2006; Vignal et al, 2008; Montcel et al, 2005, 2006; Pifferi et al, 2008; Liebert et al, 2004; Selb et al, 2006).
As part of our broader effort to develop a noninvasive neuro-method and to improve quantitative measurement of absorbing chromophores into scattering brain tissues, we worked on a time domain-based device. Using a white-light supercontinuum or ‘white laser’ (Chin et al, 1999), we combined picosecond optical tomography (POT) with near-infrared spectroscopy (spectral-POT) (Vignal et al, 2008) and a new POT with contact-free spatial imaging (spatial-POT). In the near-infrared spectral window of 650 to 850 nm, the nonmonotonic behavior of the absorption spectrum of deoxyhemoglobin (Hb) provides reliable ‘molecular fingerprints’ (Vignal et al, 2008). Furthermore, optical signals are integrated into a selected picosecond time-of-flight window specifically defined so as to probe only the targeted deep brain structures (Vignal et al, 2008). This system allows us to monitor
Having developed a spectral-POT, we have previously been able to measure oxyhemoglobin (HbO2) and Hb changes following hypercapnia (Vignal et al, 2008). We now address the task of mapping the acoustic field with the best possible spatial resolution to show that POT is able to reproduce classic neuroscience results and to measure for the first time the full time course of coupling/uncoupling in small songbirds.
Materials and methods
Animals and Stimulation Protocols
Adult male zebra finches (
Animal preparation and the spectral-POT setup have been described previously (Vignal et al, 2008). Anesthetized zebra finches with the head previously plucked (3 days before experiments) were fixed in a stereotaxic frame (Stoelting Co., Wood Dale, IL, USA, adaptations for birds). Body temperature was kept within a narrow range (39°C to 40°C) using a feedback-controlled heating pad. Optical fibers were fixed into stereotaxic manipulators (Stoelting Co.) and placed directly on the skin. Positions of the input optical fiber F1 providing illumination and those of the optical fiber F2 collecting transmitted light were chosen to probe the auditory regions of the telencephalon (field L, NCM (caudomedial nidopallium), and CMM (caudomedial mesopallium)). The precise anatomic localization of the optical fiber (Figure 1 in Ramstein et al, 2005) and probed region (Figure 1 in Vignal et al, 2008) has been described in previous studies. The head of the bird was turned until the beak (rostral extremity) was perpendicular to the body plane. This position allowed us to define a stereotaxic origin point (0, 0, 0) defined by the intersection of the vertical plane passing through the interaural line and the sagittal suture (the vena cerebralis dorsocaudalis). The stereotaxic axes were chosen according to this origin point. F1 was placed more rostrally on the right hemisphere than F2. The distance between F1 and F2 was 5 mm (Figure 1). The chosen coordinates in millimeters were: F1 (2.0, 5.4, −2.7) and F2 (2.0, 0.4, −0.3).
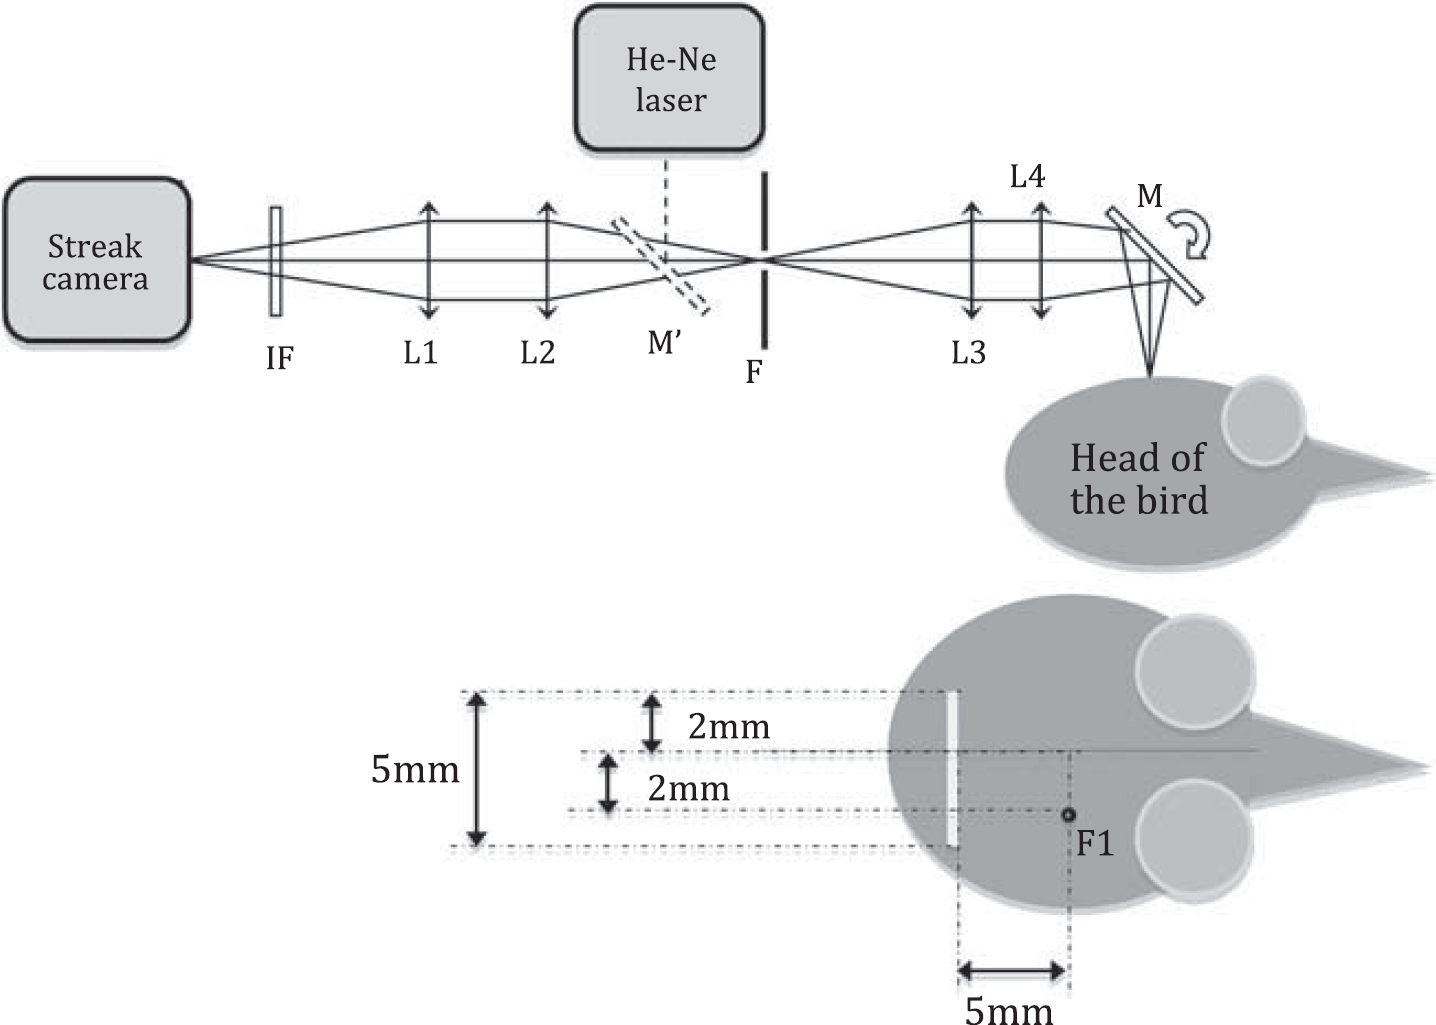
The imaging setup based on two lenses (L4 and L1) conjugates the surface of the skull with the plane of the slit of the streak camera. An afocal system made of two lenses (L2 and L3) is placed between the two imaging lenses. The slit (F) is placed at the focal point of the afocal system. The position of the 5-mm-long segment on the head of the bird can be controlled by eye, by shining a He-Ne laser through the intermediate slit and adjusting the position of its image on the skull (with mirror M). A narrow bandwidth filter (IF) is placed just before the streak camera. The 5-mm-long segment is located 5 mm away from the white-laser input optical fiber (F1).
Animals were kept in a custom-made sound-attenuated box (48 × 53 × 70 cm3) equipped with 2 fixed high-fidelity speakers (Triangle Comete 202, Triangle SAS, Villeneuve Saint Germain, France). After a 1-minute baseline period, each bird was subjected to a 20-second stimulus, followed by 1 minute for recovery of baseline. The original auditory signal was a random sequence of songs and calls recorded in the zebra finch aviary, normalized to the same intensity. Among the 20 seconds of stimulus recorded, 94% represented songs and calls, whereas 6% represented silence. For each animal, 15 stimuli were used, with 9 random white-noise stimuli. After experiments, all animals were kept in the recording room for 24 hours for physiologic and behavioral verifications. All experimental procedures were approved by the University's animal care committee. Statistical methods have been described previously (Vignal et al, 2008) (multiple comparison procedure, one-way ANOVAs (analyses of variance) for repeated measures, Tukey–Kramer test, Statistics toolbox, Matlab, The Mathworks, Natick, MA, USA). The variation of the time-resolved transmittance spectrum was also fitted to the spectra of HbO2 and Hb known in mammals by classic linear least-squares procedure. The same procedure was applied to calculate variations in the concentration of HbO2 and Hb. These concentration variations could be expressed using an absolute scale (μmol) because our time-resolved detection system could measure the mean optical path through the bird's head owing to the mean arrival time of photons (Vignal et al, 2008).
Experimental Setup of Spatial-Picosecond Optical Tomography
We used the same setup and the same laser fiber position as described previously (Vignal et al, 2008), with the omission of the polychromator and with an imaging system between the head of the animal and the streak camera (Hamamatsu Streakscope C4334, Hamamatsu, Bridgewater, NJ, USA). The imaging setup based on two lenses (L4 and L1) (100 mm focal length) optically conjugated the surface of the skull with the plane of the entrance slit of the streak camera (Figure 1). An afocal system composed of two lenses (L2 and L3) (100 mm focal) was placed between the two imaging lenses, and a slit (F) was put at the focal point of the afocal system. This slit was optically conjugated with the entrance slit of the streak camera, resulting in a great simplification of the alignment procedure and in the possibility of controlling the intensity of the light by narrowing the slit as well. The magnification of the setup was 1. Intrinsic filtering properties of the imaging setup enabled to collect only the photons emerging from a 5 mm-long segment located 5 mm apart from the fiber (Figure 1). We put a narrow bandwidth filter (IF) (10 nm full-width half-maximum) centered at 700 nm, at which the difference of absorption between the two hemoglobin species was maximal. The position of the imaged segment on the head of the bird could be controlled by eye by shining the intermediate slit with a He-Ne laser and by checking and adjusting the position of its image on the surface of the head (mirror M). The spatial resolution along the slit was determined by imaging a white sheet of paper half covered with black ink. The image consisted in the response of the system to a Heaviside step and characterized the spatial resolution of the setup. Its resolution along the slit was nearly 250 μm.
The single shot streak camera measured the propagation time of the photons through tissues. All measurements were carefully corrected from shading effects. Each measurement consisted in a frame integrating 33 laser pulses. The 5-mm-long segment (of 150 μm thickness) was imaged onto the slit of the streak camera and at the end, transformed to 640 pixels. The 2.1-nanosecond deflection time was converted to 480 pixels. The temporal resolution of the system was set by the temporal width of the trace on the CCD camera of a femtosecond pulse. Instrument response function was obtained by directly sending a leaking of a femtosecond laser pulse. Owing to the jitter (with 33 laser pulses), the resolution was 25 picoseconds (6 pixels).
An advantage of this setup comes from the possibility of contact-free measurements. The versatility of the optical design we implemented has another interesting advantage in terms of imaging. In the near future, by simply tilting the M mirror, we will sweep the imaging segment. This possibility is way more flexible than fiber bundles and leads to a narrower spatial resolution, not limited by the diameter of the optical fibers, but only by the numerical aperture and the properties of the optical setup.
Results
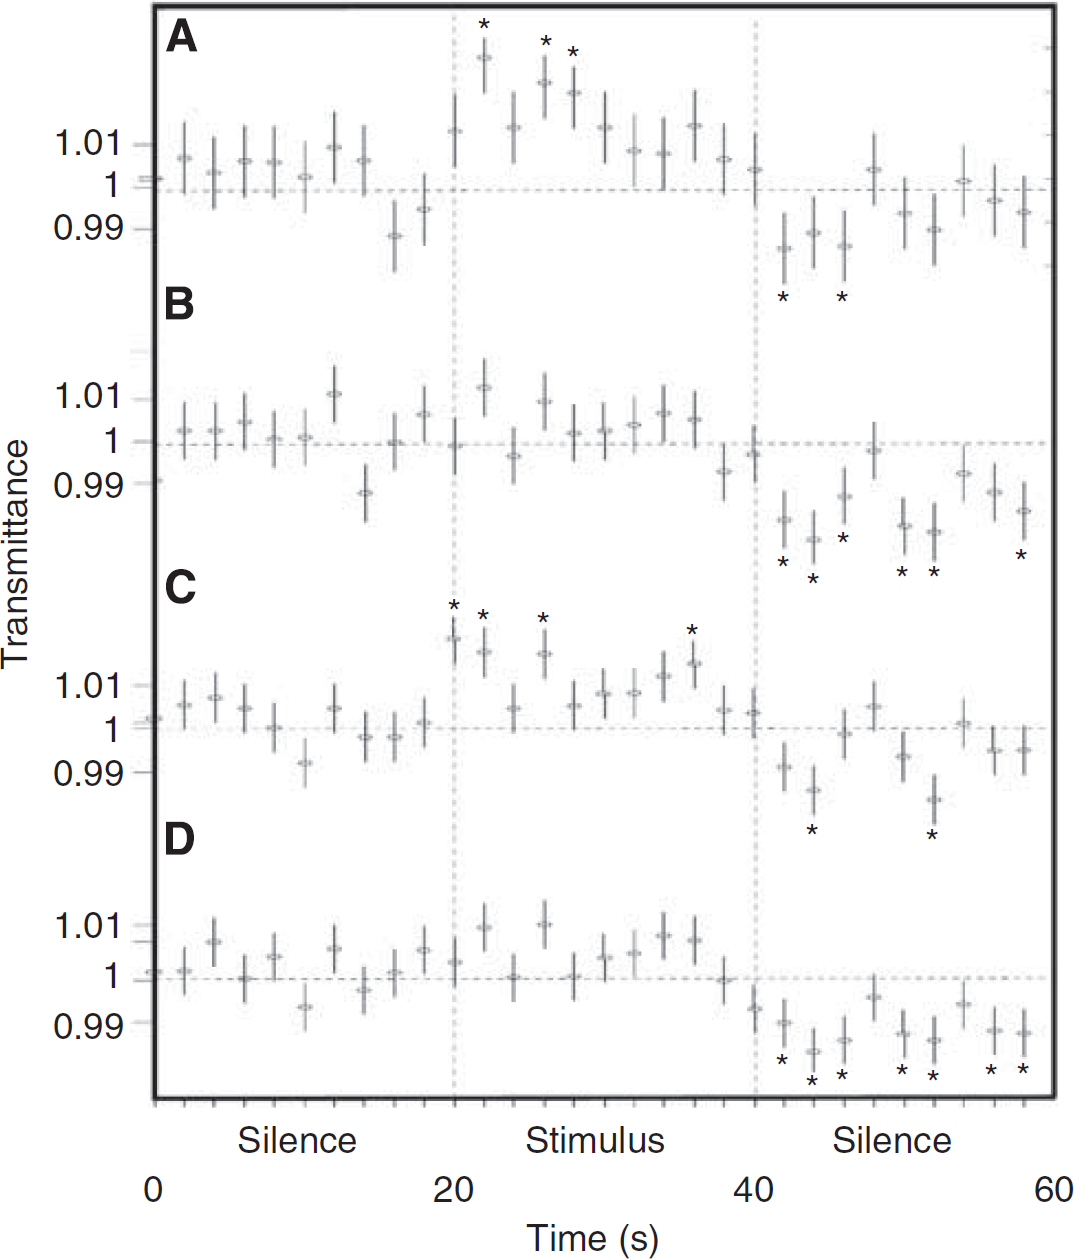
Figure 2 shows the full time courses of picosecond time-resolved transmittance measured by spectral-POT (Figure 2A) and by spatial-POT (Figure 2B). The shape of the time courses and the level of variation of transmittance were equivalent for spatial-POT and spectral-POT. The maximum change in transmittance induced by the auditory stimulus was 1.03. To establish a calibrated functional technique, acoustic response experiments were carried out under the same conditions as the 7% normoxic hypercapnic experiments (Vignal et al, 2008). The functional signal under these conditions was found to be equivalent to 10% of the hypercapnic changes (Vignal et al, 2008). Our results showed that the dynamics of these physiologic changes required at least a 2-second time resolution (Figures 2 and 3). Significant Hb and HbO2 changes were obtained by linear unmixing (Vignal et al, 2008) and were analyzed with a 0.667-second time resolution. During the 2 seconds following the onset of acoustic stimuli, Hb and HbO2 levels significantly decreased to −0.7 and −0.9 μmol/L, respectively (Figure 3). The HbO2 level then increased significantly (during 12.4 seconds, 100 concentration measurements) to reach a plateau of 0.3 μmol/L (
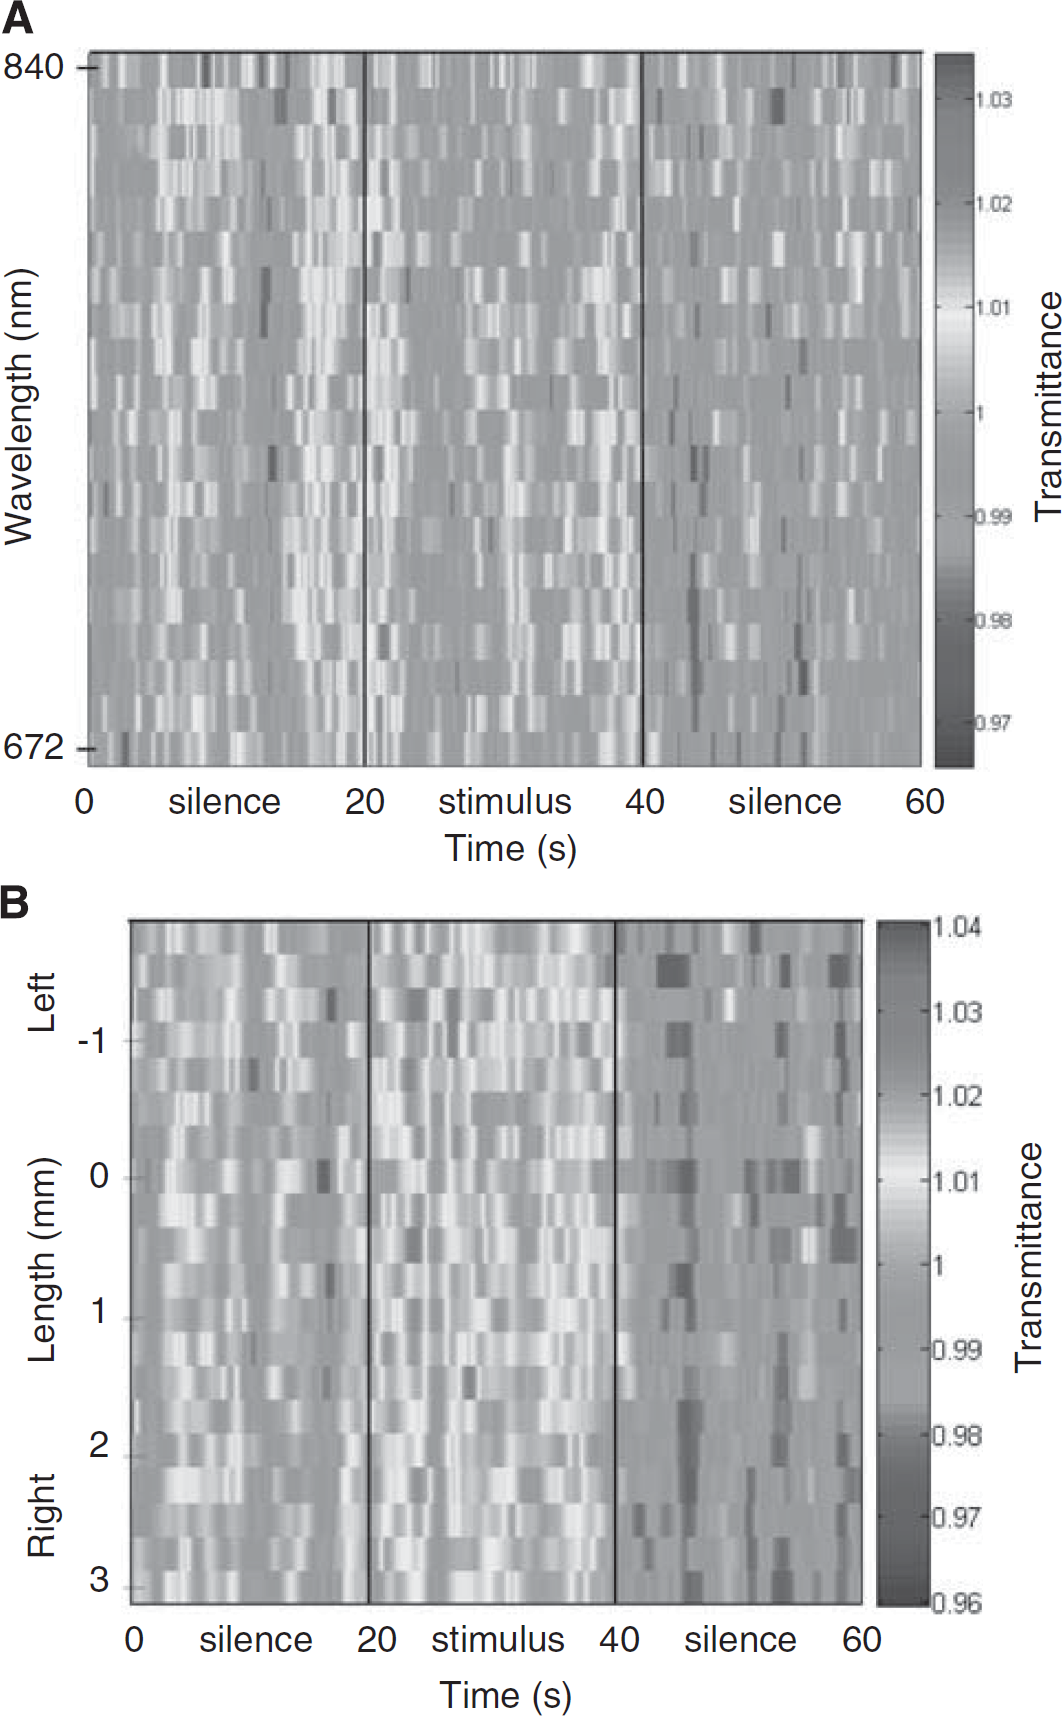
Time course of the picosecond time-resolved transmittance. (
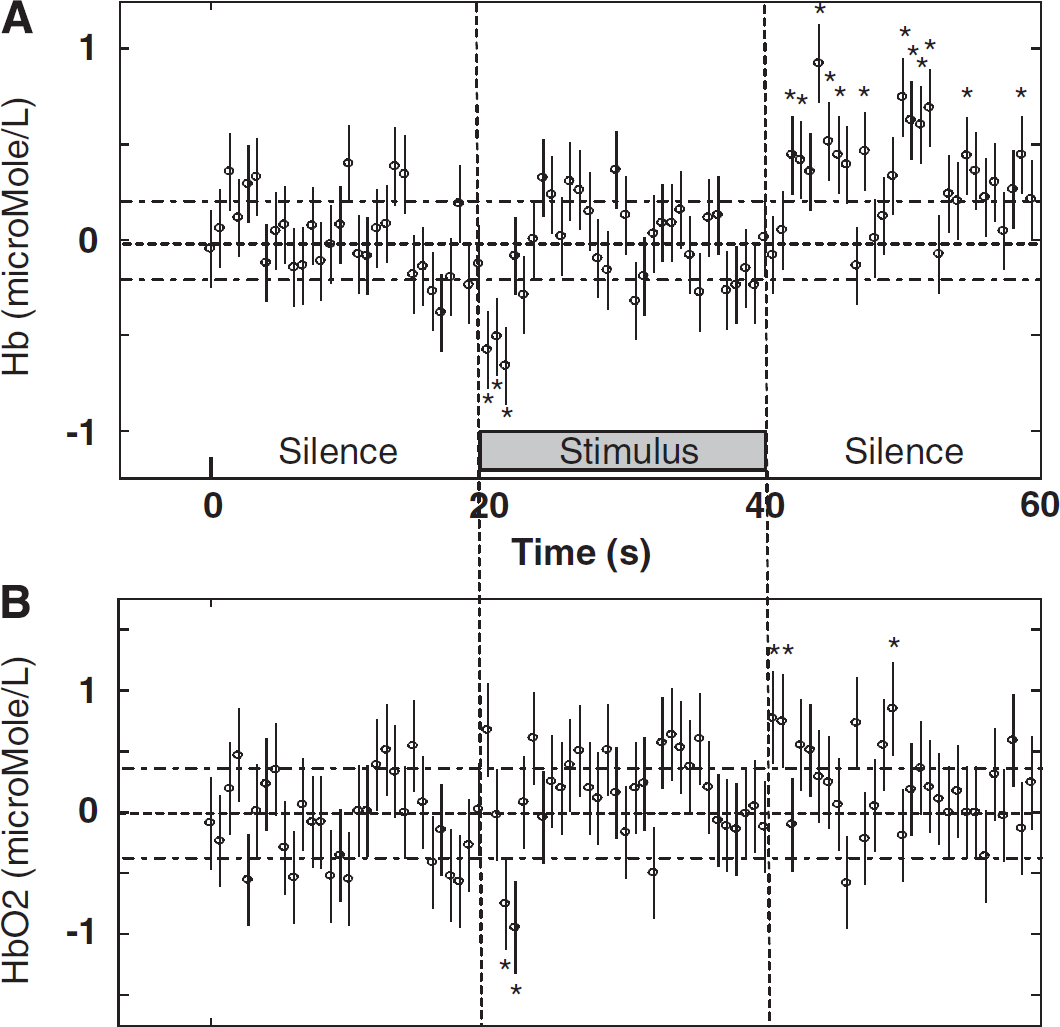
Hb and HbO2 concentration changes. (
Changes were significantly localized (Figures 2B and 4A) above the auditory forebrain areas (such as the NCM, field L, CMM). A small contribution could have derived from the hippocampus (dorsal and posterior areas) (Vignal et al, 2008). Furthermore, there was a significant bilateral increase in transmittance (Figure 4A) when compared with more lateral positions (2.75 and 3 mm). During the poststimulus period (Figure 4B), all areas showed significant decreases in transmittance when compared with the rest period. These results show that recoupling was less localized than uncoupling. Compared with more lateral positions and within the stimulation period, a significant bilateral increase was observed. In contrast, a significant bilateral decrease was observed within the poststimulus period. Furthermore, the number of Hb and HbO2 pulses was less high for the auditory-hippocampal areas (0.25 to 1.25 mm and −0.25 to −1.25 mm, respectively) than for the more lateral positions, showing that recoupling was faster in these areas (Figures 2B and 5).
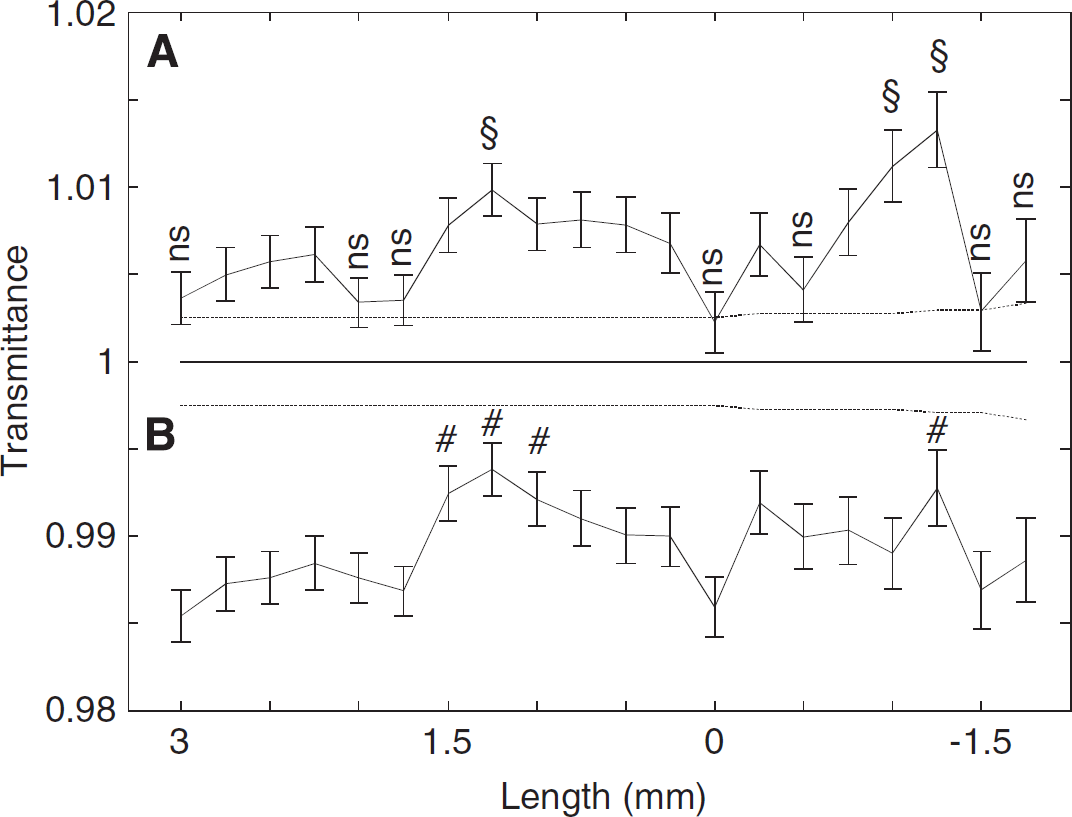
Spatial-POT transmittance changes. Spatial-POT averaged 20-second-long transmittance changes for (
Time course of spatial-POT transmittance. Time course of transmittance measured by spatial-POT at four positions (
Discussion
Our study shows for the first time the changes of blood oxygen in a small songbird during stimulation
Comparisons between BOLD spatiotemporal parameters and POT parameters
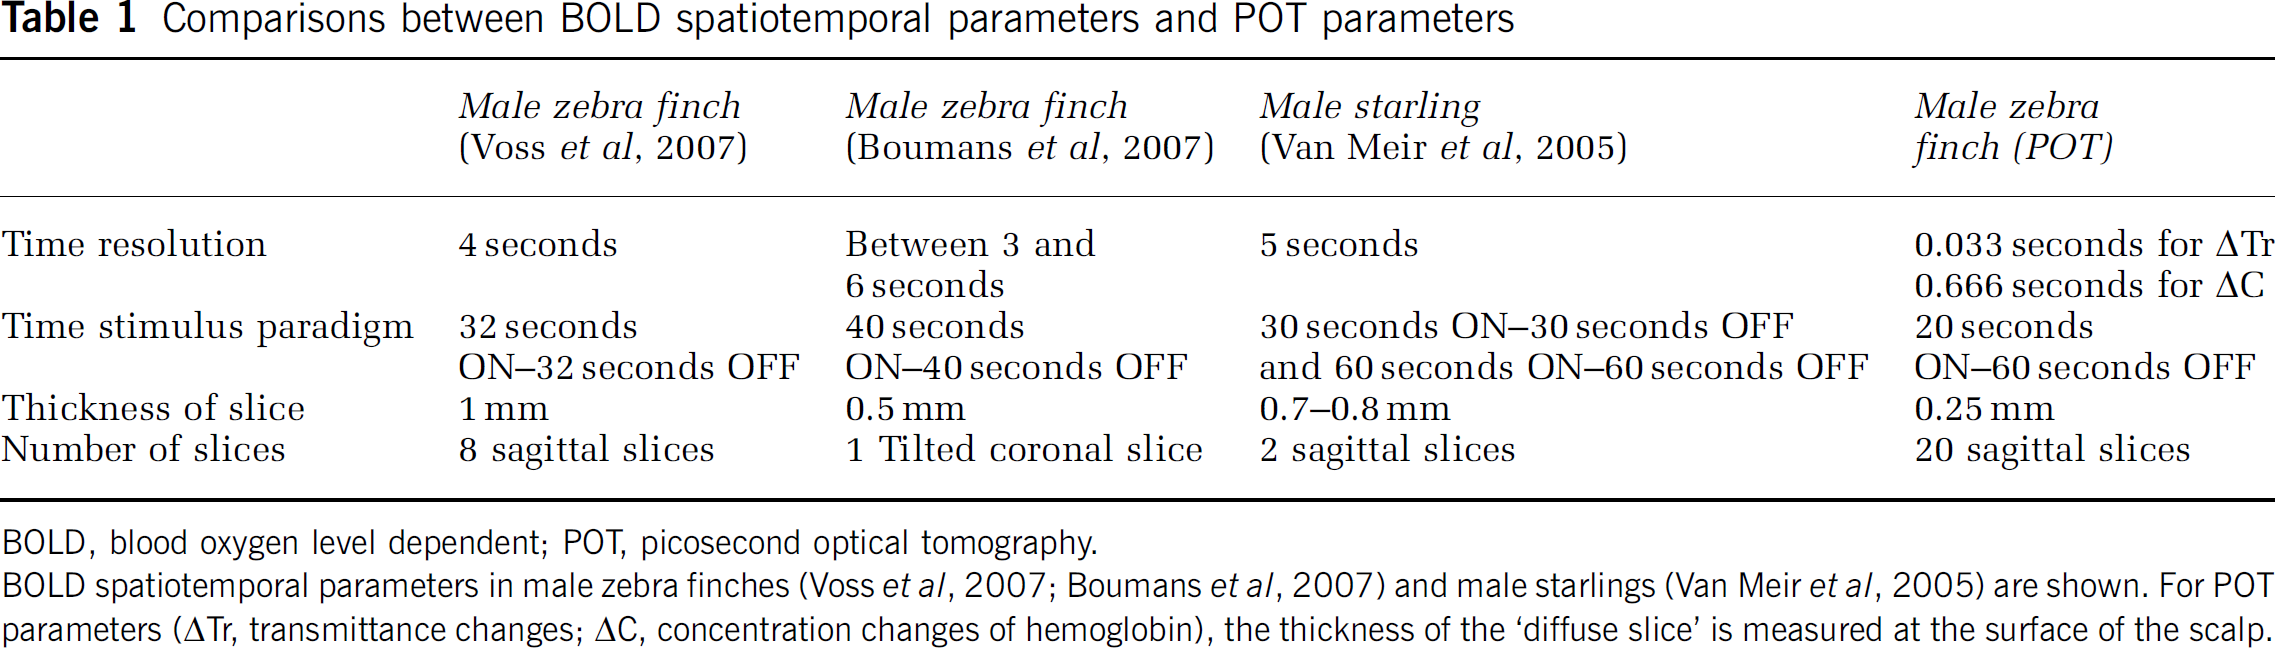
BOLD, blood oxygen level dependent; POT, picosecond optical tomography.
BOLD spatiotemporal parameters in male zebra finches (Voss et al, 2007; Boumans et al, 2007) and male starlings (Van Meir et al, 2005) are shown. For POT parameters (ΔTr, transmittance changes; ΔC, concentration changes of hemoglobin), the thickness of the ‘diffuse slice’ is measured at the surface of the scalp.
The diffuse optical method has the potential to differentiate hemoglobin dynamics; however, they have limited spatial resolution. Conversely, BOLD functional magnetic resonance imaging has achieved high spatial resolution but is more susceptible to limited ability to monitor hemoglobin dynamics. The BOLD time courses exhibit a sharp increase and an overshoot at the beginning of the stimulus and an undershoot during the poststimulus period. The BOLD undershoot reveals two oscillations that have not been discussed previously, and these poststimulus BOLD pulses are more pronounced in field L than in the NCM (Voss et al, 2007; Boumans et al, 2007). As known in mammals, we showed (Figure 6) that in birds there was a direct link between the BOLD signal and minus Hb (–Hb). However, –Hb exhibited a faster response to changes in stimulus (Figure 6), suggesting that the BOLD signal is a more ‘convoluted response’ to hemodynamic than –Hb.
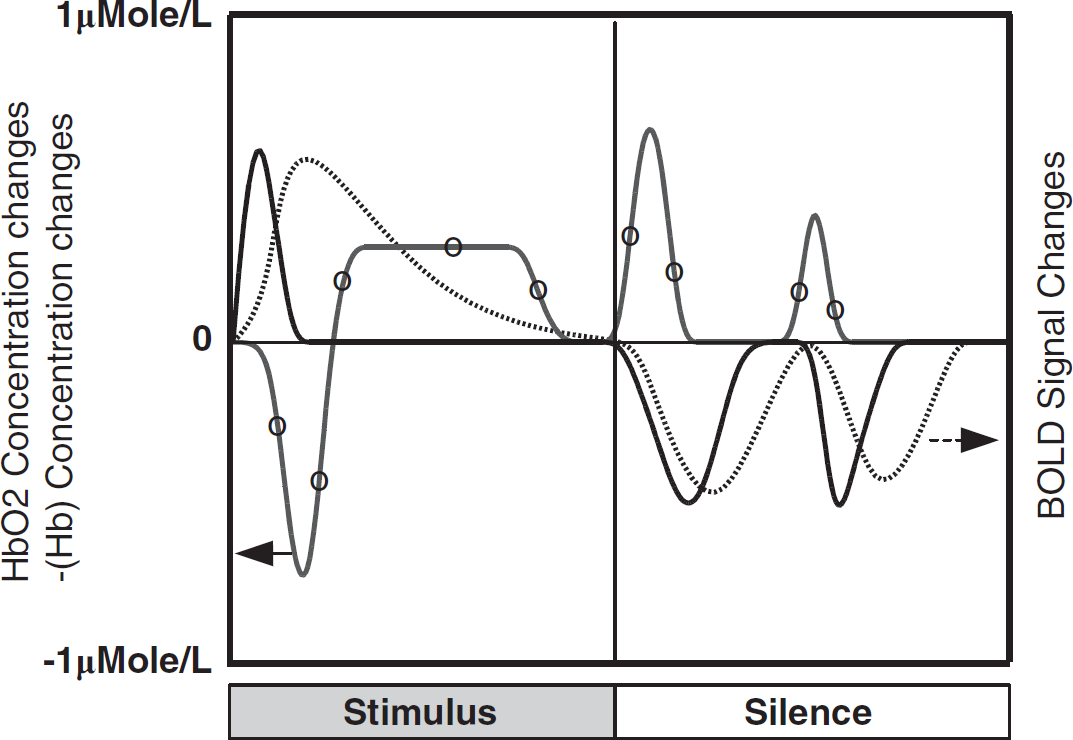
Typical time course of BOLD signal (dashed line) in zebra finches is compared with the time course of HbO2 (curve with the symbol ‘o’) and Hb concentration changes measured by POT in the caudal-medial areas. Minus Hb (–Hb) concentration is shown for better comparison with the BOLD signal. BOLD, blood oxygen level dependent; HbO2, oxyhemoglobin; POT, picosecond optical tomography.
Birds and mammals have well-pronounced pial arterial ramifications (Mc Hedlishvili and Kuridze, 1984). Birds have (1) bigger red blood cells by a factor of 3 and a far larger capillary diameter, (2) less red blood cells per volume of blood by a factor of 1/3, and (3) a hemoglobin concentration in red blood cells comparable with that of small rodents (Altman and Dittmer, 1971). The pial angioarchitecture and hematological features of tachymetabolic vertebrates appear to have converged to an equivalent oxygen supply. In mammals, the coupling of blood transport and cerebral metabolic rates in physiologically active brain states has been the subject of debate, and different theoretical models for it have been proposed (Banaji et al, 2008; Ress et al, 2009). In humans, contrary to the ‘canonical hemodynamic response function’ (used by software packages, i.e., SPM; http://www.fil.ion.ucl.ac.uk/spm), BOLD responses reveal several disparities (Aguirre et al, 1998), and some authors (Vanzetta and Grinvald, 2008; Ress et al, 2009) suggest that the differences between BOLD responses are related to differences in the properties of blood vessel networks between mammals. Despite these differences, the BOLD overshoot is always observed in the sensory systems of tachymetabolic vertebrates. Nevertheless, in the zebra finch, transient events seem to be more pronounced than in comparable small rodents, perhaps because of differences in blood vessel networks.
The biphasic changes in HbO2 (early decrease and increase) measured by POT reveal a temporal pattern similar to the biphasic response of tissue oxygen (decrease and increase) in the auditory cortex (Masamoto et al, 2003) and to the biphasic response (initial constriction followed by dilation) of isolated penetrating cerebral arterioles following an elevation of K+ or adenosine triphosphate (Dietrich et al, 2009). For the poststimulus period, recoupling seems to be more complex than expected because (1) HbO2 and Hb pulses were less localized than during activation (Figure 2B), (2) the recoupling of the activated auditory regions was faster than for other regions (Figure 5), and (3) the early HbO2 pulse arrived before the Hb pulse (Figure 3). Therefore, BOLD and POT recoupling pulses in birds seem to be more spatiotemporally structured than nonlinear ‘passive elastic sloshing’, as expected (Ress et al, 2009).
We imaged the sinus sagittalis superior (position 0 mm in Figure 2B), and no significant changes were observed during the activation period. However, this result should be considered carefully because distinguishing arterial, capillary, and venous compartments is not straightforward in optical neuroimaging (Hillman et al, 2007).
Systems with a low ratio of energy storage to energy consumption, end products, and heat generation have to respond ‘instantaneously’ to activation. The understanding of the time course of uncoupling/recoupling and spontaneous oscillations (Steinmeier et al, 1996; Biswal et al, 1997; Fox and Raichle, 2007; Ress et al, 2009) emphasize the role of nonisochoric processes in this response. Despite the constraints of an instantaneous response, the sensory systems of all tachymetabolic animals seem to be robust when faced with the ordinary perturbations they were designed to handle, but fragile when faced with unexpected or strong perturbations (Niven and Laughlin, 2008). Our approach shows the occurrence of strong reactivity in the cerebral vessels of the bird, an animal with a long lifespan (Barja and Herrero, 1998; Moe et al, 2009). Several studies (Mitschelen et al, 2009) indicate that age-related changes in vascular reactivity are important contributing factors to mild cognitive impairment in aging mammals. Contrary to the accepted dogma, the role of oxidative stress as a determinant of longevity is still open to question (Mitschelen et al, 2009; Moe et al, 2009). Our results could thus shed light on this crucial question, i.e., the link between brain aging and vascular reactivity.
Footnotes
Acknowledgements
The authors thank Clementine Vignal and Nicolas Mathevon for their technical participation and bioacoustic data. The authors also thank Colette Bouchut, Sabine Palle, and Pierre Laporte for their help.
The authors declare no conflict of interest.