
Abstract
We used magnetic resonance imaging (MRI) to investigate the temporal dynamics of changes in water diffusion and blood oxygenation level-dependent (BOLD) responses in the brain cortex of eight subjects undergoing visual stimulation, and compared them with changes of the vascular hemoglobin content (oxygenated, deoxygenated, and total hemoglobin) acquired simultaneously from intrinsic optical recordings (near infrared spectroscopy). The group average rise time for the diffusion MRI signal was statistically significantly shorter than those of the BOLD signal and total hemoglobin content optical signal, which is assumed to be the fastest observable vascular signal. In addition, the group average decay time for the diffusion MRI also was shortest. The overall time courses of the BOLD and optical signals were strongly correlated, but the covariance was weaker with the diffusion MRI response. These results suggest that the observed decrease in water diffusion reflects early events that precede the vascular responses, which could originate from changes in the extravascular tissue.
Introduction
Although functional magnetic resonance imaging (fMRI) using the blood oxygen level-dependent (BOLD) effect (Kwong et al, 1992; Ogawa et al, 1993) has been extremely successful for studying the human brain, it has well-known limitations. The extent, dynamics, and underlying mechanisms of this neurovascular coupling are not yet fully understood (Iadecola and Nedergaard, 2007; Magistretti and Pellerin, 1999), and the BOLD signal depends on several parameters, so its biophysical link with neuronal activation is not straightforward (Buxton et al, 1998, 2004; Malonek et al, 1997; Sirotin and Das, 2009; van Zijl et al, 1998). Although the coupling between neuronal activation, cell metabolism, and hemodynamic changes has been shown for BOLD fMRI (Logothetis et al, 2001), it may fail in some pathologic conditions (Lehericy et al, 2002). Also, the spatial localization of the BOLD signal can be distant from the actual site of neural activity, because the signal source includes various vascular networks ranging from small capillaries to large draining veins (Turner, 2002). Similarly, the physiologic delay necessary for the mechanisms triggering the vascular response to work intrinsically limits the temporal resolution of BOLD fMRI.
However, Le Bihan et al (2006) recently reported that brain activity could be detected and imaged through MRI observation of the diffusion behavior of water molecules, as water diffusion appears to be slower in the activated brain cortical areas. This slowdown occurs several seconds before the hemodynamic response detected by BOLD fMRI, and has been tentatively ascribed to the phase transition of a fraction of the water molecules from a faster to a slower diffusion pool in the areas of the cortex undergoing activation (Le Bihan et al, 2006). This slow-diffusion pool might consist of water molecules in close association with cell membranes, and the observed phase transition could result from the membrane expansion of cortical cells that undergo swelling during brain activation (Andrew and MacVicar, 1994; Le Bihan, 2007; Tasaki, 1999). This hypothetical mechanism, if confirmed, would be more closely associated with neuronal activation, and would mark a significant departure from the blood flow-based MRI approach, thereby potentially offering improved spatial and temporal resolution. However, the assumption of a nonvascular origin of the water-diffusion signal is a subject of controversy (Jin and Kim, 2008; Miller et al, 2007; Yacoub et al, 2008). Furthermore, vascular responses that are faster than BOLD signals have also been observed through measurements of the regional cerebral blood volume (rCBV) and the total local hemoglobin content (Huppert et al, 2006; Lu et al, 2003; Malonek et al, 1997).
To shed light on this issue, we investigated the temporal dynamics of water-diffusion and blood-oxygenation signals during visual stimulation as detected by MRI, and compared them with the changes of the vascular oxygenated, deoxygenated, and total hemoglobin (oxy-Hb, deoxy-Hb, total-Hb) contents, as obtained through intrinsic optical signals by near infrared spectroscopy (MRS). Our premise was that significant differences between the diffusion-based signal and the vascular-response time courses would be strong evidence against a vascular origin of the diffusion signal.
Materials and methods
Subjects and Equipment
Twelve healthy male subjects participated in this study. The protocol was approved by the local ethics committee. Before the experiments, written informed consent was obtained from all the subjects after they had received a complete description of the study. Three subjects failed to show any significant activation in the MRI measurement because of head motion or closure of the eyes during stimulation. Another subject had to be excluded because of an extremely poor signal-to-noise ratio in the NIRS measurement because of poor coupling of the optodes to the head. Thus, eight subjects (aged 19 to 38 years; mean age = 30.5 ± 9.8 years) were further considered.
Direct comparison of the diffusion and vascular responses was made possible through the simultaneous recording of MRI and optical signals throughout the visual areas (Figure 1). We used a 3T whole-body MRI scanner equipped with an eight-channel phased-array coil and a 40-mTm−1 actively shielded gradient coil (Trio; Siemens, Erlangen, Germany). We recorded the NIRS responses using a multichannel continuous-wave optical imager (FOIRE-3000; Shimadzu, Kyoto, Japan) with three laser diodes of 780 nm, 805 nm, and 830 nm (Kohno et al, 2007). Each detection fiber was connected to a photomultiplier tube, the sensitivity of which was tuned at these wavelengths. To simultaneously record the NIRS and MRI signals, four 8-m optical-fiber cables connected to the NIRS instrument in the control room were run to the back of the scanner through a filtered port. During signal acquisition, each of the three laser diodes sequentially delivered a 5-ms pulse of light to a source optode, followed by 10 ms intervals of dark signal acquisition. The resulting interval between two light emission/reception was 40 ms. The MRI scanner and the NIRS device were synchronized to the computer (Dell, Precision 350, Round Rock, TX, USA) that ran the visual stimulation software (Cogent 2000; www.vislab.ucl.ac.uk/Cogent2000).
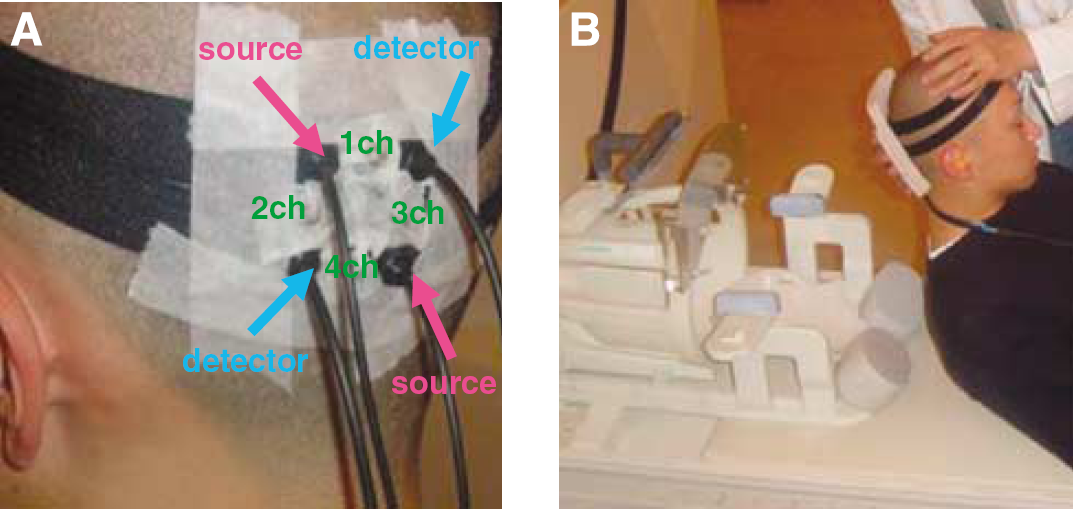
Setting for simultaneous acquisition of near infrared spectroscopy (NIRS) and magnetic resonance imaging (MRI). (
Setting and Protocol
Two sources and two detector fibers (four channels) were placed on the occipital area over the primary visual cortex as determined from three-dimensional anatomic images acquired by MRI (Figure 1A). The distance between the source and detector pairs was 2.5 cm. Four E-vitamin capsules were placed at the midpoints of the source and detector pairs, as markers of the NIRS channel positions. A custom-made cushion was used to set the optical fibers on the occipital area in the supine body position (Figure 1B).
For the measurement of diffusion, NIRS, and BOLD responses, visual stimulation was obtained from a black-and-white annular checkerboard (15 Hz reversing frequency) with a fixed point in the center that was projected onto a screen within the MRI scanner room through a video projector. The activation paradigm consisted of four epochs of 10.5 sec stimulation separated by 21 sec resting intervals.
Acquisition
The diffusion MRI sequence consisted of a twice-refocused spin-echo-echo planar imaging (SE-EPI) sequence sensitized to diffusion by an interleaved pair of bipolar magnetic field-gradient pulses applied simultaneously along all three axes (Le Bihan et al, 2006; Reese et al, 2003). The acquisition parameters were as follows: matrix = 96 × 96 × 10; interleaved slice acquisition; voxel size = 2 × 2 × 3mm2; echo time (TE) = 89 ms; repetition time (TR) = 1.5 sec; 6/8 partial k-space; and bandwidth =1,302 Hz/pix. SE-EPI sequences with (diffusion,
Data Processing
We identified the activation maps of the MRI data using SPM5 software (www.fil.ion.ucl.ac.uk/spm). The images were initially corrected for slice-acquisition order (taking the last acquired slice of the volume as the reference) and motion, and registered to the high-resolution anatomic images followed by spatial smoothing with a Gaussian filter (6 mm full width at half maximum). A multiple linear-regression algorithm based on the general linear model was used to detrend and analyze the time-course data. To avoid any bias, all the MRI data were analyzed with a box-car function identical to the activation time course (i.e., without shifted delay), and a relatively low threshold value (uncorrected,
Changes in the oxy-Hb, deoxy-Hb, and total-Hb contents (multiplied by the optical path length in the activation region) were calculated through solving simultaneous equations from modified Beer-Lambert law using the absorbance changes at three wavelengths (780, 805, and 830 nm) as measured by the MRS system (Kohno et al, 2007). Within brain tissue, light absorption at the above-mentioned wavelengths is predominantly modulated by changes in the blood hemoglobin concentration. For the optical path-length corrections, we used values from the published literature of 5.92, 5.76, and 5.39 for the differential path-length factors at 780, 805, and 830 nm, respectively (Duncan et al, 1996).
To compare the temporal dynamics between the NIRS and MRI signals, we selected the NIRS channel with the largest changes for further analysis. We drew a 30-mm half-sphere centered on the selected MRS channel in each MRI image (Figure 2), and extracted the volume of interest-averaged raw-signal time series from each MRI image, considering only the voxels detected as activated by diffusion MRI within this sphere. The time of the stimulus onset for MRI was defined as the time of acquisition of the last slice of the volume just preceding the stimulus onset (i.e., ∼75ms before the actual stimulus onset). The MRS data were resampled to fit the MRI time points equal to MRI using a quadratic Savitzky–Golay smoothing (37 points; Savitzky and Golay, 1964) and linear interpolation. First, to estimate the amplitudes of the poststimulus undershoot among three MRI signals, the baseline level for each raw MRI signal was set by averaging all the time points preceding the first stimulation epoch. The baseline level for each signal of NIRS was set by the averaging in the 4.5 sec period (4 points) just preceding the first stimulation epoch, because of the presence of large drifts. Then, to assess the response time courses the NIRS and MRI signals were folded into a single (activation–rest) epoch, by averaging the four subsequent epochs of the paradigm, and normalized. The folded plots were set to zero at the stimulus onset to remove any baseline effect, and the amplitude of each folded time course was adjusted by setting its peak amplitude to 1 (the peak was determined using a triangular moving average to decrease noise). To quantify the advance of the diffusion signal response the other MRI and NIRS signal responses were shifted in time (by 1.5 sec intervals), and a normalized root-mean-square difference (nRMS) was calculated between the normalized diffusion time course and the other time-shifted signal time courses (Le Bihan et al, 2006). The nRMS minimum value (determined through the zero crossing of its time derivative) provided an estimate of the time delay, which made time courses mostly similar with that of the diffusion response. To better realize the time differences, which might differ at stimulation onset and offset, the process was performed twice, first using the points acquired during the stimulus time frame (i.e., 0∼10.5sec) and, second, using the points collected between the stimulus offset and the nearest point of the diffusion time course crossing the baseline (i.e., 10.5∼18 sec).
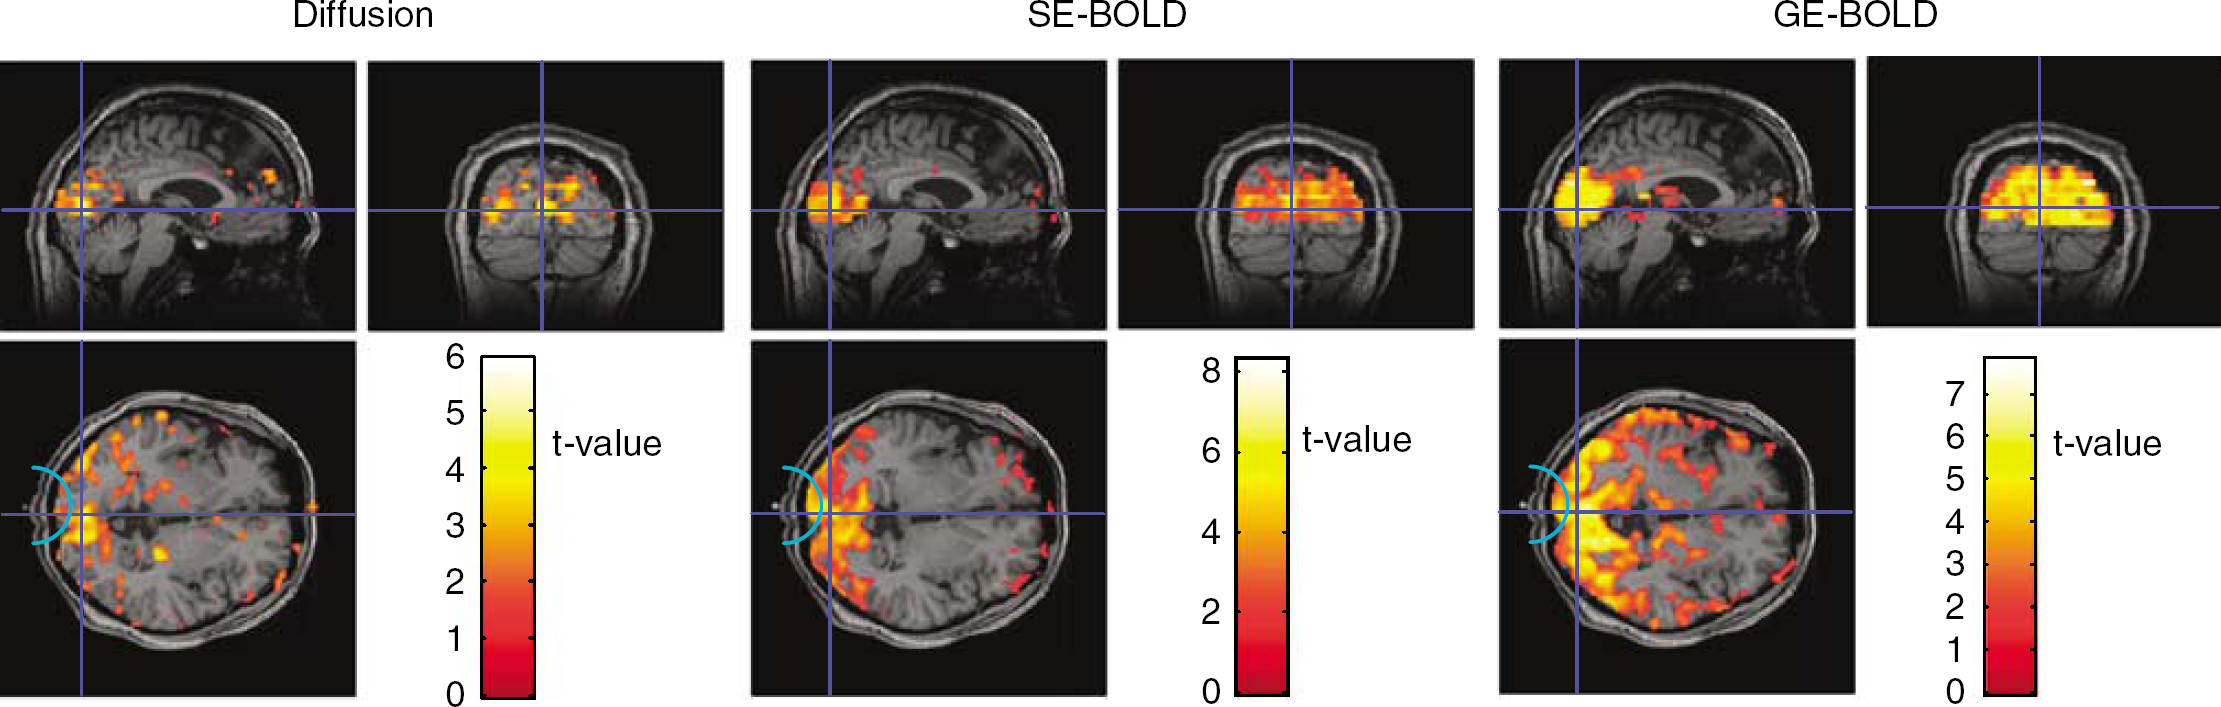
Activation maps of diffusion, spin-echo (SE)-blood oxygenation level-dependent (BOLD), and gradient-echo (GE)-BOLD. All magnetic resonance imaging (MRI) data were analyzed with a box-car function (uncorrected,
Results
All subjects showed significant activation of the early visual cortex with BOLD and diffusion-based MRI, as well as significant changes in the hemoglobin content during stimulation (monophasic increases in the oxy-Hb and total-Hb contents). Typical activation maps obtained for diffusion, SE-BOLD, and GE-BOLD MRI are shown in Figure 2.
Response Times
The full time courses and its folding time courses averaged over all individual subjects for the MRI signals (water diffusion, SE- and GE-BOLD) and the NIRS signals (oxy-Hb, deoxy-Hb, and total-Hb contents) are shown in Figures 3 and 4, respectively. The amplitude of the diffusion response was larger than that of SE-BOLD response, but was smaller than that of the GE-BOLD response, as previously reported (Le Bihan et al, 2006). The poststimulus undershoot for the diffusion signal was very small and not distinguishable from noise. However, there was a significant undershoot for SE-BOLD signal (∼0.3%) and an even larger one for GE-BOLD signal (∼0.5%; Figure 3).
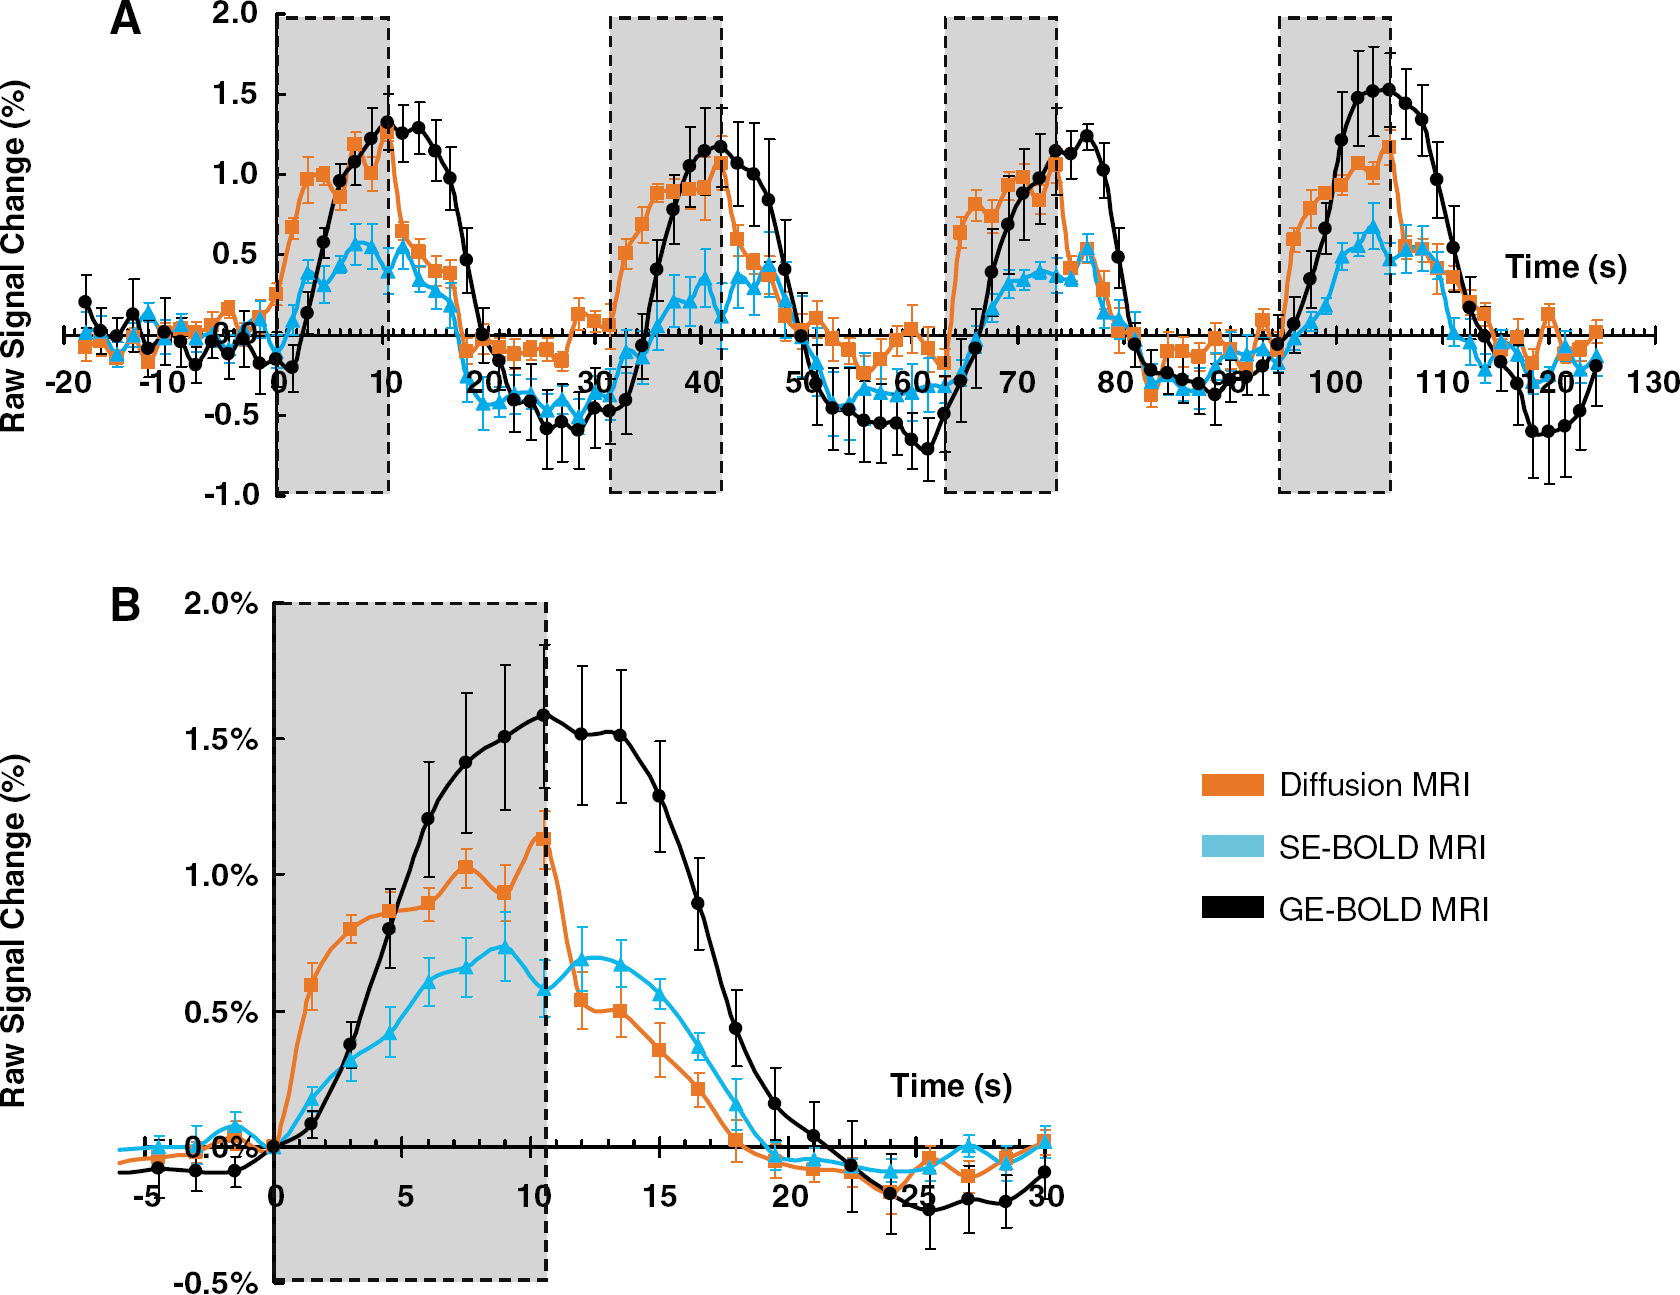
Averaged time courses for diffusion, spin-echo (SE)-blood oxygenation level-dependent (BOLD), and gradient-echo (GE)-BOLD response for all eight subjects. (
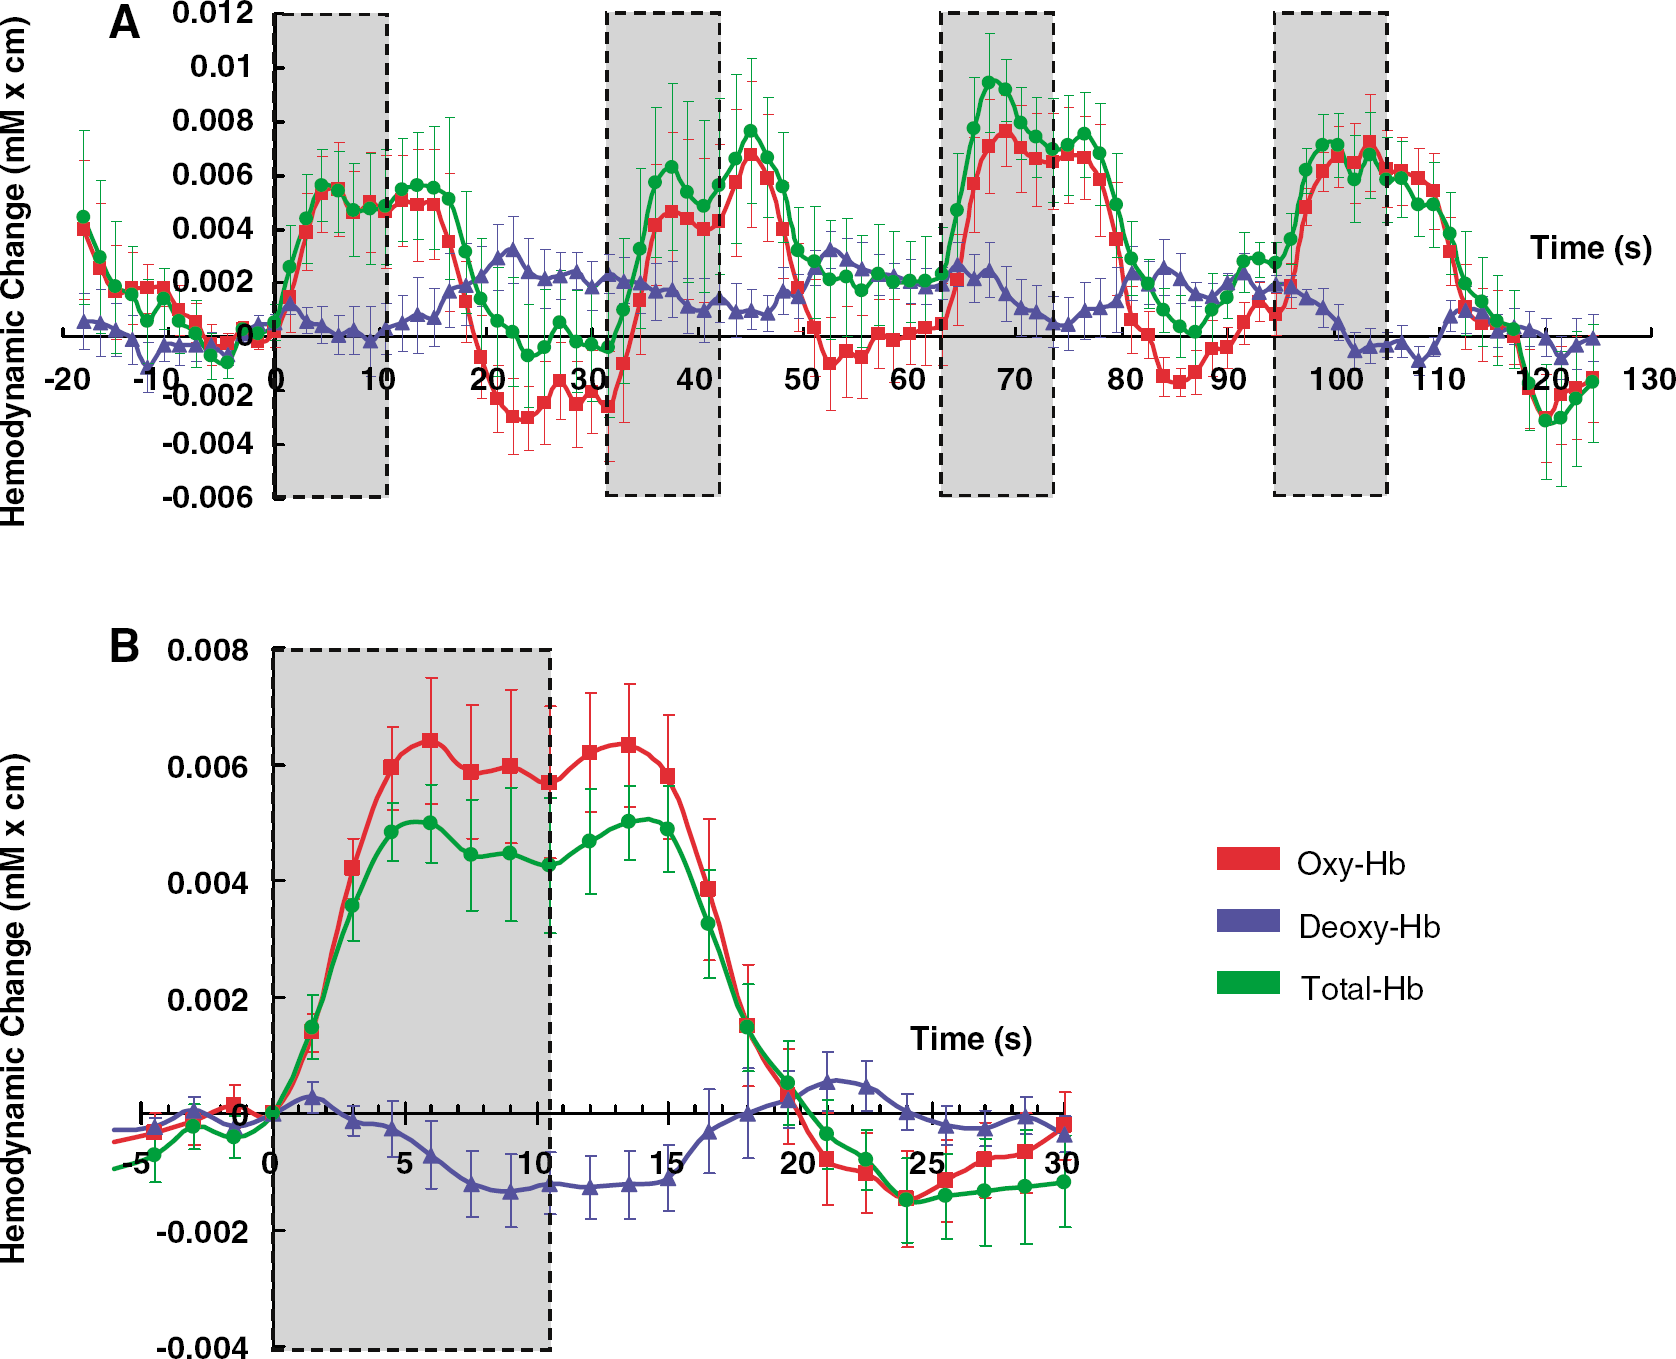
Averaged time courses for oxy-Hb, deoxy-Hb, and total-Hb response for all eight subjects. (
Using the nRMS approach the diffusion signal was found to be clearly in advance to all other signals, both at the onset and the offset of the stimulus (Figure 5). The minimum nRMS was obtained with shifts of −2.9, −1.7, −1.1 and −1.0 secs for the GE-BOLD, SE-BOLD, oxy-Hb, and total-Hb signals, respectively, compared with the diffusion response (Figure 5A). For the signal decay, the shifts minimizing the nRMS were found to be −3.3, −3.3, −4.1 and −4.4 secs for the GE-BOLD, SE-BOLD, oxy-Hb, and total-Hb signals, respectively, compared with the diffusion response (Figure 5B).
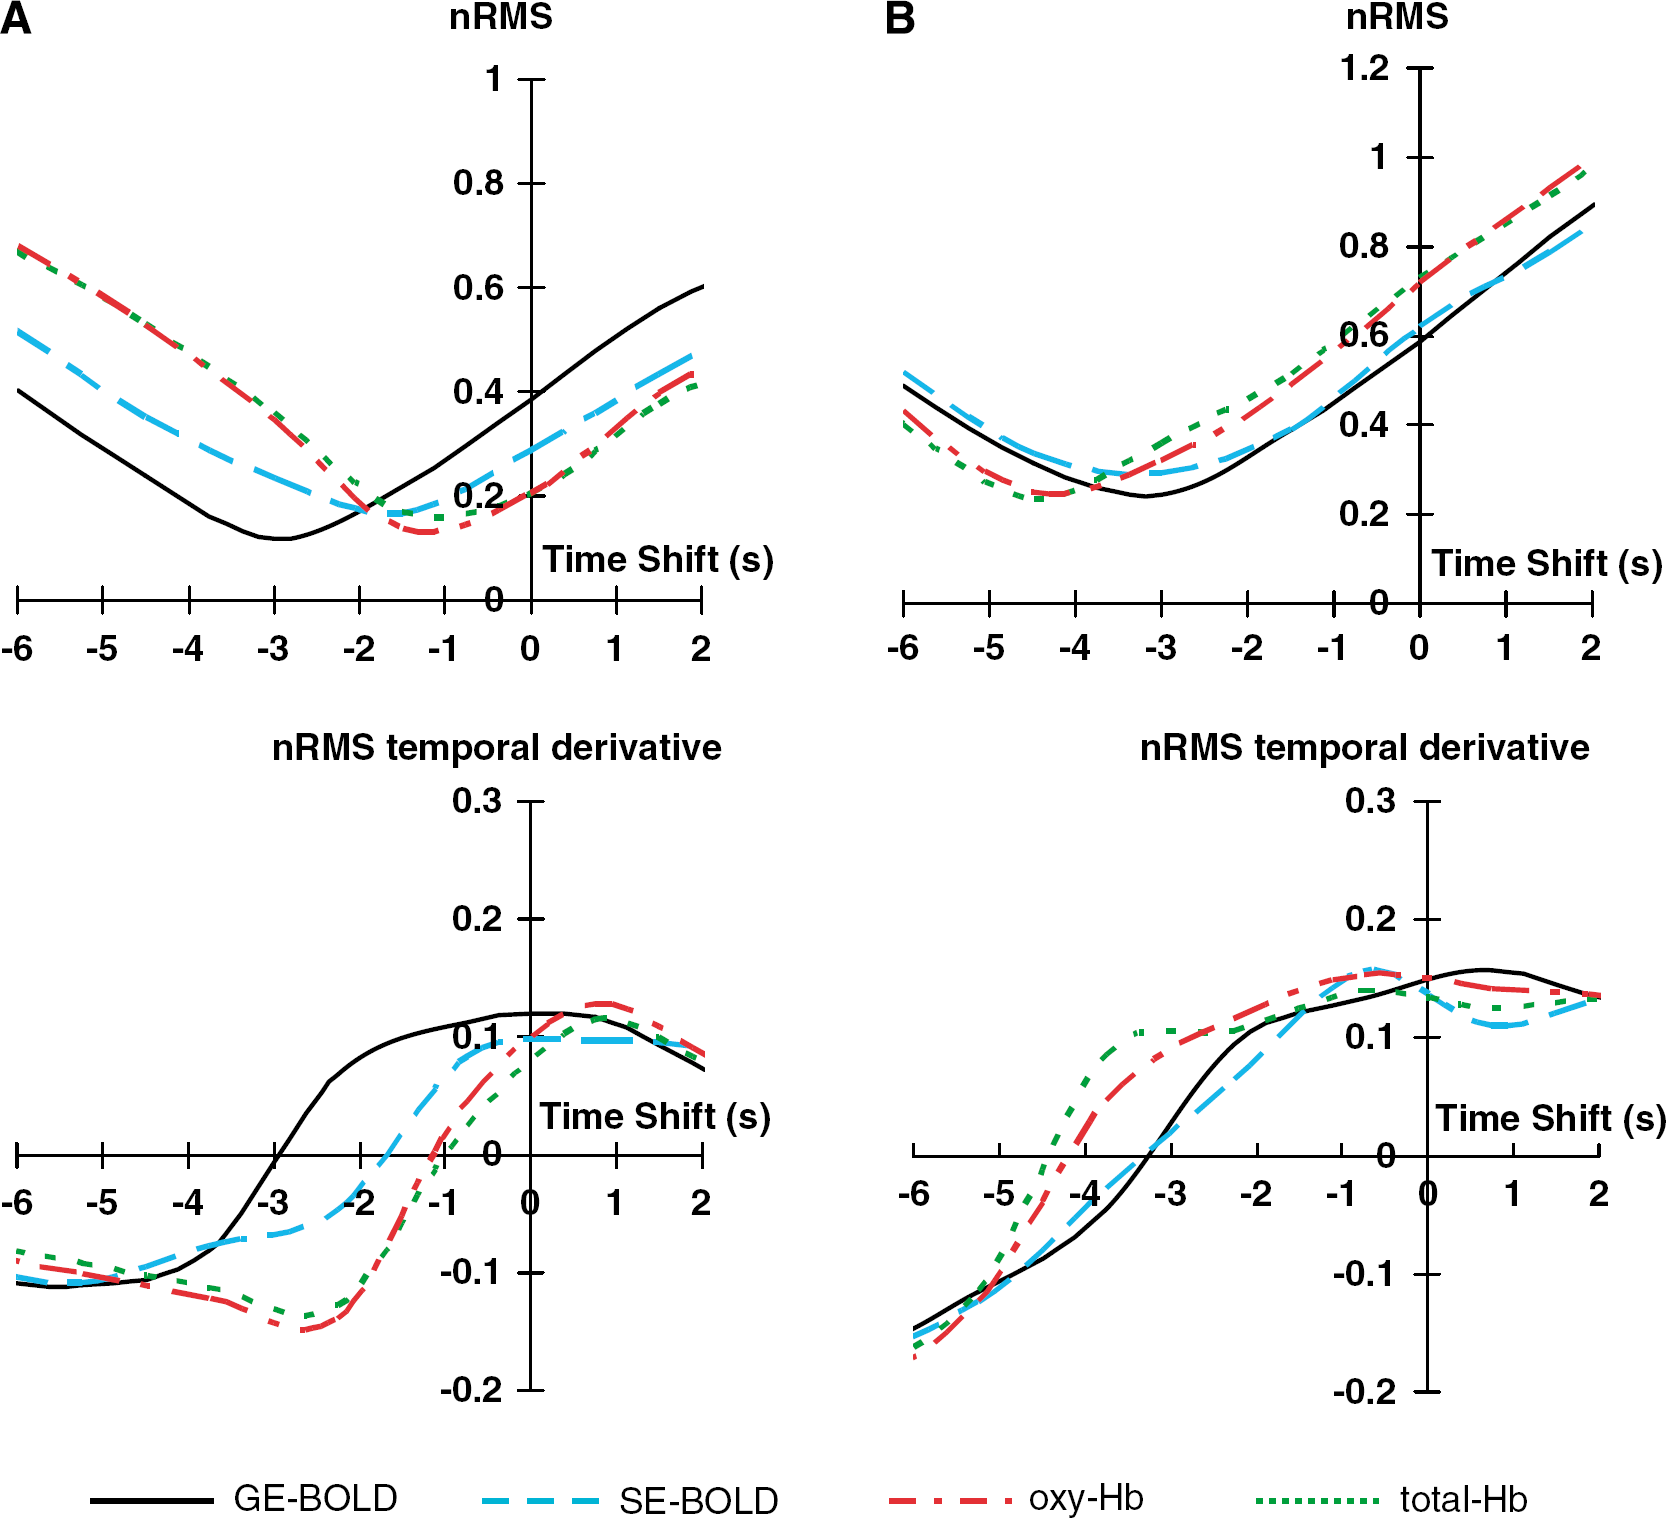
Normalized root-mean-square (nRMS) error and its temporal derivative between diffusion and other time courses (gradient-echo (GE)-blood oxygenation level-dependent (BOLD), spin-echo (SE)-BOLD, oxy-Hb, deoxy-Hb, or total-Hb). The process was performed twice, first (
The response times of the various signals were also absolutely quantified by evaluating the rise times and decay times (only relative differences could be assessed with the nRMS approach). The rise times and decay times of the activation time courses were defined as the time interval from stimulation onset and offset, respectively, to cross the level of 50% of the maximal peak. This choice was made, instead of the time-to-peak, to limit the amount of error, which could result in the determination of the time of the maximum peak in the presence of a plateau or noisy signals. The rise times and decay times are, indeed, much less sensitive to errors in the determination of the time of the peak and depend more on the steepness of the curves at onset and offset. The group average ± s.e. rise times for the diffusion MRI, SE-BOLD MRI, GE-BOLD MRI, and total-Hb (NIRS) responses were 1.2 ± 0.1, 3.3 ± 0.9, 4.4 ± 0.3, and 2.1 ± 0.6 secs, respectively (Figure 6A). The rise times of the SE-BOLD and total-hemoglobin signals were faster than those of GE-BOLD, which was in agreement with several previous works (Hulvershorn et al, 2005; Huppert et al, 2006), but were statistically significantly longer than the diffusion MRI signal.
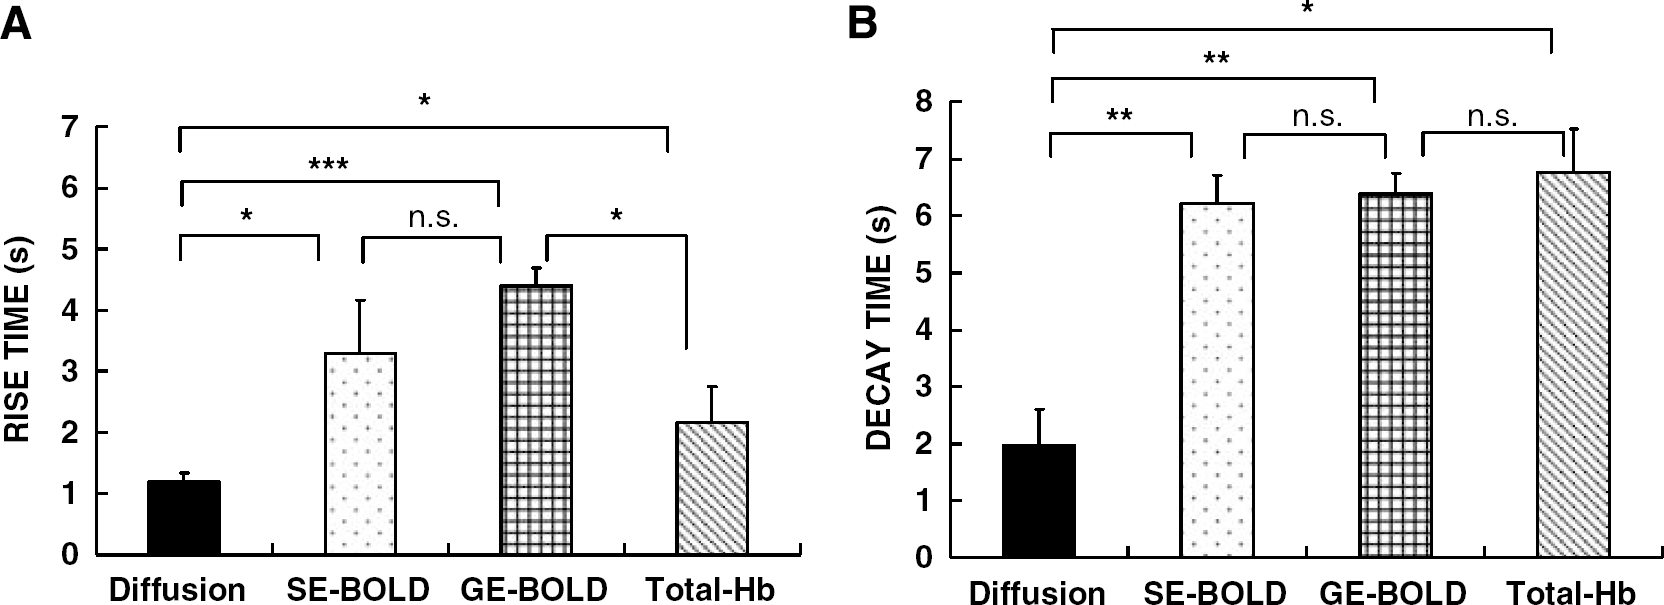
Rise and decay times. (
Interestingly, differences in the decay times were even larger: 2.0 ± 0.6, 6.2 ± 0.5, 6.4 ± 0.4, and 6.8 ± 0.8 secs, for the diffusion MRI, SE-BOLD MRI, GE-BOLD, and total-Hb responses, respectively (Figure 6B).
Phase Plots
To emphasize the temporal relationship between the different MRI signal time courses (diffusion, SE-BOLD, and GE-BOLD) and the optical-imaging parameters (oxy-Hb, deoxy-Hb, and total-Hb), phase plots of the normalized time courses were produced (Figure 7). In addition, linear-correlation coefficients were calculated over the time range of 0∼18 secs. In these plots, a simultaneous covariation of the parameters appeared as a straight and tilted line. If the time course of the parameter on the abscissa axis preceded that of the parameter on the longitudinal axis, the delayed covariation appeared as a curved line, forming a tilted ellipse in the counterclockwise direction. Although all of the MRI signal time courses were correlated with the NIRS-derived signals, the strong correlations (
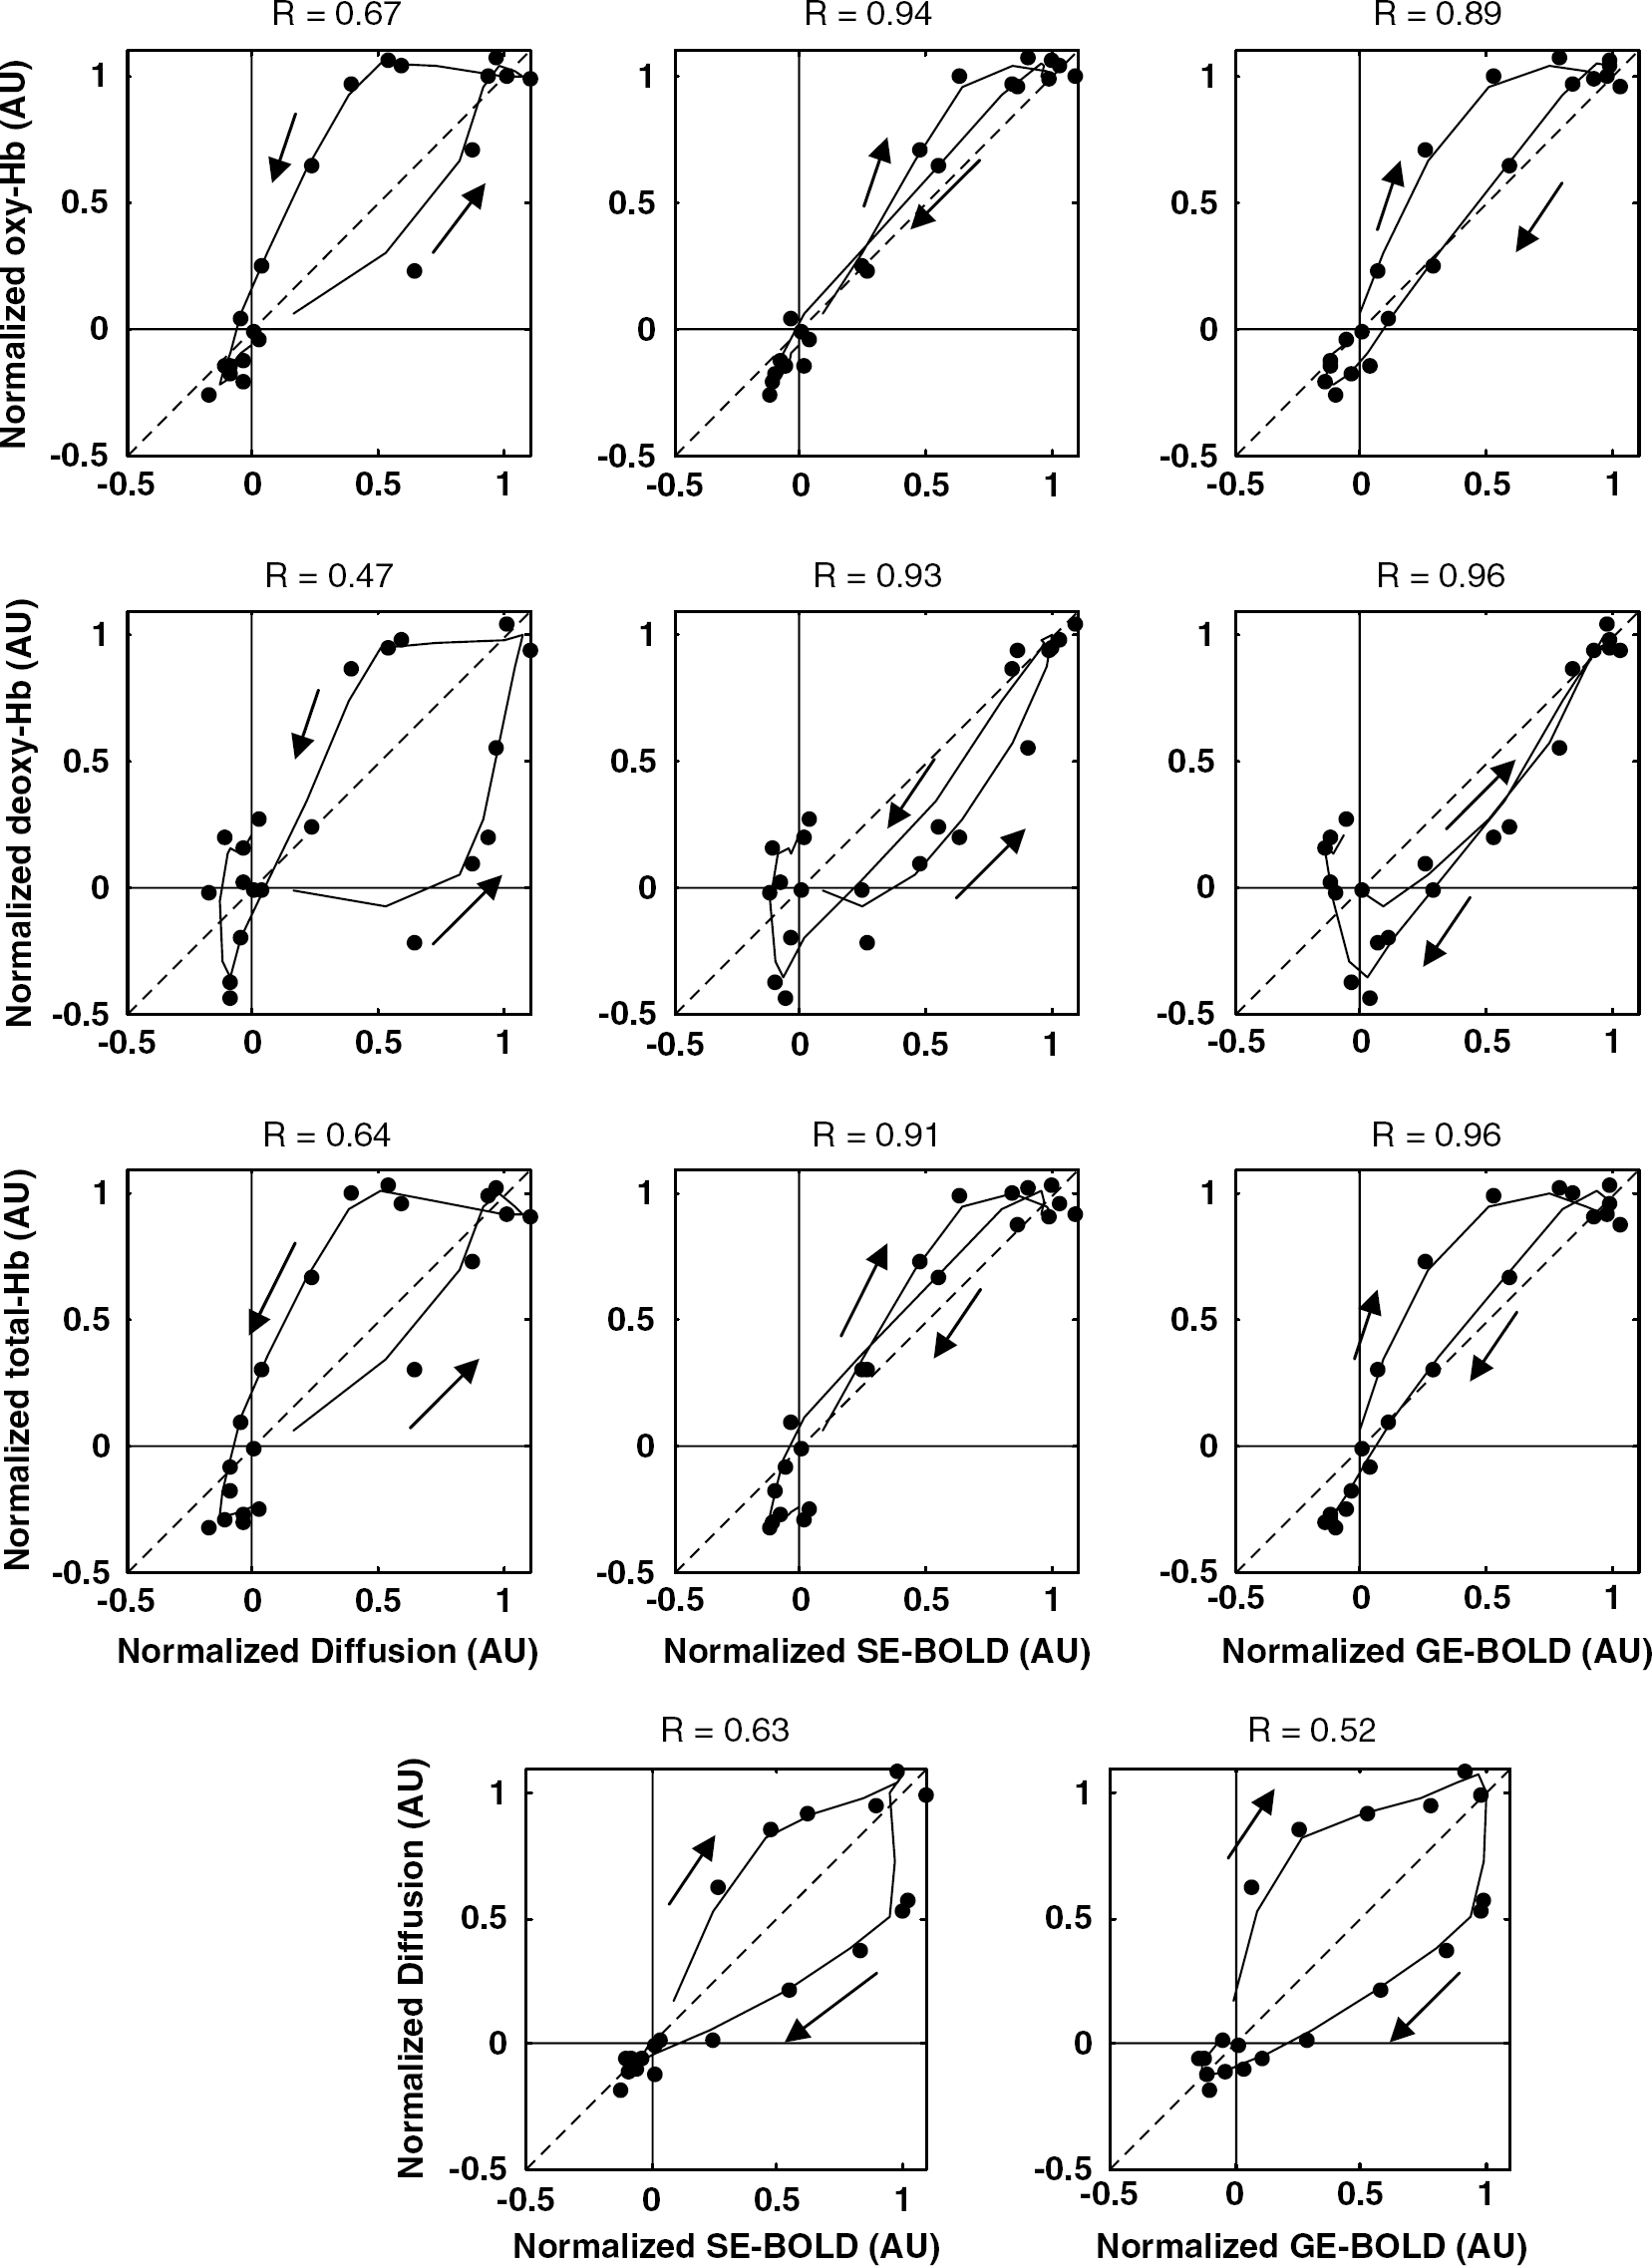
Correlated dynamics of the three magnetic resonance imaging (MRI) signal responses to the three optically derived hemodynamic parameters. The arrows indicate the direction of time in the data. The zero lag correlation (Pearson's) coefficients are shown. These values were all calculated over the time 0 ∼ 18 sec. The correlation coefficients of the oxy-Hb, deoxy-Hb, and total-Hb signals were smaller with diffusion MRI than with spin-echo (SE)-blood oxygenation level-dependent (BOLD) and gradient-echo (GE)-BOLD MRI. The sign of the deoxy-Hb signal response has been inverted to allow better comparison of the time courses.
Discussion
There was a tight coupling between the BOLD MRI signals and MRS, supporting the assumption that the recorded optical signals originated from an area that strongly colocalized with the volume of interest for the MRI measurements. In addition, our results did not change when the size of the half sphere was extended from 30 mm to 40 and 50 mm (data not shown). It is well established that, although the sensitivity of MRS to vascular signals depends on the distance between the source and the detector, the sensitivity range can extend several centimeters into the brain (Okada and Delpy, 2003). However, the strength of the correlation was not identical between the various parameters measured, as shown in the phase plots (Figure 7), and there were clear differences in the time courses of the different MRI and NIRS signals, although those signals were collected simultaneously. These differences must be interpreted taking into account the various mechanisms to which the approaches are sensitive.
NIRS
The total-Hb signal is generally considered to reflect rCBV changes (Ferrari et al, 1992; Seiyama et al, 2004). Malonek et al (1997) reported that the rCBV at activation onset was a fast observable vascular signal, preceding by more than 1 sec the increase in regional cerebral blood flow (rCBF), possibly reflecting a blood volume increase at the capillary level. Indeed, it was recently discovered that pericytes around cortical capillaries could modulate locally the capillary diameter in the brain cortex on brain activation (Peppiatt et al, 2006). Such variations in capillary diameter might be responsible for the rapid increase in blood volume, which, in turn, could later trigger an increase in blood flow from feeding arterioles.
The balance between the oxy-Hb and deoxy-Hb contents reflects more complex changes in the rCBV, rCBF, and oxygen consumption. After a small increase in deoxy-Hb content (sometimes visible as an initial peak in the deoxy-Hb curve (Malonek et al, 1997)) the large increase in rCBF that follows (Hoshi et al, 2001), induces a sharp increase in the oxy-Hb content through the arrival of fresh oxygenated blood, which washes out the modest increases in oxygen consumption and deoxy-Hb (Malonek et al, 1997). The total-Hb (rCBV) response at the activation onset seems to be the fastest in the NIRS signals (Figure 5; Malonek et al, 1997). However, on the contrary, the total-Hb (rCBV) response returns to baseline more slowly than the oxy-Hb and BOLD responses (Figure 5; Buxton et al, 2004; Lu et al, 2005; Mandeville et al, 1998).
BOLD fMRI
The BOLD fMRI signal originates from the variations in vascular deoxy-Hb content (Ogawa et al, 1993; van Zijl et al, 1998), thus reflecting a complex balance between metabolism, rCBV, and rCBF variations. Differences can be observed between the SE-BOLD and GE-BOLD signals, because of a differential sensitivity to the vessel size (Boxerman et al, 1995), the tissue, and the intravascular components. At 3T, both small and large veins experiencing changes in deoxy-Hb content contribute to the GE-BOLD signal, resulting in a larger effect than that with the SE-BOLD signal, for which the effect of large vessels is canceled (Duong et al, 2003; Hulvershorn et al, 2005). Hence, the rise time for the SE-BOLD signal is expected to occur slightly earlier than the GE-BOLD signal, because blood-flow and oxygen-saturation changes occur earlier in capillaries and small veins, near the activation site, and then gradually extend to larger draining veins. Previous work (Hulvershorn et al, 2005; Liu et al, 2000) showed that the rCBF response in the occipital cortex, as measured by perfusion MRI, peaked 1 sec before the GE-BOLD response, whereas the SE-BOLD response was less delayed. Our results are in good agreement with those observations.
Water Diffusion
The diffusion MRI signal behavior strikingly differed from the optical and BOLD signals. Indeed, the diffusion-response rise time and, even more clearly, its decay time were significantly shorter, and the correlation with the optical signals was the lowest. This strongly suggests that the intrinsic water-diffusion signal response must have resulted from events that precedes the hemodynamic changes, and, thus, are probably not of vascular origin.
The MRI signal is made up of a vascular and a tissue component. At high
Hence, the diffusion-MRI signal mainly results from the tissue component. In addition to true water diffusion changes occurring in the tissue, the raw diffusion-sensitized MRI signal remains, however, indirectly sensitive to vascular events via the local magnetic-susceptibility gradients produced in the tissue by intravascular deoxy-Hb, which is paramagnetic. In other words, the raw diffusion-weighted signal is the sum of a unique, true tissue diffusion component (apparent diffusion coefficient; ADC) and a local magnetic-susceptibility tissue component (T2*t), which is common with BOLD SE signals. The tissue diffusion response can be isolated by using images acquired with different degree of diffusion sensitization, as it increases with the
In summary, during cortical activation both tissue diffusion effects (ADC) and residual vascular effects (T2*) coexist and contribute to the DfMRI signal. The (true) diffusion component is expected to become significant at very large
Local magnetic-susceptibility gradients may also contribute through their crossterms with the external gradient pulses used to measure diffusion. The resulting crossterms might modulate the raw diffusion-weighted signal with the variations in intravascular deoxy-Hb content and mimic water-diffusion changes. However, it is well established that the decrease in deoxy-Hb content produced during activation leads to a decrease of the diffusion-sensitized signal (equivalent to a pseudo ADC increase), because the local gradients artifactually decrease the
In conclusion, the differences in the time-course differences that we observed between the MRS and BOLD signals, and the diffusion MRI response which was faster than any of the various hemoglobin-content related responses are difficult to explain in terms of a vascular component, as there is no clear physiologic and physical mechanisms to explain how such an early response, both at onset and offset, could be picked up by diffusion MRI and not BOLD MRI or NIRS. These results suggest that the diffusion response could reflect other dynamic events occurring in the tissue, notably changes in its cellular structure, such as cell swelling to which diffusion MRI is exquisitely sensitive (Le Bihan, 2007). Clearly the origin of the diffusion signal remains to be investigated and further work will establish whether this water diffusion signal can be used as a more direct surrogate marker of neuronal activation representing a significant departure from the neurovascular-coupling paradigm used by current neuroimaging methods, offering improved spatial and temporal resolution and specificity.
Footnotes
All authors have no conflict of interest to declare concerning this research.