
Abstract
Reductions in blood oxygenation level dependent (BOLD)-functional magnetic resonance imaging (fMRI) signals below baseline levels have been observed under several conditions as negative activation in task-activation studies or anticorrelation in resting-state experiments. Converging evidence suggests that negative BOLD signals (NBSs) can generally be explained by local reductions in neural activity. Here, we report on NBSs that accompany hemodynamic changes in regions devoid of neural tissue. The NBSs were investigated with high-resolution studies of the visual cortex (VC) at 7T. Task-activation studies were performed to localize a task-positive area in the VC. During rest, robust negative correlation with the task-positive region was observed in focal regions near the ventricles and dispersed throughout the VC. Both positive and NBSs were dependent on behavioral condition. Comparison with high-resolution structural images showed that negatively correlated regions overlapped with larger pial and ependymal veins near sulcal and ventricular cerebrospinal fluid (CSF). Results from multiecho fMRI showed that NBSs were consistent with increases in local blood volume. These findings confirm theoretical predictions that tie neural activity to blood volume increases, which tend to counteract positive fMRI signal changes associated with increased blood oxygenation. This effect may be more salient in high-resolution studies, in which positive and NBS may be more often spatially distinct.
Keywords
Introduction
An intriguing aspect of blood oxygenation level dependent (BOLD)-functional magnetic resonance imaging (fMRI) experiments is that certain brain regions show reduced signal level with increasing task demands (Shmuel et al, 2002, 2006; Raichle et al, 2001; Allison et al, 2000). A striking example of this is the signal in the visual system during strong visual stimulation, in regions surrounding the activated cortex (Shmuel et al, 2002, 2006; Smith et al, 2000). Initially, this phenomenon was attributed to a hemodynamic effect resulting from the so-called ‘blood stealing’ phenomenon (Harel et al, 2002; Shmuel et al, 2002). However, electrical recordings suggest that this negative BOLD signal (NBS) results from neural inhibition (Devor et al, 2007; Shmuel et al, 2006). Another example of negative BOLD activation is found in a cluster of brain regions often referred to as the default mode system, which shows reduced BOLD signal, positron emission tomograph blood flow, and CMRO2 during increasing cognitive demands and goal directed action (Raichle et al, 2001). In the absence of task demands (also called the resting state), default mode system shows negative correlation with the dorsal attention system (Fox et al, 2005; Greicius et al, 2003). These findings are consistent with the notion that negative BOLD signals (NBSs) represents a reduction in neuronal activity. During both rest and task execution, NBSs may manifest as a negative correlation between brain signals, reflecting an inhibitory interaction between regions involved in competitive processing. Finally, negative BOLD effects can be observed in the stimulus-induced hemodynamic response, in terms of an initial dip and a poststimulus undershoot. Those transient negative BOLD responses have been attributed to hemodynamic mechanisms rather than neuronal inhibition (Buxton et al, 2004; Uludag, 2010).
In this work, we report on a novel pure hemodynamic mechanism producing NBS, as suggested by several recent fMRI studies. During a combined motor/visual stimulation protocol, van der Zwaag et al (2009) found substantial BOLD signal reductions in periventricular areas apparently devoid of neural tissue. In the absence of stimuli during REM sleep (Hong et al, 2009) and resting with the eyes closed during states of varying vigilance (Olbrich et al, 2009; Moosmann et al, 2003), similar regions also appear to negatively correlate with visual areas. These findings raise the possibility that at least in certain brain regions, NBS may not reflect a reduction in local neural activity but rather a hemodynamic phenomenon. If confirmed, this may impact the understanding of the BOLD contrast mechanism and the interpretation of BOLD-fMRI studies in general.
The goal of this study was to further investigate NBSs and their potential nonneuronal contribution. For this purpose, BOLD-fMRI studies of spontaneous activity in the visual system and periventricular areas were compared with high-resolution anatomical scans obtained at 7T, and contributing sources of NBSs were identified by investigating the underlying contrast mechanism.
Materials and methods
To investigate NBSs and confirm the earlier findings in periventricular areas (Hong et al, 2009; Olbrich et al, 2009; van der Zwaag et al, 2009; Moosmann et al, 2003), we first reanalyzed resting-state single-echo BOLD-fMRI data acquired in previous work (Bianciardi et al, 2009a). Subsequently, to accurately identify the areas with negative signals, we repeated the fMRI protocol of Bianciardi et al (2009a) and also acquired high-resolution anatomical data. Finally, to investigate the origin of negative BOLD, we studied the underlying contrast mechanism by acquiring multiecho echo-planar imaging (EPI) images. In the following, each of these three experiments is discussed in detail. All studies were performed according to a human subject protocol approved by the Institutional Review Board of the National Institutes of Health. All scans were performed at 7T with multichannel receive-only coil elements, sensitivity encoding (SENSE) acceleration in the phase encode direction, and real-time shimming of B0 fluctuations because of respiration (van Gelderen et al, 2007). For fMRI data, the first 10 images (which also allowed the magnetization to reach a steady state) were used as a reference for coil sensitivity, and then discarded from further analysis.
Experiment 1: Negative Correlations with Spontaneous Activity in the Visual Cortex
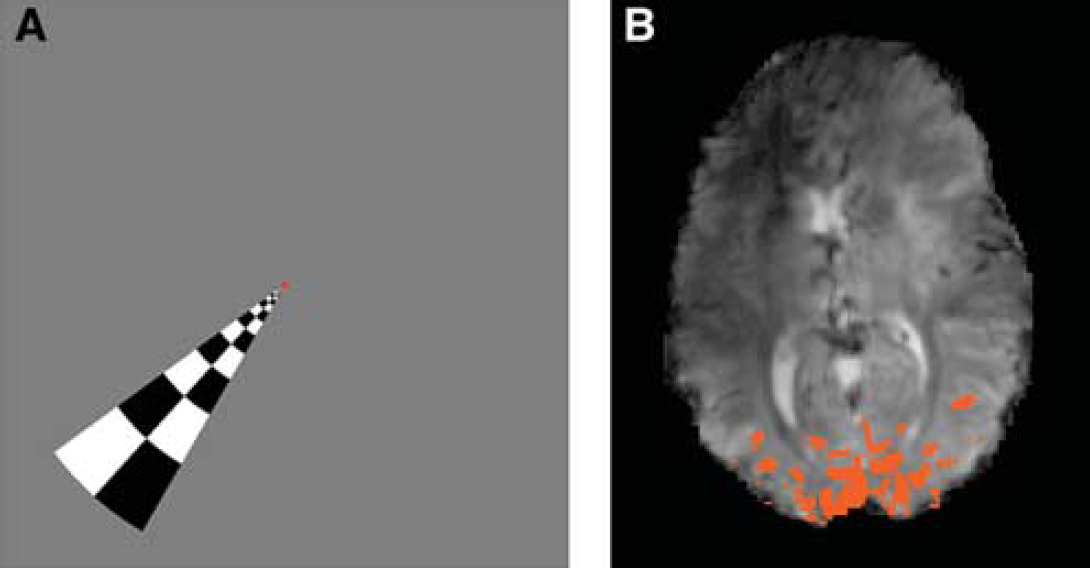
Eleven complete data sets from a previous study (Bianciardi et al, 2009a) were analyzed. Two behavioral resting conditions were investigated: eyes open with visual fixation, and eyes closed. A region of interest (ROI) was selected in the visual cortex (VC) from a functional localizer based on a rotating wedge paradigm (see Figure 1). For each condition, which lasted about 6 minutes, multislice gradient-echo-EPI data were acquired from 16 receive coils at 7T (General Electric Medical Systems, Waukesha, WI, USA) using echo time (TE)/repetition time (TR) = 32 milliseconds/3 seconds, voxel size = 1.25 × 1.25 × 2 mm3, 105 time points (see Bianciardi et al, 2009a for further details).
(
(
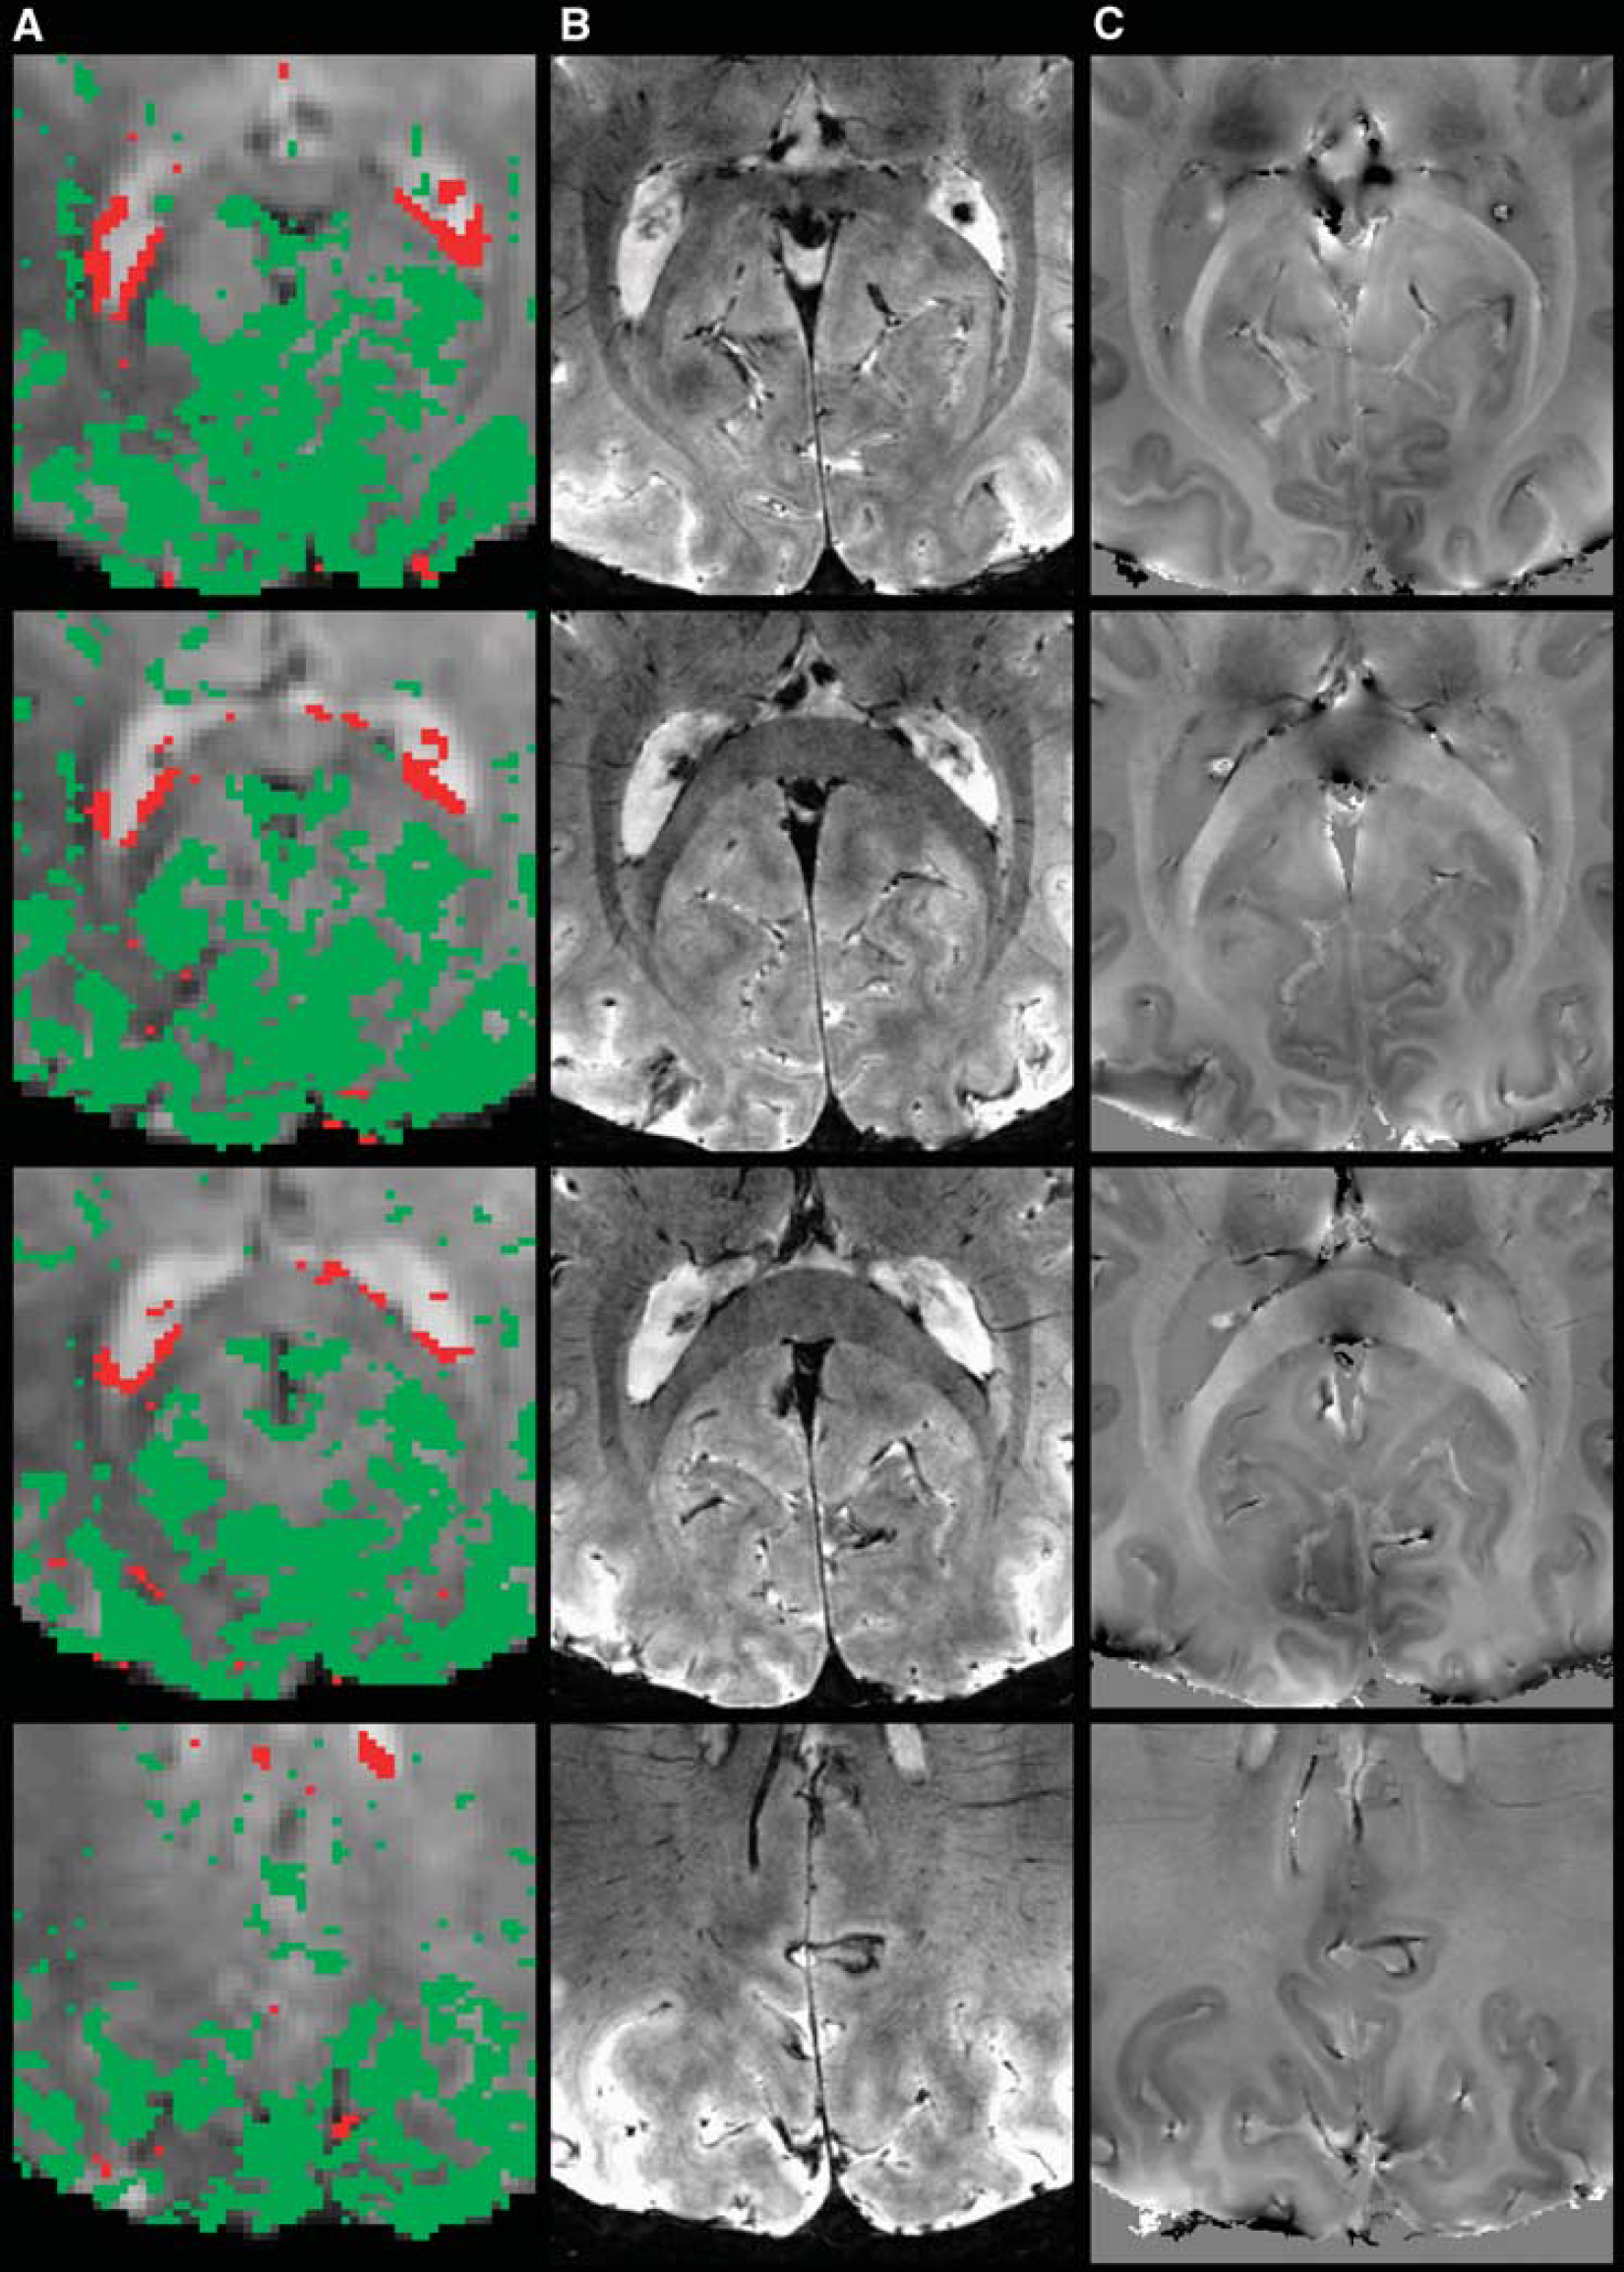
Sample data set (Experiment 2, slices = 31, 32, 33, 38, eyes-closed condition), showing a zoomed view of: (
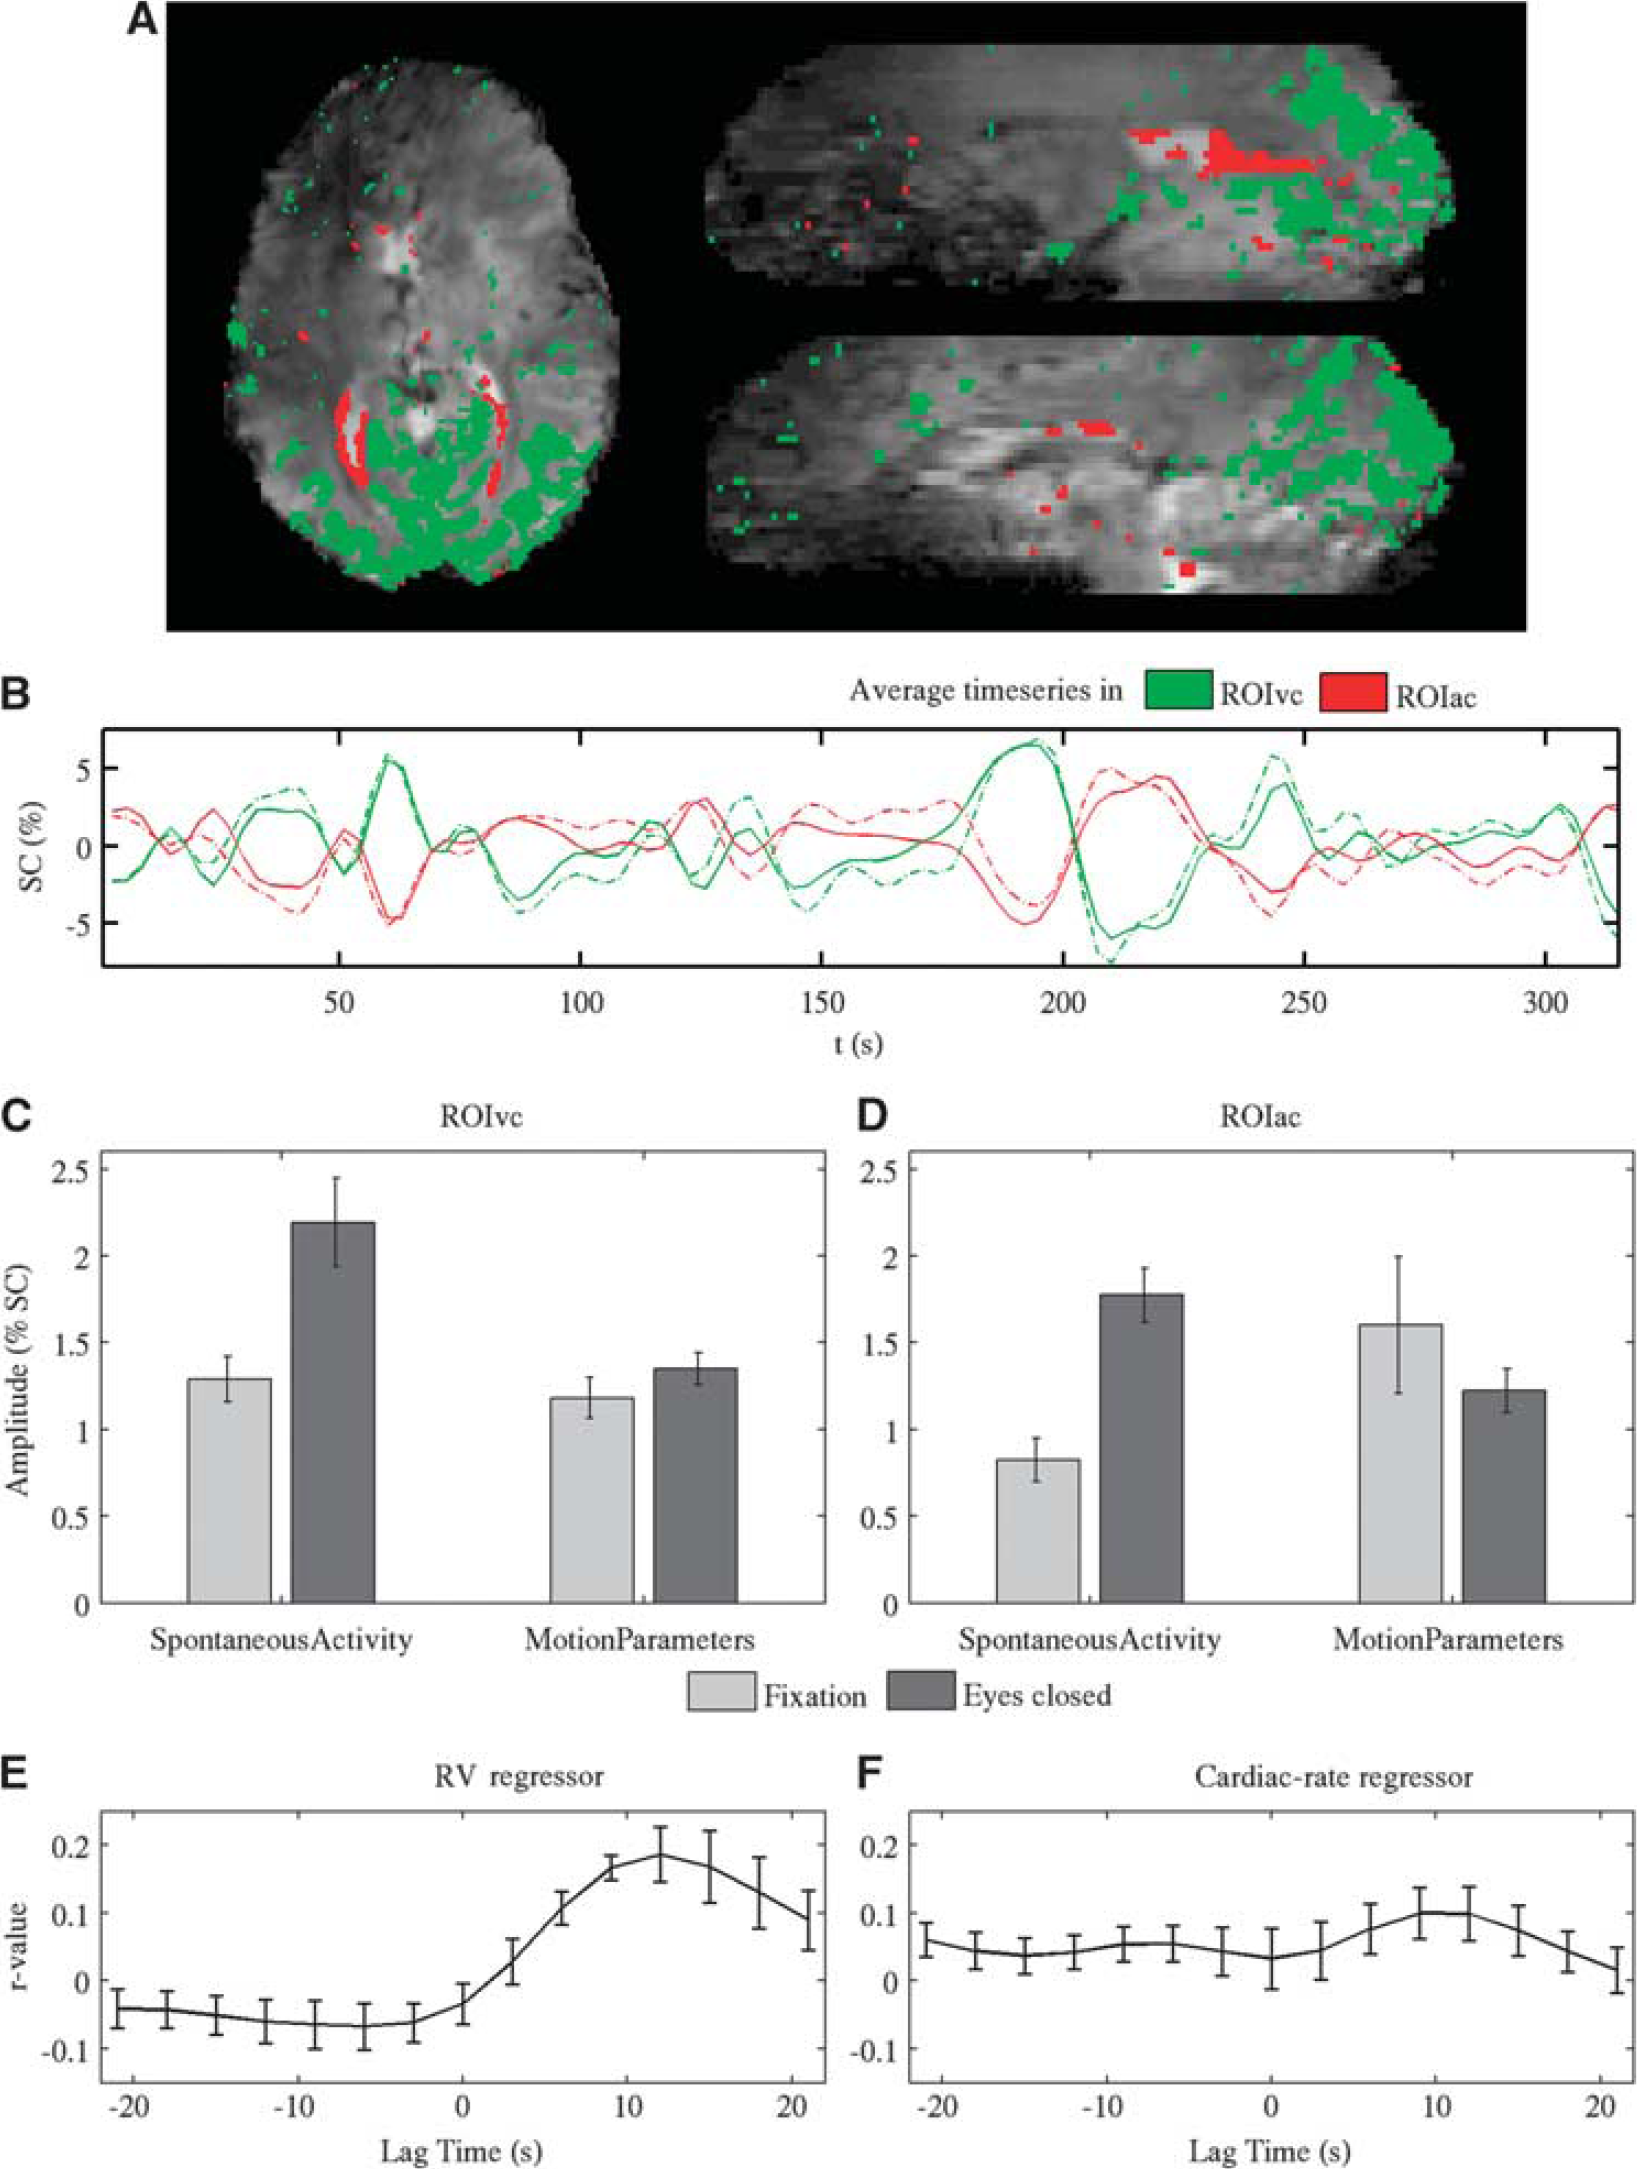
The fluctuation amplitude (% signal change, SC) of spontaneous activity and motion in ROIVC and ROIAC was measured as the standard deviation of the signal explained by the spontaneous activity regressor and by the six motion-related regressors in each voxel pertaining to the two ROIs. The average amplitude across each ROI was then computed per subject and the group average (± standard error, s.e.) was displayed (see Figures 2C and 2D).
Spontaneous activity in both the VC and in periventricular areas was defined after removal of instrumental and physiologic noise. For RV and cardiac-rate regressors, we adopted the lags optimized for the VC and for the whole gray matter as reported in previous work (Bianciardi et al, 2009b). As this may be suboptimal for periventricular areas, we computed the Pearson correlation value (
Experiment 2: Colocalization of Negative BOLD with High-Resolution Anatomical Data
On five subjects (3 males/2 females, age 33 ± 4 years) fMRI data were acquired as in Experiment 1, together with high-resolution multiecho gradient-echo anatomical data. For the latter, we used: TR= 1.9 seconds; TE1, TE2 = 14 milliseconds, 28.5 milliseconds, flip angle = 90°, bandwidth = 62.5 kHz, number of slices = 42, voxel-dim= 0.3125 × 0.3125 × 1 mm3, slice-gap = 1.2 mm; SENSE acceleration rate = 2. For both functional and anatomical scans, an array of 32 receive coils was used, and 42 slices were acquired at matching locations.
Experiment 3: Contrast Mechanism Underlying Negative BOLD
On three subjects (three males, age: 34, 34, 23 years) the eyes-closed and functional localizer scans were performed as in Experiment 1. The fMRI data were acquired with multiecho EPI to allow calculation of T*2 and TE-independent SCs and characterization of their origin.
The
Results
In 8 out of 11 subjects (Experiment 1), significant anticorrelation with VC signal was observed in focal spots near the ventricular areas (posterior and anterior horns of the lateral ventricles, third ventricle, and fourth ventricle), consistent with data presented in earlier studies (Hong et al, 2009; Olbrich et al, 2009; van der Zwaag et al, 2009; Moosmann et al, 2003). Additional focal spots of this NBS were observed throughout the occipital cortex. An example is shown in Figure 2. The amplitude of this anticorrelation reached about 1.8% during the eyes-closed condition (Figure 2D). To further investigate the origin of signals in ROIAC, we also verified if NBSs were time lagged or purely anticorrelated with respect to VC signals. The anticorrelation strength between average VC signals and average NBSs shifted at various time lags showed maximum anticorrelation for zero lag (with interpolation to 150 milliseconds from the original 3-second long time bins, we found that negative signals lagged at most 300 milliseconds the VC signals). A pure antiphase rather than a time delay between signals in ROIAC and ROIVC was found for signals both before and after physiological noise correction. The observed anticorrelation was not simply caused by motion artifacts, as significant motion-related (positive as well as negative) effects (
The Pearson correlation value between the time series in ROIAC during resting with eyes closed and RV and cardiac-rate regressors at various time lags showed a bimodal dependence, see Figures 2E and 2F. The distribution was very similar (with opposite sign) to that previously reported for the VC (Bianciardi et al, 2009b), indicating that the adopted lags optimized for physiologic noise removal in the VC are an optimal choice for periventricular areas as well. Note that the average correlation of spontaneous signal fluctuations in periventricular areas with RV and cardiac-rate regressors did not reach significance for any time lag (
To investigate the source of the anticorrelated activity, fMRI activity maps were compared with the high-resolution anatomical data. Figure 3 shows an example of fMRI negative and positive correlation maps (A), obtained during the eyes-closed condition, together with magnitude (B) and phase (C) anatomical images. Anticorrelated activity was found predominantly in the proximity of the ependymal vascularization of the ventricular system (darker contrast in anatomical magnitude images), most notably near the ependymal lining of the posterior horns of the lateral ventricles (tributaries to the vein of the posterior horn from the medial and the lateral wall of the posterior horn; Ono et al, 1984; Johanson, 1954), and near the glomus and the choroid plexus of the lateral ventricles (choroidal veins). The focal spots of anticorrelation found dispersed throughout the occipital lobe generally colocalized with large pial veins (Serrano et al, 1972).
To quantify the apparent colocalization of large veins and NBS, we investigated the distribution of baseline EPI signal intensity in ROIAC and in ROIVC (Figure 4). Across subjects, in ROIAC with respect to ROIVC, we found a larger contribution (
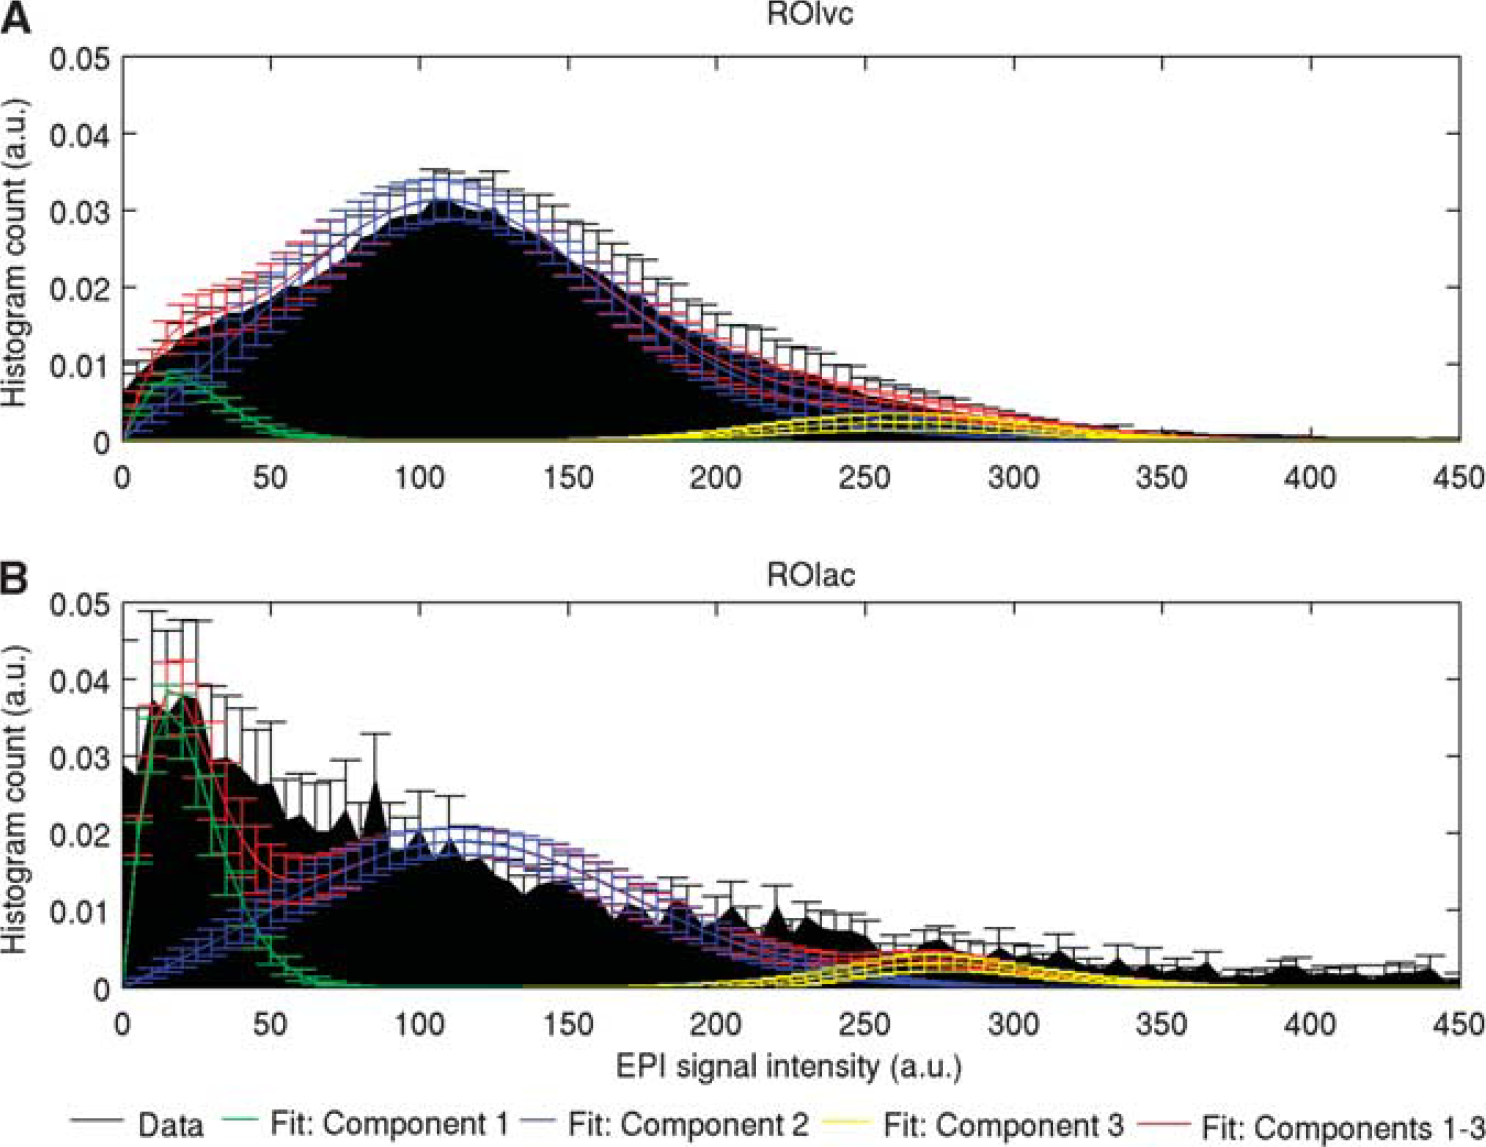
Group average (± s.e.) normalized histogram count (black) of functional magnetic resonance imaging (fMRI) baseline signal amplitude between 0 and 450 (a.u.) in voxels displaying positive (
The phenomena described above were reproduced in the multiecho experiment (Experiment 3), which showed significant correlations and anticorrelations at all echo times (Figures 5A and 5B). Furthermore, calculated T*2 images from the multiecho data mirrored the observations at individual echo times. Interestingly, the polarity of the correlations was reversed in the calculated S0 maps (Figures 5A and 5B). The anticorrelation between the average signal in ROIAC in T*2 and S0 images (Figures 5C and 5D) was significant (
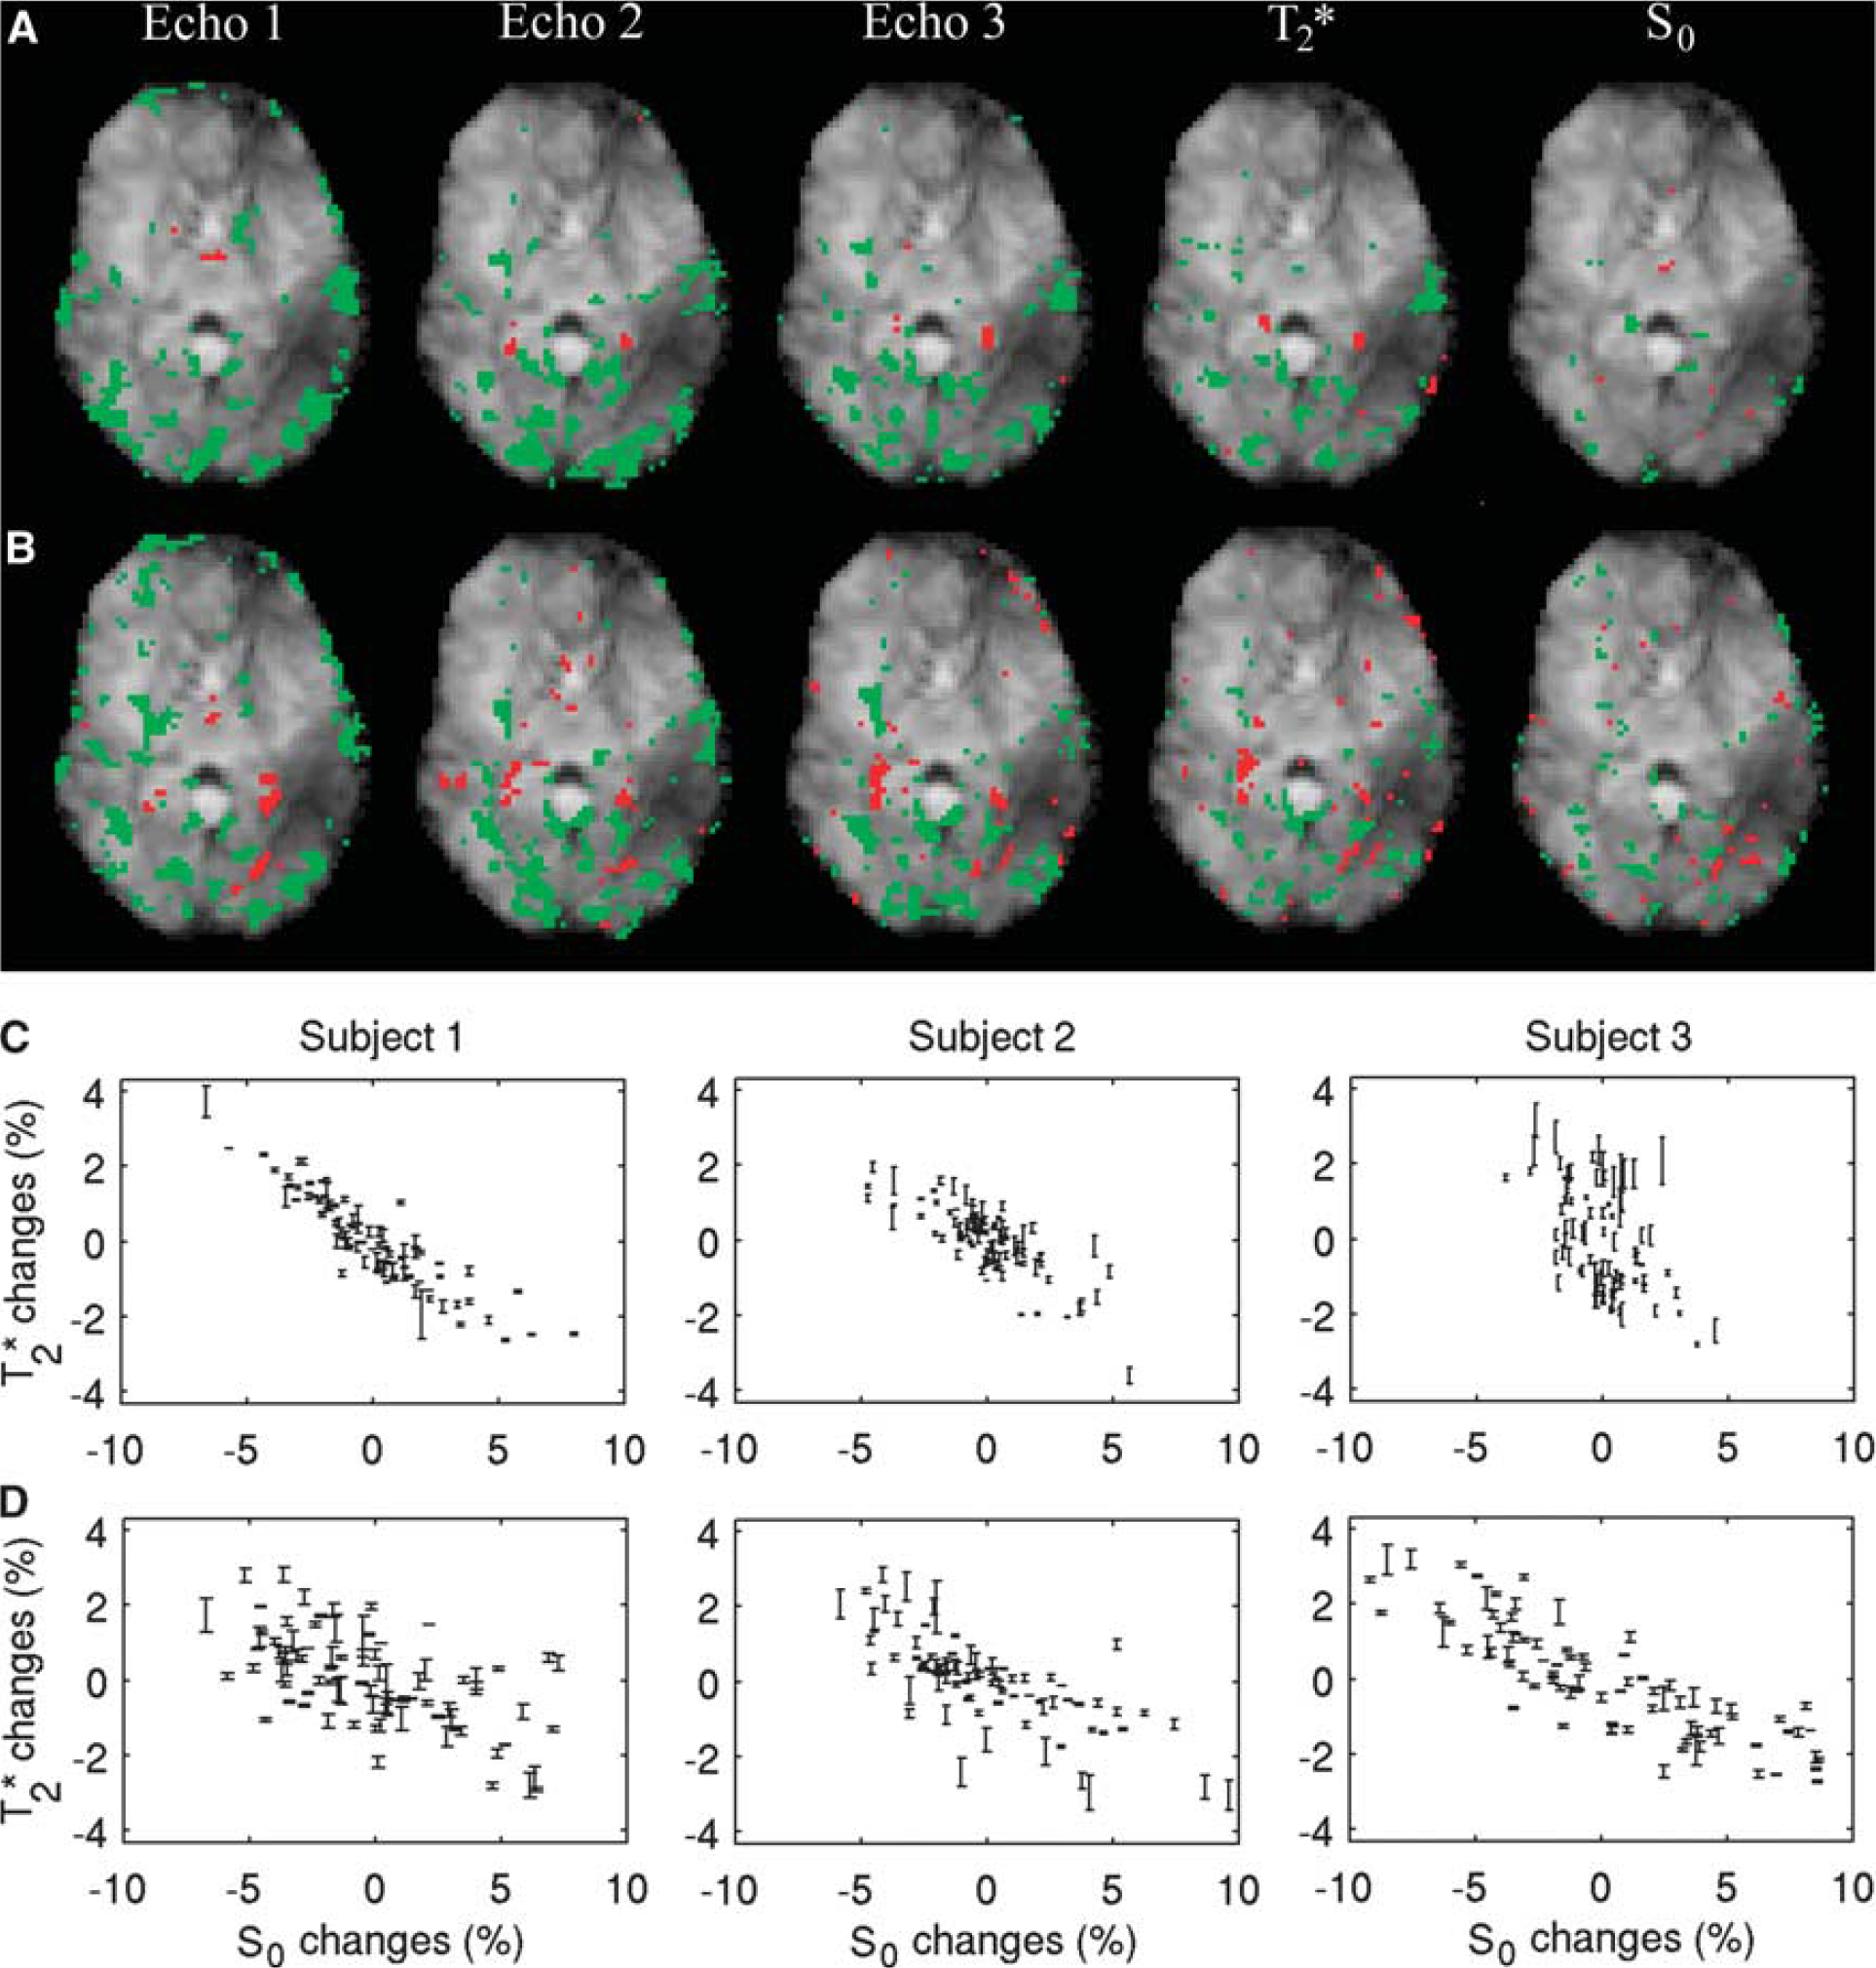
Maps of correlation (green/red = positive/negative
Analysis of the strength and of the sign of the correlation between periventricular areas and the seed time series in the visual cortex (Experiment 3)
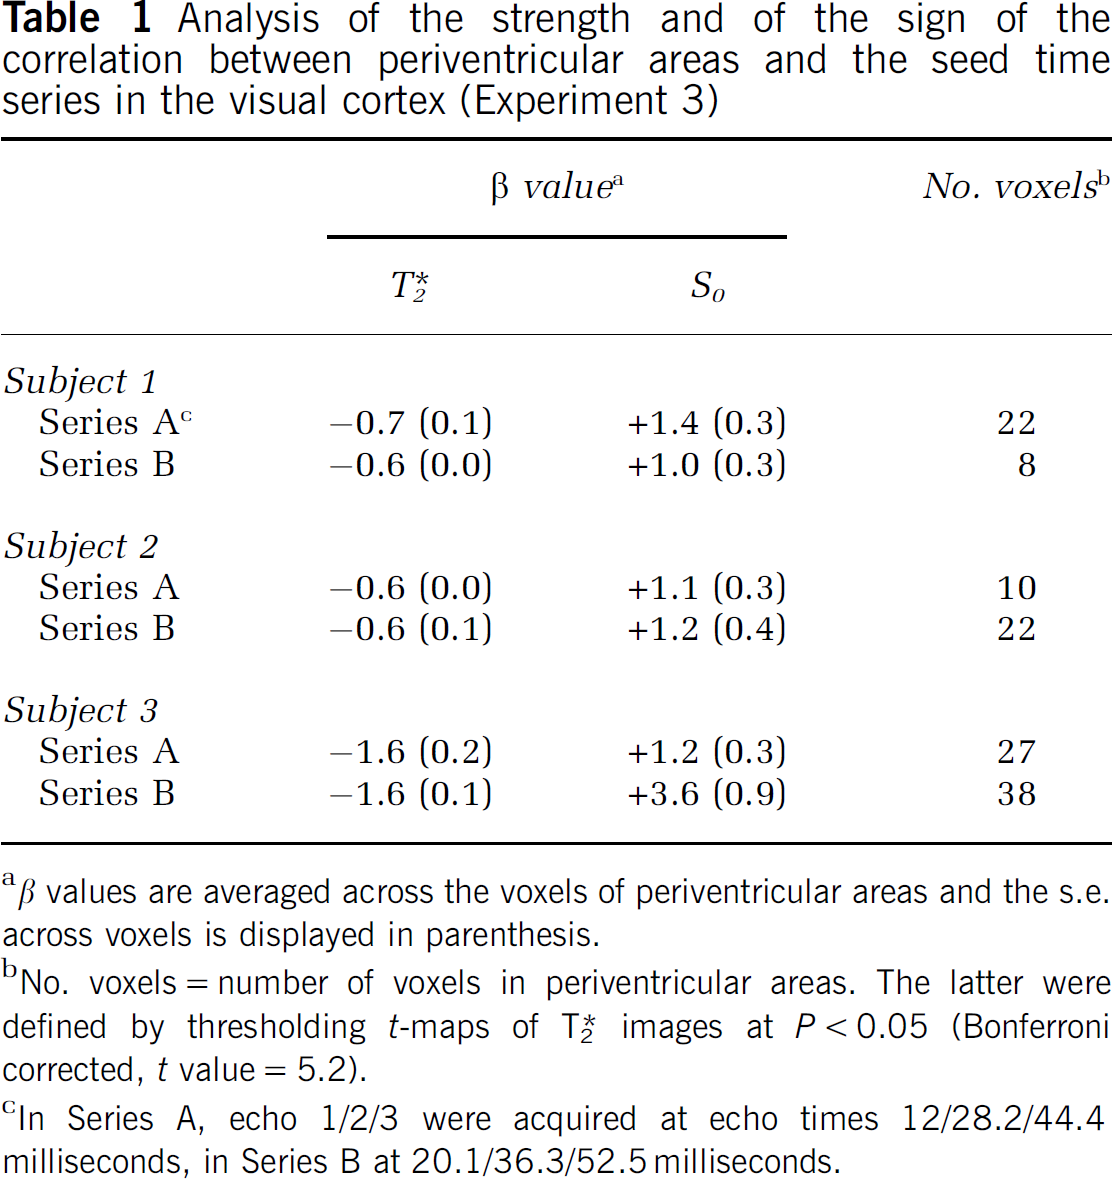
β values are averaged across the voxels of periventricular areas and the s.e. across voxels is displayed in parenthesis.
No. voxels = number of voxels in periventricular areas. The latter were defined by thresholding
In Series A, echo 1/2/3 were acquired at echo times 12/28.2/44.4 milliseconds, in Series B at 20.1/36.3/52.5 milliseconds.
To further analyze these findings in periventricular regions, we used a bicompartment model to simulate the contributions of CSF and blood, the two main constituents of this region (see Appendix). Results of this modeling indicate that the opposing changes in T*2 and S0 are consistent with blood volume changes. This can be intuitively understood considering that both T1 and T*2 are shorter in blood than in CSF, and therefore blood volume increases will reduce both the voxel averaged T1 and T*2. Under general fast imaging conditions, apparent T1 decreases lead to S0 increases. In contrast, blood T*2 decreases in the absence of a blood volume increase will reduce the voxel T*2 but will not affect S0.
On the basis of this bicompartmental model, we proceeded to estimate the fractional blood volume change required for the observed 1.8% SC at 7T (obtained in periventricular areas on average across subjects in Experiment 1, see Figure 2D, eyes-closed condition). For a vessel with its axis parallel to B0, the results of calculations are shown in Figure 6A. Starting from a baseline fractional blood volume
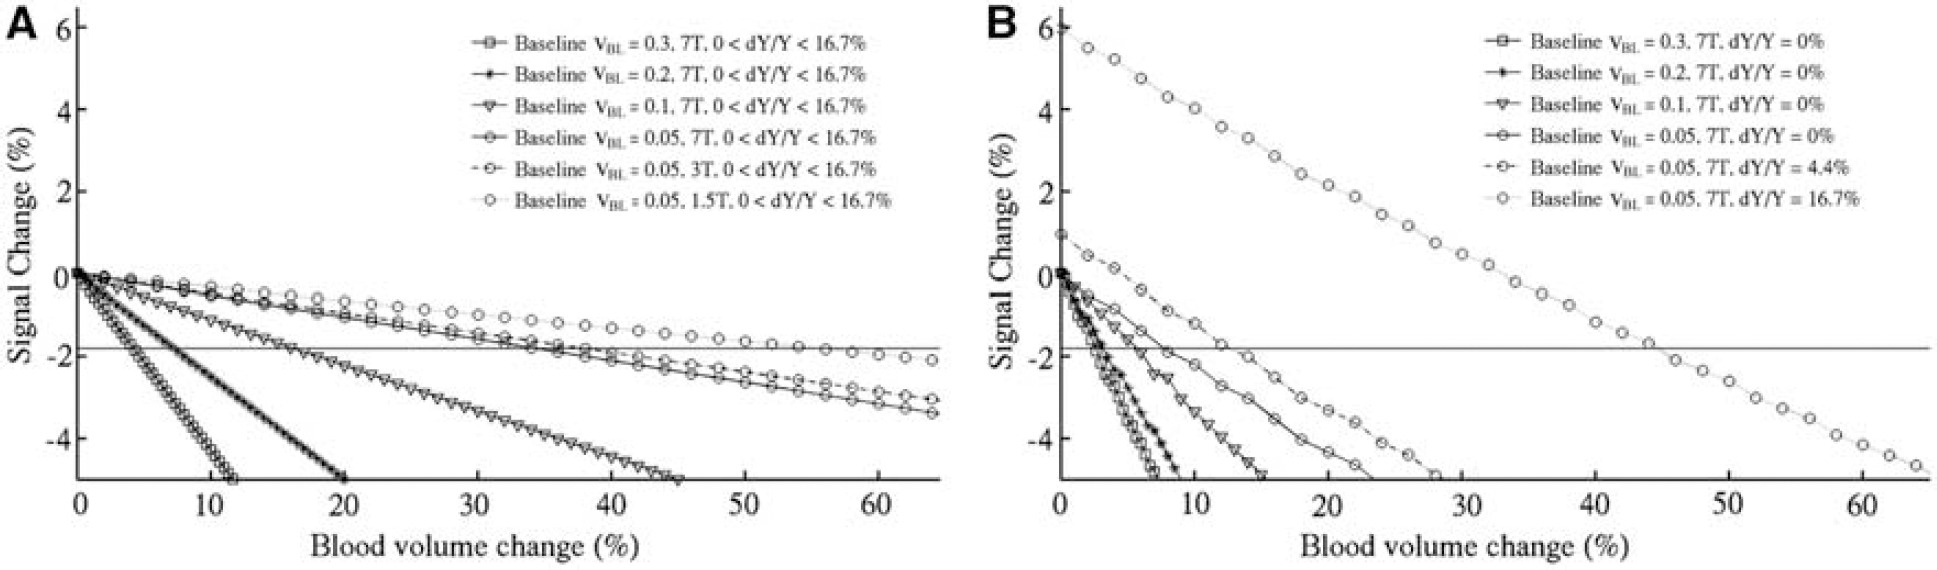
(
Extending this calculation to lower field strengths (1.5 and 3 T), we found that, for the same baseline
Moreover, for a fixed field strength (e.g., 7T), voxel size, and blood volume change, a larger baseline
Discussion
In BOLD-fMRI, negative activation in task-evoked studies and anticorrelation in resting-state data have been observed under varying conditions. Although these phenomena may generally represent local neuronal deactivation (Devor et al, 2007, Shmuel et al, 2006, Raichle et al, 2001), the results of the current study suggest that this is not always the case. Here, we show that under particular circumstances, the otherwise robust BOLD contrast mechanism can break down and lead to spurious anticorrelated activity. Using high-resolution fMRI at high field, we show that anticorrelation with the VC is observed in voxels with CSF and large veins and apparently devoid of neural tissue. Such voxels in periventricular regions have been previously shown to exhibit anticorrelation during task performance (van der Zwaag et al, 2009), and rest conditions (Hong et al, 2009; Olbrich et al, 2009; Moosmann et al, 2003). Importantly, the T*2 and S0 (i.e., TE-independent) changes in these areas, derived from multiecho data, suggest that blood volume effects in large veins may underlie the observed anticorrelation; the strongest effects would occur in voxels that have high proportions of venous blood and CSF and are downstream from the activated sites (such as periventricular areas and the larger pial veins). Simulations suggest that magnitude of the observed T*2 and S0 changes can be plausibly explained with two-compartment model of CSF and venous blood contribution to the voxel signal.
BOLD contamination in large draining veins is a recognized confounding effect in the fMRI literature (Lee et al, 1995; Turner, 2002). Large positive BOLD SCs, lagged by about 3 seconds with respect to the early onset BOLD activation, are reported in large draining veins close to activation areas (Lee et al, 1995), with time delays resulting from transit-time effects as the oxygenated blood passes through the vasculature. Here, we report on a different mechanism in large cerebral veins: first, signals in ROIAC were not time delayed but purely in antiphase, with respect to those in ROIVC (a pool of sulcal vessels in the occipital lobe 180° out phase, with respect to an early onset activation was also reported by Lee et al, 1995); second, negative and not positive BOLD signals were found in those large vessels; third, large vessel both close to (pial veins) and remote from (periventricular ependymal veins) the activation area were negatively activated.
Our finding of negative BOLD around large cerebral veins suggests a mismatch between blood volume increases and oxygenation changes in those vessels (see for instance Figure 6B). This invites speculation on the possible causes of such a mismatch. Smaller oxygenation changes in larger versus smaller veins could be explained by downstream oxygen diffusion outside the vasculature or downstream dilution of activation-related blood oxygenation changes (Turner, 2002). For instance, the fractional blood oxygenation change was shown to decrease as a function of distance from activated areas, for example to 25% of its initial value at a distance of 2.5 cm from an activation area of 100 mm2 (Turner, 2002; for instance, see in Figure 6B the SCs caused by blood volume changes for an oxygenation change of 4.4% and 16.7%). The reduction in oxygenation change at distal sites might not be matched by an equal reduction in blood volume changes and as a result produce NBSs.
The hypothesis that blood volume changes with little or no change in blood oxygenation cause a decrease in BOLD signals has been previously proposed as an explanation for the poststimulus undershoot (Buxton et al, 2004) and the initial dip (Uludag, 2010) of the BOLD response. The initial dip may be related to blood volume changes in blood vessels with high oxygen concentration (arterioles and arteries; Uludag, 2010); a differential temporal dynamic of blood volume and blood flow changes might be the cause of the BOLD poststimulus undershoot (Buxton et al, 2004). Our findings are in agreement with these predictions that tie neural activity to venous blood volume increases that tend to reduce the fMRI signal. Nevertheless, unlike the BOLD undershoot, we believe that NBSs in large veins are caused by a different relationship between blood volume and oxygenation changes rather than a differential temporal dynamics of blood volume and oxygenation.
Although some large vessels surrounded by CSF on the brain surface close to the activation area displayed NBS changes (see for instance three of them in Figure 3A, upper row), negative BOLD, in general, was more apparent in periventricular regions more distant from the activation area. An explanation of this finding might be related to the vessel size and distance from the activation area. The draining veins from active areas combine a negative volume effect with a positive BOLD effect, e.g., the increased flow in the activated area results in a lower deoxyhemoglobin concentration. Combined with the increase in volume, the total deoxyhemoglobin content change may be close to zero. The negative volume effect would be expected to be stronger farther from the activation site, where there could be volume changes without an appreciable decrease in deoxyhemoglobin concentration. Indeed, in the case of a very long vascular pathway, one would expect the venous oxygenation to be close to tissue oxygenation irrespective of flow velocity, because of oxygen diffusion across the vasculature. An activity induced flow velocity increase may therefore lead to a smaller decrease in deoxyhemoglobin concentration in largest veins compared with smaller veins. Moreover, as visible from our calculations (see Figure 6), larger baseline blood volume fractions induce larger signal decreases, thus negative BOLD is stronger for larger than for smaller vessels. For small oxygenation changes (e.g., d
Spurious negative activity is generally observed in scattered voxels throughout the brain, and their number may exceed that expected from the applied statistical threshold. In part, this activity may be caused by noise sources that do not obey model assumptions such as motion and cardiac and respiratory rate. However, these phenomena are unlikely to have caused the current observation for two reasons: first, anticorrelated activity was modulated by behavior, and this was not the case for motion-related parameters. Second, physiologic noise was removed before seed analysis, accounting both for signal fluctuations related to the phase of physiologic cycles (Glover et al, 2000) and to changes in physiologic rates (dual-lagged model; Bianciardi et al, 2009b). Periventricular activation was defined on the residual signal fluctuations after removal of these noise sources; therefore, the impact of physiologic noise on periventricular activity was negligible. Moreover, anticorrelations were not introduced by physiologic noise correction, as they were present both before and after physiologic noise correction (see Figure 2B). We also verified if the use of the dual-lagged model for fluctuations in physiologic rates optimized for the gray matter (Bianciardi et al, 2009b) could have biased the obtained result in periventricular areas. This was not the case, as RV and cardiac-rate regressors did not significantly correlate with signals in ROIAC for any introduced temporal shift (lag times ranging between −21 and 21 seconds).
In this study at 7T (as in van der Zwaag et al, 2009), negative activity occurred not only in periventricular regions, as observed in previous work at lower field strength (Hong et al, 2009; Olbrich et al, 2009; Moosmann et al, 2003), but also in scattered sulcal areas with large pial venous vessels. This invites the question of why these sulcal effects were visible only at high magnetic fields. This could have a number of reasons, including the choice of experimental parameters. For example, the size of the effect is expected to depend on the spatial resolution, with a generally smaller effect expected for the relative coarse resolution used in typical fMRI experiments. Furthermore, at coarser resolution, negative effects caused by blood volume are more likely to be canceled out by positive tissue T*2 effects. Finally, the size of the effect will depend on TR, TE, flip angle, and field strength used for fMRI acquisition, as they govern the relative size of the counteracting S0 and T*2 effects.
Conclusion
Data obtained in this study suggest that blood volume effects in large veins downstream from activated brain areas may reduce the BOLD signal and lead to apparent negative activation. The effect is expected to be most apparent in high-resolution experiments, where it may appear spatially distinct from positive activation and veins occupy a larger volume fraction in some voxels. In lower resolution experiments, negative activation may not be spatially distinct but rather reduce signal in positively activated regions. Conversely, the findings of this study suggest that increasing the resolution in fMRI may increase the sensitivity by reducing signal cancellation caused by concurrent T*2 and blood volume effects.
Footnotes
The authors declare no conflict of interest.