
Abstract
Chronic hydrocephalus (CH) is characterized by the presence of ventricular enlargement, decreased cerebral blood flow (CBF), and brain tissue oxygen delivery. Although the underlying pathophysiological role of vascular endothelial growth factor (VEGF) is not clear, ischemic–hypoxic events in CH are known to trigger its release. Previously, we have shown increased VEGF receptor-2 (VEGFR-2) and blood vessel density (BVd) in the hippocampus after CH. We investigated changes in neuronal and glial VEGFR-2 density and BVd in the caudate nucleus in an experimental model of CH. Animals with CH were divided into short term (ST, 2 to 4 weeks) and long term (LT, 12 to 16 weeks) and were compared with surgical controls (SCs, 12 to 16 weeks). The cellular and BVds were estimated using immunohistochemical and stereological counting methods. Overall, percentage (%)VEGFR-2 neurons were approximately two times greater in CH (ST, LT) than in SC. By comparison, glial cell %VEGFR-2 was greater by 10% to 17% in ST and 4% to 11% lower in LT compared with that in SC. Blood vessel density was significantly lower in CH than in SC in the superficial caudate. Changes in cerebrospinal fluid ventricular volume and pressure, as well as in CBF did not correlate with either VEGFR-2 or BVd. These observed findings suggest that destructive forces may outweigh angiogenic forces and possibly show a disassociation between VEGFR-2 and BV expressions.
Introduction
Chronic hydrocephalus (CH) may be considered a form of cerebral ischemia–hypoxia resulting from impaired cerebral blood flow (CBF) as a result of mechanical compression and brain distortion (Del Bigio and Bruni, 1988; Dombrowski et al, 2006; Edwards et al, 2004; Momjian et al, 2004; Owler et al, 2004). Although most studies have described cerebrovascular compression in CH (Del Bigio and Bruni, 1988), a few studies have observed increased vascular density in certain brain regions and at various time points in CH (Dombrowski et al, 2008; Luciano et al, 2001; Ransohoff et al, 1975). Previously, we have shown an initial decrease in vascularity followed by a return above baseline in cortical gray and periventricular white matter in CH (Luciano et al, 2001). We have also shown a sustained increase in BVd in the hippocampus after the induction of CH. The blood vessel density (BVd) changes in CH have been observed to occur in both directions, and different tissues have shown different responses. The size and direction of these observed BVd changes could not be explained by a simple spatial compression of an intact vascular tree.
Many studies have indicated a chronic hypoxic state in hydrocephalus (Del Bigio, 1993; Edwards et al, 2004; Higashi et al, 1986). Thus, it is possible that in this state there may be an increase in angiogenic factors as well as increases in the BVds. Changes in BVd have been correlated with the angiogenic factor vascular endothelial growth factor (VEGF) and its receptor VEGFR-2, which has a predominant role in the formation of new BVs (Dvorak, 2005; Rosenstein and Krum, 2004). Experimental evidence suggests a direct relationship between VEGF/VEGFR-2 and BVd (Issa et al, 1999; Manoonkitiwongsa et al, 2004). Earlier, we have shown a sustained increase in VEGFR-2 receptors associated with increased BVd in the hippocampus of hydrocephalic animals (Dombrowski et al, 2008).
Using an experimental model of CH that was developed previously in our laboratory (Dombrowski et al, 2006; Dombrowski et al, 2008; Fukuhara et al, 2001; Johnson et al, 1999; Luciano et al, 2001), we investigated the relationship between vascular density and VEGFR-2 (neuronal and glial) density in the superficial and deep regions of the caudate nucleus. The caudate nucleus is a periventricular structure vulnerable to compression and/or stretching during CH-induced ventriculomegaly. The basal ganglia are involved in both voluntary and involuntary motor functions and damage specifically to the caudate nucleus may also be involved in gait impairment seen in CH. Clinical and experimental evidence also suggests a pronounced decrease in caudate nuclei volume and CBF in the head of the caudate in CH (Dombrowski et al, 2006; Owler et al, 2004).
The goal of this study was to quantify changes in BVd in the caudate nucleus of hydrocephalic animals, and to investigate their relationship to changes in neuronal and glial VEGFR-2 density using immunohistochemical and stereological methods.
Materials and methods
Animals
A total of 15 (n=15) young adult, male canines (Canis familiaris) approximately 8 to 9 months of age, weighing 25 to 30 kg were used in this study. The animals were divided into three groups, namely CH short term (CH-ST, 2 to 4 weeks), CH long term (CH-LT, 12 to 16 weeks), and surgical controls (SCs, 12 to 16 weeks) according to the duration of condition. The animals were obtained from licensed suppliers and quarantined for a minimum of 7 days before entering into the study. All the animals were maintained at the Cleveland Clinic's fully accredited Animal Care Facility in accordance with Public Health Service policy and the Health Research Extension Act (PL99 to 158) under the rules and regulations of the Guide for the Care and Use of Laboratory Animals.
Surgical Induction of Chronic Hydrocephalus
The surgical procedure used to induce chronic obstructive hydrocephalus in an experimental animal was originally developed in our laboratory (Johnson et al, 1999) and has been studied extensively (Dombrowski et al, 2006; Dombrowski et al, 2008; Fukuhara et al, 2001; Luciano et al, 2001). This procedure has been explained in detail in our earlier report (Luciano et al, 2001). Surgical control animals were generated using the same procedures as those described for experimental CH animals, with the exception of a saline injection into the fourth ventricle rather than cyanoacrylic gel.
Volumetric Analysis
Magnetic resonance images were collected before CH induction (i.e., at baseline) and again at the time of killing for all animals and were used to assess the anatomic severity of hydrocephalus. Routine spin-echo magnetic resonance images were acquired using a 1.5 T Siemens vision magnetom (Siemens, Erlangen, Germany) and archived onto an optical disc for subsequent volumetric analyses. Separate measures for brain and ventricular volume were obtained by manually tracing their contours on approximately 60 to 80 sections in the coronal plane of 1-mm-thick gapless sections from digital images using an image analysis system (Neurolucida, Microbrightfield, version 4.0, Colchester, VT, USA).
Intracranial Pressure Measurement
Intraoperative intracranial pressure measures were obtained for all animals at baseline and then again at the time of killing as described previously (Fukuhara et al, 2001; Dombrowski et al, 2006). The procedure has been explained in detail in our earlier reports (Luciano et al, 2001).
Cerebral Blood Flow Measurements
Left Atrium Catheterization and Microsphere Injection
The surgical procedure using the CBF microsphere injection method has been described in detail previously (Dombrowski et al, 2006).
Cardiac Output
Cardiac output (CO) (expressed in L/min) measures were obtained using the thermodilution method by pulmonary artery (Swan–Ganz) catheterization similar to an earlier report (Dombrowski et al, 2006). Cardiac output measures were obtained at baseline and before killing.
Killing and Tissue Preparation
For the killing, the animals were deeply anesthetized with sodium pentobarbital in combination with inhaled isoflurane and perfused through the left atrial port access with 4% paraformaldehyde in 0.1 mol/L phosphate-buffered saline (PBS). The brains were removed and postfixed for 48 h in 4% paraformaldehyde for the study of gross pathology, frozen sectioning, and VEGFR-2 immunohistochemistry. The brains were then cut into serial coronal sections on a freezing microtome at 40 μm and subjected to immunohistochemical staining (VEGFR-2, glial fibrillary acidic protein (GFAP), neuronal nuclei (NeuN)) and silver staining for BVs.
Immunohistochemistry for VEGFR-2, GFAP, and NeuN
Immunohistochemical staining for VEGFR-2 was performed on free floating sections that were rinsed thoroughly in 0.1 mol/L of PBS before treatment with a solution of 3% H2O2 and 10% methanol in 0.1 mol/L of PBS to reduce staining from endogenous peroxidase. The obtained tissue was then incubated in 3% blocking serum (Goat IgG (immunoglobulin G); Vectastain Elite ABC Kit, PK-6105, Vector Laboratories, Burlingame, CA, USA) with 0.3% Triton-X 100 in 0.1 mol/L of PBS followed by an overnight incubation at 4°C with polyclonal anti-mouse VEGFR-2 (Flk-1) antibody (AF644, Anti-mouse VEGFR-2 (Flk-1), R&D Systems, Minneapolis, MN, USA). The sections were rinsed thrice in 0.1 mol/L of PBS and then treated in secondary biotinylated anti-goat IgG. Tissue sections were treated with ABC (avidin–biotin complex) followed by a rinse with 3,3-diaminobenzidine tetrahydrochloride (DAB Substrate Kit, Vector Laboratories).
NeuN and GFAP Staining: To clearly identify neurons and glial cells, the VEGFR-2-stained tissue was double labeled with NeuN and GFAP. In brief, the tissue was incubated in 3.0% normal horse serum (Mouse IgG Vectastain Elite ABC Kit, Vector Laboratories) with 0.3% Triton-X 100 in 0.1 mol/L of PBS followed by an overnight incubation at 4°C with monoclonal anti-NeuN antibody (monoclonal, anti-mouse NeuN, no. MAB377, Chemicon International, Temecula, CA, USA). Similarly, the VEGFR-2-stained tissue was also incubated with polyclonal anti-GFAP antibody (polyclonal, anti-rabbit GFAP, no. G9269, Sigma, St Louis, MO, USA). The sections were rinsed and treated with a biotinylated anti-mouse IgG then treated with ABC followed by the Vector VIP substrate peroxidase kit (Vector Laboratories). NeuN- and GFAP-stained tissues were cover slipped using the Cytoseal-60 mounting medium (Richard-Allan Scientific, Kalamazoo, MI, USA) as preparation for microscopic analysis and stereological counting methods.
Immunohistological control experiments were carried out by omitting the primary and secondary antibodies individually to distinguish specific VEGFR-2 (GFAP/NeuN) staining from nonspecific binding of the VEGFR-2 antibody.
Blood Vessel Identification: The tissue sections were impregnated with silver (FD NeuroSilver Kit I, FD NeuroTechnologies, Baltimore, MD, USA) to visualize the vascular anatomy. Mounting tissue sections were dehydrated in alcohol, cleared in xylene, and cover slipped using the Cytoseal-60 mounting medium.
Region of Interest Selection: the Caudate Nucleus
The head of the caudate nucleus is located in the anterior horn of the lateral ventricle, rostral to the thalamus. The lateral ventricle serves as its medial border, and the anterior limb of the internal capsule serves as its lateral border. The head of the caudate nucleus was delineated into two divisions, namely superficial and deep caudate. Each caudate region had a dimension of 2.5 × 0.5 mm2 equally through. The two areas selected for stereological analysis were located immediately adjacent to the ventricle (superficial caudate region) and 1 mm from the ventricular surface (deep caudate region).
Sampling of Sections
Five randomly selected sections were sampled from each animal through the head of the caudate nucleus. A sample size of five animals per group (three groups, ST=5, LT=5, and SC=5) was chosen using the coefficient of error of <10% (West, 1993). Each section was processed for VEGFR-2 and for either NeuN or GFAP. Adjacent sections stained with silver were used for BV identification.
Stereological Counting Methods
Cellular Density: The density of neurons and glial cells was estimated using a method adapted from a previous study (Dombrowski et al, 2001; Dombrowski et al, 2008; West, 1993). An unbiased estimation of the numerical density of neurons and glia in the canine caudate nucleus is made by sampling the superficial and deep caudate regions in a systematic random manner using optical dissectors, an extension of the dissector principle. The subdivisions of the head of the caudate nucleus from each coronal section was traced at × 2.5 magnification under a light microscope with a camera attached to a computer using the imaging capture program (Stereo Investigator version 5.04.5, MicroBrightField, Williston, VT, USA). Neurons (NeuN+) and astrocytes (GFAP+) were counted in 40-μm-thick sections using an optical dissector at × 100 magnification under oil immersion with a dissector volume of 36,000 μm3 (height=30 μm, width=30 μm, thickness=40 μm). Five slides, corresponding to ∼10% or more of the total area, were counted with 30 to 35 randomly placed dissector counters per region.
Blood Vessel Density: The BVds in the canine caudate nucleus were estimated using stereological methods modified from previous studies (Dombrowski et al, 2008; Lokkegaard et al, 2001). Blood vessels were counted at × 40 magnification with a dissector volume of 300,000 μm3 (height=75 μm, width=100 μm, thickness=40 μm). Approximately, 40 to 45 randomly placed dissectors were used to count BVs in each caudate region. To quantify the total BVd, both transverse and longitudinal BVs were counted.
Stereological procedures were carried out by two independent investigators (AD and AL), and the interinvestigator and intrainvestigator reliability was >90%.
Statistical Analysis
The results obtained from this study were expressed as mean±s.e. of the mean for BV and VEGFR-2 density, total cell density, and percentage (%)VEGFR-2 cells. Statistical comparisons were made among the three groups (ST-CH, LT-CH, and SC), caudate subdivisions (superficial and deep), and cell type (neurons and glia) using one-way ANOVA (analysis of variance) followed by subsequent two-tailed unpaired Student's t-tests. Correlations were made between BV and VEGFR-2 density, and cerebrospinal fluid (CSF) volume, CBF, and pressure and CO. Paired t-tests were used to compare both preinduction and postinduction volumetric changes. Statistical significance was accepted at the probability level of P≤0.05.
Results
Using quantitative stereological counting methods, we estimated the density and %VEGFR-2 in neurons and glial cells and BVd in superficial and deep caudate nucleus regions in experimental CH and SC animals.
Confirmation of Hydrocephalic Induction
After induction of hydrocephalus, the total volume of CSF increased ∼200% in CH animals compared with 14% in SC animals (P≤0.01; Figure 1). There was no significant difference in CSF volume between ST and LT CH groups. There was no difference in intracranial pressure between CH and SC groups. There was no incidence of mortality or morbidity in any animal for either the experimental CH or control groups. Autopsy performed in each animal revealed no evidence of intracerebral or intraventricular bleeding, which corroborated with magnetic resonance imaging data.
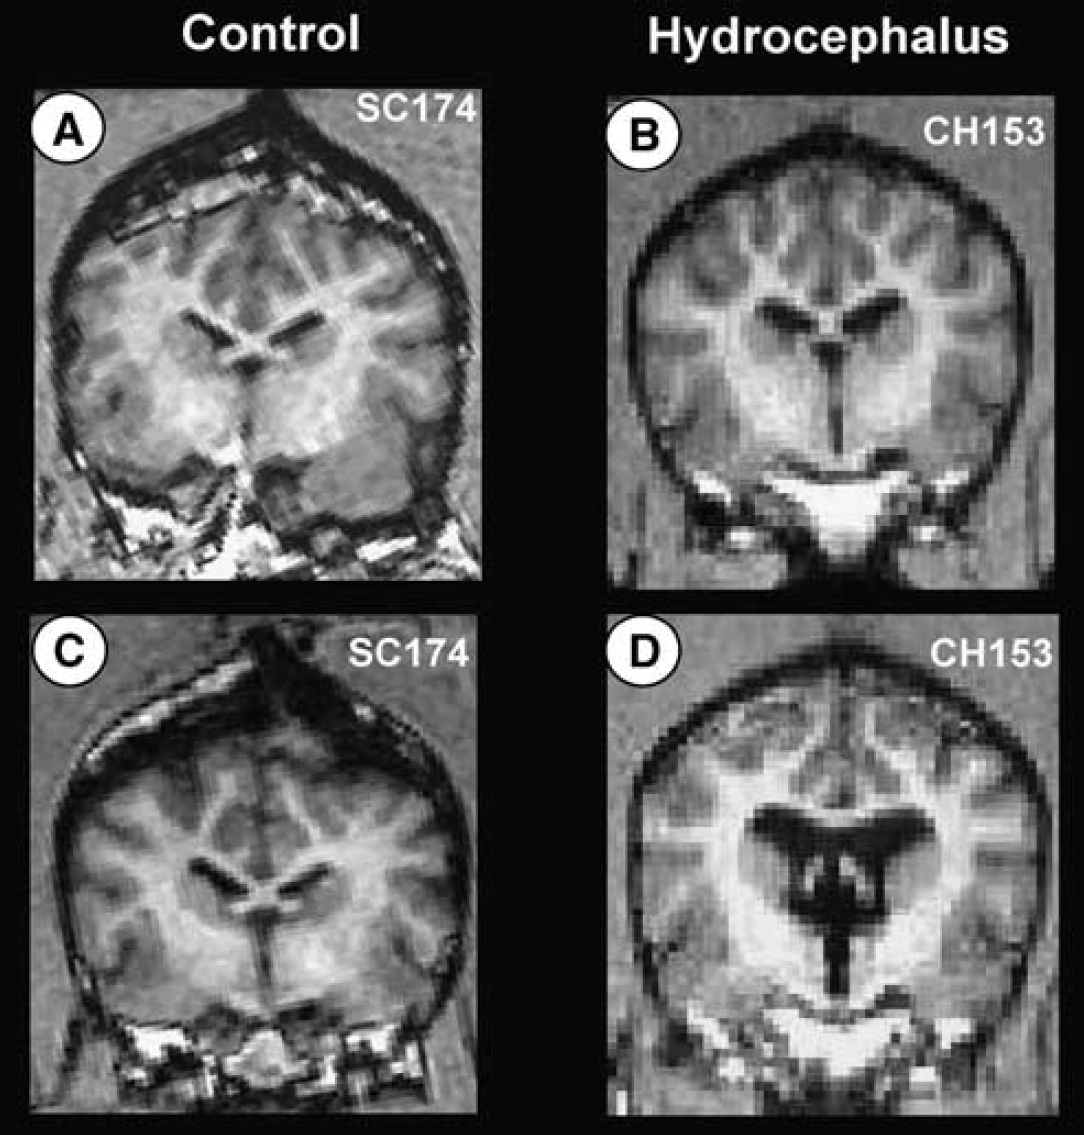
MRI confirmation of CSF ventricular volume change in SC (
Density and %VEGFR-2 Neurons and Glia
Table 1 shows VEGFR-2 neuronal density (Nd), astrocyte density (Gd), and the %VEGFR-2 neurons and astrocytes in superficial and deep caudate regions.
VEGFR-2+density (VEGFR-2+d) and percentage total population and BVd
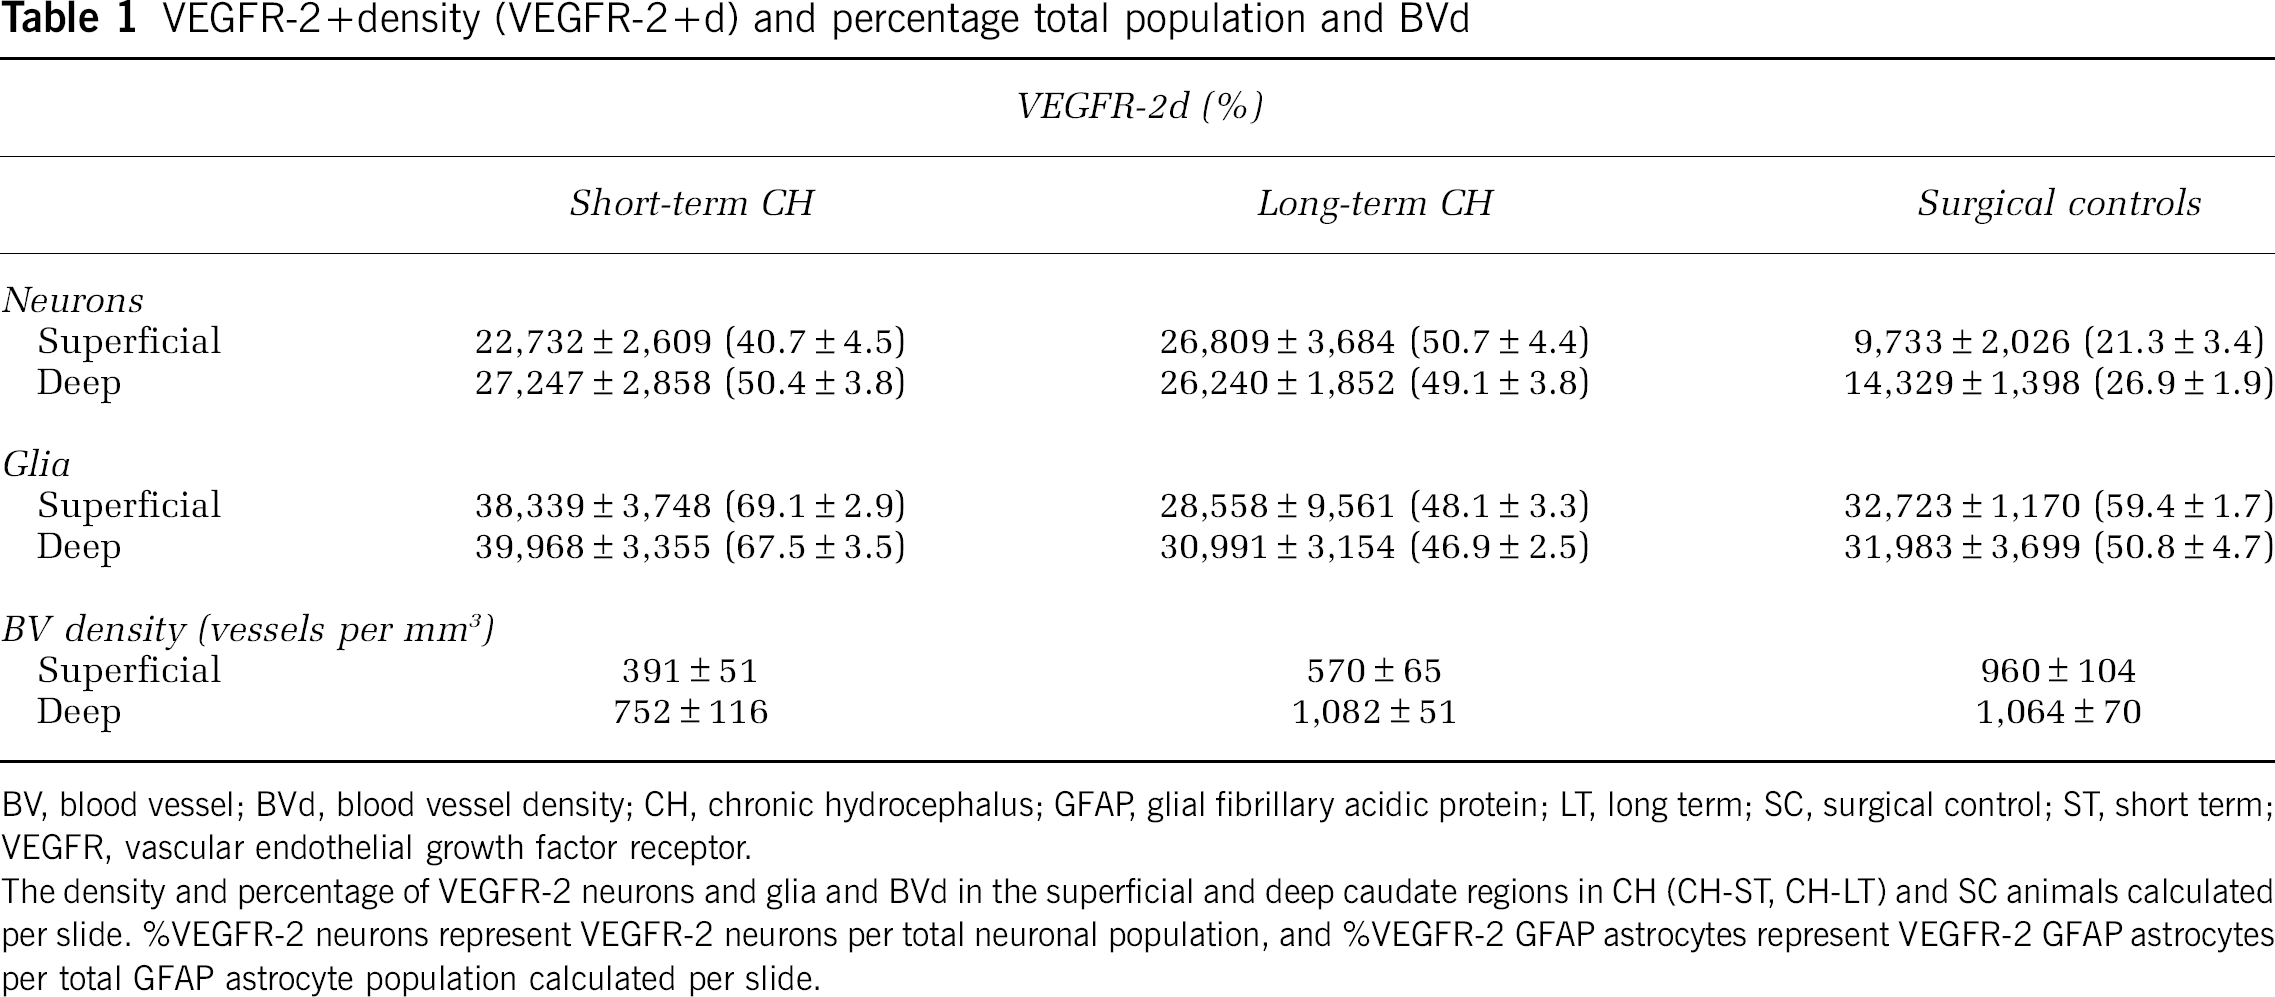
BV, blood vessel; BVd, blood vessel density; CH, chronic hydrocephalus; GFAP, glial fibrillary acidic protein; LT, long term; SC, surgical control; ST, short term; VEGFR, vascular endothelial growth factor receptor.
The density and percentage of VEGFR-2 neurons and glia and BVd in the superficial and deep caudate regions in CH (CH-ST, CH-LT) and SC animals calculated per slide. %VEGFR-2 neurons represent VEGFR-2 neurons per total neuronal population, and %VEGFR-2 GFAP astrocytes represent VEGFR-2 GFAP astrocytes per total GFAP astrocyte population calculated per slide.
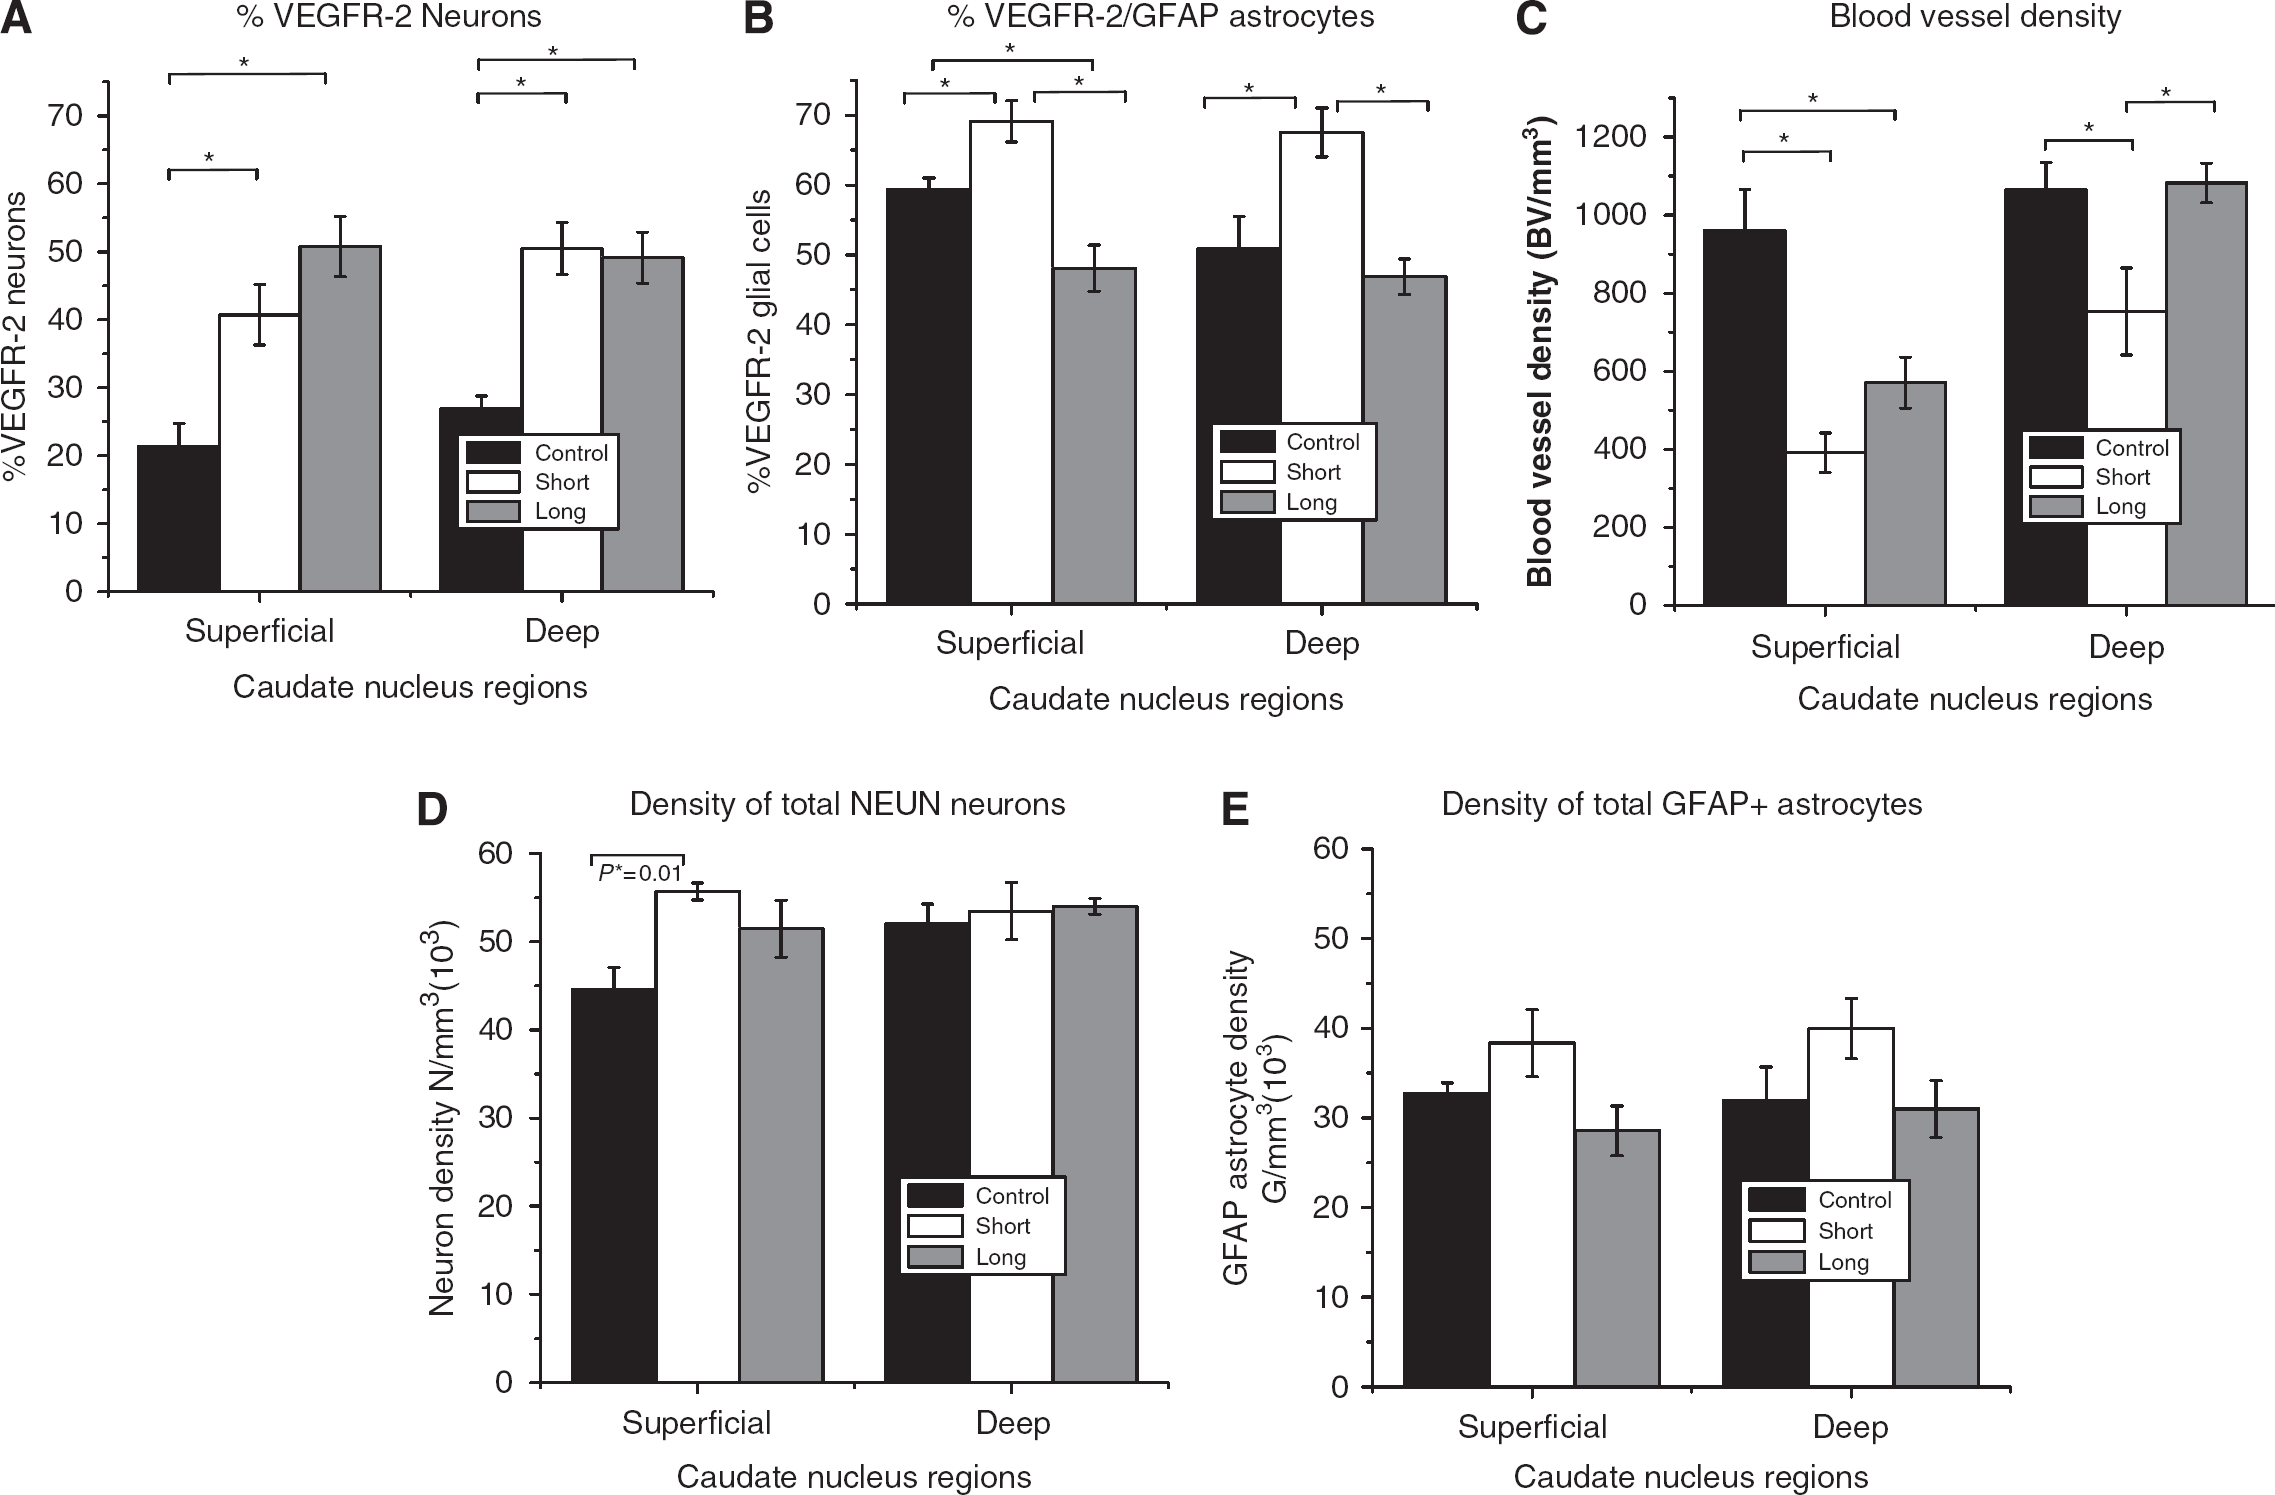
Neurons: Overall, density and %VEGFR-2 neurons for CH animals were significantly higher than for SC animals for both superficial and deep caudate regions (P≤0.01, Figure 2). Specifically, VEGFR-2 Nd and %N were approximately 2 to 3 times greater in CH (ST and LT) groups (22,732±2,609 to 26,809±3,684 N/mm3 (neurons per cubic millimeter); 40% to 50%) compared with that in the SC group (9,733±2,026 to 14,329±1,398 N/mm3; 21% to 26%). There was no statistical difference in %VEGFR-2 or Nd between ST and LT CH groups in either superficial or deep caudate region (Figure 4).
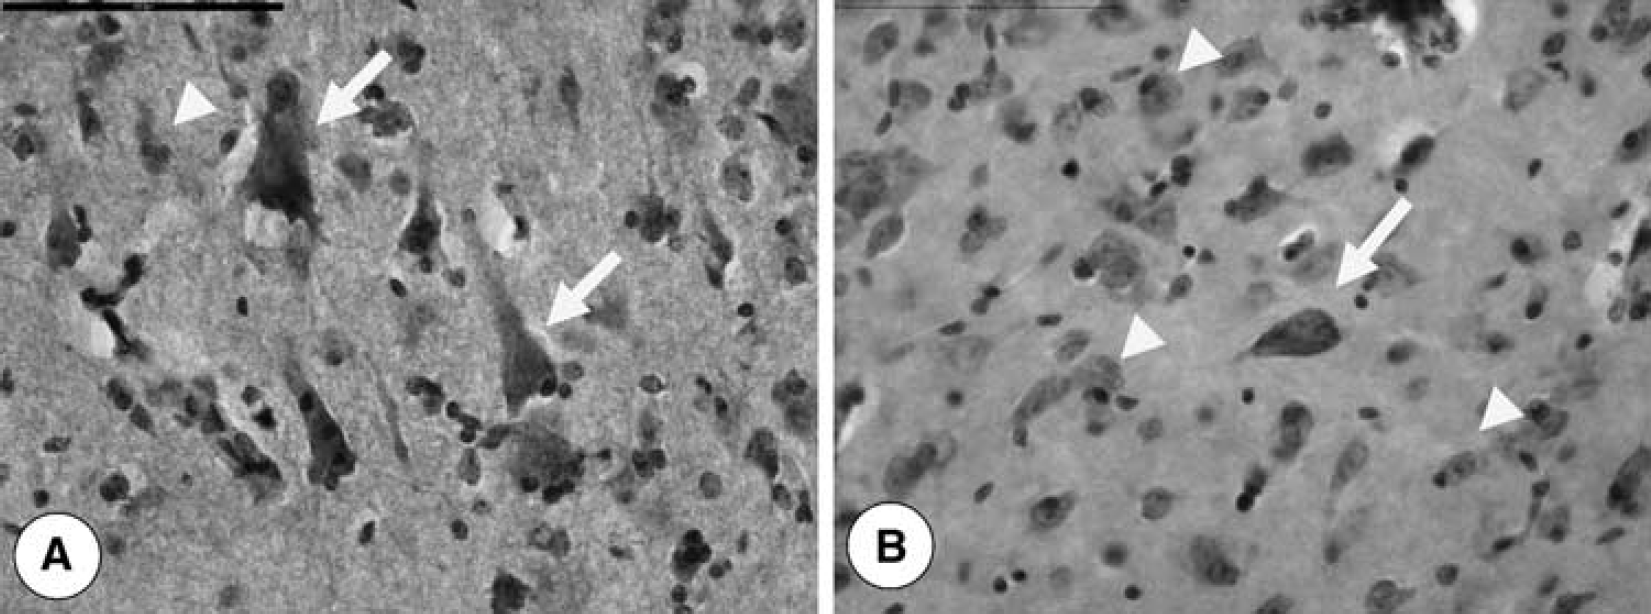
Photomicrographs showing VEGFR-2 positive (arrows) and negative (arrow heads) immunohistochemical expression in neurons. Examples of increased VEGFR-2 expression in CH (
Glial Cells: %VEGFR-2 glia was 10% to 17% greater in CH-ST and 4% to 11% less in CH-LT compared with that in SC. The %VEGFR-2 glial cells between ST and LT CH groups for superficial or for deep caudate regions were not statistically different. In addition, there was no statistical difference in VEGFR-2 Gd between the experimental and control groups (Figure 4).
When all NeuN+ neurons were taken into account, the total neuronal density was significantly higher in CH-ST (55,699 N/mm3) than in SC (44,550 N/mm3) in the superficial caudate (P≤0.01) but not in the deep caudate region (Figure 4). There was no significant difference in the total neuronal density in the superficial caudate between CH-LT and SC groups. Similarly, when all GFAP+ astrocytes were taken into account, there was no significant difference in the total glial density between CH and SC animals (Figure 4).
Blood Vessel Density
Overall, the BVd was approximately 2 to 3 times lower in CH (ST and LT) (391 to 570 BV per mm3) compared with that in SC (960 BV per mm3) in the superficial caudate (P≤0.001, Figure 3), but not significantly different in the deep caudate (Table 1, Figure 4). In the deep caudate region, BVd was lower in CH-ST (752 BV per mm3) compared with that in CH-LT (1,082 BV per mm3) and SC (1,064 BV per mm3) (P≤0.01). There was no significant difference in BVd between CH-LT and SC groups in the deep caudate region. Overall, the BVd in the deep caudate (752 to 1,082 BV per mm3) was approximately twice that of the superficial caudate for CH (ST and LT) animals (391 to 570 BV per mm3). There was no significant difference in BVd between the superficial and deep caudate regions in the SC group (Figure 4).
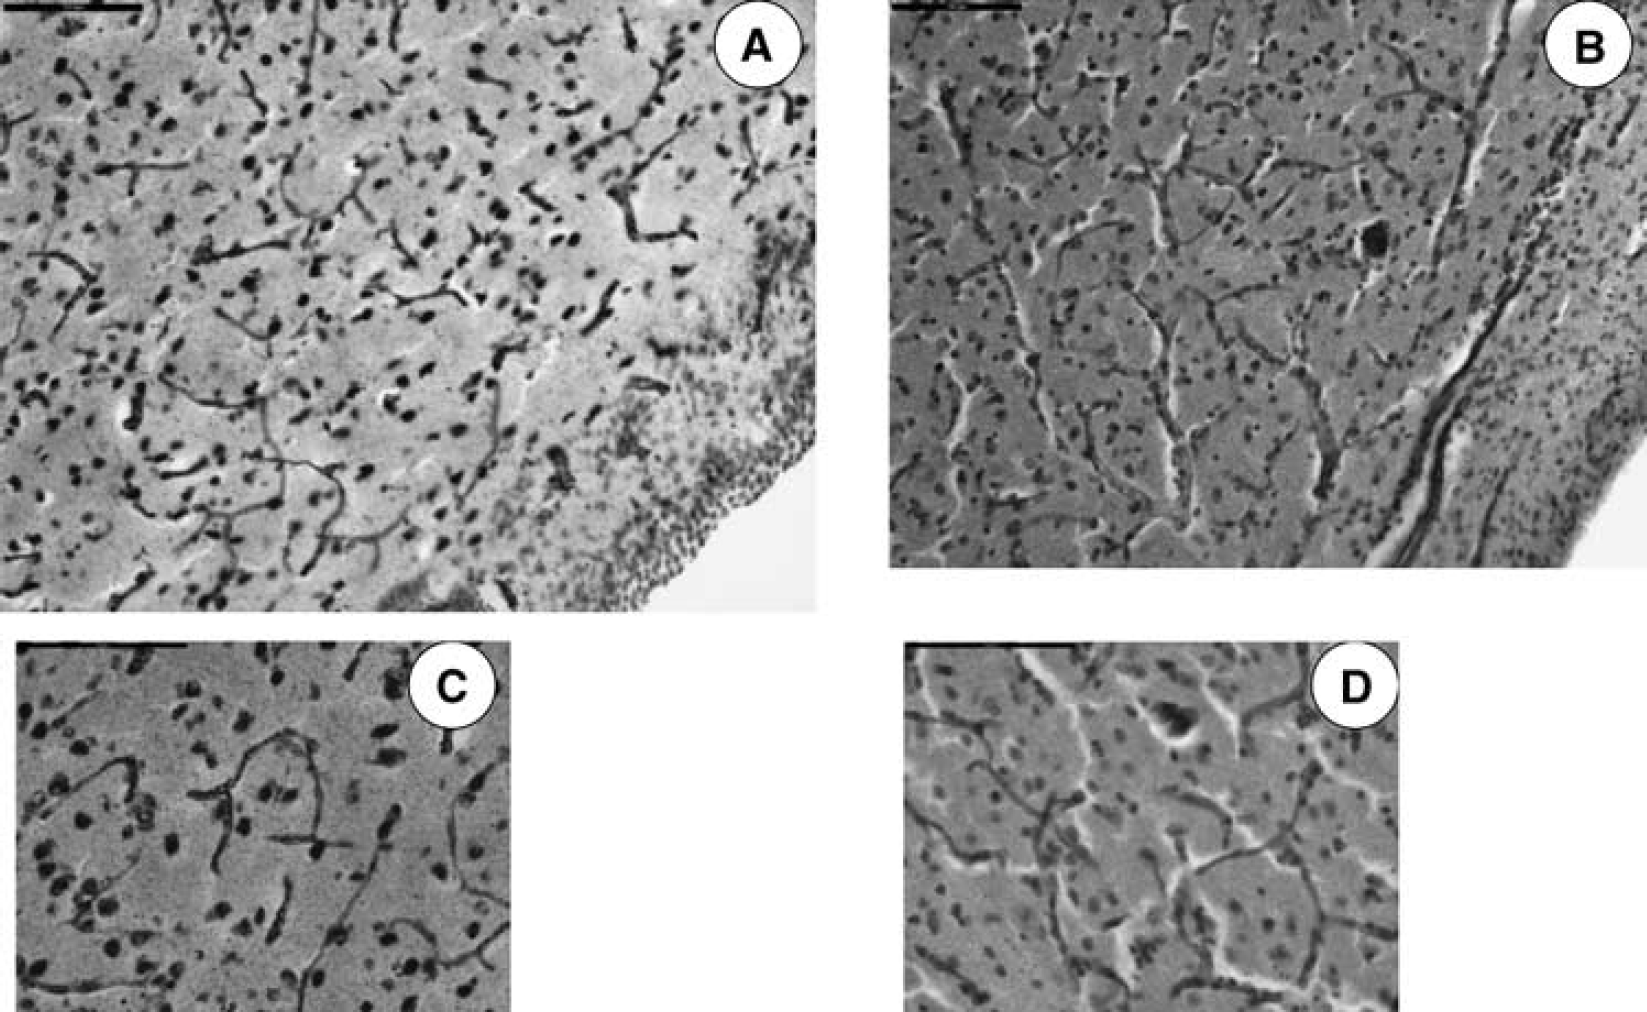
Photomicrographs showing differences in BVd in CH (
Bar graph illustrating %VEGFR-2/NeuN neurons (
Relationships between Severity of Hydrocephalus, CO, CBF, BVD, VEGFR-2, and Intracranial Pressure
Blood vessel density was inversely related to %VEGFR-2 neurons in the superficial caudate (P=0.02, R=−0.56), but did not correlate within the deep caudate region (Figure 5). By comparison, BVd was inversely related to %VEGFR-2 astrocytes in the deep caudate (P=0.05, R=−0.67) and did not correlate in the superficial caudate region (Figure 5).
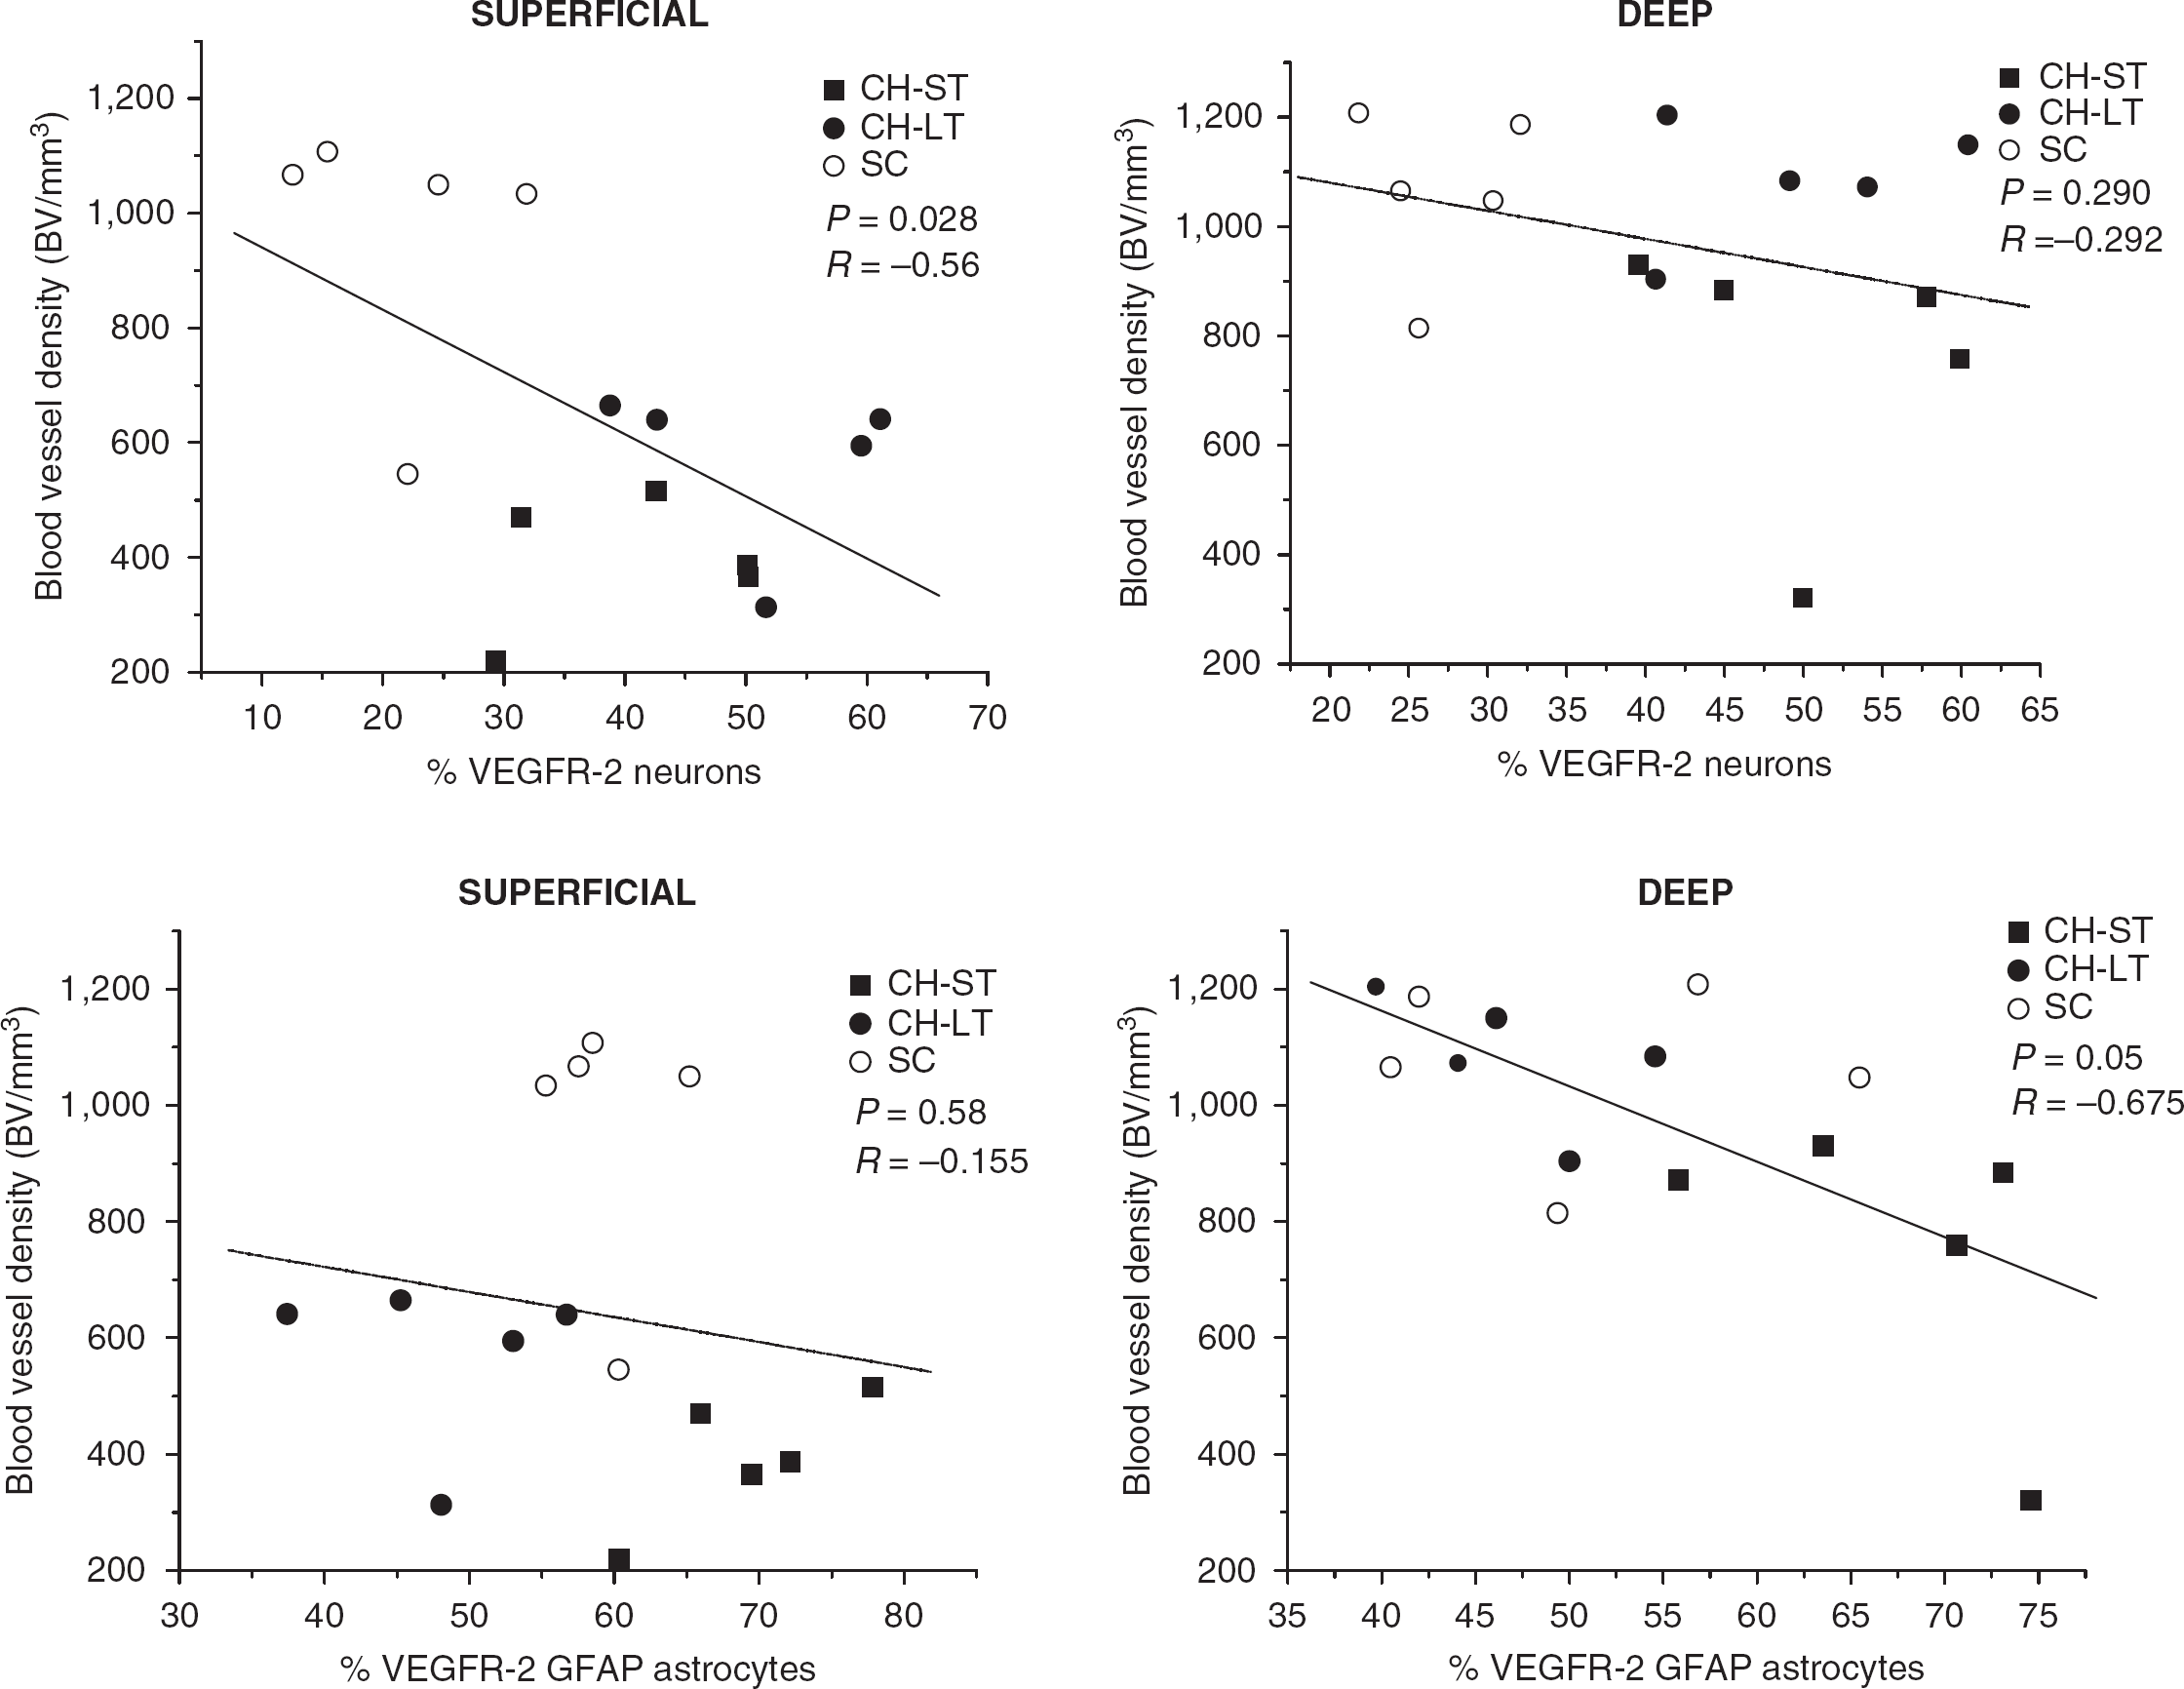
Relationship between %VEGFR-2/NeuN neurons and blood vessel density in chronic hydrocephalus (short term, long term) and surgical controls in superficial (
We found no correlations between BVd, CBF, and CO in the superficial or deep caudate region. In addition, changes in CSF ventricular volume and pressure did not correlate with either %VEGFR-2 cellular expression or BVd in CH. When CH and SC data were combined, CSF ventricular volume significantly correlated with %VEGFR-2 neurons and glial cells in the superficial (P=0.02), but not in the deep caudate, region.
Discussion
This study shows quantitative changes in BVd and neuronal and glial VEGFR-2 expression in the caudate nucleus of an experimental model of CH. The temporal pattern of these changes varied by region (superficial versus deep) and by duration (ST versus LT) of hydrocephalus. The overall pattern of BVd change was that of initial decrease followed by a return to baseline. Overall, increases in VEGFR-2 expression were similar across both the caudate regions and cell types and did not correlate with BVd.
Cerebrovascular Changes
Previously, we have shown an initial decrease in vascularity followed by a return above baseline in cortical gray and periventricular white matter (Luciano et al, 2001). We have also shown a sustained increase in BVd in the hippocampus after the induction of CH (Dombrowski et al, 2008). Although most studies have described cerebrovascular compression, a few studies have observed increased vascularity in certain brain regions and at various time points in hydrocephalus (Ransohoff et al, 1975; Del Bigio and Bruni, 1988; Jones et al, 1991). The size and direction of these observed BVd changes could not be explained by a simple spatial compression of an intact vascular tree.
As in all tissues, the observed BVd measurements are the net result of ongoing angiogenic stimulation and destructive forces. Although the stimulation of angiogenesis by hypoxia has been well demonstrated, this relationship is not simple linear and can be modified by the presence of other stimulating and antiangiogenic factors. For example, growth factors such as transforming growth factor-β (TGF-β) inhibit angiogenesis and have been shown to be increased in hydrocephalus (Li et al, 2007). The metabolic activity of a region may have a role in that a highly metabolic area such as the hippocampus may be more vulnerable to hypoxia resulting in a greater stimulation of the angiogenic process (Hidaka et al, 1997).
However, destructive forces such as vessel stretch and compression caused by the expanding ventricles, and collapse of vascular lumen caused by a decrease in CBF are variables that may have region-specific roles based on that region's vulnerability to ventricular compression or based on its specific vascular anatomy, rich collateral flow versus terminal fields. To detect the potential modifying role of these factors, the superficial and deep regions of the caudate, which otherwise have no distinct morphologic or functional demarcation, were measured and compared. The superficial caudate region may be more vulnerable to the change in hydrocephalus both because of its relative proximity to expanding ventricles and its location at the most terminal field of the ascending vascular supply. The hippocampus also differs from the superficial caudate in its richer collateral supply. Thus, the decrease in BVd best observed in the superficial caudate may be the result of a more direct ventricular compression or the result of decreased blood flow to terminal vessels.
In this study, some degree of compaction due to hydrocephalus is suggested by the finding of a higher density of glial cells in hydrocephalic animals compared with controls in both regions of the caudate and a higher neuronal density in the superficial region. It is of importance that, increased cellular distance with expanded extra cellular spaces or edema was not observed in hydrocephalic cases. This cellular compaction was not observed in our previous study of the hippocampus. In fact, a lower total glial cell density was found in the hippocampus with hydrocephalus (unpublished results).
Although this amount of tissue compaction is not sufficient enough to explain changes in BVd in terms of vessel tree constriction, it may be associated with luminal collapse. Previous studies of our own (Luciano et al, 2001) and those of others (Jones et al, 1991) have also suggested decreased vessel lumen diameters in hydrocephalus. It can be speculated that a decreased BVd may be observed as a result of compression and subsequent vessel destruction, by a decreased visualization of collapsed vessels or vascular regression due to a decrease in luminal diameter. However, the role of compression in decreasing vessel diameters and BVd was not supported by our measures of hydrocephalus severity in this study. Blood vessel density changes did not directly correlate with changes in CSF ventricular volume and pressure.
As lumen vessel diameter is also dependent on blood flow (Langille and O’Donnell, 1986), the apparent tissue compaction observed in this study may not be caused by tissue and vessel compression but instead by the result of decreased CBF and BVd. We have previously measured an up to 70% decrease in blood flow to the caudate in hydrocephalus (Dombrowski et al, 2006). Furthermore, in this study a trend (P=0.06) toward a correlation between CO and BVd in the superficial caudate region was observed, suggesting that vessels in the distal water shed areas such as the superficial caudate region might not be well perfused. This can be contrasted with the hippocampus where greater vascularity was associated with a lower glial cell density.
The observed recovery in BVd may be the result of reexpansion of existing vessels or the development of new vessels. Although this study suggests a good environment for stimulated angiogenesis on the basis of prolonged VEGFR-2 stimulation (see below), other stains such as CD105 (Duff et al, 2003) or BrdU (5-bromo-2-deoxyuridine) (Sun et al, 2003) prelabeling may used to positively identify new vessels in future studies.
Vascular Endothelial Growth Factor Receptor-2 Expression
Our own observations along with those of others that indicate an increased vascularity, beyond that of controls, raises the possibility of angiogenesis in CH. Clinical and experimental studies have shown that CH is associated with decreased CBF and oxygen delivery to the brain, conditions which promote the angiogenesis cascade (Del Bigio, 1993; Edwards et al, 2004; Higashi et al, 1986) . This was also consistent with our previous finding of decreased oxygen saturation and blood flow in this model of CH (Fukuhara et al, 2001). Our investigation of VEGFR-2 expression is a first attempt to investigate the activity of an angiogenic cascade in CH. This report of increased VEGFR-2 expression in the neurons and glia of the caudate is consistent with our earlier report of increased receptor concentrations in the hydrocephalic hippocampus (Dombrowski et al, 2008). The degree of VEGFR-2 response shown here is in a similar proportion to the response observed during acute ischemic–hypoxic conditions, such as stroke and cerebral infarction (Issa et al, 1999; Rosenstein and Krum, 2004).
The expression of VEGF and VEGFR-2 is closely related with the onset and cessation of hypoxia (Chow et al, 2001; Dvorak, 2005; Neufeld et al, 1999). In experimental stroke models, it has been reported that VEGFR-2 expression increases as early as 6 h after middle cerebral artery occlusion with peak activity observed after 5 to 7 days, whereas VEGF expression returned to near normal levels after 3 weeks. The 40% to 50% increased neuronal expression of VEGFR-2 in both ST and LT CH groups suggests a severe and prolonged stimulation in the neurons, similar to other chronic neurologic diseases, such as Parkinson's and Alzheimer's disease (Issa et al 1999; Kalaria et al, 1998). Although hypoxia can persist in CH, VEGFR-2 stimulation may originate from other sources as well (see below).
The glial VEGFR-2 change appears less robust and sustained when compared with the neuronal response and the response found in the hippocampus. The VEGFR-2 glial expression was greater by 10% to 17% in ST CH animals compared with controls, but was 4% to 11% lower in LT CH animals compared with control. Although this difference remains unexplained, it is interesting to note that SC VEGFR-2 expression at 12 weeks was generally 10% to 20% across cell types and regions, with hydrocephalus-stimulated levels generally at 50% to 70%. However, the caudate glia VEGFR-2 staining showed elevations to ‘stimulated’ levels even in SCs. Glia in this region had an apparent increased expression unrelated to hydrocephalus. This increase in SC may result from some aspect of the surgery to induce hydrocephalus itself because it can also result from trauma and inflammation in the brain (Del Bigio, 1993; Dombrowski et al, 2006; Dombrowski et al, 2008; Luciano et al, 2001; Wang et al, 2005). This possible nonhydrocephalic increase may explain the less robust increase and relative late decrease in VEGFR-2 change. It may also have a role in the difference in BVd response as compared with the hippocampus, which showed more dramatic increases in glial VEGFR-2 expression and BVd.
Physiologic Role of Vascular Endothelial Growth Factor in Chronic Hydrocephalus
Although this study has shown an increase in VEGFR-2 expression in CH, the physiologic significance of this increase is unknown. The role of VEGFR-2 in facilitating new BVs cannot be determined in this study through the measurement of net BVd alone. In addition, in this study, CBF did not correlate with either VEGFR-2 expression or BVd. Therefore, even if new BVs are facilitated, their ability to sustain or increase blood flow or to increase oxygen delivery in hydrocephalus is also uncertain. Finally, VEGFR-2 activation can lead to increased vascularity which is, however, pathologic and not adaptive (Ferrara, 2002).
Vascular endothelial growth factor receptor-2 has been also studied for its effects on vascular permeability and neuroprotection (Storkebaum et al, 2004), both of which may be physiologically significant in CH. Although fluid shifts are of obvious importance in hydrocephalus, this disease is not commonly associated with cerebral edema, and brain swelling commonly decreases ventricular size. Moreover, we observed no histologic evidence of edema or increased extracellular spaces in this study. Blood–brain barrier disruption has been observed in CH (Edwards et al, 2004; Sada et al, 1994) and may result from immature vessels of a facilitated angiogenesis or from VEGF's permeability changes directly. The neuroprotective function of VEGFR-2 is difficult to assess in a model of CH in which cell death is not a significant feature. Experimental studies have reported axonal and neuropile degeneration but no cell death/loss in hydrocephalic models (Del Bigio, 1993). Ultimately the significance, mechanism, and impact of VEGFR-2 activation in CH can be determined best through an interventional study blocking VEGF activity.
Summary
In CH, BVd decreases in the caudate in the ST (2 weeks) and recovers to baseline in the LT (12 to 16 weeks) groups. Vascular endothelial growth factor expression increases in neurons and glia, although the response in glia may be less robust or specific to CH. The dissociation of BVd and VEGF expression observed in this study in the caudate differs from our previous study with uniform increases in the hippocampus where increased BVd may have been facilitated by greater VEGFR-2 activation and better collateral blood supply. The use of VEGF antagonists may clarify its role in adaptive versus pathologic BV changes.
Footnotes
The authors declare no conflict of interest.