
Abstract
The risk of severe hypoglycemia in patients with type I diabetes and high basal activity in the renin–angiotensin system (RAS) is significantly higher than in patients with low basal RAS activity. In healthy men, we tested the hypothesis that differences in spontaneous RAS activity are associated with differences in cerebral activity responses during mild hypoglycemia. A total of 10 healthy men with high and 10 with low spontaneous RAS activity were selected. An H215O-PET (H215O-positron emission tomography) study was conducted with a series of six scans, i.e., two during normoglycemia, two during hypoglycemia, and two after hypoglycemia. The mean plasma glucose concentration was similar in both the groups (i.e., 2.1 mmol/L (s.d.: 0.4) in the low RAS group and 2.2 mmol/L (s.d.: 0.4) in the high RAS group (P=0.47)). The high RAS group has lower cerebral activity in the frontal area and a higher cerebral activity in the entorhinal area that expanded to include the parahippocampal gyrus after hypoglycemia. Our findings suggest that the high RAS group to a lesser extent than the low RAS group activates areas involving executive function that may explain the correlation between high basal RAS activity and risk of severe hypoglycemia in type I diabetes.
Introduction
The existence of a cerebral renin–angiotensin system (RAS) is well established (Ganten et al, 1984; Saavedra, 1992), but its function is disputed (Gard, 2002; Magy et al, 2005; von Bohlen und and Albrecht, 2006). Evidently, the RAS is involved in the neuromodulation of a number of processes, such as visual processing (Albrecht et al, 1997a, 1997b) and cognitive function (Gard, 2002). Furthermore, RAS activity influences cerebral response to substrate depletion, e.g., hypoxia or ischemia (Achard et al, 2001). Thus, high RAS activity mediated through the AT1 (angiotensin II type-1) receptor increases cerebral vulnerability in these conditions (Magy et al, 2005; Saavedra et al, 2006). Hypoglycemia is another condition of substrate depletion, and in patients with type I diabetes high basal RAS activity is associated with a high risk of severe hypoglycemia (Pedersen-Bjergaard et al, 2001, 2003, 2008). At present, this finding is poorly understood but may hypothetically be due to an effect of differences in RAS activity on cerebral fuel supply during hypoglycemia, on cellular reaction to substrate depletion or on cerebral activity—and thereby fuel requirement—during hypoglycemia. Changes in brain synaptic activity during hypoglycemia can be studied using neuroimaging techniques, because changes in local cerebral activity are coupled to those in regional cerebral blood flow (Lauritzen, 2005).
In healthy men, we tested the hypothesis that differences in basal RAS activity are associated with differences in cerebral activity responses during mild hypoglycemia by using H215O-PET (H215O-positron emission tomography), which provides an indirect measure of relative cerebral activity by measuring the relative changes in regional cerebral blood flow.
Materials and methods
Participants
A total of 503 healthy young men from educational establishments in the Greater Copenhagen area participated in a screening program, involving a venous blood sample and a health-related questionnaire.
From the screening population, we selected 10 individuals with low RAS activity—defined as serum angiotensin-converting enzyme (ACE) and plasma angiotensinogen concentrations present in the lowest quartile in the population combined with the presence of the X-linked angiotensin II subtype 2 (AT2 receptor) 1675 genotype G—and 10 individuals with high RAS activity—defined as serum ACE and plasma angiotensinogen concentrations present in the highest quartile in the population combined with the presence of the AT2 receptor genotype A (Table 1). The classification is based on findings in patients with type I diabetes, for whom the combination of these parameters in the RAS resulted in a significantly higher risk of severe hypoglycemia (Pedersen-Bjergaard et al, 2008). Pooled analyses of the presented data have recently been published with evaluation of the effect of the hypoglycemic condition on cerebral activity (Bie-Olsen et al, 2009).
Baseline characteristics and renin–angiotensin system (RAS) activity of 20 healthy men included in the study
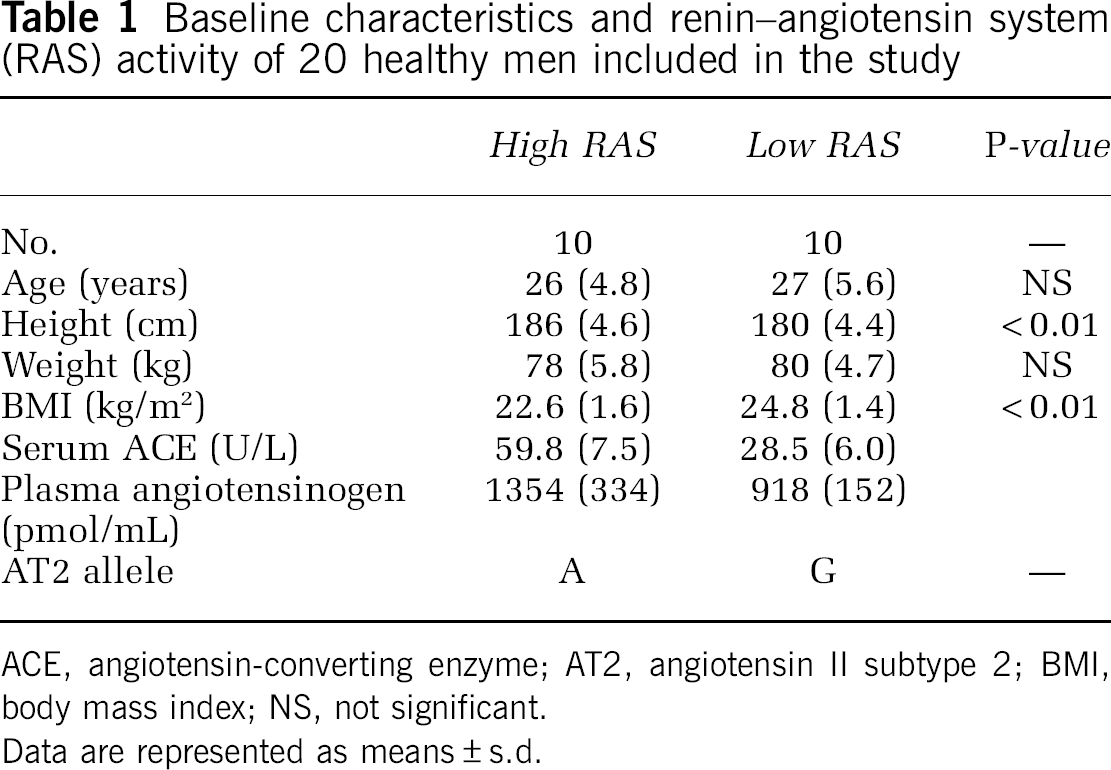
ACE, angiotensin-converting enzyme; AT2, angiotensin II subtype 2; BMI, body mass index; NS, not significant.
Data are represented as means±s.d.
Experimental Setup
Each participant provided a detailed medical history to ensure good health and no routine medication. Any contraindication against a magnetic resonance (MR) scan was an exclusion criterion. The participants were graded according to handedness (Edinburgh Handedness Inventory). In all, 19 of the participants were strongly right-handed and 1 was primarily left-handed. They were instructed to live and eat as normally as possible and to avoid any rigorous exercise, as well as the use of alcohol and drugs, in the week preceding the experiments.
All screened participants provided their written informed consent before participating in the study. The study was approved by the regional medical ethics committee (15 February 2005) and was conducted at the PET and Cyclotron Unit (Rigshospitalet, Copenhagen University Hospital, Denmark).
Experimental Design
The participants were studied after an overnight fast. Intravenous infusion lines were inserted in the left and right antecubital veins (left: injection of tracer, right: blood samples) and in the left hand (insulin infusion). The participants remained in supine position in the scanner during the whole experimental session.
After scans during normoglycemia, insulin was administered as a continuous intravenous infusion to induce and maintain hypoglycemia. The target nadir plasma glucose concentration was 2.2 mmol/L. An infusion of 0.14 IE/kg per hour was administered until the plasma glucose concentration was 2.5 mmol/L, after which the infusion was reduced to 0.07 IE/kg per hour (aiming at a plasma glucose concentration of 2.2 mmol/L). Depending on bedside plasma glucose measurements, the infusion was further reduced. This approach was preferred to conventional hyperinsulinemic hypoglycemic clamping to minimize the insulin dose, because insulin per se may affect cerebral metabolism and activation (Rotte et al, 2005), and to avoid any exogenous glucose supply during hypoglycemia. Blood samples were collected twice during normoglycemia, during hypoglycemia, and after the restoration of normoglycemia (after hypoglycemia). Restoration of normoglycemia was achieved by ingestion of 250 mL apple juice.
Relative changes in regional cerebral blood flow were measured during normoglycemia (two scans), during hypoglycemia (two scans), and after hypoglycemia (two scans). To standardize the visual input, the participants were instructed to look at a computer screen with a white cross on a blue background during the scans. Finally, symptoms of hypoglycemia were rated according to the Edinburgh Hypoglycemia Symptom Score Questionnaire (Hepburn et al, 1994).
Image Sequence/Technique
Positron emission tomography scans were carried out with the participants in supine position using an Advance PET scanner (GE, Milwaukee, WI, USA) operating in a three-dimensional mode with collimating septa retracted, producing 35 image slices at a distance of 4.25 mm. The total axial field of view was 15 cm with an approximate in-plane resolution of 5 mm; each participant underwent an initial 2-min scan for positioning followed by a 10-min transmission scan for attenuation correction. Eight intravenous injections of 400 MBq of oxygen-15-labeled water were administered. The tracer was administered using an automatic water injection system through the left brachial vein over 30 secs followed by 10 mL of isotonic saline for flushing. Data acquisition was triggered by total count rate buildup and began ∼40 secs after the start of injection and lasted for ∼90 secs. There was an interval of at least 10 mins between repeated emission scans to allow for the isotope to decay.
On a separate day, each participant underwent MR imaging of the brain using a 3 T magnetic resonance whole body scanner (Trio, Siemens, Erlangen, Germany) to provide an MR template for the PET scans. A single three-dimensional MPRAGE (Magnetization Prepared RApid Gradient Echo) structural imaging sequence was acquired.
Biochemical Analyses
Blood samples were collected on ice, centrifuged at 5°C within 20 mins, and the specimens were stored immediately thereafter at −80°C until further analyses. Bedside plasma glucose measurements used for monitoring during the experiments were carried out using a HemoCue Analyzer (HemoCue AB, Angelholm, Sweden) every 5 mins.
All biochemical analyses were carried out blinded to the other results. Plasma angiotensinogen was determined as the maximal quantity of angiotensin I generated during the incubation of plasma in the presence of excess recombinant human renin (Derkx et al, 1986). Serum ACE activity was determined using a commercial kinetics-based assay (Sigma Diagnostics, St Louis, MO, USA). DNA was extracted from peripheral blood leukocytes using a standard salting-out method. The AT2 receptor 1675G/A single-nucleotide polymorphism was determined by polymerase chain reaction. Blood collected for the measurement of adrenaline was sampled in chilled tubes containing 100 μL EDTA (ethylenediaminetetraacetic acid), glutathione, and heparin, centrifuged, collected using a pipette, and frozen (−80°C) within half an hour. Analyses were carried out using high-performance liquid chromatography with fluorimetric detection (van der Hoorn et al, 1989). Glucose and cortisol levels were analyzed immediately by the local laboratory. Plasma glucose concentrations were measured enzymatically (ROCHE, Basel, Switzerland). Plasma cortisol was measured by ECLIA (electrochemiluminescence immunoassay). Serum growth hormone concentration was determined with a commercial fluoroimmunometric method (Delfia, Wallac, Finland) using two monoclonal antibodies against two separate antigenic determinants on the growth hormone molecule. Glucagon concentrations in plasma were measured using a radioimmunoassay directed against the C terminus of the glucagon molecule (antibody code no. 4305), which mainly reflects glucagon of pancreatic origin (Holst, 1983). Serum insulin was determined using a fluoroimmunometric sandwich assay (AutoDELFIA, PerkinElmer Life and Analytical Science, Inc., Waltham, MA, USA).
Image Processing and Analysis
The PET data were reconstructed using the filtered back projection method, including attenuation to 35 128 × 128 pixel matrices applying an 8-mm Hanning filter, and thereafter exported from the scanner's database. The voxel size of the exported images was 2.0 × 2.0 × 4.25 mm3.
After conversion to the Analyze format, the data were analyzed using statistical parametric mapping (Frackowiak et al, 1997). All the scans obtained from each participant were realigned, coregistered to individual MR imaging, and subsequently projected into a standard stereotactic three-dimensional space.
The spatially normalized images of all participants were smoothed using an isotropic Gaussian filter (full-width half-maximum 14 mm).
We designed a flexible factorial model, in which the two deciding factors were individuals and condition (normoglycemia, hypoglycemia, or posthypoglycemia). We constructed a design matrix that evaluated the differences in the effect of hypoglycemia (compared with normoglycemia) and posthypoglycemia (compared with normoglycemia) on regional cerebral blood flow between the high and low RAS groups.
Statistics (Biochemical Parameters)
A comparison of the three conditions (normoglycemia, hypoglycemia, and posthypoglycemia) was made with one-way ANOVA (analysis of variance). When the assumptions of normality and/or equal variances were not fulfilled, we used the Kruskall–Wallis test to assess the between-condition differences. No post hoc tests were carried out.
To compare the between-group (high RAS versus low RAS) difference an independent t-test was used, when the assumption of normality was fulfilled, otherwise a Mann–Whitney test was applied. Normality was tested by using probability plots and Kolmogorov–Smirnov tests. P<0.05 (two-sided) was considered significant. All analyses were carried out using SPSS 13.0 (SPSS).
Results
Hypoglycemic Stimulus, Symptoms Scores, and Hormonal Counter Regulation
The mean plasma glucose concentration was 2.1 mmol/L (s.d.: 0.4) in the low RAS group and 2.2 mmol/L (s.d.: 0.4) in the high RAS group during hypoglycemia (P=0.47). Hypoglycemia was induced with a total of 0.14 U/kg (s.d.: 0.03) regular human insulin in the high RAS group and 0.12 U/kg (s.d.: 0.02) in the low RAS group (P=0.12). During hypoglycemia, the serum insulin concentration was 414 pmol/L in the low RAS group and 508 pmol/L in the high RAS group (P=0.15). The hypoglycemic challenge was sufficient enough to generate adequate hormonal counter-regulatory and symptomatic responses with no between-group difference, except for growth hormone, for which the high RAS group had a significantly higher level after hypoglycemia compared with the low RAS group (P=0.04) (Table 2).
Response to hypoglycemia according to RAS activity
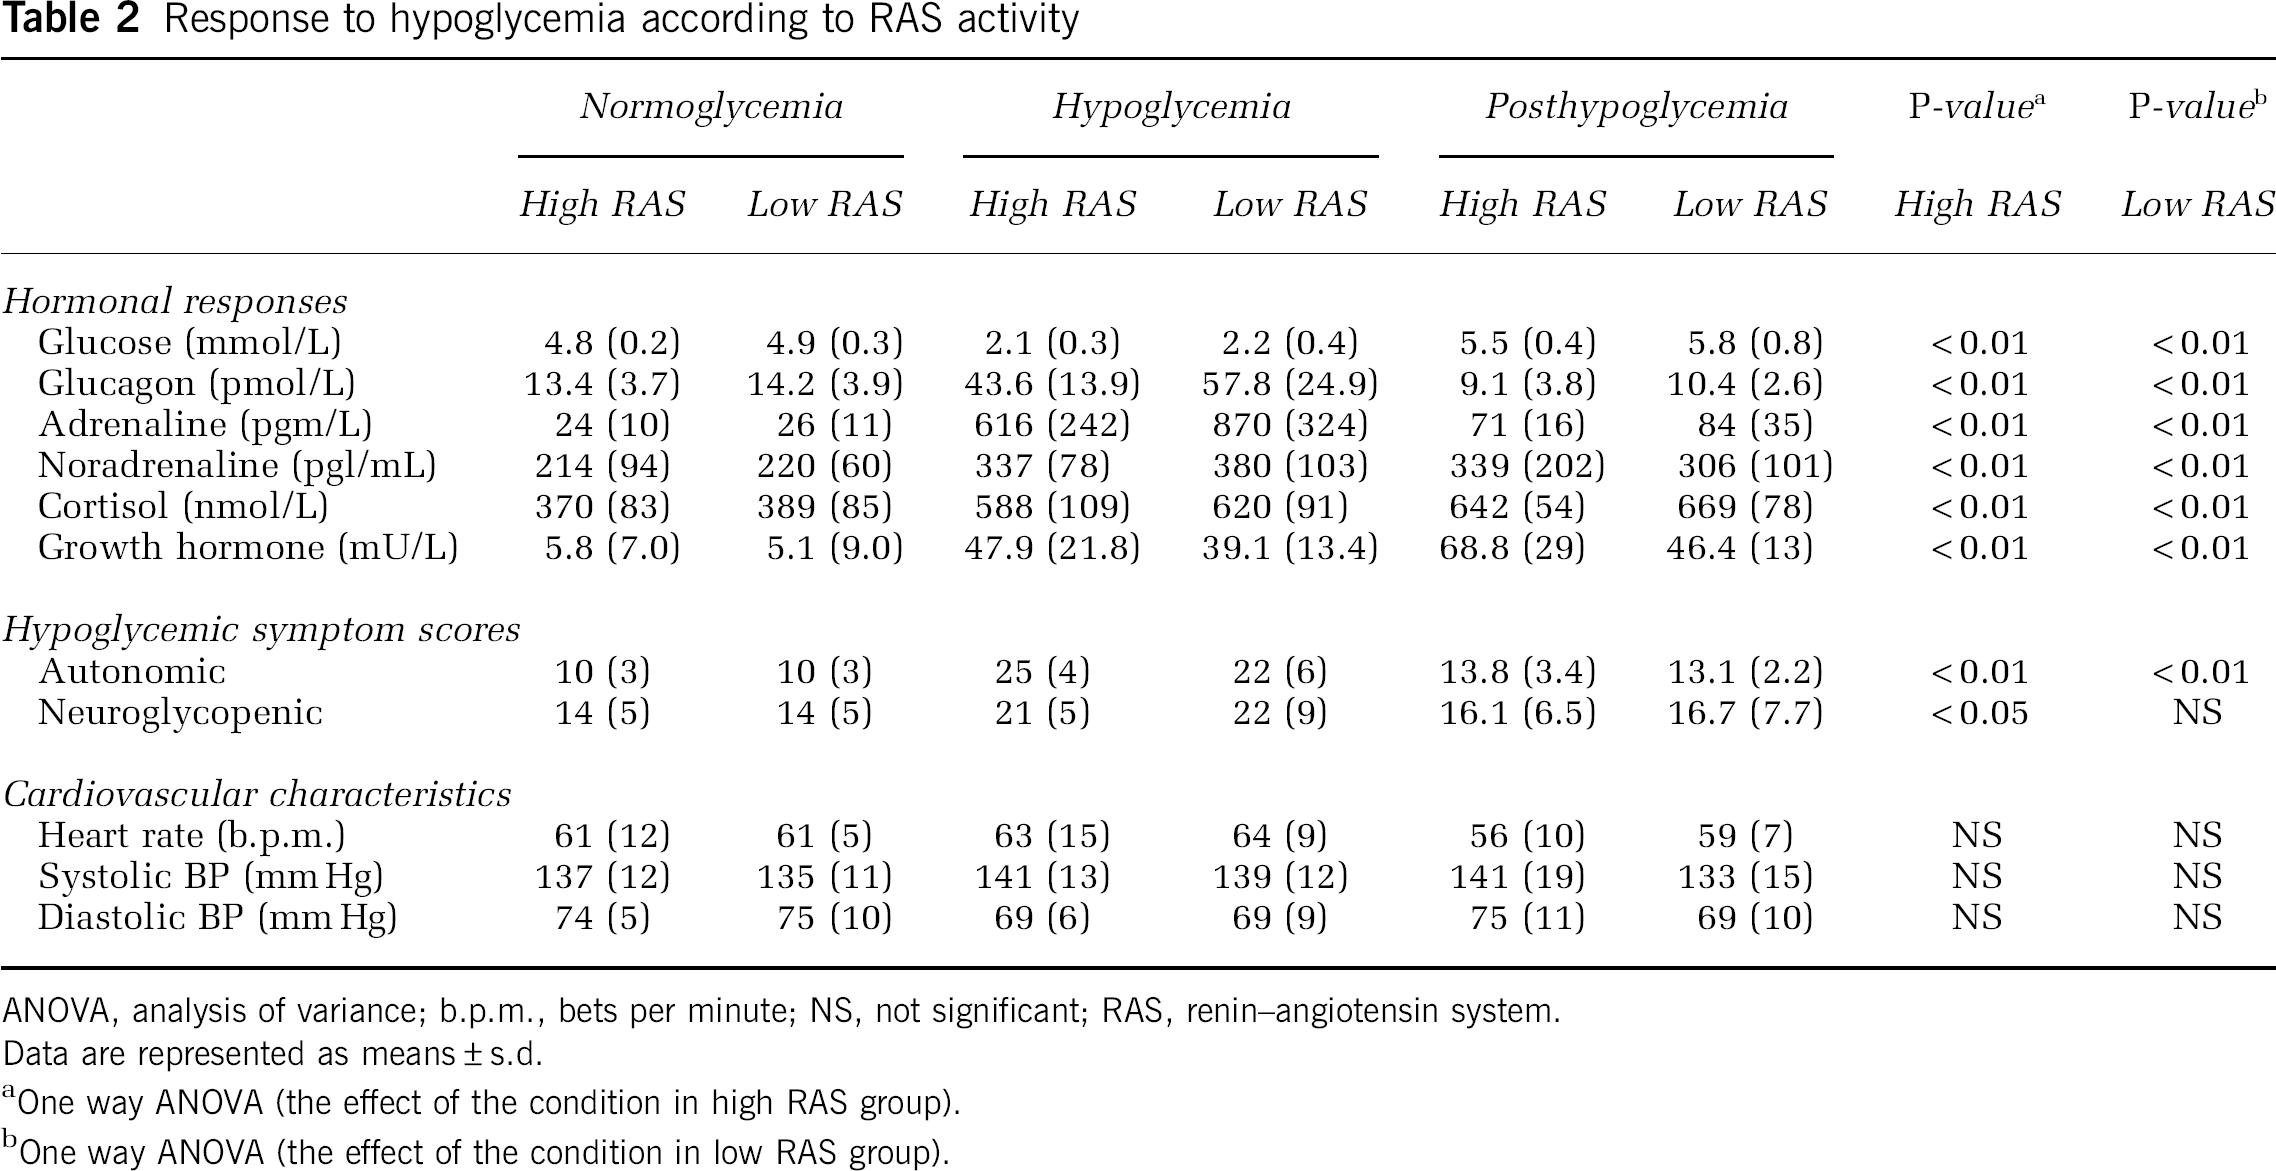
ANOVA, analysis of variance; b.p.m., bets per minute; NS, not significant; RAS, renin–angiotensin system.
Data are represented as means±s.d.
One way ANOVA (the effect of the condition in high RAS group).
One way ANOVA (the effect of the condition in low RAS group).
Brain Activity Patterns
In this study, we present the differences between the two RAS groups in their response to hypoglycemia. This analysis yielded four contrasts: low RAS group versus high RAS group (changes between normoglycemia and hypoglycemia as well as changes between normoglycemia and posthypoglycemia) and high RAS group versus low RAS group (changes between normoglycemia as well as hypoglycemia and changes between normoglycemia and posthypoglycemia). Interaction analyses show that the high RAS group has lower activity in the frontal area (Brodmann area 11) (Table 3) during hypoglycemia and higher cerebral activity in the entorhinal area compared with the low RAS group. After hypoglycemia, the increased cerebral activity in the entorhinal area of the high RAS group extends to include the parahippocampal gyrus (Table 3). After hypoglycemia, there were no areas where the high RAS group had lower activity compared with the low RAS group.
Activation changes during hypoglycemia and posthypoglycemia
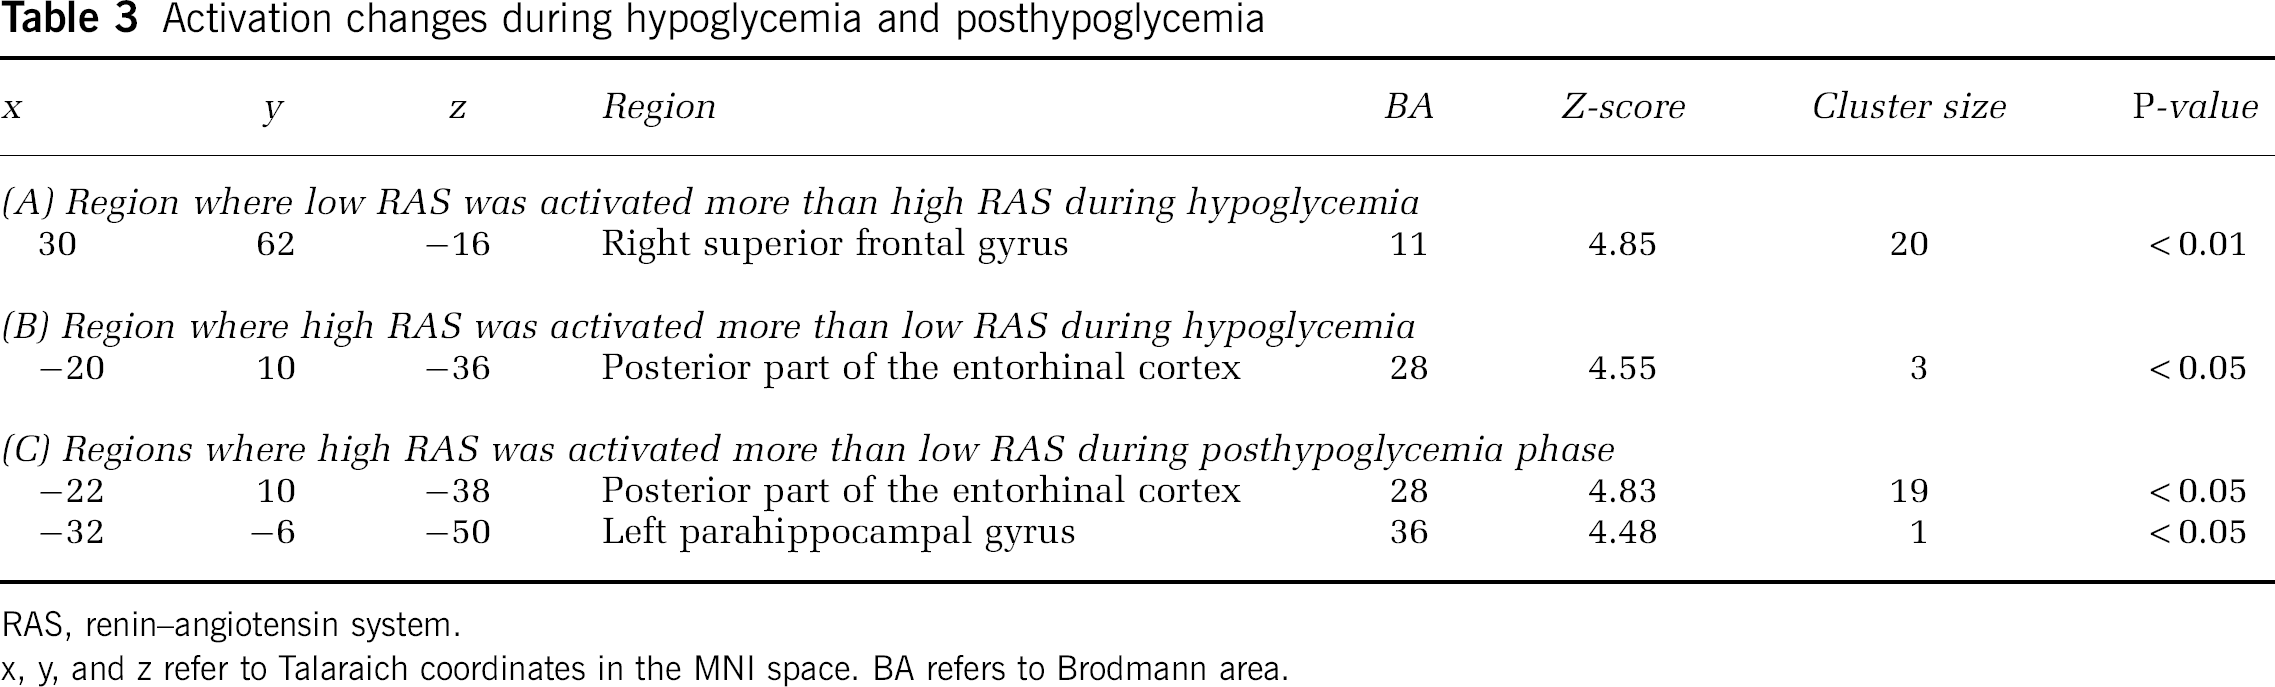
RAS, renin–angiotensin system.
x, y, and z refer to Talaraich coordinates in the MNI space. BA refers to Brodmann area.
Discussion
In this study, we focus on the effect of genetic and phenotypic heterogeneity of the RAS and its effect on cerebral blood flow changes during and after hypoglycemia. We show that these traits of the RAS are associated with differences in cerebral activity during and after hypoglycemia. The hypoglycemic stimulus generated relevant hypoglycemic symptom scores and counter-regulatory hormonal responses with no between-group differences.
Our findings suggest that brain function is significantly different between the groups of low RAS activity and high RAS activity. The high RAS group had lesser activity in an area in the right orbitofrontal cortex (Brodmann area 11) compared with the low RAS group, whereas the high RAS group had higher activity in an area in the left entorhinal cortex. This area also showed increased activity after hypoglycemia, for which the activated area expanded to involve the parahippocampal gyrus.
The orbitofrontal cortex is one of the least understood regions of the human cortex, but it is believed to be involved in executive function and strategic processing in memory retrieval (Krawczyk, 2002). Our findings suggest a more profound impairment in cognitive executive functioning during hypoglycemia in individuals with high RAS compared with those with low RAS. This is in accordance with the fact that patients with type I diabetes and high RAS activity have a significantly increased risk of hypoglycemic episodes accompanied by severe cognitive dysfunction and dependence on assistance from other people to manage the situation (Pedersen-Bjergaard et al, 2001, 2003, 2008; Zammitt et al, 2007). Thus, the impairment of executive function during moderate hypoglycemia may compromise the patient's ability to take the right action to avoid more profound hypoglycemia. Areas where the high RAS group was activated more than the low RAS group comprised the entorhinal cortex and parahippocampal gyrus, which are areas involved in memory (Hargreaves et al, 2005; Shrager et al, 2008). With our present knowledge, this observation cannot be placed into a functional context.
Our study participants were selected by particular high or low basal systemic RAS activities from three different key parameters in the RAS, each associating independently with the risk of severe hypoglycemia in patients with type I diabetes: plasma concentration of angiotensinogen—the primary substrate of RAS, serum activity of ACE, and the genotype of the AT2 receptor. The physiologic role of AT2 receptors is not fully clarified. Presently, the predominant function of the AT2 receptor stimulation is believed to be antagonistic to the effects of AT1 receptor stimulation. Studies regarding the role of AT2 receptors in cell regeneration and apoptosis are also diverging. It has been claimed that the AT2 receptor is capable of initiating both cell regeneration and apoptosis depending on the input, and thereby optimizing the response to an injury (Horiuchi et al, 1998; Lucius et al, 1998). This is in accordance with AT2 receptors being heavily upregulated in the case of an injury e.g., ischemia (Kagiyama et al, 2003). However, these results should be interpreted with care because the studies are based on the use of both nonselective antibodies and nonselective AT2 antagonists. Furthermore, studies regarding mice with a disrupted AT2 receptor gene showed attenuated exploratory behavior compared with wild type, indicating a role of the AT2 receptor in sensory processing (Maul et al, 2008). Other parameters in the RAS, which could have been relevant to include are plasma renin activity, being a good indicator for peripheral RAS, and genetic variations in the AT1 receptor. In our previous work, neither plasma renin (Pedersen-Bjergaard U, unpublished data) nor polymorphism in the AT1 receptor tended to associate with severe hypoglycemia, either in univariate or in multivariate analyses (Pedersen-Bjergaard et al, 2008). In this study, by screening more than 500 individuals for recruiting participants with extreme RAS properties, the inclusion of parameters that were not earlier shown to be associated with severe hypoglycemia would make it difficult to provide a mechanistic explanation of the association between severe hypoglycemia and high RAS activity.
We do not know how the corresponding cerebral RAS activity was in these participants, and we are unable to conclude whether differences in brain activation are caused by endocrine actions of the peripheral RAS or by paracrine or autocrine actions of the intracerebral RAS. However, the AT2 receptor genotype is similar, and there is a good correlation between ACE activity in serum and tissues because of a major genetic influence of the ACE I/D polymorphism.
A comparison of our results with other neuroimaging studies during hypoglycemia is difficult, because we describe the differences between the responses to hypoglycemia caused by differences in RAS activity and not the effect of the hypoglycemic condition. To our knowledge, this is the first time that differences in RAS activity have been evaluated using neuroimaging techniques.
This study shows that basal systemic renin–angiotensin activity influences the brain's response to hypoglycemia. This may explain why patients with type I diabetes and high serum ACE or RAS activity are at an increased risk of severe hypoglycemia. The lack of frontal brain activation may decrease the ability to respond efficiently to the symptoms of hypoglycemia. It would be of major interest to evaluate the effect of pharmacological inhibition of RAS by renin blockers, ACE inhibitors, or angiotensin II receptor blockers on cerebral responses to hypoglycemia in individuals with high RAS activity to explore a potential neuroprotective action of these agents in diabetes.
Footnotes
Acknowledgements
We thank the research nurses Pernille Banck-Petersen and Tove Larsen, Department of Cardiology and Endocrinology, Hillerød Hospital for their skillful technical assistance during the experiments. We acknowledge the staff at the PET center at Rigshospitalet for their participation.
The authors declare no conflict of interest.