
Abstract
Glucose transporter 2 (Glut2)-positive cells are sparsely distributed in brain and play an important role in the stimulation of glucagon secretion in response to hypoglycemia. We aimed to determine if Glut2-positive cells can influence another response to hypoglycemia, i.e. increased cerebral blood flow (CBF). CBF of adult male mice devoid of Glut2, either globally (ripglut1:glut2−/−) or in the nervous system only (NG2KO), and their respective controls were studied under basal glycemia and insulin-induced hypoglycemia using quantitative perfusion magnetic resonance imaging at 9.4 T. The effect on CBF of optogenetic activation of hypoglycemia responsive Glut2-positive neurons of the paraventricular thalamic area was measured in mice expressing channelrhodopsin2 under the control of the Glut2 promoter. We found that in both ripglut1:glut2−/− mice and NG2KO mice, CBF in basal conditions was higher than in their respective controls and not further activated by hypoglycemia, as measured in the hippocampus, hypothalamus and whole brain. Conversely, optogenetic activation of Glut2-positive cells in the paraventricular thalamic nucleus induced a local increase in CBF similar to that induced by hypoglycemia. Thus, Glut2 expression in the nervous system is required for the control of CBF in response to changes in blood glucose concentrations.
Introduction
A continuous supply of glucose from the systemic circulation to the brain is essential for sustained brain metabolism and function and any interruption of glucose delivery may lead to brain cell injury or death.1,2 Hypoglycemia is a state of energy deficit incompatible with the maintenance of normal brain function and therefore elicits numerous hormonal responses to restore euglycemia, including an increased secretion of epinephrine and glucagon. 3 In addition, hypoglycemia also induces an immediate elevation of cerebral blood flow (CBF) in regions associated with increased autonomic response, a response consistently observed not only in humans but also in other mammals.1,4,5 A local increase in CBF is also required for increased delivery of glucose in regions with augmented synaptic activity observed for instance during hypoglycemia and prevents hypoglycemia-associated cognitive impairments.5,6 However, in diabetic patients, the normal hypoglycemia-induced increase in blood flow becomes progressively impaired5,7,8 in association with development of hypoglycemia associated autonomic failure.
The mechanisms underlying the global increase of CBF upon hypoglycemia and how they become blunted in diabetes remain unclear. Experimental studies have suggested that the increased CBF upon insulin-induced acute hypoglycemia is comparable to the elevation of CBF at pharmacological doses of deoxyglucose. 9 Glucose responsive neurons activated by hypoglycemia, referred to as glucose inhibited (GI) neurons, have been characterized by electrophysiological recordings on acute brain slices and found to be present in several brain areas, in particular in the hypothalamus and brainstem.10–12 Activation of GI neuron firing by hypoglycemia involves a decrease in glucose metabolism with the consequent activation of AMP-dependent protein kinase and closure of a chloride conductance, or of K+ leak channels. 13 In preceding studies, we have shown that GI neurons from the nucleus tractus solitarius (NTS) expresses the glucose transporter Glut2 and are involved in stimulating vagal nerve activity and glucagon secretion, linking hypoglycemia detection by the brain to the counterregulatory response. 14 More recently, we found that Glut2 neurons in the paraventricular thalamic nucleus (PVT) are also activated by hypoglycemia. These are glutamatergic neurons that project to the nucleus accumbens and when activated by hypoglycemia, Glut2 inactivation, or optogenetics they increase motivated sucrose seeking behavior in mice. 15 Immunohistological analysis of Glut2 expression as well as genetic tagging of Glut2-expressing cells revealed that Glut2 is expressed in relatively rare neurons, astrocytes and endothelial cells distributed in several brain areas.16–19 As Glut2 expression has been consistently associated with glucose sensing capacity, 20 this suggests that central Glut2-expressing cells may form a global glucose surveillance network. Here, we tested the hypothesis that brain Glut2-expressing cells control CBF in response to hypoglycemia.
In order to measure CBF, we used the arterial spin labeling (ASL) magnetic resonance imaging (MRI) technique, which provides a non-invasive measurement of the blood flow in the brain21,22 that is superior to other exogenous contrast-agent based techniques, e.g. autoradiography,9,23 positron emission tomography (PET 24 ) and dynamic perfusion MRI. 25 Moreover, continuous ASL (CASL) using an actively-detuned two-coil system presents higher sensitivity and minimizes magnetization transfer effects and, thus, has been extensively used for brain studies in both rats21,22 and mice.26,27 Furthermore, the hypoglycemia-induced CBF increases measured in rats using the CASL technique 28 were similar to those obtained from ex vivo tissues using a diffusible indicator (i.e. 4-iodo-[N-methyl-14C] antipyrine).4,9
Thus, the aim of this study was to compare CBF under basal glycemia and upon insulin-induced hypoglycemia in Glut2-null mice and their controls using the CASL MRI technique. We also used an optogenetic approach to test the impact on regional blood flow of selectively activating Glut2-positive GI neurons in the PVT.
Methods
Animals
All experiments were carried out with the approval of the Veterinary Office of Canton de Vaud and were conducted according to the Federal and Local ethical guidelines, EXPANIM (Expérience sur animaux- SCAV, Service de la consommation et des affaires vétérinaires, Switzerland) and in compliance with ARRIVE guidelines (Animal Research: Reporting in Vivo Experiments) for how to REPORT animal experiments. We used mice with systemic Glut2 gene inactivation and transgenic expression of Glut1 in pancreatic islet beta-cells to normalize glucose-stimulated insulin secretion (ripglut1;glut2−/− mice and their littermate controls: ripglut1;glut2+/−) 29 and mice with inactivation of the Glut2 gene only in the central and peripheral nervous system Glut2 (glut2Δ/loxP;NesCre/+ (NG2KO) mice and their littermate controls: glut2delta/lox; or glut2+/lox;NesCre/+). 30 All mice studied had been backcrossed on the C57BL/6 background. For the optogenetic study, we used mice expressing channelrhodopsin2 in Glut2-positive cells (glut2-cre;Rosa26ChR2-YFP; mixed C57BL/6;SV129 background).14,15,18
For all experiments, adult male mice (10–15 weeks old) were used. Animals were collectively housed (maximum five individuals per cage) on a 12-h light/dark cycle (lights on at 7 a.m.) and fed with a standard chow (Diet 3436, Provimi Kliba AG).
MR Experiments
For MR experiments, all mice were anesthetized in a chamber filled with 3% isoflurane mixed with air, which helped minimizing the effect of oxygen levels on CBF. Thereafter, the mice were placed in a home-built holder and fixed using one bite piece and two ear bars. Once mouse heads were secured, tail bleeds were sampled for blood glucose level measurements using a glucose meter (Bayer Breeze2, Bayer Inc.), which requires a 1 µL volume per test and delivers a sufficient glucose range for our study, i.e. 0.6–33.3 mmol/L. Through the entire studies, physiological conditions including respiration rate and rectal temperatures were monitored through an MR compatible monitoring system (SA Instruments, US) and maintained in the targeted range, i.e. 80–10 beats-per min and 36–37℃, by varying the percentage of isoflurane (i.e. 1–1.5%) and the temperature of circulating warm water, respectively. Immediately at the end of the MR experiments, glycemia was measured again from tail bleeds and blood samples were withdrawn from some animals to ensure that pH was 7.3–7.5, PaCO2 35–45 mmHg and PaO2 > 80 mmHg, in order to prevent their vascular effects on CBF. 31
The MR experiments were performed in a horizontal 9.4T/26 cm magnet (Agilent Inc., US), with a 12-cm-diameter gradient (400 mT/m in 120 µs) insert interfaced to a DirectDrive console (Vnmrj, Agilent Inc., USA). A 1H quadrature coil consisting of two geometrically decoupled 12-mm-inner-diameter loops, resonating at 400 MHz, was used as a radio-frequency (RF) transceiver for MR imaging. An 8-mm-inner-diameter butterfly RF coil at 400 MHz was used for ASL. Both coils included PIN-diode-based active-detuning circuits, controlled by a CASL pulse sequence via a home-built switch board. 26
Neurochemical profile of hippocampus and hypothalamus
To assess potential effects of glut2 gene inactivation on brain and its intracellular glycemic state at basal glycemia, a localized 1H MR spectroscopy sequence was applied to two brain regions, e.g. hippocampus (∼4 µL) and hypothalamus (∼4 µL16–19), of five ripglut1;glut2−/− mice and five control littermates under basal (random fed) glycemia, as previously described. 32 This allowed assessing abundant metabolites involved in neurotransmission and metabolism from defined brain volumes, including all cells, extracellular space, and bloodstream. Cerebrospinal fluid contributes minimally to the measured metabolites in bilateral hypothalamus and even less so in unilateral hippocampus. 32 Sufficient signal-to-noise ratios (SNRs>15) were achieved by averaging 160–320 scans for 1H MR spectra. The water signal (eight scans) was acquired from the identical volumes of interests for further quantification, as described below.
CASL of CBF
The CASL pulse sequence was implemented with a semi-adiabatic Spin-Echo Echo Planer Imaging (SE-EPI) sequence with both negative and positive reference scans by including additional labeling components, i.e. a 2.1-s hard RF pulse, a z-gradient (14 mT/m) and 1 s delay. 26 Such SE-EPI images are more representative of capillary perfusion. 33 Each labeling plane was carefully selected based on serial anatomical neck images (gradient-echo, 0.4-mm slice thickness, 20 × 20 mm2, RO × PE = 128 × 128, nt = 8). The resulting CBF values of cortex, hippocampus, thalamus and hypothalamus can be obtained with minimal magnetization transfer residuals. 26
Anatomical images of murine brains were acquired using a fast spin echo (FSE) sequence (TEeffective/TR = 50/4000 ms, a 20 mm × 20 mm field of view (FOV), readout (RO) × phase-encode (PE) = 256 × 256, 8 averages). Both first- and second-order shim terms were automatically adjusted over the murine brain (a 6×4×5 mm3 volume of interest, VOI) using an EPI version of FASTMAP. 34 A localized water signal was acquired from the volume covering the entire brain to examine the field homogeneity within the VOI. Immediately after improving field homogeneity, 16 pairs of four or eight-segmented semi-adiabatic SE-EPI images were acquired to map CBF (TE=42 ms, FOV=23 × 15 mm2, RO × PE=128 × 64, spectral width = 200 kHz, 1.5–2.0 mm slice thickness). 26 For CBF in response to hypoglycemia, the EPI image slices were carefully positioned by referencing to the dorsal edge of the ventral hippocampal commissure (vhc) at Bregma −0.8 mm to have two MR image slices centered at Bregma 1 mm and −2 mm, respectively. The total acquisition time was approximately 6 or 13 min.
CBF measurements under resting glycemia and insulin-induced hypoglycemia
To evaluate CBF responses upon insulin-induced hypoglycemia, ripglut1;glut2−/− mice (n = 7) and their wild type counterparts (n = 6) were studied at basal glycemia and following insulin-induced hypoglycemia. Six NG2KO mice and six of their age-matched control littermates were similarly studied.
A cannula was placed in the femoral vein, and mice were placed in the holder for the CASL measurements and a first CBF determination in basal glycemic conditions was performed over a 20-min period, as described above. Then, to induce hypoglycemia, the animals along with the entire fixation system, including the RF coils, were carefully removed from the magnet and placed securely outside the magnetic field. A 1 U/kg bolus of insulin (1 U/ml, Lilly Inc., US) was given in 20 min. Once the hypoglycemic condition was reached, i.e. ≤2.5 mmol/L, a minimal continuous rate of insulin (in the range of 2–4 mU/kg) was maintained, and animals were carefully placed back to the original position in the magnet. Right after relocating the original slice of interest based on both transverse and sagittal images, i.e. in a 0.01 mm precision with our existing MR system, field homogeneity was slightly adjusted. Then, CBF measurements were performed on the nearly matching slice (e.g. <1% error to a 0.01 mm shift) in the very same animals using the identical CASL parameters over a 20-min period. A typical experimental layout is shown in Supplementary Figure 1.
The validity of the present protocol to study central effects of hypoglycemia on CBF relies on the absence of potential alterations of CBF secondary to peripheral cardiovascular changes. Isoflurane anesthesia minimally affects heart rate and pressure in mice. 35 Likewise, hypoglycemia is unlikely to secondarily alter CBF in our experiments. Indeed, firstly, while hypoglycemia was shown to increase heart rate – but not blood pressure, 6 we observed in parallel bench experiments using the MouseOx® module (Starr Life Science Corp, USA) in three control mice undergoing an identical CBF protocol, that heart rate did not significantly change during the experiment, i.e. between the basal and hypoglycemic periods (p > 0.05), or from beginning to end of the basal period (457 ± 75 bpm vs. 482 ± 46 bpm (mean ± SD) respectively, p > 0.05) and hypoglycemic phase (495 ± 39 bpm and 506 ± 36 bpm, respectively, p > 0.05). Secondly, CBF is highly autoregulated so that it remains independent of peripheral blood flow within a wide range of physiological cardiovascular states,1,31 and the observed heart rate ranges in our bench experiment were well within the physiological range for CBF autoregulation. 35 As CBF is altered by both hypercapnia and poor blood oxygenation, 31 appropriate PaCO2 and PaO2 values were maintained by controlling respiration rates in the range of 80–110 bpm by varying the delivery rate of isoflurane. 26
Optogenetics
Ten to fifteen weeks old glut2Cre/+;rosa26ChR2loxP/+ (glut2Cre;rosa26ChR2lox/+) and glut2+/+;rosa26ChR2loxP/+ controls (rosa26ChR2lox/+) were used for in vivo optogenetics experiments. One week before the experiment, the mice were placed in a stereotaxic frame (David Kopf Instruments, U.S.A) under isoflurane anesthesia. A custom made optical cannula made of a ceramic ferrule (Precision Fiber Products) and an optical fiber (0.39 NA, 200 µm core diameter) was lowered in the PVT using the following stereotaxic coordinates: AP −0.4/ML +0.8/DV −3.4 mm with a 10° angle to avoid any damage to the superior sagittal sinus. The optical cannula was secured on top of the skull with tissue adhesive (VetBond; 3 M) and dental cement (Paladur; Heraeus-Kulzer). On the day of the experiment, the animals were prepared for CBF measurement, as described above. In addition, a DSPP laser (LRS-0473-GFM-00100-05; Laserglow Technologies) placed outside the MRI scanner room was connected to the mice via a fiber optic patch cable plugged to the fiber cannula. The light stimulation protocol consisted of the delivery of 473 nm light pulses (10 ms light pulses at 20 Hz, 1 s on/1 s off, 15 mW) for 15 min during the acquisition of CBF measurements. CBF was monitored in anterior part of the PVT under basal and light-stimulated conditions. Basal CBF values were obtained by averaging CBF measurements before and after the optical stimulation.
Data analysis
The acquired 1H MR spectra were post-processed for quantification. Briefly, each spectrum was frequency-corrected, summed and prepared for further LCModel analysis. The water signal originating from the same VOIs without water suppression was assumed 80% for both hippocampal and hypothalamic tissues, as previously reported. 32 Data from mice with a basal (random fed) glycemia out of the 4–10 mM range were excluded in order to avoid any potential effect of mild hypoglycemia and acute hyperglycemia on the neurochemical profiles.36,37
CBF maps, in units of mL/100 g/min, were derived by pair-wise pixel-by-pixel calculation of label and control semi-adiabatic SE-EPI images as previously described
26

where λ is the blood–brain partition coefficient for water (0.9), T1 is the brain tissue longitudinal relaxation time (1.9 s at 9.4 T), SC is the control imaging signal intensity, SL is the labeled image signal intensity, and α is the labeling efficiency of ASL and assumed to be 0.8, as measured previously. 26 Regions of interests were manually drawn based on the acquired EPI images. For instance, two brain regions with abundant Glut2 neurons, e.g. hippocampus and hypothalamus, and one low abundant Glut2 region, cortex, were assessed. The whole brain was also evaluated. The percent changes of CBF were calculated based on the acquired CBF baselines under basal conditions, as above.
Statistics
Data are shown as mean ± SEM. Student t-test (paired/unpaired) was applied to single comparisons. In order to evaluate difference between genotypes or treatments, two-way ANOVA was used with two major factors, e.g. genotype and region for CBF, genotype and metabolite for neurochemical profiles, and genotype and treatments for CBF changes. Bonferroni post hoc tests were then applied. Differences were considered statistically significant when p-value was less than 0.05.
Results
Effects of systemic Glut2 inactivation on neurochemical profiles of both hippocampus and hypothalamus
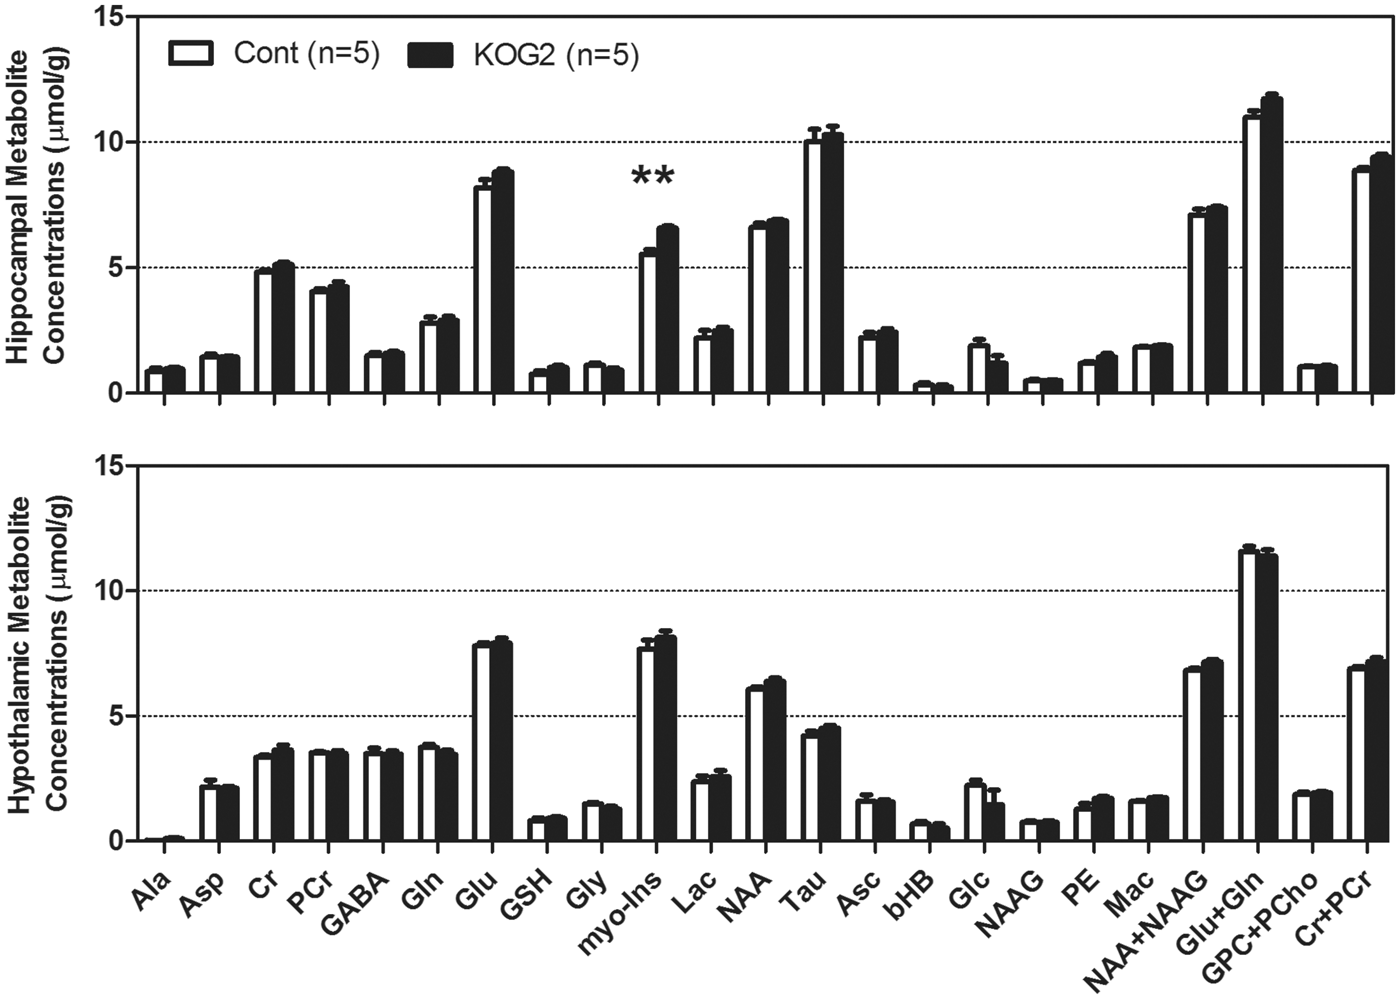
To evaluate the potential effects of Glut2 inactivation on brain neurochemical profiles, including energy substrates, such as glucose, lactate, and other metabolites, we acquired 1H MR spectra in the hippocampus and hypothalamus of ripglut1;glut2−/− mice under basal (random fed) condition in five ripglut1;glut2−/− mice and five control littermates. MR spectra were obtained from both brain regions with excellent quality, and distinct regional differences in metabolite levels (Figure 1). The glycemia before and at the end of the measurements were 9.3 ± 0.6 and 7.3 ± 2.0 mM, respectively (paired t-test p = 0.34) for control mice and 6.1 ± 0.2 vs. 5.0 ± 0.2 mM (paired t-test p < 0.03) for ripglut1;glut2−/− mice. Despite these glycemic differences between control mice and ripglut1;glut2−/− mice, which are due to renal glucose excretion in the absence of Glut2 from the proximal convoluted tubules, glucose levels in the hippocampus and hypothalamus were not different between strains (1.9 ± 0.2 vs. 1.2 ± 0.3 µmol/g in the hippocampus of control and mutant mice, respectively p = 0.093; 2.2 ± 0.2 vs. 1.5 ± 0.6 µmol/g, in the hypothalamus of control and mutant mice, respectively, p = 0.10). This was also the case for all the other measured metabolites, except for a significant increase of myo-inositol in the hippocampus of ripglut1;glut2−/− mice (Figure 2).
MR spectra of mouse brain hippocampus and hypothalamus. Localized MR spectra of hippocampus (red voxel in top MR image) and hypothalamus (yellow voxel in bottom MR image). Gln: glutamine; Glu: glutamate; tCr: total creatine; GABA: γ-aminobyutraric acid; myo-Ins: myo-inositol; NAA: N-acetyl-aspartate; Mac: macromolecule; Lac: lactate. Neurochemical profiles of hippocampus and hypothalamus. Neurochemical profiles of hippocampus (Top) and hypothalamus (Bottom) of ripglut1;glut2−/− mice (KOG2, solid black bars, n = 5) and their age-matched controls (Cont, in white bars, n = 5) recorded in the basal state, revealed very minimal changes in ripglut1;glut2−/− (KOG2) mice except a small increase of myo-inositol (myo-Ins, arrow) in hippocampus (genotype: F(1,192) = 20.72, p-value < 0.0001, metabolite: F(23,192) = 957.4, p-value < 0.0001, interaction, F(23,192) = 2.209, p-value = 0.002, Two-way ANOVA followed by the Bonferroni post-tests p-value < 0.01). Ala: alanine; Asc: ascorbate; Asp: aspartate; bHB: beta-hydroxybutryrate; Cr: creatine; myo-Ins: myo-inositol; GABA: γ-aminobutryric acid; Glc: glucose; Gln: Glutamine; Glu: glutamate; Gly: glycine; GPC: glycerophoshocholine; GSH: glutathione; Lac: lactate; Mac: macromolecule; NAA: N-acetyl-aspartate; NAAG: N-acetyl-aspartyl-glutamate; PCho: phosphocholine; PCr: phosphocreatine; PE: phosphatidylethanolamines; Tau: taurine. NAA+NAAG, Glu+Gln, GPC+PCho, Cr+PCr and myo-Ins+Tau were included for statistical analysis but not displayed here. Error bars were SEMs.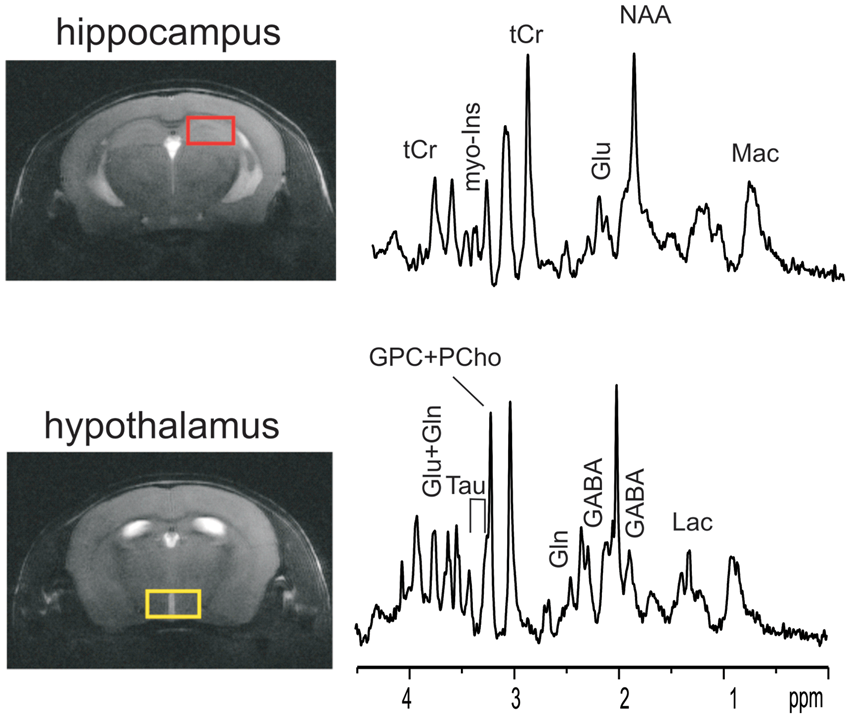
CBF of ripglut1;glut2−/− mice under resting/basal glycemia and insulin-induced hypoglycemia
For CASL-based measurement of CBF, another group of ripglut1;glut2−/− mice was studied. Multi-slice SE-EPI images were obtained with minimal artifacts or distortion and preserved anatomical structures, which allowed identifying regions of interest, e.g. hippocampus, hypothalamus, cortex and whole brain.
In basal conditions, CBF exhibited regional variations (Figure 3). A significantly higher CBF was observed in the hippocampus and hypothalamus of ripglut1;glut2−/− mice as compared to control mice (Figures 3(a) and 4(a) to (d)). When assessed in the cortex and the whole brain, no significant difference in CBF could be measured between strains. In control mice, blood glucose levels did not vary before and immediately after the CBF measurements (10.8 ± 1.0 mM vs. 10.3 ± 1.5 mM, respectively; paired t-test p = 0.96); in ripglut1;glut2−/− mice, glycemic levels tended to decrease (8.4 ± 2.1 mM vs. 5.7 ± 1.6 mM, respectively; paired t-test p = 0.19).
Cerebral blood flow color maps. Typical CBF maps of ripglut1;glut2−/− mice (KOG2 in a) and NG2KO mice (b) mice and their corresponding control littermates in basal conditions (basal, left column) and during insulin-induced hypoglycemia (hypo, right column). The typical CBF maps (mL/100 g/min) at Bregma 1 mm were scaled in the range of 0–200 ml/100 g/min to colors (see side bars). Impaired activation of CBF in ripglut1; glut2−/− mice during insulin-induced hypoglycemia. The CBF values (ml/100 g/min) of ripglut1; glut2−/− (KOG2) mice and their control littermates (Cont) were measured under basal glycemic condition and insulin-induced hypoglycemia in different brain regions: (a) cortex, (b) hypothalamus, (c) hippocampus and (d) whole brain. (e) Glycemic levels of control and ripglut1; glut2−/− mice under basal glycemic condition and upon insulin-induced hypoglycemia. (f) Changes in CBF in the indicated brain regions of control and ripglut1; glut2−/− mice under insulin-induced hypoglycemia, expressed as percent of basal CBF values. Error bars were SEMs. Statistical significance: *p < 0.05, **p < 0.01, ***p < 0.001, comparing treatments (two-way RM ANOVA with the Bonferroni post-tests), e.g. basal and hypo, in the same genotype groups. †p < 0.05, ††p < 0.01, †††p < 0.001, comparing genotypes, e.g. KOG2 vs. Cont, under the same glycemic conditions (genotype and region factors, two-way ANOVA with the Bonferroni post-tests). When compare basal vs. hypo in the same genotype groups (a–d), two-way RM ANOVA was applied. Cont. treatment: F(1,20) = 52.73, p-value < 0.0001, regions: F(3,20) = 10.81, p-value = 0.0002, interaction: F(3,20) = 0.7462, p-value = 0.5372; K2GO. treatment: F(1,24) = 1.799, p-value = 0.1924, regions: F(3,24) = 6.181, p-value = 0.0029, interaction: F(3,24) = 2.4, p-value = 0.0927. To compare genotype (a–d), two-way ANOVA was applied with genotype and region factors at basal and hypo conditions. Basal: genotype, F(1,44) = 20.01, p-value < 0.0001; region, (F(3,44) = 13.04, p-value < 0.0001; and interaction, F(3,44) = 0.4813, p-value = 0.6970; hypo: genotype, F(1,44) = 0.3470, p-value = 0.5588; region, F(3,44) = 11.12, p-value < 0.0001; interaction, F(3,44) = 0.3573, p-value = 0.7841. In F, genotype: F(1, 44) = 28.71, p-value < 0.0001, region: F(3, 44) = 1.319, p-value = 0.2804, interaction: F(3, 44) = 1.408, p-value = 0.2531.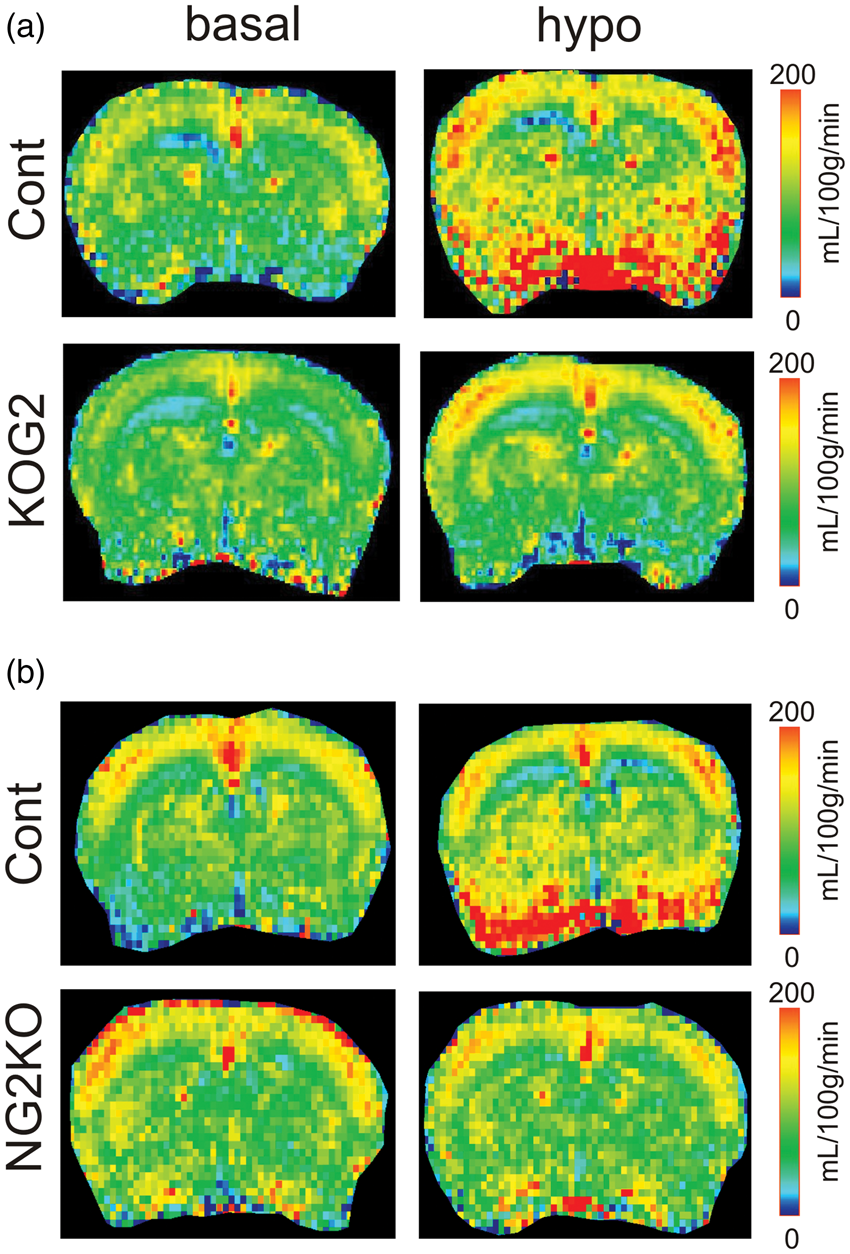
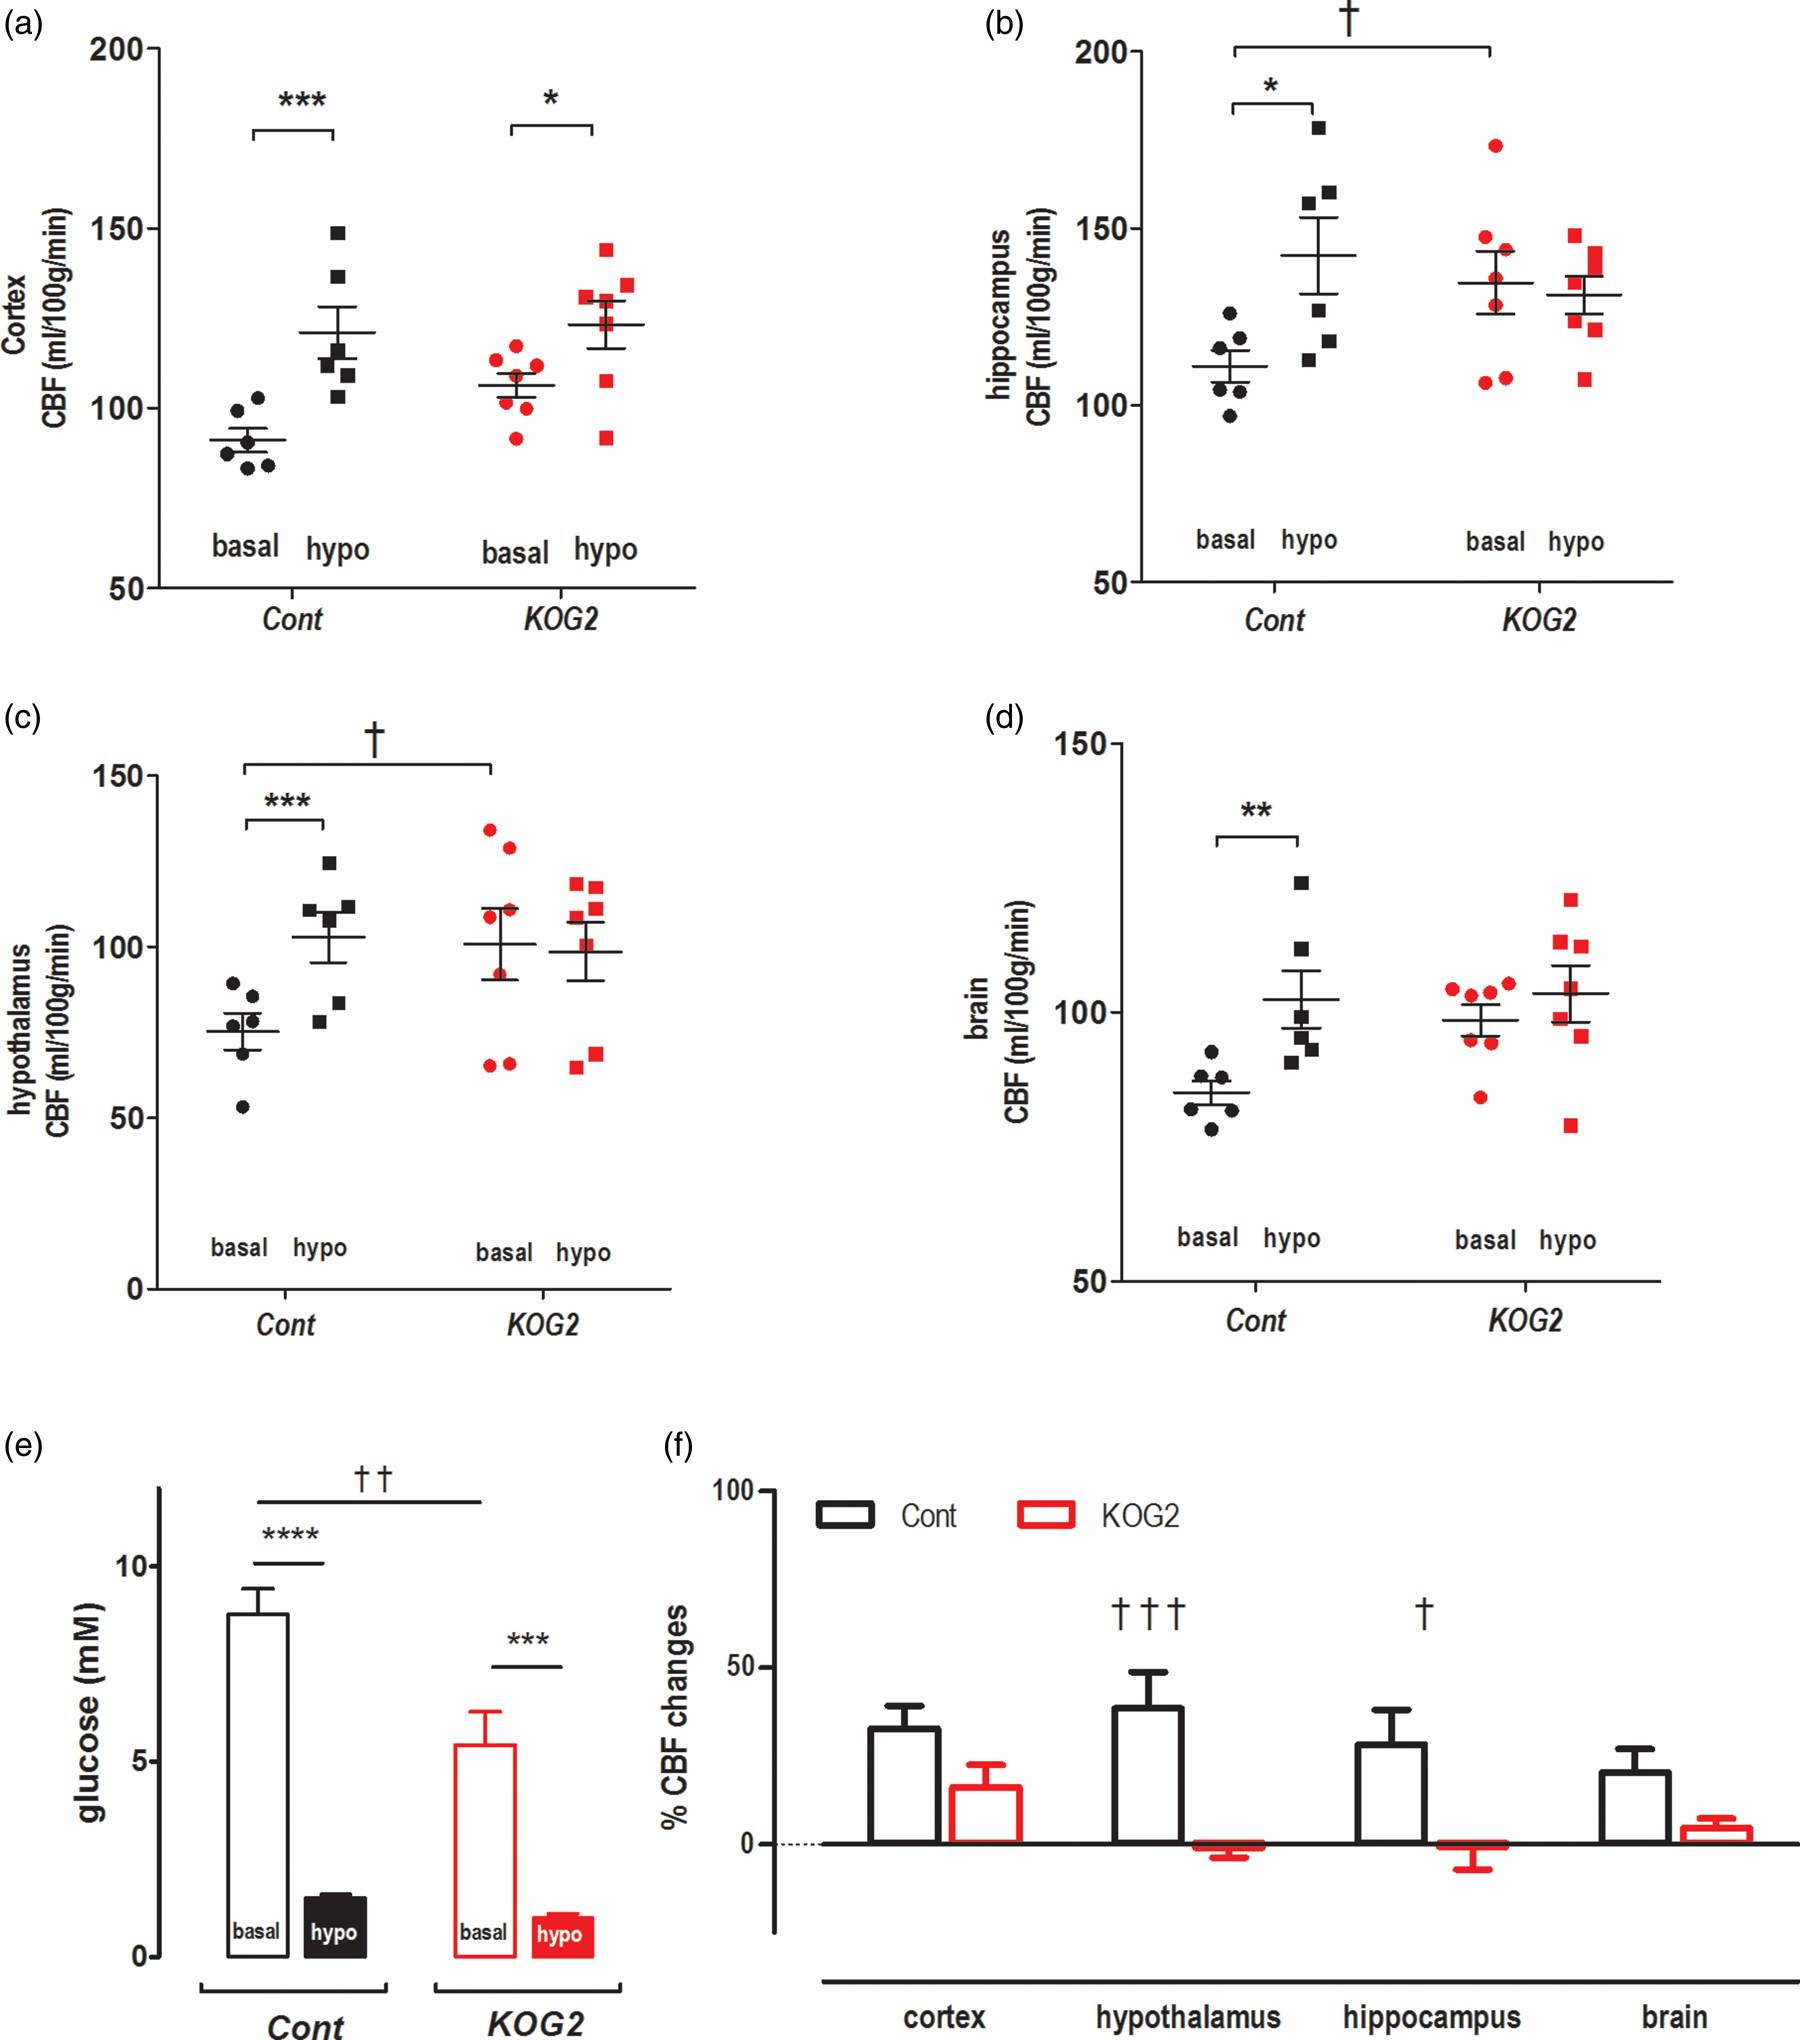
Next we determined CBF during insulin-induced hypoglycemia in ripglut1;glut2−/− mice (n = 7) and their controls (n = 6). In control mice, hypoglycemia (1.5 ± 0.1 mM, Figure 4(e)) significantly elevated CBF (Figures 3 and 4(a) to (d) and (f)) by 28 ± 10% in hippocampus, 38 ± 10% in hypothalamus, 33 ± 6% in cortex and 21 ± 6% in whole brain. In ripglut1;glut2−/− mice, hypoglycemia (1.0 ± 0.1 mM, Figure 4(e) and (f)) did not increase CBF except in the cortex where a small increase (5 ± 3%) could be measured.
CBF of NG2KO mice under resting/basal glycemia and acute hypoglycemia
To exclude potential contribution from peripheral Glut2 and specifically assess the role of nervous system Glut2 on CBF, we studied another mouse model, the NG2KO mice 30 in the basal state and upon insulin-induced hypoglycemia (Figure 3(b)), as described above.
In basal conditions, NG2KO mice and their controls (six of each) had similar glycemic levels, i.e. 6.9 ± 0.6 mM vs. 9.2 ± 1.7 mM (unpaired t-test p = 0.30). NG2KO mice displayed significantly higher CBF than controls in the hypothalamus and the whole brain, but not in the hippocampus and cortex (Figure 5(a) to (d)).
Impaired activation of CBF in NG2KO mice during insulin-induced hypoglycemia. The CBF values (ml/100 g/min) of NG2KO mice (n = 6) and their control littermates (Cont, n = 6) were measured under basal glycemic condition and insulin-induced hypoglycemia in different brain regions: (a) cortex, (b) hypothalamus, (c) hippocampus and (d) whole brain. (e) Glycemic levels of control and NG2KO mice under basal glycemic condition and upon insulin-induced hypoglycemia. (f) Changes in CBF in the indicated brain regions of control and NG2KO mice under insulin-induced hypoglycemia, expressed as percent of basal CBF values. Error bars were SEMs. Statistical significance: *p < 0.05, **p < 0.01, ***p < 0.001, comparing treatments (two-way RM ANOVA with the Bonferroni post-tests), e.g. basal and hypo, in the same genotype groups. †p < 0.05, ††p < 0.01, †††p < 0.001, comparing genotypes, e.g. NG2KO vs. Cont, under the same glycemic conditions (genotype and region factors, two-way ANOVA with the Bonferroni post-tests). To compare basal vs. hypo in the same genotype groups (a–d), two-way RM ANOVA was applied (treatment and region). Cont: treatment, F(1,20) = 79.34, p-value < 0.0001; regions, F(3,20) = 3.862, p-value = 0.0249; interaction, F(3,20) = 1.028, p-value = 0.4013; Subjects (matching) p-value = 0.0002; NG2KO: treatment, F(1,20) = 0.007026, p-value = 0.934; regions, F(3,20) = 4.919, p-value = 0.0102; interaction, F(3,20) = 4.274, p-value = 0.0174; Subjects (matching), p-value = 0.0098. To compare genotype (a–d), two-way ANOVA was applied with genotype and region factors at basal and hypo conditions. Basal: genotype, F(1,40) = 22.61, p-value < 0.0001; region, (F(3,40) = 8.249, p-value = 0.0002; and interaction, F(3,40) = 0.9113, p-value = 0.4442; hypo: genotype, F(1,40) = 1.252, p-value = 0.2698; region, F(3,40) = 6.802, p-value = 0.0008; interaction, F(3,40) = 0.6181, p-value = 0.6074. In F (genotype and region factors), genotype: F(1,40) = 36.43, p-value < 0.0001, interaction: F(3,40) = 2.811, p-value = 0.0516, region: F(3,40) = 1.940, p-value = 0.1387.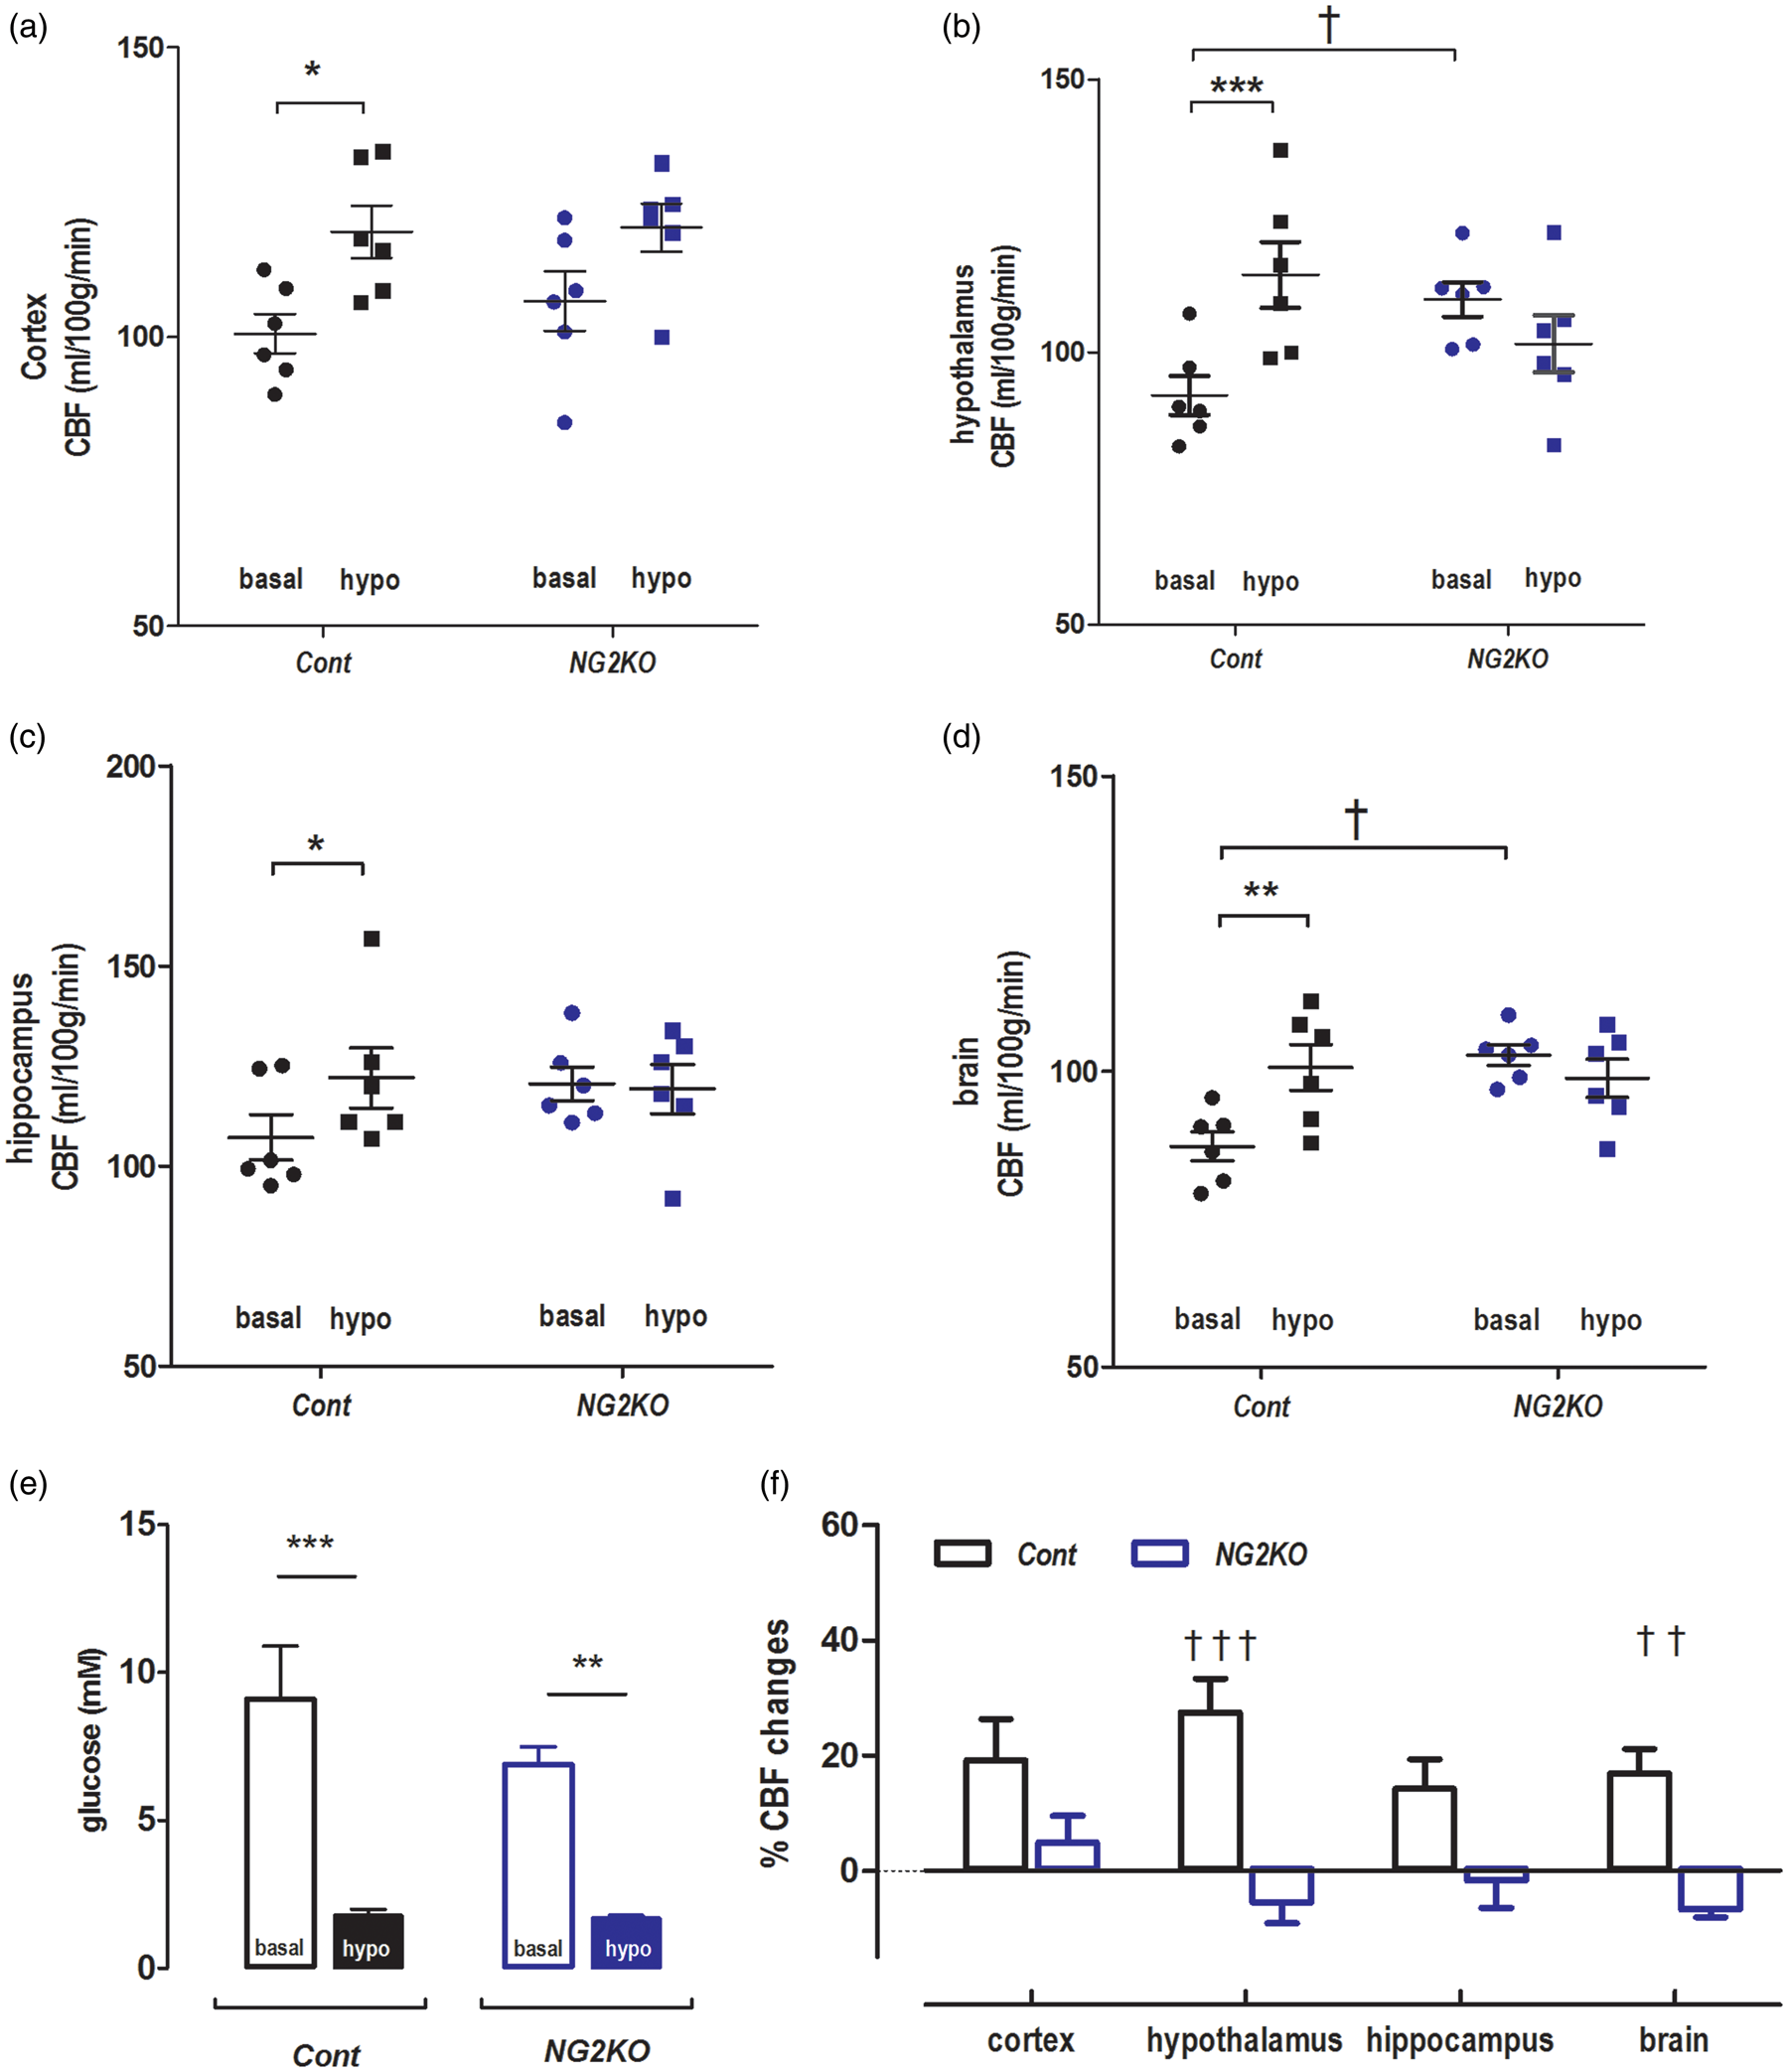
Upon insulin-induced hypoglycemia (Figure 5(e)), control mice displayed increased CBF over all regions analyzed, e.g. 14 ± 3% in hippocampus, 24 ± 4% in hypothalamus, 18 ± 5% in cortex and 15 ± 3% in brain (Figure 5(a) to (d) and (f)). In contrast, hypoglycemia in NG2KO mice (Figure 5(e)), failed to increase CBF in the hippocampus (−2 ± 4%), in the hypothalamus (−7 ± 3%) and in the entire brain (−5 ± 2%), with, however, a small increase in the cortex (11 ± 7%) (Figure 5(a) to (d) and (f)). The higher CBF measured in both the ripglut1;glut2−/− mice and NG2KO mice in the basal state as compared to their respective controls suggests that inactivation of Glut2, by preventing glucose uptake, leads to an intracellular state of hypoglycemia sufficient to maximally activate the Glut2 cells involved in CBF control.
Optogenetic activation of PVT Glut2 neurons increases CBF
To directly evaluate the role of Glut2-expressing cells in the regulation of CBF, we determined whether optogenetic activation of Glut2-neurons of the PVT could elicit a local increase in CBF. We previously reported that these PVT Glut2 neurons form a homogenous population of glucose-inhibited neurons that control motivated sucrose seeking behavior.
15
Here, we equipped glut2Cre;rosa26ChR2lox/+ mice and littermates not expressing channelrhodopsin with a fiber-optic cannula in the PVT. CASL measurements were performed in the basal state and during optical stimulation. Light stimulation of channelrhodopsin-expressing Glut2-neurons increased local CBF in the PVT by 28 ± 4% (Figure 6); no such increase was observed in control (1 ± 3%, Figure 6). No differences in glycemia were found between the two groups, e.g. 8.8 ± 0.6 mM in glut2Cre;rosa26ChR2lox/+ mice and 9.6 ± 0.8 mM in controls (unpaired t-test p = 0.53) before CBF measurements, and 6.3 ± 0.6 vs. 8.3 ± 1.8 mM (unpaired t-test p = 0.33) at the end of the measurements.
Optogenetic activation of Glut2 neurons of the PVT increases local CBF. Glut2 neurons of the PVT expressing channelrhodopsin were stimulated by light during CBF measurements. In anatomical MR images (a), squares indicate the location of the PVT. (b) Light-induced CBF increase in mice expressing channelrhodopsin (Glut2-ChR) in Glut2 cells (n = 5) but not in control mice (Cont) not expressing channelrhodopsin (n = 6). Error bars were SEMs. Student unpaired t-test p value was 0.004.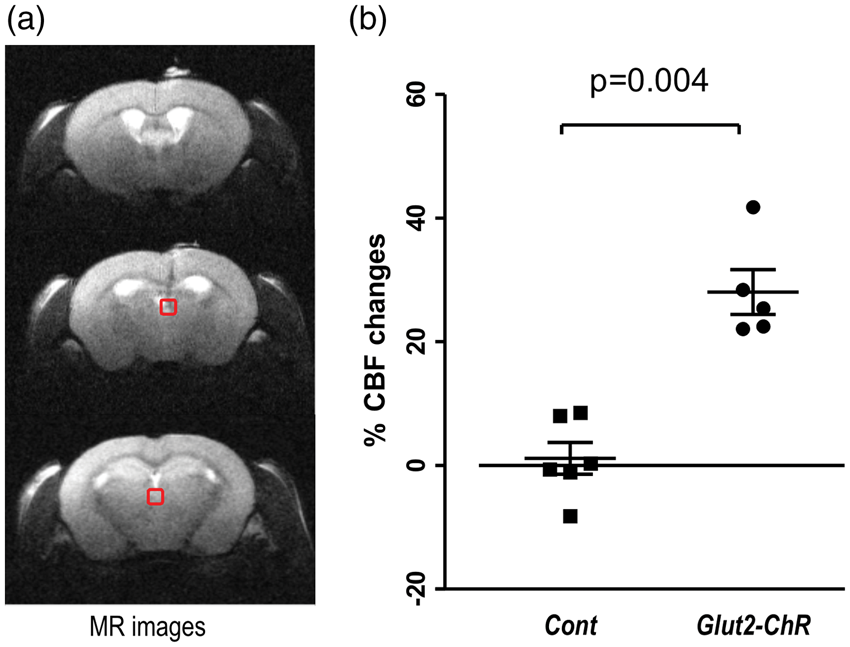
Discussion
The present study shows that systemic inactivation of Glut2 or its inactivation only in the nervous system increases CBF in basal glycemic conditions but prevents its increase in response to insulin-induced hypoglycemia. This was observed in the whole brain and specifically in the hypothalamus and hippocampus, and to a lesser extent in the cortex. In addition, optogenetic activation of Glut2-neurons of the PVT was sufficient to increase local CBF. This study, thus, identifies Glut2 expression in brain cells as a critical determinant of CBF response to hypoglycemia.
Previous immunohistochemical studies reported that Glut2 is expressed in many brain regions where it is expressed by sparsely distributed neurons, glial or endothelial cells.16,17 Mice expressing a fluorescent reporter protein under the control of the Glut2 locus show a similar distribution of Glut2-expressing cells. 18 These central Glut2 expressing cells were found to be required for glucose sensing and the control of various aspects of glucose homeostasis and feeding behavior.19,20,38 In particular, we showed that central Glut2-dependent glucose sensing cells are required for the control of glucagon secretion in response to hypoglycemia.18,19,39
In the present study, we extended these studies to assess the role of Glut2 expressing cells in the CBF response to hypoglycemia using the non-invasive MR techniques. Absence of Glut2 expression in ripglut1;glut2−/− mice had no effect on brain metabolites levels, impacting only slightly myo-inositol in the hippocampus but not in the hypothalamus. Notably, glucose levels in these two brain regions of Glut2-null mice were in the 1–2 µmol/g range at euglycemia, in agreement with the fact that glucose transport through brain capillaries, a process that depends largely on Glut1 expression in endothelial cells, represents the rate-limiting step for establishing parenchymal glucose levels. 40 In basal conditions, CBF was slightly, but significantly elevated in the hypothalamus of ripglut1;glut2−/− and NG2KO mice and in the hippocampus of ripglut1;glut2−/− mice when compared to their respective control littermates. Such increases in blood flow could not be explained by hypercapnia 31 or poor blood oxygenation since throughout the entire studies we maintained their respiration rates in the range of 80–110 bpm by varying the delivery rates of isofluorane that ensured appropriate PaCO2 and PaO2 values. Moreover, these CBF increases were seen despite the fact that we used isoflurane, an anesthetic vasodilator,41–43 which can raise all measured blood flow values and thus might narrow the CBF differences between strains. Since we excluded animals with moderate acute hyperglycemia, which occurred occasionally in controls but less so in ripglut1;glut2−/− mice, plausible CBF variations44–47 were ruled out from these CBF differences between strains.
Upon hypoglycemia, control mice displayed a marked increase in CBF in the cortex, the hippocampus and the hypothalamus, where the highest increase was observed. The increase in CBF induced by hypoglycemia was slightly lower in the NG2KO control group as compared to the ripglut1;glut2−/− control group; this may be attributed to slightly higher hypoglycemic levels of NG2KO controls compared to the ripglut1:glut2−/− control group (∼1.8 mM vs. 1.5 mM, unpaired t-test p = 0.09), similar to observations in rats. 9 It is striking that the absence of Glut2 expression in both mouse models studied led to the same increase in CBF in the basal state and the absence of response during insulin-induced hypoglycemia, except for a small increase in the cortex. The brain as a whole showed a markedly blunted CBF response in both mouse models. The lower suppression of CBF in the cortex is consistent with a lower vulnerability to hypoglycemia of the cortical tissue compared to other brain regions1,48–50 suggesting that whereas Glut2-dependent sensing is critical for adjusting CBF in many brain areas, other hypoglycemia detection mechanisms may operate in the cortex.
Our optogenetics experiments showed that activation of channelrhodopsin-expressing Glut2-neurons of the PVT led to a robust increase in local CBF, similar in magnitude to that obtained following insulin-induced hypoglycemia. These PVT Glut2 neurons have previously been described to control motivated feeding behavior through their projection to the nucleus accumbens, 15 a response that is activated by hypoglycemia or by Glut2 inactivation. Whether the same neurons control feeding behavior and CBF is not known. From our present experiments, we do not know if activation of PVT Glut2 neurons increase CBF also in the nucleus accumbens where their projections form a very dense network. Nevertheless, the fact that these PVT Glut2 neurons are glutamatergic suggests that they control CBF through the release of glutamate, which has been reported to be a key signal to trigger the production of various vasodilators by astrocytes and neurons. 1
The observation that in the absence of Glut2, the basal state CBF is high and not further increased by hypoglycemia is analogous to our previous report that plasma glucagon levels during euglycemic clamps are higher in ripglut1;glut2−/− mice than in control mice and are not further increased by hypoglycemia. 39 This, therefore, suggests that in the absence of Glut2, the hypoglycemia-sensing cells that normally express this transporter can no longer take up glucose, thereby causing an intracellular state of hypoglycemia, which maintains the cells in an active state. The consequences are hyperglucagonemia and higher CBF in basal glycemic conditions. This also indicates that absence of Glut2 from these sensing cells is not compensated by expression of another glucose transporter. In a previous study, 19 we also showed hypoglycemia-induced glucagon secretion could be restored in ripglut1;glut2−/− mice by transgenic expression of Glut2 in astrocytes but not neurons. Here, we show that, at least in the PVT, Glut2-neurons can directly control CBF when activated by optogenetics. Whether CBF and glucagon responses depend on Glut2 expression by different cell types, neurons vs. astrocytes, or whether hypoglycemia sensing in different brain regions rely on different cellular mechanisms that similarly control CBF and glucagon secretion is not known. However, our studies of Glut2 neurons of the PVT 15 and the NTS 14 showed that, although they are both activated by hypoglycemia, the PVT neurons are glutamatergic and the NTS ones are GABAergic. Thus, there is probably a multiplicity of hypoglycemia sensing modalities, which control various physiological functions. These could be investigated using optogenetic approaches as used here to selectively activate the Glut2 neurons of the PVT.
Collectively, our data show that Glut2 expression by brain cells is required for the control CBF in response to variations in glucose concentrations. These cells could be neurons, as shown for the PVT Glut2 neurons activated by optogenetics. But they could also be astrocytes, as these cells have been shown to also be involved in Glut2-dependent counterregulation. 19 One interesting aspect of these findings is that Glut2 cells are present in most brain areas as dispersed cells with, however, a distinctly low abundance in the cortex, where sparse nerve terminals have been observed. 17 These Glut2-expressing cells may, therefore, form a global monitoring system that detect falls in glycemia and trigger area-specific increases in blood flow. More work is required to fully understand how activation of these cells increases CBF. However, as Glut2 PVT neurons are glutamatergic and glutamate plays a critical role in controlling vasodilation, 1 glutamate release may be a key mediator of increased CBF. Our mouse models may be used to further dissect the link between hypoglycemia detection and increased CBF.
Supplemental Material
Supplemental material for Glucose transporter 2 mediates the hypoglycemia-induced increase in cerebral blood flow
Supplemental material for Glucose transporter 2 mediates the hypoglycemia-induced increase in cerebral blood flow by Hongxia Lei, Frédéric Preitner, Gwenaël Labouèbe, Rolf Gruetter and Bernard Thorens in Journal of Cerebral Blood Flow & Metabolism
Footnotes
Funding
The author(s) disclosed receipt of the following financial support for the research, authorship, and/or publication of this article: This work was supported by the Centre d'Imagerie BioMédicale (CIBM) of the University of Lausanne (UNIL), University of Geneva (UNIGE), Hôpitaux Universitaires de Genève (HUG), Centre Hospitalier Universtaire Vaudois (CHUV), and Ecole Polytechnique Fédérale de Lausanne (EPFL); and the Leenaards and Jeantet Foundations. The work in BT’s laboratory was supported by grants from the Swiss National Science Foundation (3100A0B-128657) and European Research Council Advanced Grant (INSIGHT and INTEGRATE).
Declaration of conflicting interests
The author(s) declared no potential conflicts of interest with respect to the research, authorship, and/or publication of this article.
Authors’ contributions
Study concept and design: HL, RG and BT; acquisition of data: HL, FP, GL; analysis and interpretation of data: HL, FP, GL, RG, BT; drafting of the manuscript: HL, FP, GL, RG, BT. HL and BT are the guarantors of this work, had full access to all the data in the study and take responsibility for the integrity of the data and the accuracy of the data analysis.
References
Supplementary Material
Please find the following supplemental material available below.
For Open Access articles published under a Creative Commons License, all supplemental material carries the same license as the article it is associated with.
For non-Open Access articles published, all supplemental material carries a non-exclusive license, and permission requests for re-use of supplemental material or any part of supplemental material shall be sent directly to the copyright owner as specified in the copyright notice associated with the article.