
Abstract
It has been suggested that compared with other brain tissues, the hippocampus in particular is vulnerable to chronic hypoperfusion. We investigated whether total parenchymal cerebral blood flow (pCBF) was associated with hippocampal atrophy, and also whether this relationship was modified by white matter lesions (WMLs). In a cross-sectional analysis within the SMART-MR (Second Manifestations of ARTerial disease-magnetic resonance) study, which is a cohort study among patients with arterial disease, total CBF (tCBF) and hippocampal volume were assessed in 392 patients (mean age: 62±9 years, 84% men). Total CBF was expressed in per 100 mL brain volume for obtaining pCBF. Manual volumetric measurements of the hippocampus were carried out on a three-dimensional fast field-echo T1-weighted magnetic resonance imaging scan with isotropic voxels. Automated brain segmentation was used to quantify volumes of the WML and the total brain. A linear regression analysis showed that reduced pCBF was not associated with smaller hippocampal volume after adjustments were made for age and sex. The association attenuated further after additional adjustments were made for vascular risk factors, lacunar infarcts, and WMLs (β=0.01 mL per s.d. decrease in pCBF; 95% confidence interval: −0.06 to 0.08). The association was not modified by WML (P-value for interaction term pCBF∗WML=0.84). We found no evidence of the fact that lower parenchymal blood flow contributes to the neurodegeneration of the hippocampus in a population of patients with arterial disease.
Keywords
Introduction
Hippocampal atrophy has been associated with cognitive deterioration and conversion to dementia (Scheltens et al, 1992; Laakso et al, 1995). It has been suggested that compared with other brain tissues, the hippocampus in particular is vulnerable to chronic hypoperfusion (Ruitenberg et al, 2005). Hypoperfusion may result in hypoxia and ischemia, which in turn, may lead to the neurodegeneration of hippocampal neurons (Pulsinelli et al, 1982; Cervos-Navarro and Diemer, 1991; Kril et al, 2002). Studies have shown that reduced cerebral perfusion is associated with brain atrophy (de la Torre, 2002; Appelman et al, 2008) and may contribute to the development of cerebrovascular disease (Bisschops et al, 2004), cognitive decline, and dementia (Jagust et al, 1997; Rabbitt et al, 2006; Poels et al, 2008).
In healthy individuals, the brain can compensate for hypoperfusion by decreasing the resistance of the vascular bed and can thus maintain an adequate cerebral perfusion (Marstrand et al, 2002). However, in patients experiencing cerebral small vessel disease, this autoregulation is impaired, and the capacity to respond adequately to a decrease in blood flow to the brain is thus reduced, which may lead to neurodegeneration (Kril et al, 2002; Marstrand et al, 2002). Indeed, in a previous study (Appelman et al, 2008), we observed that reduced cerebral blood flow (CBF) was associated with more subcortical atrophy if moderate-to-severe white matter lesions (WMLs) were present. This study was conducted in a large sample of patients with arterial disease, a group particularly at a high risk of cerebral small vessel disease. However, no studies have examined whether this vulnerability of WMLs for reduced CBF is also present in the hippocampus.
We investigated whether reduced CBF, relative to total brain tissue, was associated with smaller hippocampal volume, and also whether this relationship was modified by WMLs in patients with arterial disease. We hypothesize that reduced CBF due to arterial disease in combination with the presence of WMLs will be associated with smaller hippocampal volume.
Materials and methods
SMART-MR Study
This study is a cross-sectional analysis within the Second Manifestations of ARTerial disease-magnetic resonance (SMART-MR) study, a prospective cohort study within the SMART study (Simons et al, 1999) with regard to brain changes on magnetic resonance imaging in patients with manifest arterial disease. Methods for baseline examinations have been described previously (Appelman et al, 2008). In brief, between May 2001 and December 2005, patients were included in the study if they were newly referred to the University Medical Center Utrecht with coronary artery disease, cerebrovascular disease, peripheral disease or abdominal aortic aneurysm, and had no MR contraindications. During a 1-day visit to our medical center, a physical examination was performed, and ultrasonography of the carotid arteries, blood, and urine sampling were conducted. Risk factors, medical history, and functioning were assessed using questionnaires that the patients filled before their visit to the medical center. In total, 1,309 patients (mean age: 58±10 years; 80% men) were included in the SMART-MR study. The SMART-MR study was approved by the ethics committee of our institution, and written informed consent was obtained from all participants.
Starting in January 2006, all patients still alive have been invited for a second MR of the brain and other follow-up examinations, including assessment of risk factors and cognitive testing. In addition, a T1-weighted three-dimensional fast field-echo sequence was added to the MRI protocol for measuring hippocampal volume. Patients are still being invited for follow-up examinations, but for the current analysis, we used data collected between 2006 and 2007. In 2006 and 2007, a total of 499 patients (mean age: 62±9 years; 85% men) received follow-up examinations.
Magnetic Resonance Protocol
The MR investigations were carried out on a 1.5-T whole-body system (Gyroscan ACS-NT, Philips Medical Systems, Best, The Netherlands). The protocol consisted of a transversal T1-weighted gradient-echo sequence (repetition time (TR)/echo time (TE): 235/2 msec; flip angle: 80°), a transversal T2-weighted turbo spin-echo sequence (TR/TE: 2,200/11 msec and 2,200/100 msec; turbo factor 12), a transversal T2-weighted FLAIR (fluid attenuating inverse recovery) sequence (TR/TE/TI (inversion time): 6,000/100/2,000 msec), and a transversal IR (inversion recovery) sequence (TR/TE/TI: 2,900/22/410 msec; FOV (field of view): 230 × 230 mm; matrix size: 180 × 256; slice thickness: 4.0 mm; slice gap: 0.0 mm; 38 slices). Furthermore, on the basis of a localizer MR angiographic slab in the sagittal plane, a two-dimensional phase-contrast section was positioned at the level of the skull base for measuring the volume flow of the internal carotid arteries and the basilar artery (TR/TE: 16/9 msec; flip angle: 7.5°; slice thickness: 5.0 mm; FOV: 250 × 250 mm; matrix size: 256 × 256; eight acquired signals; velocity sensitivity: 100 cm/sec). For hippocampal volume measurements, we obtained a sagittal T1-weighted three-dimensional fast field-echo sequence (TR/TE: 7.0/3.2 msec; flip angle: 8°, FOV: 240 mm; matrix size: 240 × 256; slice thickness: 1.0 mm; slice gap: 0.0 mm; 170 slices).
Measurement of Total Cerebral Blood Flow
Postprocessing of the flow measurements was performed blinded to the clinical or brain characteristics of the patient. For each vessel, the spatial and time-averaged flow velocity was calculated from the phase-difference images by manually drawing a region of interest around the vessel (Figure 1). The average flow velocity in each vessel was multiplied by the cross-sectional area of the pixels in the region of interest to obtain the volume of flow rate. Good agreement between the repeated volume flow rate measurements was shown in our research group, with a 5% coefficient of variation (Bakker et al, 1995). The flow through the left and right internal carotid arteries and basilar artery were summed up to calculate the total CBF (tCBF expressed in mL/min). As a part of the differences in tCBF between individuals can be attributed to differences in brain size, we expressed tCBF per 100 mL brain tissue by dividing the tCBF by the total brain volume (mL) and multiplying this by 100 to obtain parenchymal CBF (pCBF) (Appelman et al, 2008).
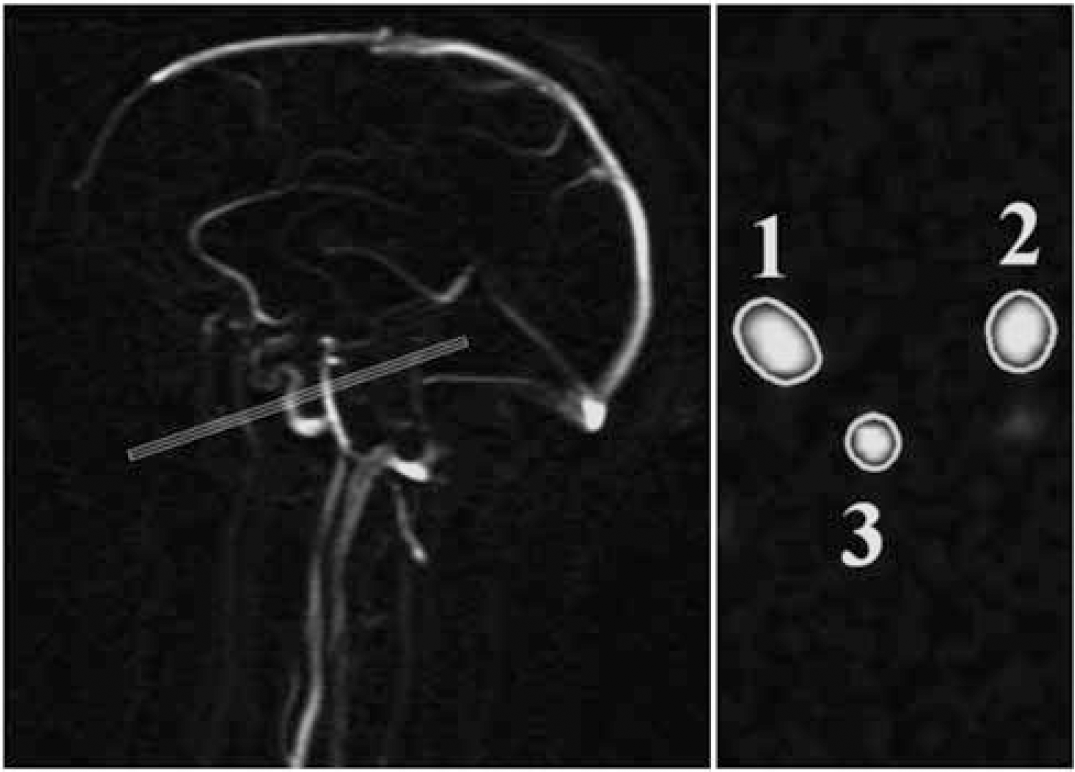
Left: Sagittal localizer MRA image illustrating the positioning of a two-dimensional phase-contrast MR angiographic slab used to measure the volume flow through the internal carotid arteries and basilar artery. Right: quantitative flow values were obtained by integrating across manual drawn regions of interest that enclose the vessels (1 indicates right-sided internal carotid artery; 2 indicates basilar artery; 3 indicates left-sided internal carotid artery).
Brain Segmentation
We used the T1-weighted gradient-echo, IR sequence, and FLAIR sequence for brain segmentation. The probabilistic segmentation technique according to the k-nearest neighbor classification has been described elsewhere (Anbeek et al, 2005). The result of the classification method is a probability value for each voxel that quantifies the amount of a specific tissue type contained in that voxel. The segmentation program distinguishes gray matter, white matter, sulcal and ventricular cerebrospinal fluid (CSF), and lesions. Total volumes were calculated by multiplying these probabilities by the number and volumes of the voxels (4.0 × 0.9 × 0.9 mm).
White matter lesions and infarcts are classified as ‘lesion’ volume, as the segmentation program cannot distinguish between them. Therefore, an investigator and a neuroradiologist visually checked the results of the segmentation analysis, and made a further distinction into WMLs and infarct volumes by manually assigning the lesion volumes to one of these two categories. The total brain volume was calculated by summing up the volumes of gray and white matter and, if present, the volumes of WMLs and infarcts. The total intracranial volume (ICV) was calculated by summing up the total brain volume and volumes of sulcal and ventricular CSF. All volumes cranial to the foramen magnum were included in the segmentation results. As a result, the total brain volume includes the cerebrum, brainstem, and the cerebellum.
Assessment of Hippocampal Volume
The sagittal T1-weighted images were tilted to the coronal plane and orientated perpendicular to the long axis of the left hippocampus. The hippocampus was manually outlined on an average of 40 slices and included the hippocampus proper, subiculum, fimbria, alveus, and dentate gyrus. We started at the first slice where the hippocampus was visible as the anterior boundary. The alveus, which was clearly visible, formed the dorsal border of the hippocampus on the anterior slices and was used to separate the hippocampal head from the amygdala. More posterior, the dorsal boundary was defined by CSF and choroid plexus, which were not included in the measurements. The posterior border was defined as the slice before the total length of the fornix was visible. The lateral boundaries were defined by the CSF of the temporal horn of the lateral ventricle and by the gray–white matter border of the temporal stem. Medially, the hippocampus was bounded by CSF in the cisterna ambiens and transverse fissure, and ventrally by the white matter of the parahippocampal gyrus (Figure 2).
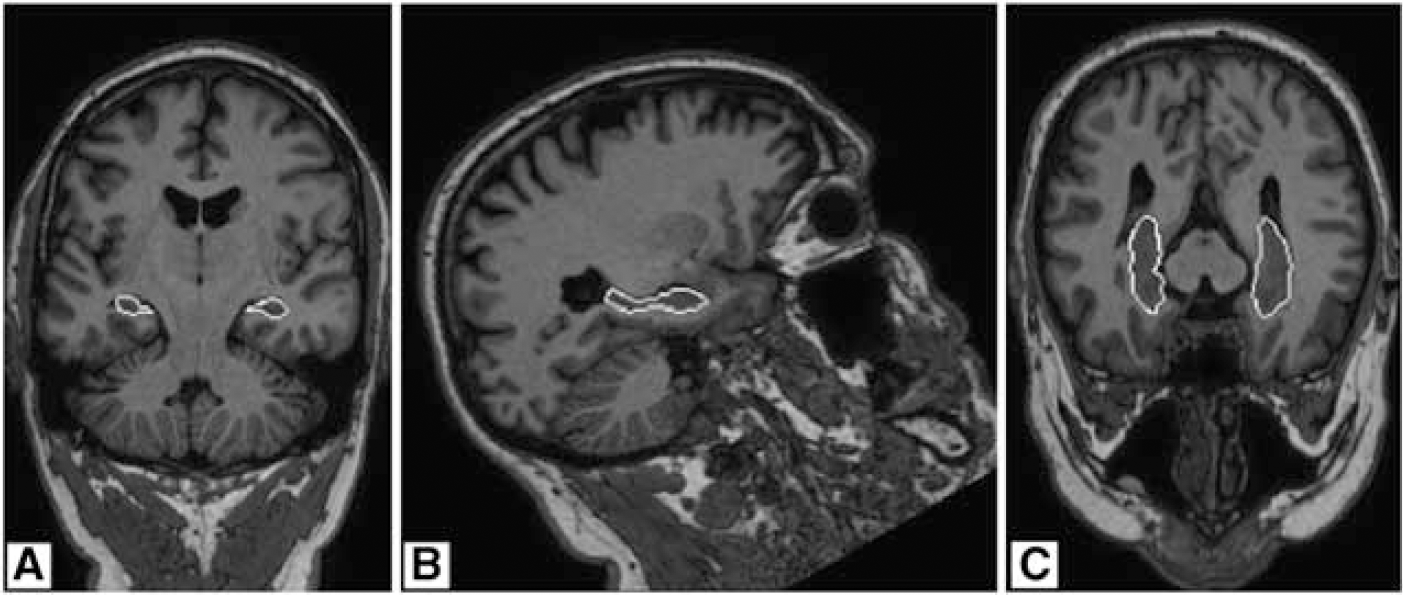
Magnetic resonance image of the hippocampal formation in three orientations. Shown are coronal (
Hippocampal volumes were measured by two extensively trained investigators, who were blinded to all clinical information. Left and right hippocampal volumes were calculated by multiplying the total number of voxels by the volume of a voxel (1.0 × 0.94 × 0.94 mm). The intrarater reliability coefficient for repeated tracing in 20 randomly selected hippocampi was 0.96 and 0.98, respectively, and the interrater agreement was 0.96. The reproducibility of the hippocampal measurements was also analyzed according to the method described by Bland and Altman (1986). The mean difference in hippocampal volume measurements between the two raters was 11.1 voxels. The coefficient of variation was 3.8%.
White Matter Lesions and Infarcts
Volumes of WMLs obtained with the segmentation program were summed up to obtain the total WML volume. There was no distinction between deep and periventricular WMLs as these are highly correlated, and it has been suggested that categorical distinctions between periventricular and deep WMLs are arbitrary (Decarli et al, 2005). The WMLs were divided by ICV to correct for individual differences in head size. Infarcts were defined as focal hyperintensities on T2-weighted images of at least 3 mm. Hyperintensities located in the white matter, had to appear as a hypointense lesion on the T1-weighted images, to discern them from WMLs. Dilated perivascular spaces were distinguished from infarcts on the basis of their location, form (round/oval), and the absence of gliosis (Giele et al, 2004). The location, affected flow territory, and type were scored for every infarct. A lacunar infarct was defined as an infarct sized between 3 and 15 mm and located in the subcortical white matter, thalamus, or basal ganglia.
Vascular Risk Factors
During the patient's visit to the hospital, after overnight fasting, venous blood sample was collected to determine glucose and lipid levels. Height and weight were measured without shoes and heavy clothing and the body mass index was calculated (kg/m2). Systolic and diastolic blood pressure levels (mm Hg) were measured thrice using a sphygmomanometer while the patient was seated, and the average of the three measurements was calculated. Information on the current use of medication, smoking, and alcohol status was obtained using questionnaires. To calculate pack-years of smoking, the average number of smoked cigarettes per day was divided by 20 and then multiplied by the number of years of smoking. Diabetes mellitus was defined as a referral diagnosis of diabetes, self-reported diabetes (use of glucose-lowering agents), a known history of diabetes or a fasting plasma glucose level of 7.0 mmol/L at baseline, and receiving treatment with glucose-lowering agents within 1 year after baseline. Hyperlipidemia was defined as total cholesterol >5.0 mmol/L, low-density lipoprotein cholesterol >3.2 mmol/L, or use of lipid-lowering drugs.
Study Sample
Of the 499 patients who were examined between 2006 and 2007, segmentation data were missing in 85 patients (missing MR sequences required for the segmentation analysis, because of the development of the scanning protocol for the segmentation of the hippocampus (n=49), irretrievable MR data (n=18), and motion or other artefacts (n=18)). Of the remaining 414 patients, CBF measurements were missing in 2 patients. Furthermore, 20 patients were excluded from analysis, because they had missing values on one or more covariates. Therefore, the total study sample consisted of 392 patients.
Data Analysis
The mean hippocampal volumes were divided by ICV to correct for variation in head size. This proportion was multiplied by the mean ICV of the study population (1,465 mL) to obtain relative hippocampal volumes expressed in milliliters. We summed up the left and right sides to yield total volumes because the analyses did not suggest a laterality of effects. To assess to what extent pCBF was associated with hippocampal volumes, a linear regression analysis was used. The pCBF was expressed in per s.d. increase. In the first model, no adjustments were made. In the second model, adjustments were made for age and sex. In the third model, additional adjustments were made for smoking, alcohol use, body mass index, hyperlipidemia (yes versus no), diabetes mellitus (yes versus no), systolic and diastolic blood pressures, the presence of lacunar infarcts, and WML. To examine whether the association between pCBF and measures of brain atrophy was modified by the WML, an interaction term between pCBF and WML volume was entered in model 3. Furthermore, as it has been suggested that hippocampal atrophy may accelerate with increasing age (Scahill et al, 2003), an interaction term between age and pCBF was entered in the final model to investigate whether the association between pCBF and hippocampus changed with age. All analyses were repeated after the exclusion of patients with one or more nonlacunar cerebral infarcts (i.e., cortical, large subcortical, or infratentorial infarcts (n=82)).
In all analyses, the 95% confidence intervals (95% CI) were determined. The statistical package SPSS version 14.0 (SPSS, Chicago, IL, USA) was used to analyze the data.
Results
The baseline characteristics for the total study sample on the basis of tertiles of pCBF are presented in Table 1. The total sample consisted of 392 patients of whom 84% were men (mean age±s.d.: 62±9 years). The mean pCBF±s.d. was 49.8±11.2 mL/min per 100 mL brain volume. The mean total hippocampal volume was 6.2±0.7 mL, and this volume was smaller in the lowest tertile of pCBF (Table 1). The patients in the lowest tertile of pCBF were older, were more often men, and had more frequent Diabetes Mellitus (DM) compared with patients in the upper two tertiles. Furthermore, the WML volume was larger and lacunar infarcts were more often present in patients with lower pCBF.
Patient characteristics according to pCBF (mL/min per 100 mL brain volume) and in total study sample (n=392)
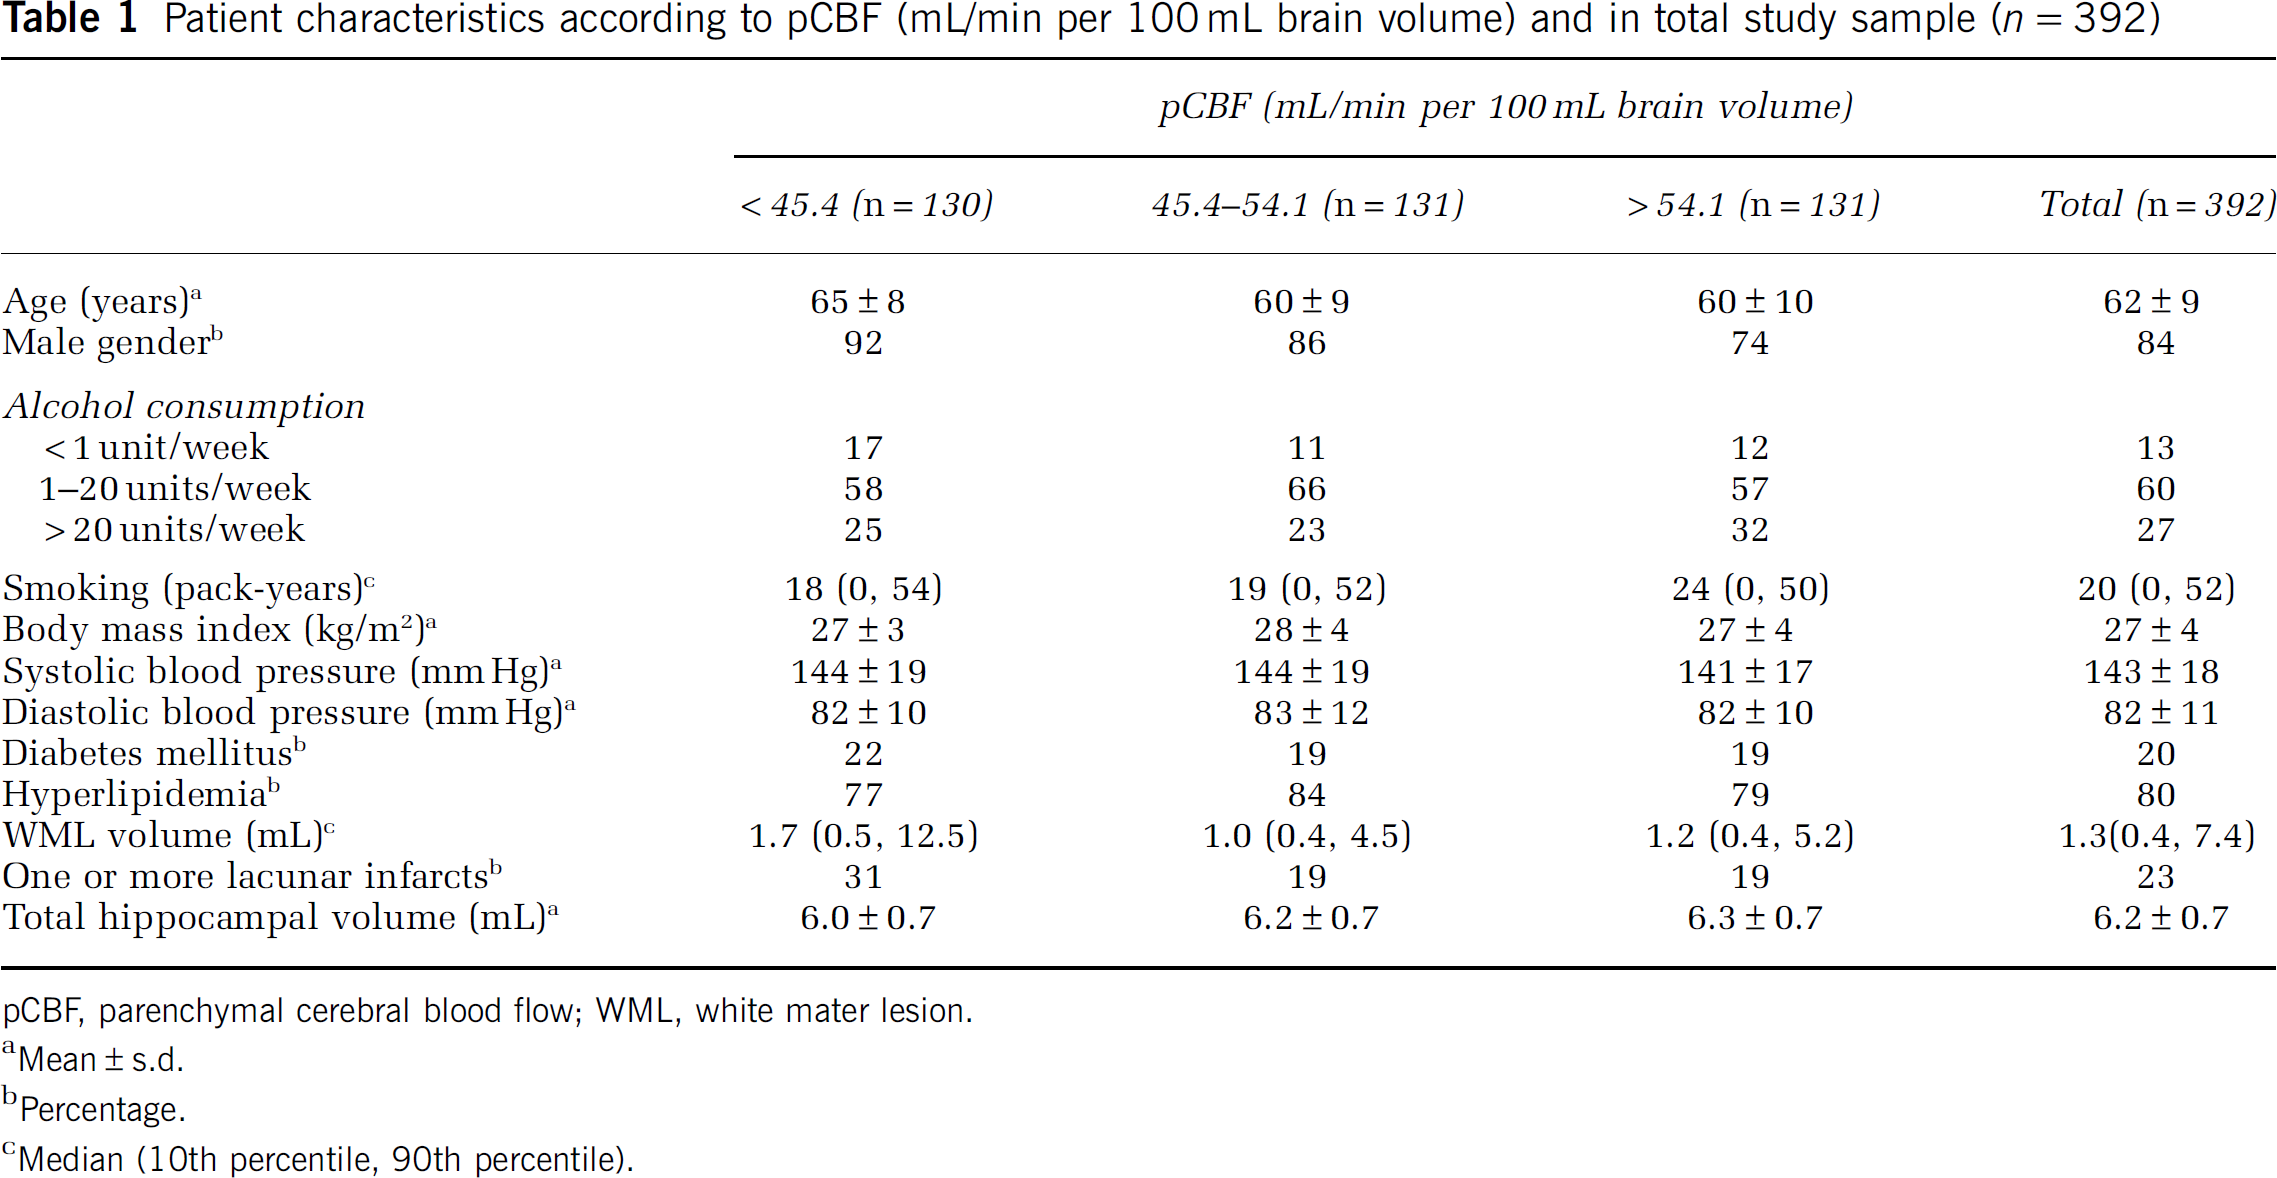
pCBF, parenchymal cerebral blood flow; WML, white mater lesion.
Mean±s.d.
Percentage.
Median (10th percentile, 90th percentile).
Table 2 presents the regression coefficients and 95% CIs of the linear regression analysis with hippocampal volume as a dependent variable and pCBF, measured continuously, as an independent variable. With higher pCBF, the hippocampal volume increased (β=0.08; 95% CI: 0.01 to 0.14). However, after adjustments were made for age and sex, there was no significant association between pCBF and hippocampal volume (β=0.02; 95% CI: −0.05 to 0.09). Additional adjustment for the use of alcohol, smoking, hyperlipidemia, diabetes mellitus, blood pressure, body mass index, lacunar infarcts, and WMLs attenuated the association further (β=0.01; 95% CI: −0.06 to 0.08). When we added the interaction between pCBF and WML to examine whether the association between pCBF and hippocampal volume was modified by WML, no significant interaction between pCBF and WML was found (interaction term P=0.84). Furthermore, there was no significant interaction between pCBF and age (P=0.38), indicating that the association between pCBF and hippocampal volume did not become stronger with increasing age.
Results of the linear regression analysis of the association between pCBF (s.d., 11.2 mL/min per 100 mL increase) as independent variable and hippocampal volume as dependent variable (n=392)
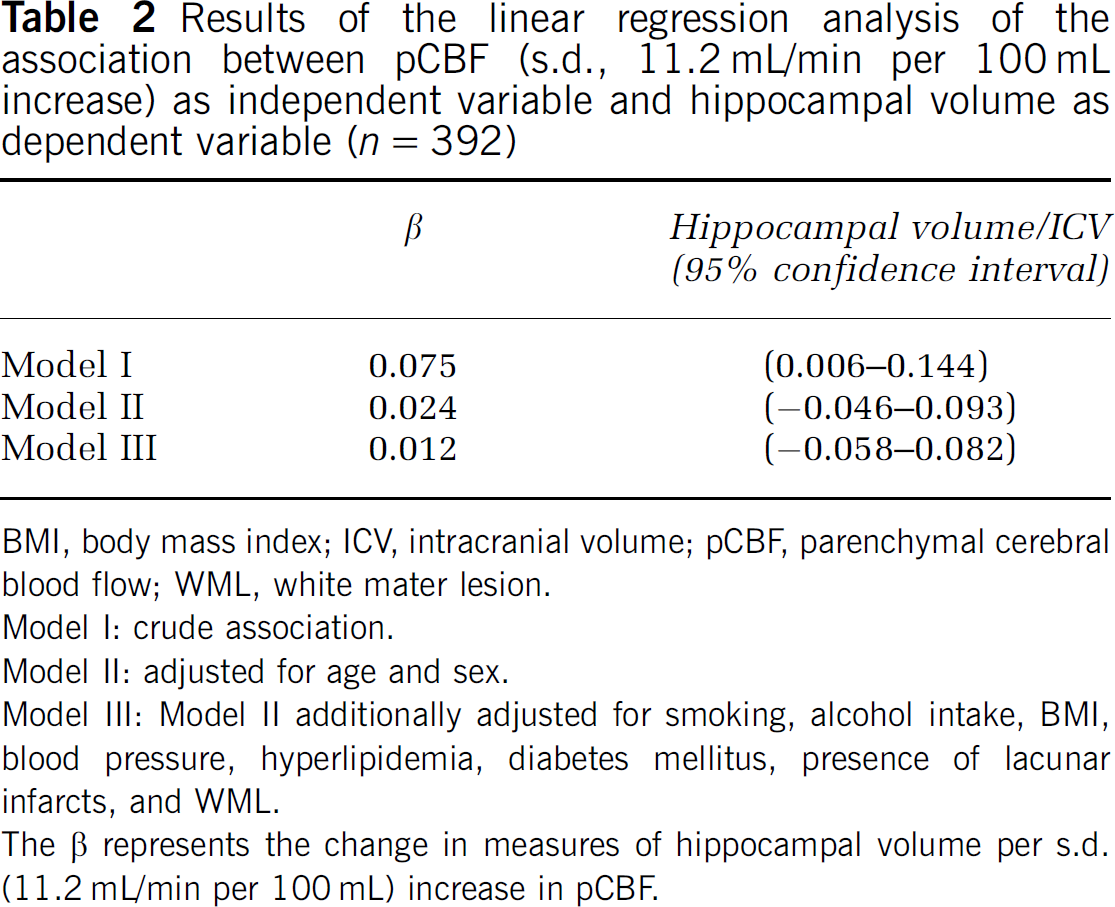
BMI, body mass index; ICV, intracranial volume; pCBF, parenchymal cerebral blood flow; WML, white mater lesion.
Model I: crude association.
Model II: adjusted for age and sex.
Model III: Model II additionally adjusted for smoking, alcohol intake, BMI, blood pressure, hyperlipidemia, diabetes mellitus, presence of lacunar infarcts, and WML.
The β represents the change in measures of hippocampal volume per s.d. (11.2 mL/min per 100 mL) increase in pCBF.
Finally, we repeated the analyses excluding all patients (n=82) with nonlacunar cerebral infarcts, but the results did not change materially (data not shown).
Discussion
We observed that, in a large population of patients with arterial disease, pCBF was not associated with hippocampal volume after adjustments were made for age, sex, and other potential confounders. Furthermore, WMLs did not modify the relationship between pCBF and hippocampal volume.
Previous phase-contrast studies have shown that lower tCBF is related to poorer cognition and dementia (Spilt et al, 2005; Rabbitt et al, 2006). To our knowledge, only one study has examined the association between CBF and hippocampal volumes (Ruitenberg et al, 2005). This study reported that higher CBF velocity, measured with transcranial Doppler ultrasonography, was related to larger hippocampal and amygdalar volumes. However, these studies did not adjust CBF for brain volume to correct for differences in brain size between patients. Cerebral blood flow regulates the oxygen and nutritional demand of the brain, and an explanation for these findings may thus be that smaller brain volumes have less metabolic demand, which results in diminished tCBF (Strandgaard, 1991; Vernooij et al, 2008). Therefore, as a part of the differences in tCBF can be attributed to individual differences in brain size, it is important to adjust for brain volumes by dividing the tCBF by the total brain parenchymal volume. We did not find any association between reduced pCBF, expressed as tCBF per 100 mL parenchymal volume, and hippocampal volume, indicating that the differences in hippocampal volume cannot be explained by reductions in CBF. Furthermore, as hippocampal atrophy is considered to be an early marker of dementia (Convit et al, 1997), our findings do not support the notion that a reduction in tCBF may contribute to the development of dementia (de la Torre, 2000).
In a recent study by our group (Appelman et al, 2008), the pCBF was associated with a loss of subcortical white matter. Previous studies have shown that cerebral white matter is more vulnerable to cerebral ischemia than gray matter (Pantoni and Garcia, 1997). The cerebral white matter is supplied by long medullary penetrating arteries, which divide into short branches that supply the deep white matter. The periventricular white matter is supplied by perforating branches of the medial cerebral artery.
With the exception of severe ischemic conditions such as those observed in patients with Moyamoya disease, anastomoses between the deep perforating arteries and those of the medullary arterioles are either scarce or absent, making the white matter an arterial border zone and particularly susceptible to injury caused by a decrease in CBF (Pantoni and Garcia, 1997). The results of this study show that hippocampal atrophy was not associated with pCBF. An explanation for this difference could be the fact that the hippocampus is part of the subcortical gray matter and is primarily supplied by short branches that originate directly from the posterior cerebral artery, and may therefore be less susceptible to changes in CBF. In line with our findings are the results of a recent population-based study that showed that the relationship between tCBF and cognition was dependent on brain volume, and that after correction for brain volume the association between cognitive functioning and tCBF disappeared (Poels et al, 2008).
White matter lesions are associated with its inability to autoregulate CBF. This inability to maintain adequate cerebral perfusion may lead to hypoxia (Marstrand et al, 2002). As it has been suggested that the hippocampus in particular is vulnerable to chronic cerebral hypoperfusion, we examined whether a relationship between pCBF and hippocampal volume was more pronounced in patients with more WMLs. However, we did not find an interaction between pCBF and WMLs on hippocampal volume.
This study has several strengths. First, we examined a large number of patients with arterial disease, a group of individuals particularly at risk for cerebral small vessel disease and brain atrophy. The large number of patients included in the study made precise estimates possible. Second, we assessed hippocampal volumes manually with high interrater and intrarater agreement and we used a rater-independent automated probabilistic segmentation technique to accurately quantify the volumes of WML, brain tissue, and ICV (Anbeek et al, 2005). Third, two-dimensional phase-contrast MRI angiography is a fast and noninvasive and reproducible technique to measure tCBF (Spilt et al, 2002). It is, therefore, in contrast to invasive and relatively expensive methods that are used to measure brain perfusion, a feasible method to use in large epidemiologic studies. Fourth, we expressed CBF relative to total brain volume to correct for individual differences in brain metabolic demand.
A limitation of our study is that we assessed blood flow in total brain tissue, and therefore we do not know whether the pCBF directly reflects CBF in the hippocampus. Therefore, we cannot exclude the possibility that regional differences in the flow are related to volume loss in the hippocampus. For several studies, in which positron emission tomography or single photon emission computed tomography was used to determine regional blood flow, lower regional blood flow in the hippocampus was found in patients with Alzheimer's, a disease in which hippocampal atrophy is a key feature, compared with controls (Donnemiller et al., 1997; Bonte et al, 2001; Trollor et al, 2005). Moreover, we did not measure PaCO2 during investigation in this study. The pCBF may change with changes in CO2, and this reactivity may be influenced by atherosclerosis or may indicate cerebral small vessel disease (Terborg et al, 2000). However, although our patients were included in the SMART study after referral to the University Medical Center Utrecht with coronary artery disease, cerebrovascular disease, peripheral disease, or abdominal aortic aneurysm, they are all treated in an outpatient setting and were generally in good condition. During the investigation, the participants were at rest and no hypercapnia or hypocapnia was induced with the administration of CO2 or hyperventilation. Therefore, it is likely that the PaCO2 values were within normal range during the investigation. Furthermore, our study was carried out in patients with arterial disease. Although this population may be at high risk of cerebral small vessel disease and brain atrophy (de la Torre, 2002), the study population was relatively young with a mean age of 62 years. Therefore, it is possible that hippocampal volume loss is still in its early phase, making it more difficult to find a significant association. However, we observed no interaction between age and pCBF, indicating that the association between pCBF and hippocampal volume did not change with age.
In conclusion, we found no evidence of the fact that lower parenchymal blood flow contributes to neurodegeneration of the hippocampus in a population of patients with arterial disease. Future studies should evaluate whether regional hypoperfusion contributes to hippocampal volume loss.
Footnotes
The authors declare no conflict of interest.