
Abstract
Evolution of the neurochemical profile consisting of 19 metabolites after 30 mins of middle cerebral artery occlusion was longitudinally assessed at 3, 8 and 24 h in 6 to 8 µL volumes in the striatum using localized 1H-magnetic resonance spectroscopy at 14.1 T. Profound changes were detected as early as 3 h after ischemia, which include elevated lactate levels in the presence of significant glucose concentrations, decreases in glutamate and a transient twofold glutamine increase, likely to be linked to the excitotoxic release of glutamate and conversion into glial glutamine. Interestingly, decreases in N-acetyl-aspartate (NAA), as well as in taurine, exceeded those in neuronal glutamate, suggesting that the putative neuronal marker NAA is rather a sensitive marker of neuronal viability. With further ischemia evolution, additional, more profound concentration decreases were detected, reflecting a disruption of cellular functions. We conclude that early changes in markers of energy metabolism, glutamate excitotoxicity and neuronal viability can be detected with high precision noninvasively in mice after stroke. Such investigations should lead to a better understanding and insight into the sequential early changes in the brain parenchyma after ischemia, which could be used for identifying new targets for neuroprotection.
Keywords
Introduction
Experimental models of ischemia help advance the understanding of the pathobiology of cerebral ischemia and thus may lead to the identification of potential therapeutic targets for neuroprotection. In stroke patients, magnetic resonance (MR) techniques, mostly MR imaging (MRI) applications, play a central role in diagnosis, monitoring the lesion progression and the outcome after therapeutic interventions. Perfusion- and diffusion-weighted MRIs are used for diagnosis in the acute phase, followed by T2-weighted images to locate the lesion and the associated edema at later time points (Weber et al, 2006; and references therein). Magnetic resonance spectroscopy (MRS) provides powerful applications, such as MRS imaging (MRSI) for tissue characterization (Weber et al, 2006; and references therein). Although diffusion MRI is widely used in the clinical setting, understanding the neurochemical profile of ischemic brain injury can shed light on important mechanisms and on the evolution of ischemic lesions and thus provide insights into processes linked to glutamatergic excitotoxicity and neuronal damage in experimental animal models (Coon et al, 2006). Moreover, MRS has capabilities of assessing information other than water in tissue, for example, 1H-MRS of metabolites using their specific protons (Berkelbach van der Sprenkel et al, 1988), 31P-MRS of energy phosphate metabolism (Kozlowski et al, 1997) or 13C-MRS of metabolic alterations (van der Zijden et al, 2008).
In vivo MRS studies of ischemia, especially 1H-MRS, have been limited so far to a few compounds, mainly lactate (Lac), total creatine (phosphocreatine + creatine, PCr +Cr), total choline (glycerophosphocholine + phosphocholine, GPC + PCho) and total N-acetyl-aspartate (N-acetyl-aspartate +N-acetyl-aspartyl-glutamate, NAA+ NAAG) in animal models (Coon et al, 2006; Hesselbarth et al, 1998; Igarashi et al, 2001; Kuhmonen et al, 1994; Malisza et al, 1998) and to a certain extent in humans (Cheong et al, 2006; Nitkunan et al, 2006). This could be explained by the variability of most ischemic models and further compounded by limitations in the MR methodology, notably the use of lower magnetic field strengths. With improved MR techniques, more than 18 metabolites, termed ‘the neurochemical profile’, have been identified in rats (Rao et al, 2007), including the neuronal marker NAA (Clark, 1998); some mostly cell-specific metabolites, such as glutamine (Gln) and glutamate (Glu), are present mainly in astrocytes and neurons, respectively (Ottersen et al, 1992; Torp et al, 1991); the osmoregulator taurine (Tau) (Ottersen et al, 1992; Torp et al, 1991); and energy substrates, such as glucose (Glc) and Lac. Although the neurochemical profile has been analyzed in a transgenic mouse model of Huntington's disease (Tkáč et al, 2007), to our knowledge the neurochemical profile of cerebral ischemia has not been studied in mice, possibly due to the combination of technical challenges inherent in their small size and in the spatial resolution of the available MR equipment.
Therefore, the aim of this study was to establish reliable and precise hallmarks of early metabolic changes after ischemia. Metabolic changes were characterized using a horizontal bore 14.1-T MR system in a mouse model of transient cerebral ischemia, which induces highly reproducible striatal lesions. We expect that this study will lay the foundation for a description of the cellular biologic status, thereby providing an additional ‘fingerprint’ of disease progression, which can be monitored for diagnosis and to determine the effects of specific treatments, for example, preconditioning and neuroprotectants.
Materials and methods
Animal Protocols
All experiments were approved by the local authority. In this study, a transient 30-mins of MCAO was chosen for the consistent lesion in the striatum 1 day after ischemia (preliminary data not shown). Briefly, 11 male ICR-CD1 mice (24±3 g, Charles River, L'Arbresle, France) were anesthetized and maintained below 1.5% to 2% isoflurane in 30% oxygen and 70% nitrous oxide using a face mask. At 0 h, ischemia was induced by inserting an 11-mm silicone-coated 8–0 filament through the left common carotid artery into the internal carotid artery (Wiegler et al, 2008; and references therein). The filament was withdrawn after 30 mins allowing reperfusion. Regional cerebral blood flow (rCBF) was measured by laser-Doppler flowmetry (Periflux 5000, Perimed, Sweden) with a flexible probe fixed on the skull, 1mm posteriorly and 6mm laterally from the bregma. Throughout the entire operation, rCBF was monitored and maintained within the target range of 18%±3.5% of the baseline level during ischemia and 74%±8.5% of the baseline after reperfusion. On average, 30% of the operated animals did not fulfill the inclusion criteria (cerebral blood flow below 20% during ischemia and above 50% after reperfusion) and were immediately discarded from the study. Throughout surgery and until awaking, the rectal temperature was maintained at 37°C±0.5°C with a temperature control unit (FHC Inc., Bowdoinham, ME, USA).
Mice were given 0.025 mg/kg of buprenorphine subcutaneously for analgesia at the end of the operation. Once animals were awake, they were housed in an incubator at 31°C. Thereafter, the animals underwent longitudinal MR studies. More specifically, studies at 3 and 8 h after ischemia were chosen with regard to the therapeutic window, in this model, of D-JNKI-1, a neuroprotective JNK-inhibiting peptide (Borsello et al, 2003), and studies at 24 h after ischemia were performed for lesion identification. In addition, nine mice (26 to 37 g) were measured and served as the healthy control group. To evaluate the effects of repeated bouts of isoflurane esthesia (owing to the repeated MR measurements) on the development of the striatal lesions (Sicard et al, 2003), five mice (22 to 33 g) underwent the same MCAO protocol, with no further MR measurements or isoflurane administration.
Magnetic Resonance Instruments
Magnetic resonance studies were carried out in a horizontal, 14.1-T/26-cm magnet (Magnex Scientific, Abingdon, UK), with a 12-cm inner-diameter gradient (400mT/m in 200 µsecs, minimized eddy currents), interfaced with a DirectDrive console (Varian Inc., Palo Alto, CA, USA). A home-built quadrature surface coil with two geometrically decoupled single-turn loops (12-mm inner diameter), resonating at 600MHz radio frequency, was used for radio frequency transmission and reception at 14.1 T.
In Vivo Magnetic Resonance Imaging/Magnetic Resonance Spectroscopy of the Ischemic Brain
For the MR studies, animals were maintained anesthetized with 1% to 2% isoflurane mixed with O2 and placed stereotaxically into the isocenter of the magnet with two ear pieces and a bite piece in a holder (RAPID Biomedical GmbH, Rimpar, Germany). Throughout the entire experiment, the animal was simultaneously monitored for breathing and temperature through a MR-compatible monitor system (Model 1025, SA Instruments Inc., Stony Brook, NY, USA), and rectal temperature was maintained at approximately 37.0°C by circulating warm water.
Briefly, multislice T2-weighted images were acquired using the fast spin-echo technique (Hennig, 1988), with effective echo time TEeff = 50 msecs and repetition time TR = 6,000 msecs to evaluate the evolution of the ischemic lesion and locate the volume of interest (VOI), in the left striatum. Thereafter, all first- and second-order shim terms over the VOI were altered accordingly using the echoplanar version of FASTMAP (Mlynárik et al, 2006; and references therein) and resulted in a line width of water within 30 Hz for 6 to 8 µL volumes. Localized 1H-MR spectra were obtained using the SPECIAL technique, TE/TR = 2.8/4,000 msecs and 320 averages in combination with outer volume suppression and VAPOR water suppression (Mlynárik et al, 2006; and references therein).
Determination of Ischemic Lesion Volumes
Animals were killed at either 30 or 48 h after the onset of focal ischemia, and 20-µm-thick, 720 µm distant, coronal cryostat sections were stained with cresyl violet for histologic determination of the lesion size. A digitalized image of the Nissl-stained tissue was obtained under a light stereomicroscope (Leica MZ16FA). The lesion area was determined using ImageJ software (NIH, http://rsb.info.nih.gov/ij/) on both Nissl-stained sections and MRI images. The infarct volume was calculated by multiplying the sum of the infarct areas on each section by the spacing distance. Brain swelling was estimated as % (swelling) in Equation (1) either on the same images or on MRI images, as described earlier (Gartshore et al, 1997),
where Area is the surface area of the specified region, indicated by the corresponding subscript.
Quantification and Statistics
The in vivo 1H-MR spectra obtained from each study were processed as in Tkáč I et al (2007), frequency drift-corrected, summed and eddy-current compensated using the water signal from the same VOI. Thereafter, the absolute quantification was obtained using a linear combination analysis method, LCModel assuming 80% brain water content (Tkáč et al, 2007; and references therein), which has been reported to vary minimally after transient ischemia in rodents (Bentue-Ferrer et al, 1986; Mdzinarishvili et al, 2007; Taniguchi et al, 2007). In this study, all metabolites except macromolecules (Mac) in the basic set of the LCModel were simulated (Mlynarik et al, 2008), that is alanine (Ala), ascorbate (Asc), aspartate (Asp), Cr, myo-inositol (myo-Ins), γ-aminobutryric acid (GABA), Glc, Gln, Glu, glycine (Gly), GPC, glutathione (GSH), Lac, NAA, NAAG, PCho, PCr, phosphatylethanolamine (PE), scyllo-inositol (scyllo), and Tau. The spectrum of Mac was measured in vivo using the inversion recovery technique with further postprocessing, as described earlier (Mlynarik et al, 2008; and references therein). Most of the metabolites were quantified with Cramer–Rao lower bounds (CRLB) > 35%, which correspond to errors in metabolite concentrations of > 0.5 µmol/g (Tkáč et al, 2007). Summed concentrations (Glu +Gln, PCr+ Cr, GPC+ PCho and NAA+NAAG) and concentration ratios (Gln/Glu and PCr/Cr) were calculated. As GPC+ Cho has been found to be reduced after ischemia (Kuhmonen et al, 1994) and not all PCho and GPC could be quantified reliably with satisfactory CRLB (Tkáč et al, 2007), only the sum of GPC+ PCho was evaluated. The percentage changes were calculated compared with healthy control values obtained in the same study.
All data were presented as mean±s.d., except when otherwise specified. Significance was set as P > 0.05 using unpaired two-tailed Student's t-test.
Results
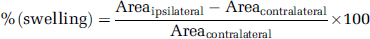
In this study, a 30-min transient ischemia resulted in very reproducible ischemic lesions 1 day after ischemia located in the ipsilateral striatum (in only two mice there was additional cortical involvement), which was detected by both MR images and histologic determinations (Figure 1). T2-weighted images showed no observable lesion at 3 h after ischemia onset (Figure 1B), slight and variable T2-contrast at 8 h (Figure 1C) and more profound lesions at 24 h (Figure 1D). The striatal lesion size measured at 24 h by MRI (18.2±2.5mm3) was in excellent agreement with the corresponding Nissl staining at 30 h (16.5±9.3mm3, Figure 1E) and at 48 h (20.1±5.2mm3). All striatal lesions at 24 h were larger than the VOIs (6 to 8 µL) of all the acquired spectra. To rule out a possible effect of isoflurane used during NMR measurements on lesion size, five mice underwent the same MCAO without further anesthesia and were killed at 48 h. The lesion size of this group was 18.7±3.2mm3 and was not different from the lesions that were measured in the mice that underwent the MR measurements (P = 0.61).
T2-weighted images of a control mouse (
Brain swelling assessed using Equation (1) correlated well with the published observations (de Castro Ribeiro et al, 2006), showing a first peak of swelling directly after ischemia slightly visible at 3 h (2.4%±1.9%) and a second peak beginning at 30 h (4.5%±1.5%) and increasing until 48 h (11.4%± 4.2%). There was no swelling in the period between the two peaks (–0.5%±1.1% at 8 h and 0%±1.6% at 24 h), indicating that our metabolite measurements were not biased by variable water content due to edema.
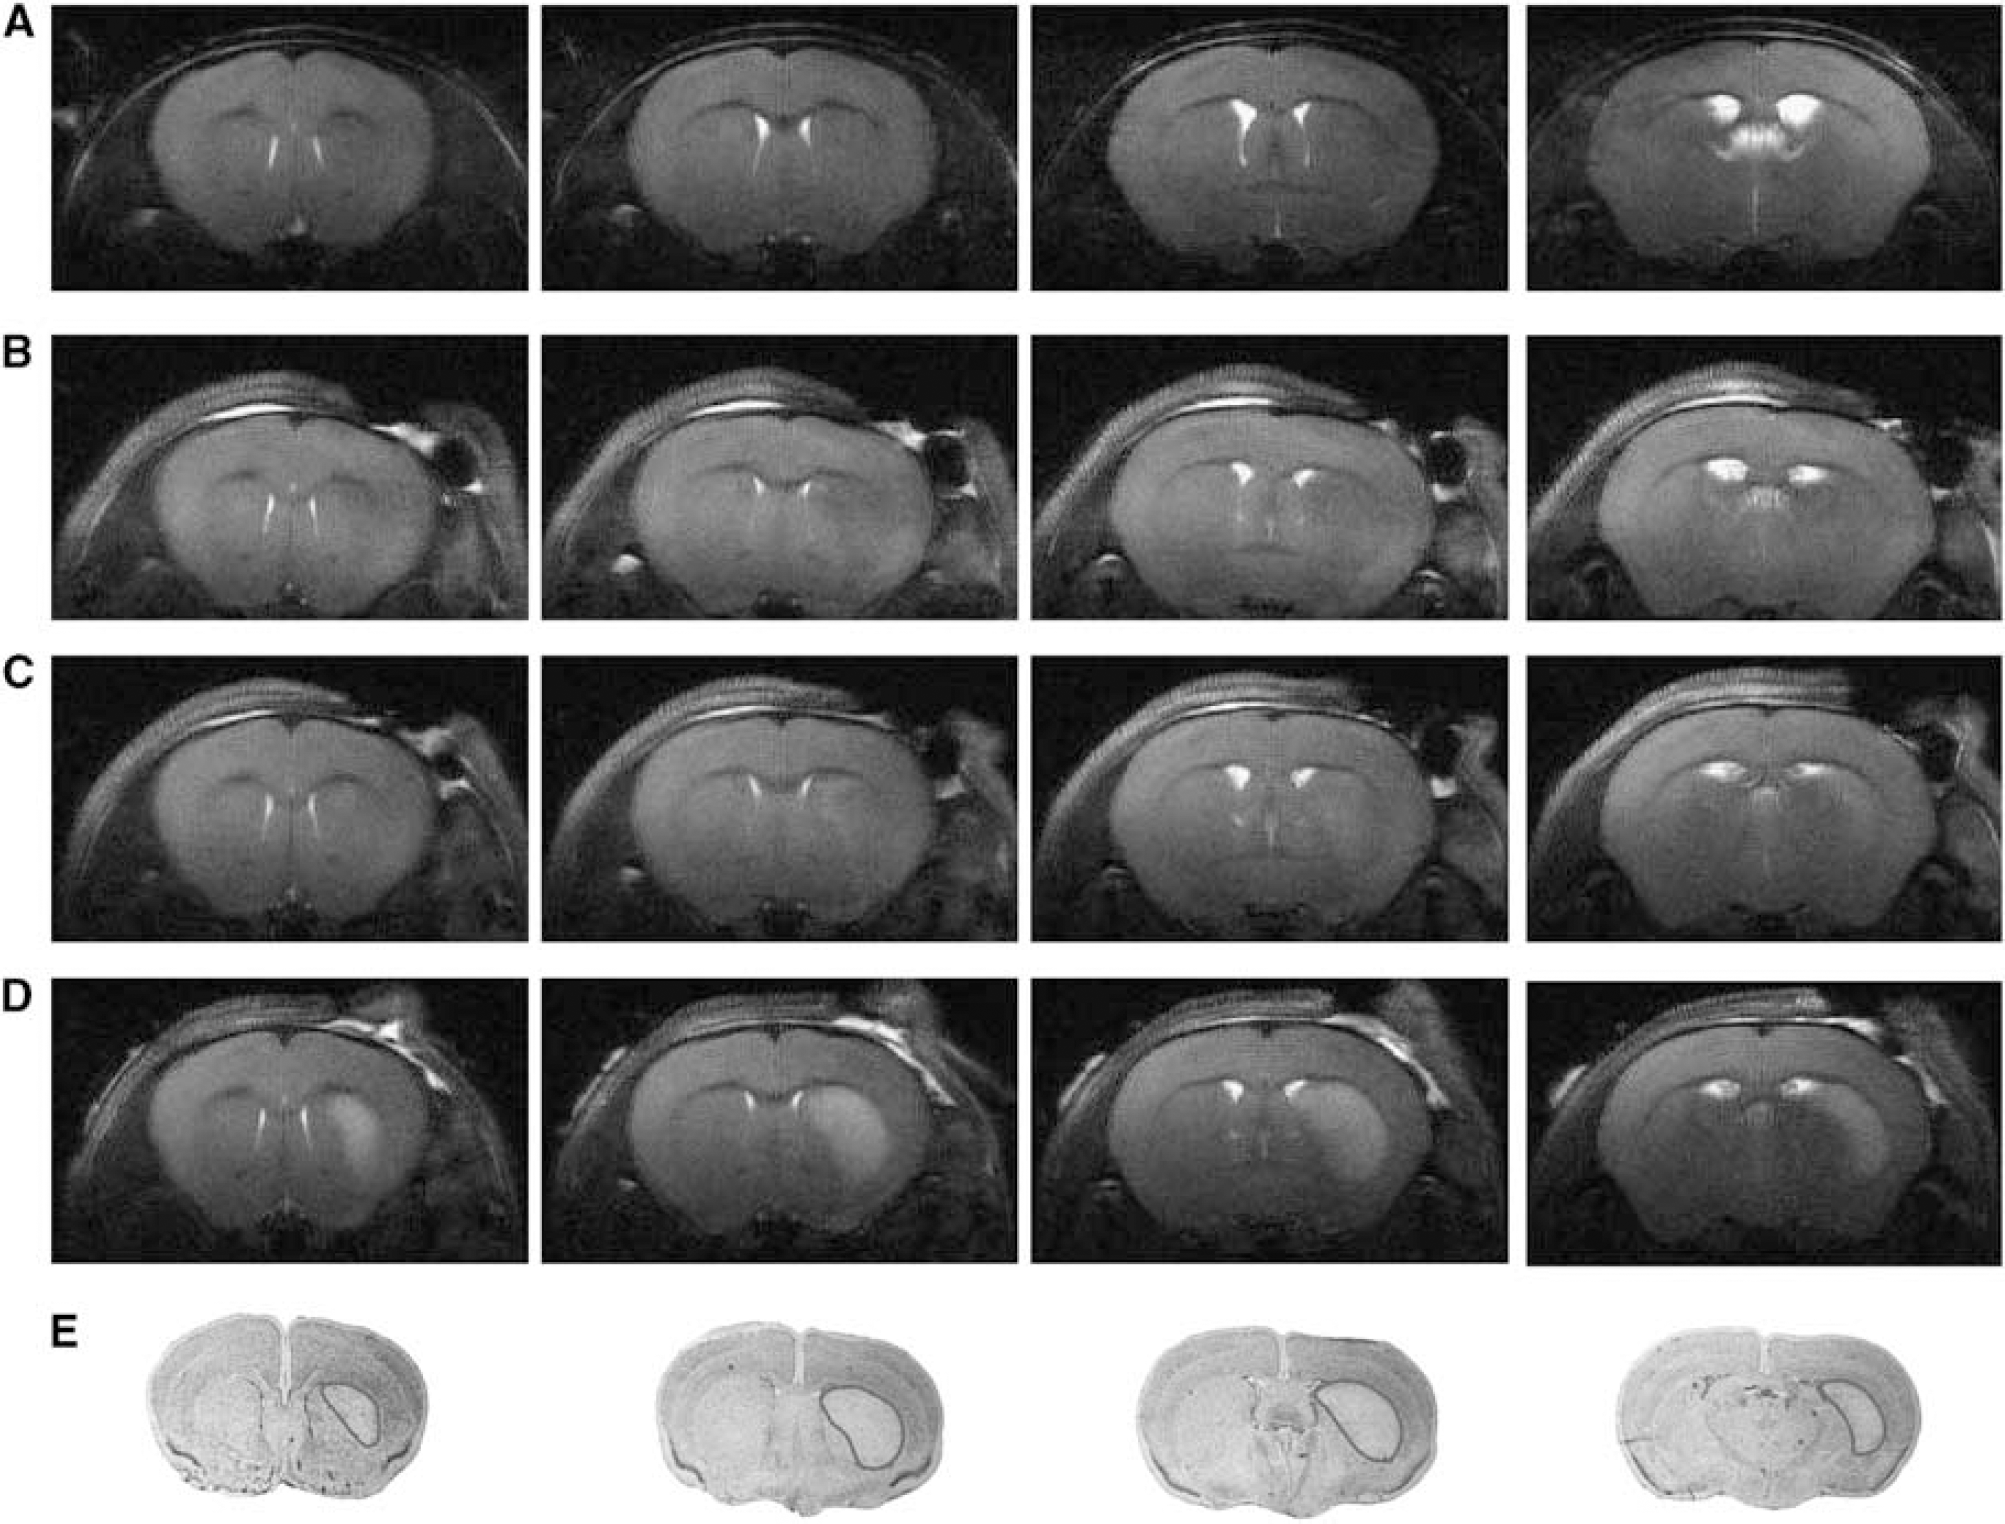
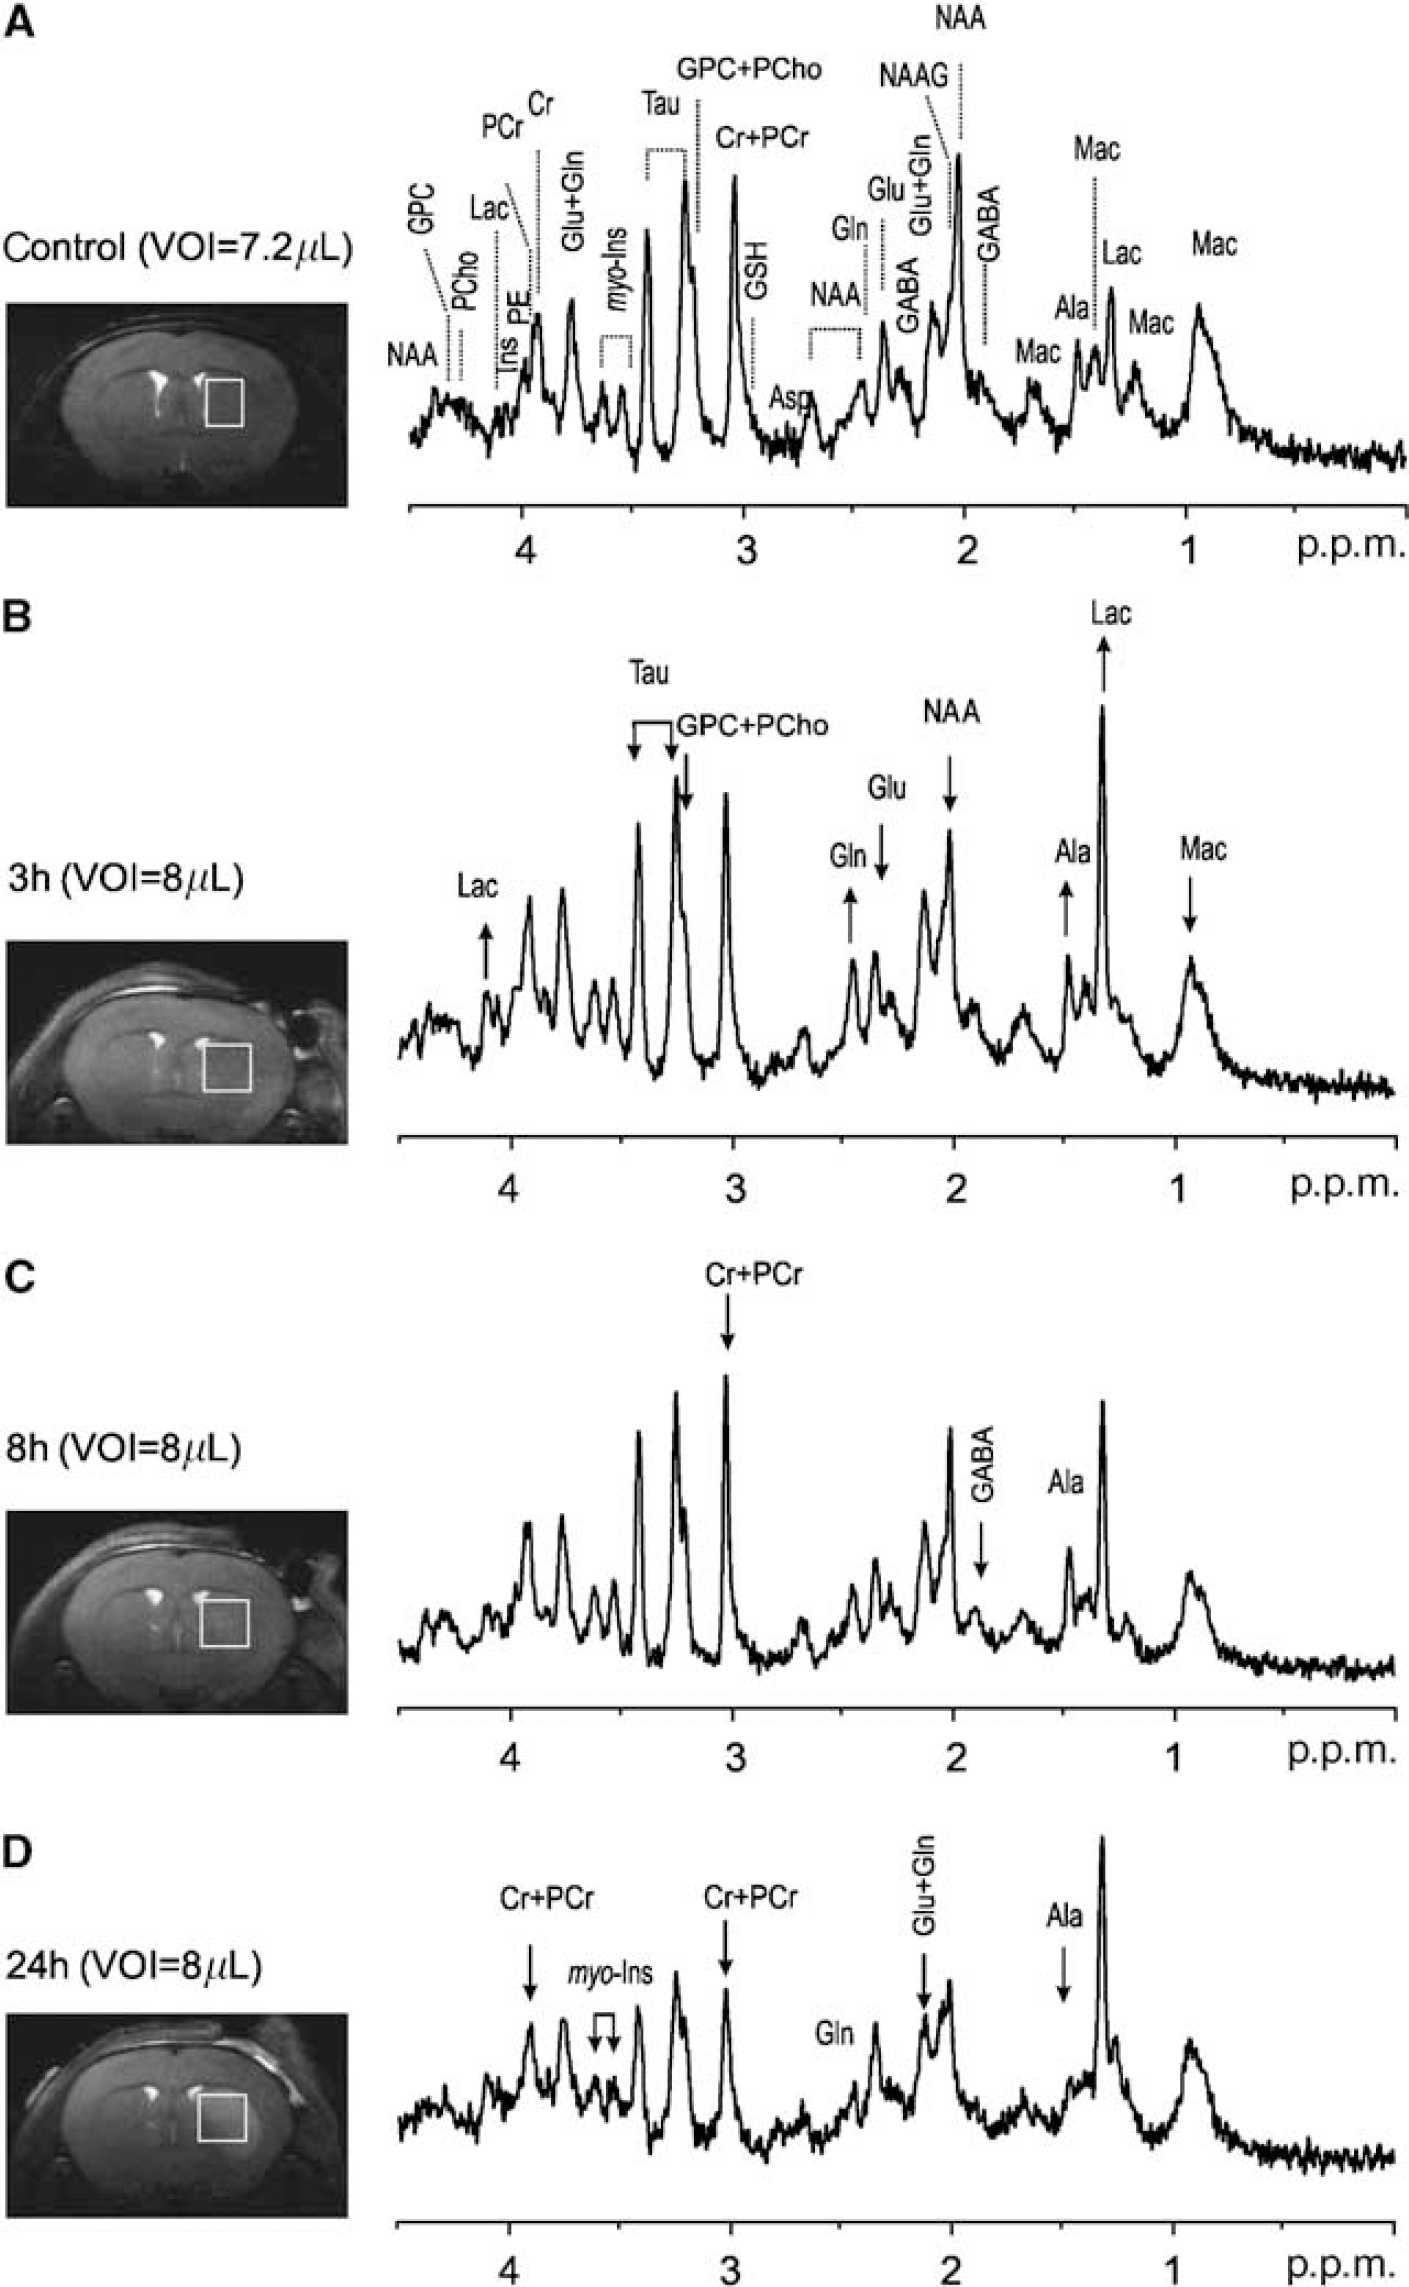
Localized 1H-MR spectra acquired from the striatum (a typical example is shown in Figure 2) presented excellent line widths (12 to 28 Hz), water suppression and high signal-to-noise ratios (12±3), which are prerequisites for robust metabolic concentration determinations. At 14.1 T, additional resolved signals, ascribed to Ala, GPC, GABA, glycine, NAAG and PCho (Mlynarik et al, 2008), were clearly detected (Figure 2A). Therefore, a neurochemical profile of 21 metabolites, including NAAG (0.58±0.12 micromole/g), PCho (0.45±0.12 micromole/g) and scyllo (0.20±0.06 micromole/g), could be routinely quantified in healthy mouse striatum, with CRLB mostly within 35% (Table 1). This high-quality neurochemical profile obtained at 14.1 T allowed the precise quantification of low-concentration metabolites.
Time course of glial activation in CA1 hippocampus after ischemia. (
Neurochemical profiles in the striatum of healthy mice, and after 30 min of transient ischemia
Ala, alanine; Asc, ascorbate; Asp, aspartate; Cr, creatine; myo-Ins, myo-inositol; GABA, γ-aminobutryric acid; Glc, glucose; Gln, glutamine; Glu, glutamate; Gly, glycine; GPC, glycerophosphocholine; GSH, glutathione; Lac, lactate; Mac, macromolecule; NAA, N-acetyl-aspartate, NAAG, N-acetyl-aspartyl-glutamate; PCho, phosphocholine; PCr, phosphocreatine; PE, phosphatylethanolamine; Tau, taurine.
All concentrations, except ratios, are in µmol/g. Number of animals is indicated in parentheses. Superscripts indicate a lower number of data points, as measurements with CRLB>50% were excluded from the analysis.
Noticeable changes were already apparent in the spectra obtained 3 h after ischemia, such as the clear reduction in NAA and Glu concentrations and the increase in Lac and Gln concentrations, as illustrated in the example in Figure 2B. At later time points, additional metabolite reductions were readily observed in the spectra, such as in GABA at 8 h (Figure 2C), and Ala and myo-Ins at 24 h (Figure 2D). Lactate concentration remained highly elevated in all ischemic mice at all time points.
Quantitative analysis confirmed the visually apparent changes (see above) and additional changes were detected in the neurochemical profile (Table 1). With ischemia evolution, these changes became increasingly significant and involved an increasing number of metabolites, which are summarized in Table 2. For example, the decrease in Tau and GSH concentrations became more severe at 8 h compared with that at 3 h (Table 2). At 24 h, most metabolites were significantly reduced compared with controls, with the notable exception of aspartate, Glc, Gln, Lac and NAAG (Table 1). It is interesting to note that Glc was consistently detected even in the presence of elevated Lac concentration.
Summary of observed postischemic changes in metabolites
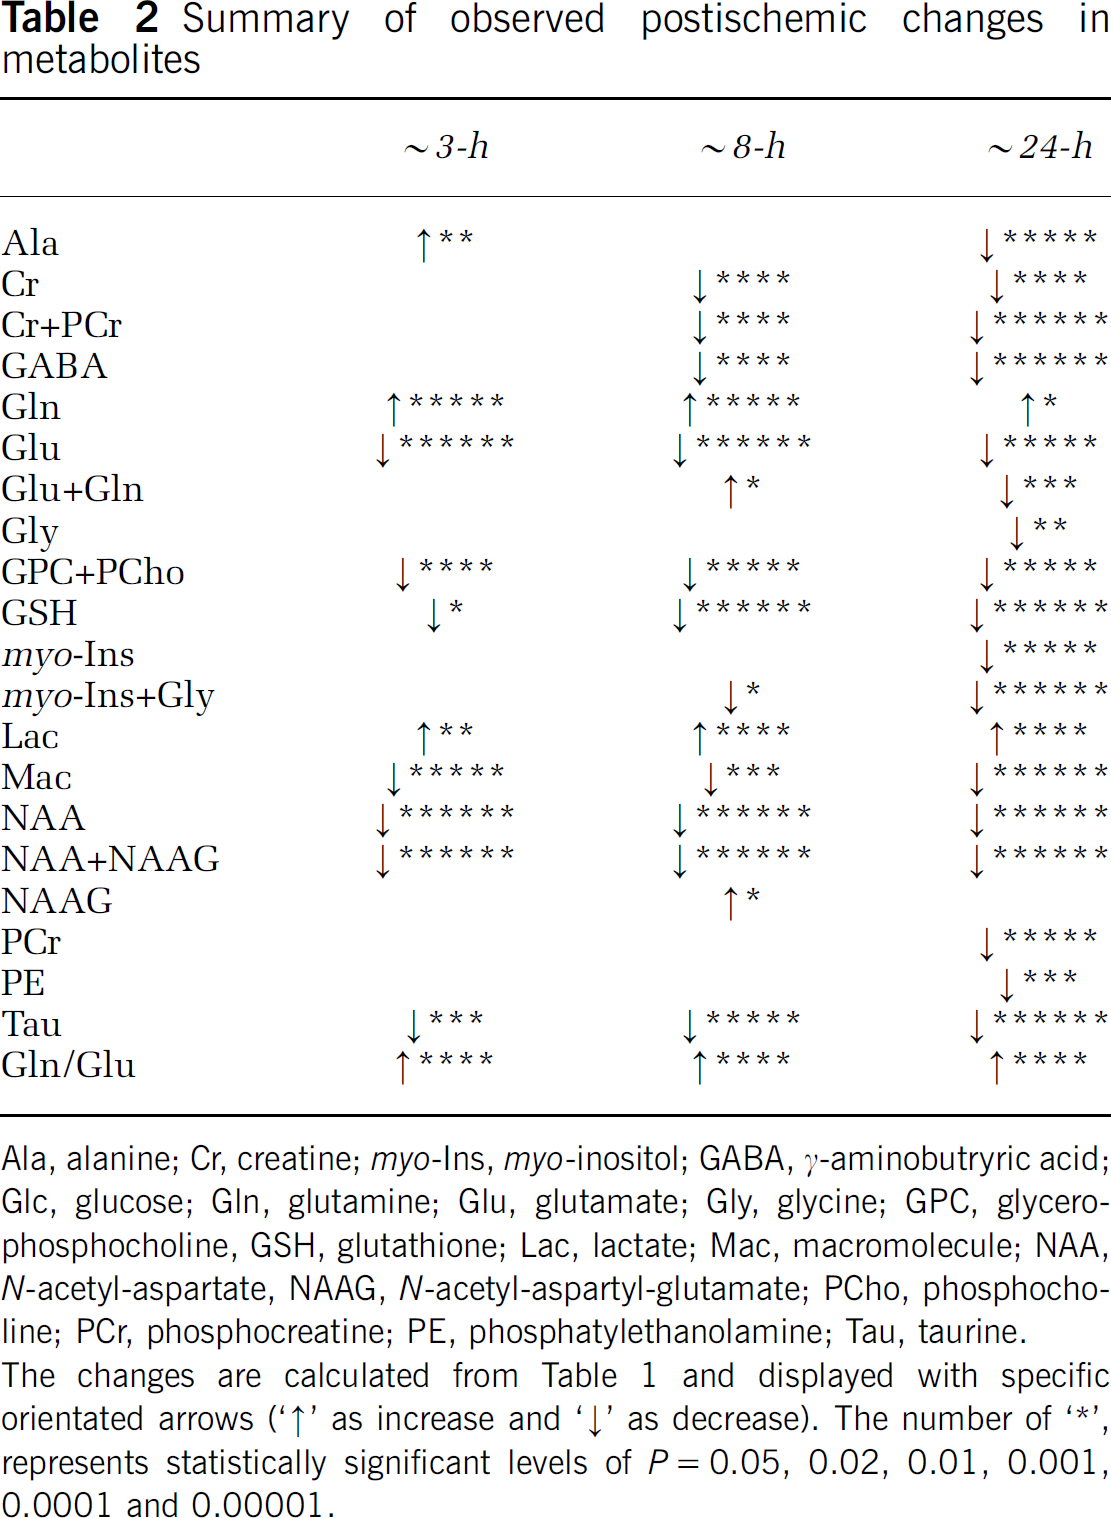
Ala, alanine; Cr, creatine; myo-Ins, myo-inositol; GABA, γ-aminobutryric acid; Glc, glucose; Gln, glutamine; Glu, glutamate; Gly, glycine; GPC, glycerophosphocholine, GSH, glutathione; Lac, lactate; Mac, macromolecule; NAA, N-acetyl-aspartate, NAAG, N-acetyl-aspartyl-glutamate; PCho, phosphocholine; PCr, phosphocreatine; PE, phosphatylethanolamine; Tau, taurine.
The changes are calculated from Table 1 and displayed with specific orientated arrows (’↑’ as increase and ‘↓’ as decrease). The number of ‘*’, represents statistically significant levels of P=0.05, 0.02, 0.01, 0.001, 0.0001 and 0.00001.
In addition, increased Gln and reduced Glu contents at 3 h (Table 1) resulted in an increase in the Gln/Glu ratio (Table 1). At 24 h, the Gln/Glu ratio returned close to normal, whereas the sum of Glu + Gln remained constant within the experimental error (Table 1).
The postischemic evolution differed between metabolites and thus did not correlate with the formation of edema, as shown in Table 2. In particular, three neuron-specific metabolites, NAA, Glu and Tau, were all found to decrease with ischemia evolution. However, although NAA and Tau concentrations kept decreasing until 24 h, Glu concentration stabilized after 3 h (Figure 3).
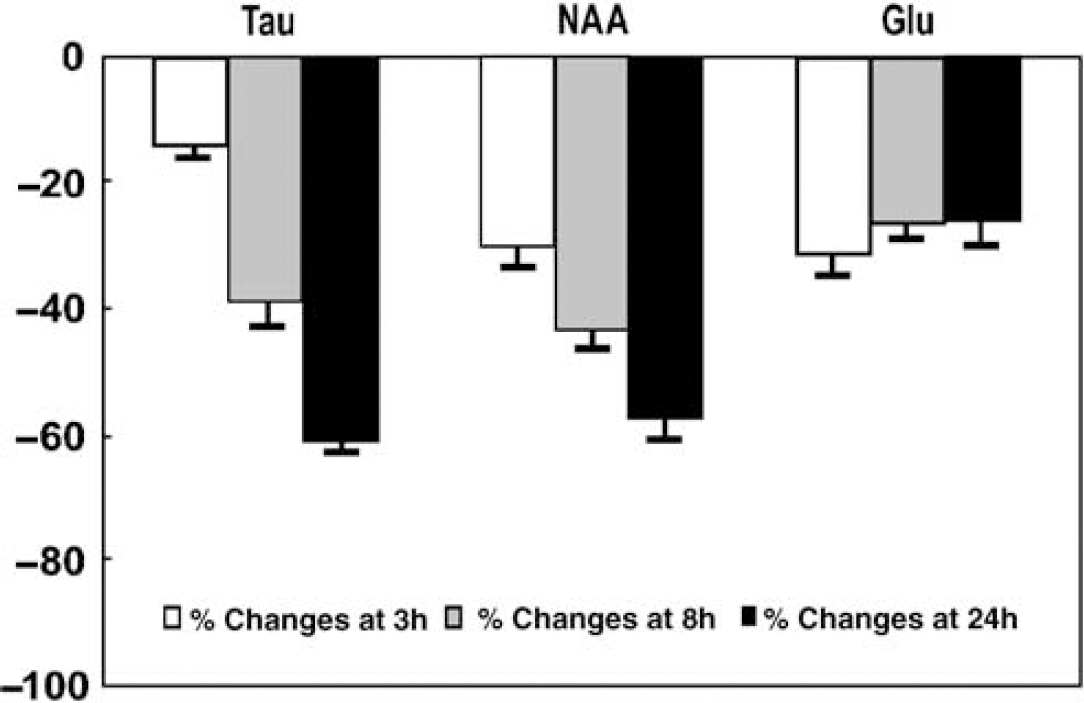
Relative changes in taurine (Tau), N-acetyl-aspartate (NAA) and glutamate (Glu) concentrations after ischemia compared with those in control at 3 h (white bars), 8 h (gray bars) and 24 h (solid black bars). The error bars represent s.e.m.
Discussion
This study describes several early metabolic changes preceding overt changes observed in T2-weighted images. This was possible using a highly reproducible striatal insult combined with very high magnetic field MRS techniques performed at 14.1 T. To date, this is the first in vivo study to measure the postischemic evolution of the neurochemical profile in mice.
In the current MCAO model, the T2-weighted MR images showed highly consistent lesion development in the striatum at 24 h when compared with lesion volume assessed by Nissl staining (Figure 1). Excluding the two animals with cortical involvement did not alter any of the significantly changed metabolite concentrations (i.e., Glu, Gln, Lac, NAA and Tau, see Table 1) by more than 6%, and thus was without significant impact on the conclusions of this study. In the metabolite concentrations described in Table 1, the Mac resonances showed a 20% decrease as early as 3 h after ischemia, which can be interpreted as a loss of cellular mass, assuming that the Mac content that is ascribed to cytosolic proteins (Behar and Ogino, 1993) reflects the cellular mass. The reduction of 20% of Mac would thus imply an increase in the water content from 80% to 84%. As metabolite quantification was performed relative to tissue water, this could lead to a 4% underestimation of the metabolite concentrations. However, we did not detect any macroscopic evidence of brain swelling. Furthermore, major metabolites, such as total Cr + PCr, Glu +Gln and myo-Ins, remained at control levels, which argues against a substantial increase in tissue water. Therefore, the decrease in Mac concentration is more likely to be explained by the degradation of cellular integrity.
Interestingly, prominent and visually apparent changes could be observed in the MR spectra at an early stage before apparent changes were detected by T2-weighted MRI (Figure 2). Most metabolites showed a significant reduction after focal ischemia, except Lac and Gln concentrations, which increased, and Asc, Asp and Glc concentrations, which did not change significantly. The increased Lac, decreased NAA and total GPC + PCho, and a variable response in Ala are in good agreement with the reports (Hesselbarth et al, 1998; Kuhmonen et al, 1994; Brulatout et al, 1996).
More specifically, the increase in Lac concentration as early as 3 h after ischemia and its persistence up to 24 h has already been established in several studies using different ischemia models (Berkelbach van der Sprenkel et al, 1988; Hesselbarth et al, 1998; Thoren et al, 2006; van der Toorn et al, 1994). However, in addition, we found that Lac accumulated in the presence of normal Glc, which suggests that the elevated Lac content is not likely to be due to a persistent oxygen deficiency. The increased Lac may reflect a change in the Lac clearance rate relative to the synthesis rate, possibly mediated by the altered expression of Lac transporters (Kuhr et al, 1988; Walz and Mukerji 1988). The persistence of high Lac levels days after ischemia in stroke patients has been proposed to reflect anerobic glycolysis by macrophages, infiltrating into the brain after ischemia (Lanfermann et al, 1995).
Therefore, this study does not indicate a major energy deficiency after reperfusion, and astrocytes are likely to retain sufficient energy for the uptake of extracellular Glu to convert into Gln, both of which are major steps to sustain Glu/Gln homeostasis in Gln–Glu cycling (Rossi et al, 2007) and require ATP (Laake et al, 1995). Glu released from neurons after ischemia, leading to extracellular accumulation and excitotoxicity (Benveniste et al, 1984), is cleared by the astrocytes and converted into Gln. The profound increase in Gln/Glu with the concomitant constant Gln +Glu suggests that Glu excitotoxicity in reperfusion leads to a transient Gln accumulation in astrocytes.
In normal brain tissue, Glu is mainly located in neurons (Torp et al, 1991). Therefore, given the proposed metabolic shift of Glu to glial Gln (Torp et al, 1991), we would expect a more dramatic decrease in Glu than in the putative neuronal marker NAA (Clark, 1998). When compared with changes in Glu, the reduction of NAA was significantly more pronounced than that of Glu at 8 h and 24 h after ischemia. This is surprising, considering that both Glu and NAA are ascribed to the neuronal compartment and a metabolic conversion of Glu into Gln was likely. Concurrently, Tau, a putative osmotic regulator ascribed mainly to neurons (Nagelhus et al, 1993; Torp et al, 1991), showed a decrease similar to that of NAA (Figure 3). Whether the similarity of the reduction in Tau compared with NAA implies osmoregulatory properties of NAA (Taylor et al, 1995; Tranberg et al, 2007) remains to be determined. Our study suggests that NAA might not just reflect the number of living neurons; rather, gives an indication of the status of these neurons.
Interestingly, the neurochemical profile of the present healthy ICR-CD1 mice (Table 1) showed apparently different metabolic information compared with other strains or species, for example, lower concentrations of Gln, Glu and Lac compared with R6/2 and C57 black mice (Tkáč et al, 2007; and references therein) or higher Lac and Tau concentrations than those of Sprague-Dawley rats (Mlynarik et al, 2008). This suggests that a knowledge of the additional metabolic information attainable as shown in this study likely provides a complementary insight into various stroke models (Bardutzky et al, 2005).
In addition to differences in mouse strains, it is possible that the known neuroprotective effect of isoflurane (Sakai et al, 2007; Sicard et al, 2003) may have mitigated the extent of the striatal lesion. Indeed, when the same person performed the identical MCAO protocol, but under halothane anesthesia, it resulted in larger lesions (data not shown). Although isoflurane is known to be neuroprotective when administered after ischemia (Lee et al, 2008), the short (2 h) MR measurements requiring isoflurane anesthesia did not have a discernible effect on lesion size and extent. It is therefore remarkable that even under conditions that might mitigate lesion development, early neurochemical changes were clearly and consistently discernible and thus are likely to be more pronounced in more severe lesion models.
Thus, it will be of great interest to measure the effect of neuroprotective agents on such early metabolic changes and to extend the current approach to the ischemic penumbra in conjunction with perfusion and diffusion imaging techniques (Shen et al, 2004).
We conclude that after transient ischemia, in the core region of the lesion even if energy metabolism appears close to normal, allowing for the removal of excitotoxic extracellular Glu, Lac accumulation and decreases in 16 metabolites still occur. These early metabolic changes may provide insights into the subsequent tissue damage and provide early markers of lesion evolution. The neurochemical profile can thus serve as the basis for future experiments to evaluate neuroprotection or to find markers of different lesion status in ischemic mice. Moreover, they can be used to point out potential therapeutic targets and for early evaluation of neuroprotective strategies.
Footnotes
Acknowledgements
The authors thank Dr Melanie Price for proofreading the manuscript.
The authors state no conflict of interest.