
Abstract
Cortical spreading depression (CSD) is associated with a dramatic failure of brain ion homeostasis and increased energy metabolism. There is strong clinical and experimental evidence to suggest that CSD is the mechanism of migraine, and involved in progressive neuronal injury in stroke and head trauma. Here we tested the hypothesis that single episodes of CSD induced acute hypoxia, and prolonged impairment of neurovascular and neurometabolic coupling. Cortical spreading depression was induced in rat frontal cortex, whereas cortical electrical activity and local field potentials (LFPs) were recorded by glass microelectrodes, cerebral blood flow (CBF) by laser—Doppler flowmetry, and tissue oxygen tension (tpO2) with Polarographic microelectrodes. Cortical spreading depression increased cerebral metabolic rate of oxygen (CMRO2) by 71% ± 6.7% and CBF by 238% ± 48.1% for 1 to 2 mins. For the following 2 h, basal tpO2 and CBF were reduced whereas basal CMRO2 was persistently elevated by 8.1% ± 2.9%. In addition, within first hour after CSD we found impaired neurovascular coupling (LFP versus CBF), whereas neurometabolic coupling (LFP versus CMRO2) remained unaffected. Impaired neurovascular coupling was explained by both reduced vascular reactivity and suppressed function of cortical inhibitory interneurons. The protracted effects of CSD on basal CMRO2 and neurovascular coupling may contribute to cellular dysfunction in patients with migraine and acutely injured cerebral cortex.
Introduction
Clinical and experimental evidence indicate that cortical spreading depression (CSD) is an essential mechanism of migraine (Lauritzen, 1994), and recent data suggest that CSD or CSD-like events occur at a high frequency in the cerebral cortex of patients with acute traumatic brain injury (Strong et al, 2002), intracerebral and subarachnoid hemorrhage (Fabricius et al, 2006; Dreier et al, 2006), or malignant stroke (Dohmen et al, 2008). The objective of the present study was to examine in detail the changes in cerebral blood flow (CBF), cerebral metabolic rate of oxygen (CMRO2), and neurovascular and neurometabolic coupling in the first 2 h after the depolarization wave. We expected this would provide important information about energy supply and failure as a consequence of CSD, and thus help to explain why those with migraine have a higher risk of stroke (Kurth, 2007), and why some patients with traumatic or vascular brain injury develop secondary lesions (Hansen and Lauritzen, 1984).
Restoration of the ionic gradients after CSD is extremely energetically demanding, and the rise in metabolism during CSD is among the largest observed in the brain (Shinohara et al, 1979). This is matched by a huge increase in erebral blood flow (CBF), which ensures that the amount of substrate supplied matches the increased metabolic rate (Shinohara et al, 1979). In mice, CSD may cause a decrease (Ayata et al, 2004) or a minimal rise in CBF and in consequence a mismatch between O2 use and supply that may lead to tissue hypoxia (Takano et al, 2007). Similarly, young rats (P15 to P25) have been reported to show no increase in CBF in response to CSD (Chuquet et al, 2007). We report that basal CMRO2 was elevated for up to 2 h after CSD, whereas concurrently basal CBF and tissue oxygen partial pressure (tpO2) were reduced. At the same time neurovascular coupling was impaired whereas neurometabolic coupling was preserved. Our results may have direct clinical implications given the involvement of CSD in migraine, and the possible contribution of CSD to neuronal dysfunction or death in acute brain disorders.
Materials and methods
Eleven male Wistar rats (308 ± 6.1 g) were anesthetized with isoflurane (induction: 5%, surgery: 2%; Baxter A/S, Allerod, Denmark) while ventilated with O2 and air. The head was placed in a stereotactic head holder. Lidocaine (5 mg/mL) was used at the contact spots for the ear pins. A femoral artery catheter was inserted for measuring arterial blood pressure and taking blood-gas samples. A femoral vein catheter was inserted for saline infusion. The trachea was cannulated and rats were ventilated and maintained throughout the experiment at pH 7.35 to 7.45,
Experimental design. (
Experimental Protocols
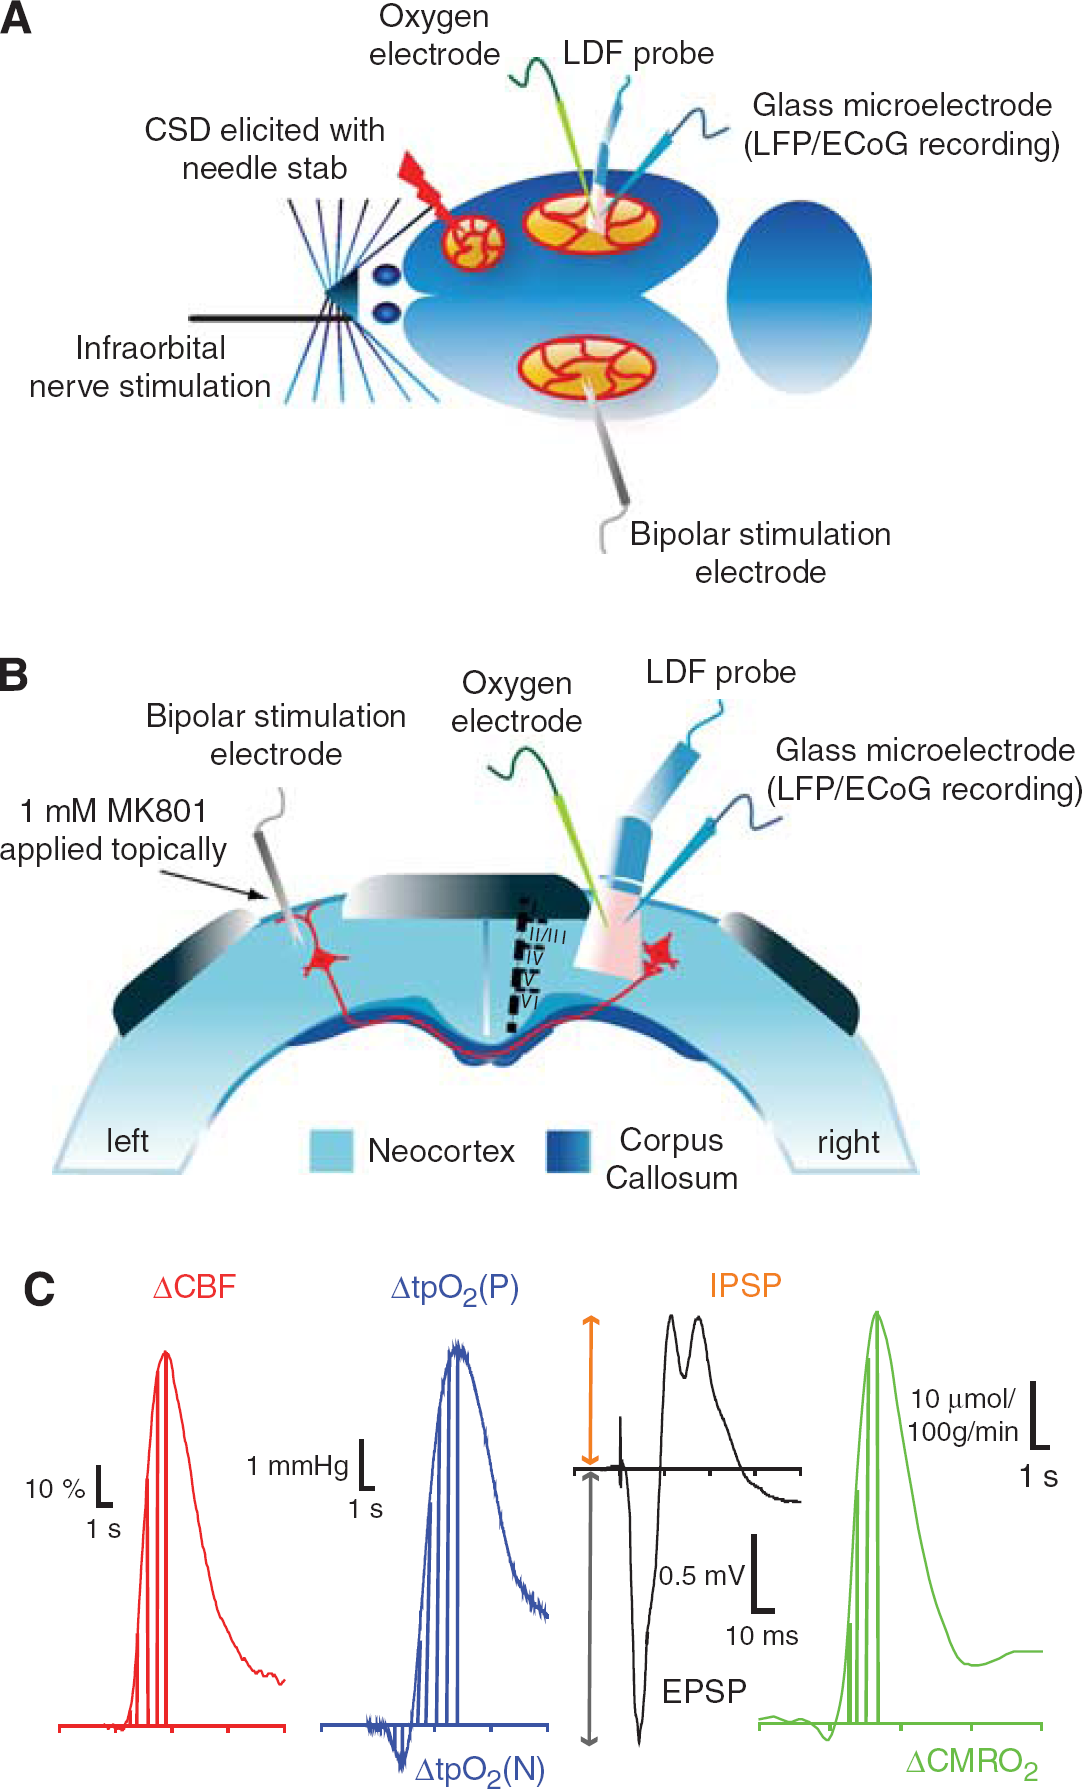
In all experiments described, recording electrodes and laser—Doppler probe were placed in a region devoid of large vessels (> 100 μm) as close as possible to each other at coordinates 3 mm posterior to bregma and 6 mm lateral to the midline, corresponding to the barrel cortex. To ensure that recordings were in the barrel cortex, we performed initial stimulation of the contralateral infraorbital nerve was performed and the area of recordings was ascertained by the presence of large and robust local field potential (LFP) and CBF responses. Cortical spreading depression was elicited in the right frontal cortex with a brief needle stab, and propagated into right somatosensory cortex monitored by a glass microelectrode recording electrocorticographic (ECoG) activity at a distance of approximately 6 mm from the site of elicitation.
Transcallosal Fiber Stimulation
In six experiments, a coated bipolar stainless steel electrode (SNEX 200, contact separation: 0.25 mm; RMI, Woodland Hills, CA, USA) was lowered 0.5 mm into the right sensory cortex 3.0 mm posterior to bregma and 6.0 mm lateral to the midline using stereotactic instruments. Direct current stimulation (ISO-flex; A.M.P.I., Jerusalem, Israel) was given as square wave pulses (100 μs, 1.5 mA) at 1, 2, 4, 6, 10, 20, 30, and 40 Hz in trains lasting for 1 sec. Each frequency was run three times with interstimulus intervals of 0.5 to 1.5 mins, depending on the stimulation frequency, to allow the reestablishment of a stable baseline between stimulations. Cortical stimulation elicited episodes of CSD on the stimulated side. To circumvent this problem, we applied the NMDAR antagonist MK801 to the stimulated (left) cortex in a concentration of 1 mmol/L (Figure 1B), which prevented the occurrence of CSD (Hoffmeyer et al, 2007). This procedure ensured reproducible tpO2, LFPs, and CBF responses in the activated (right) cortex.
Tissue PO2 Measurements
We used a modified Clark-type Polarographic oxygen microelectrode (OX-10; Unisense A/S, Aarhus, Denmark) with a guard cathode for tpO2 measurements. The advantage of this electrode type is its small tip size (10 μm in this study) and its built-in guard cathode, which removes all oxygen from the electrolyte reservoir.
This enabled us to measure tpO2 over time (and among different treatment conditions) with excellent long-term stability (signal drift, 0 to 0.5% per hour). The field of sensitivity is a sphere of two times the tip diameter. The electrodes used in this study were constructed so that 90% of the response time was < 1 sec and the stirring sensitivity was nearly negligible at <0.8%. Oxygen microelectrodes responded linearly to changes in oxygen concentration. Calibration of each electrode was performed before and after each experiment in both air-saturated saline and in oxygen-free solution consisting of 0.1 mol/L (+)sodium
Electrophysiology
We used single-barreled glass microelectrodes, filled with 2 mol/L saline (impedance, 2 to 3 MΩ tip, 2 μm). Extracellular LFPs were recorded with a single electrode at a depth of 300 to 600 μm in the right somatosensory cortex. An Ag/AgCl ground electrode was placed in the neck muscle. The preamplified (x 10) signal was A/D converted, amplified, band pass filtered at 1 to 1000 Hz, and digitized using the 1401 plus hardware (CED) connected to a PC running the Spike 2.5 software. Digital sampling rates for LFP and ECoG were 5 kHz.
Laser—Doppler Flowmetry
Cerebral blood flow was continuously recorded using LDF. The LDF probe was at a fixed position at 0.3 mm above the pial surface in a region devoid of large blood vessels (wavelength, 780 nm; fiber separation, 250 μm; Periflux 4001 Master, Perimed, Jarfälla, Sweden). With this wavelength and fiber separation, changes in CBF were recorded to a cortical depth of 1 mm (Fabricius et al, 1997). After stable baseline recordings had been obtained, the probe was left for the duration of the experiment. The signal was A/D converted and recorded using the CED 1401 plus interface and the CED Spike 2.5 software (10 Hz digital sampling rate). The LDF monitor displays blood flow readings in arbitrary units that do not allow for measurement of CBF in terms of absolute values, but the method is valid in determining relative changes of CBF during moderate flow increases (Fabricius and Lauritzen, 1996).
Calculation of CMRO2
To evaluate the effect of stimulation on metabolism, we calculated CMRO2 from simultaneously obtained recordings of tpO2 and CBF offline. Baseline values of tpO2 and CBF were taken as the mean of a 1 sec period obtained before onset of stimulation. These values were then combined with reported values for CBF and CMRO2 from the literature using α-chloralose anesthesia (53 mL/100 g per min and 219 μmol/100 g per min, respectively; Zhu et al, 2002) to calculate the corresponding 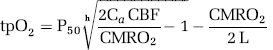
Data Analysis and Statistics
Simultaneously recorded LFP, CBF, and tpO2 signals were used for analysis. The LFPs were averaged, and amplitudes were calculated for each stimulation period as the difference between the baseline and the first negative peak (excitatory postsynaptic potential, EPSP), and between baseline and first positive peak (inhibitory postsynaptic potential, IPSP). Stimulation-induced CBF responses (ACBF) were converted from AU to percent change from baseline (1 sec before stimulation) as the area under curve (AUC) from stimulation onset to peak value. tpO2 values were converted from pA to mmHg, and evoked responses were calculated as AUC from stimulation onset to trough (ΔtpO2(N)), and from onset to peak (ΔtpO2(P)); Figure 1C shows calculated areas and amplitudes. Baseline values for CBF, tpO2, and CMRO2 for a given period were calculated for every animal as follows: the last second before stimulation onset for every frequency (1, 2, 4, 6, 10, 20, 30, and 40 Hz) was summed and divided by the number of stimulation frequencies (
Results
We recorded colocalized changes in ECoG activity, evoked LFP responses, tpO2, and CBF in rat barrel cortex online. CMRO2 was calculated offline from corresponding changes in CBF and tpO2. In the following section, we describe the effect of CSD on these variables in the acute phase (first 1 to 2 mins of the CSD), and for up to 2 h after CSD with respect to baseline changes and the evoked responses.
CSD Triggers Large Acute Rises in CBF and CMRO2 and Occasionally Tissue Hypoxia
The effect of CSD on CBF and CMRO2 was evaluated in 11 animals. Within 1 to 2 mins after elicitation of CSD in the right frontal cortex, the depolarization wave reached the somatosensory barrel cortex as identified by the loss of spontaneous ECoG activity and a large DC shift (Figure 2A). Coinciding with the DC shift, tpO2 (Figure 2B, blue trace) increased by 51% from baseline levels of 18.0 ± 1.9 mmHg to 27.2 ± 2.0 mmHg (
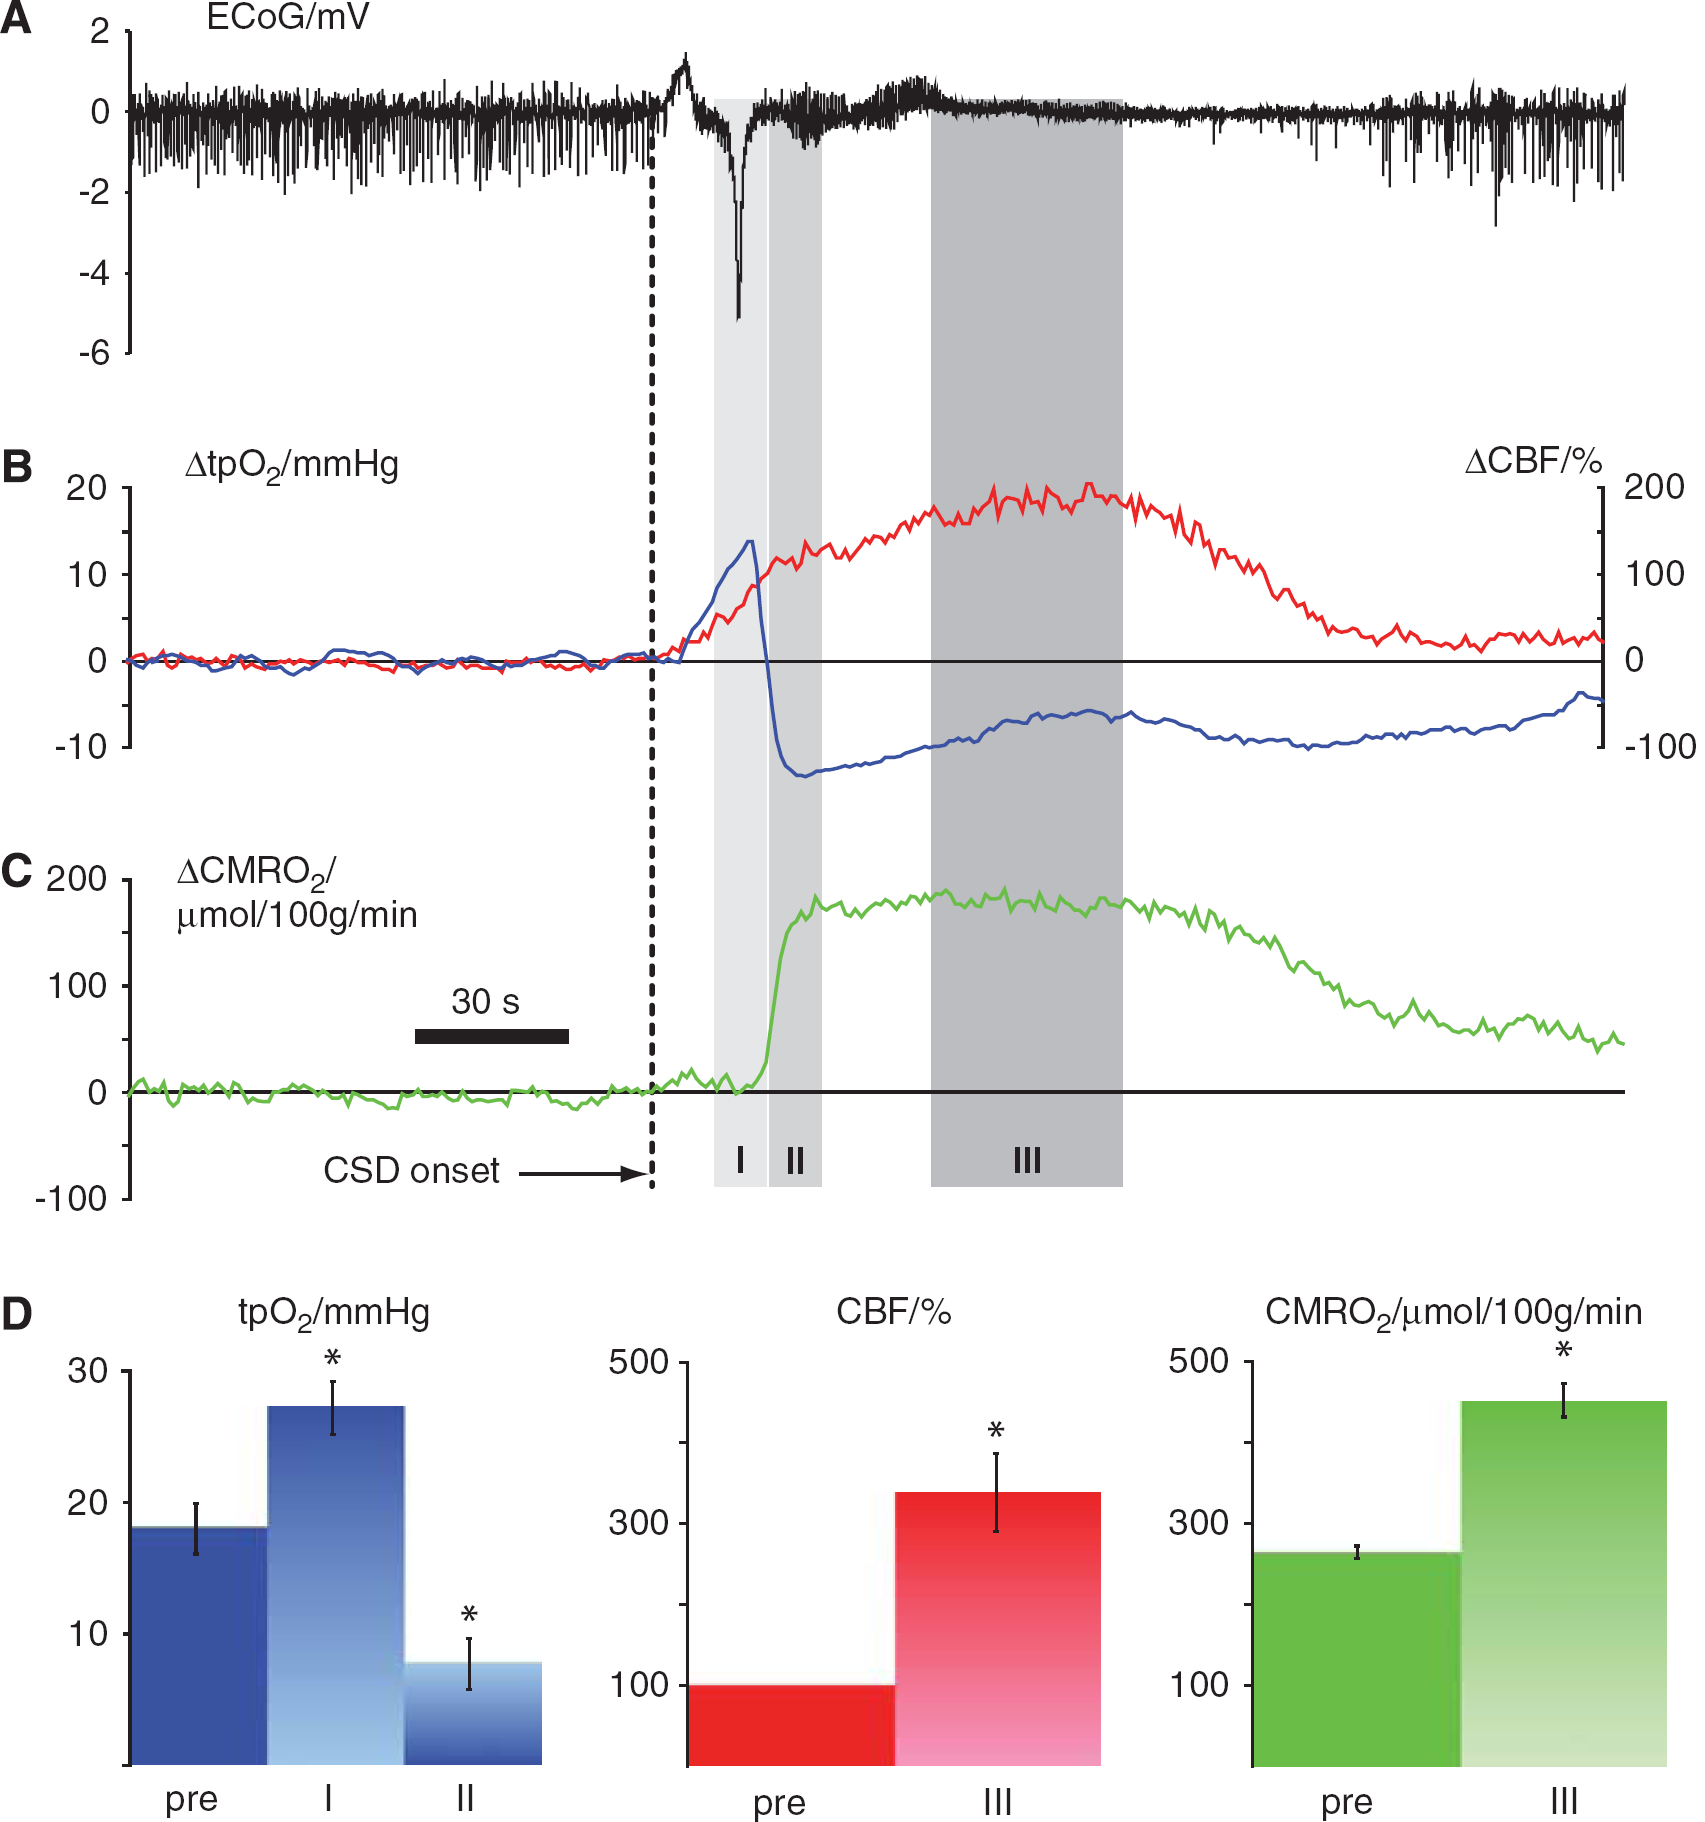
Vascular and metabolic changes during single episode of cortical spreading depression. Data in
Persistent Reduction in Baseline CBF, tpO2 and Rise in CMRO2 at 1 to 2 h after CSD
In the same 11 animals we assessed baseline tpO2, CBF, and CMRO2 for 2 h after CSD. Cortical tpO2 was persistently reduced in the first hour after CSD by 52.1% ± 5.9% (
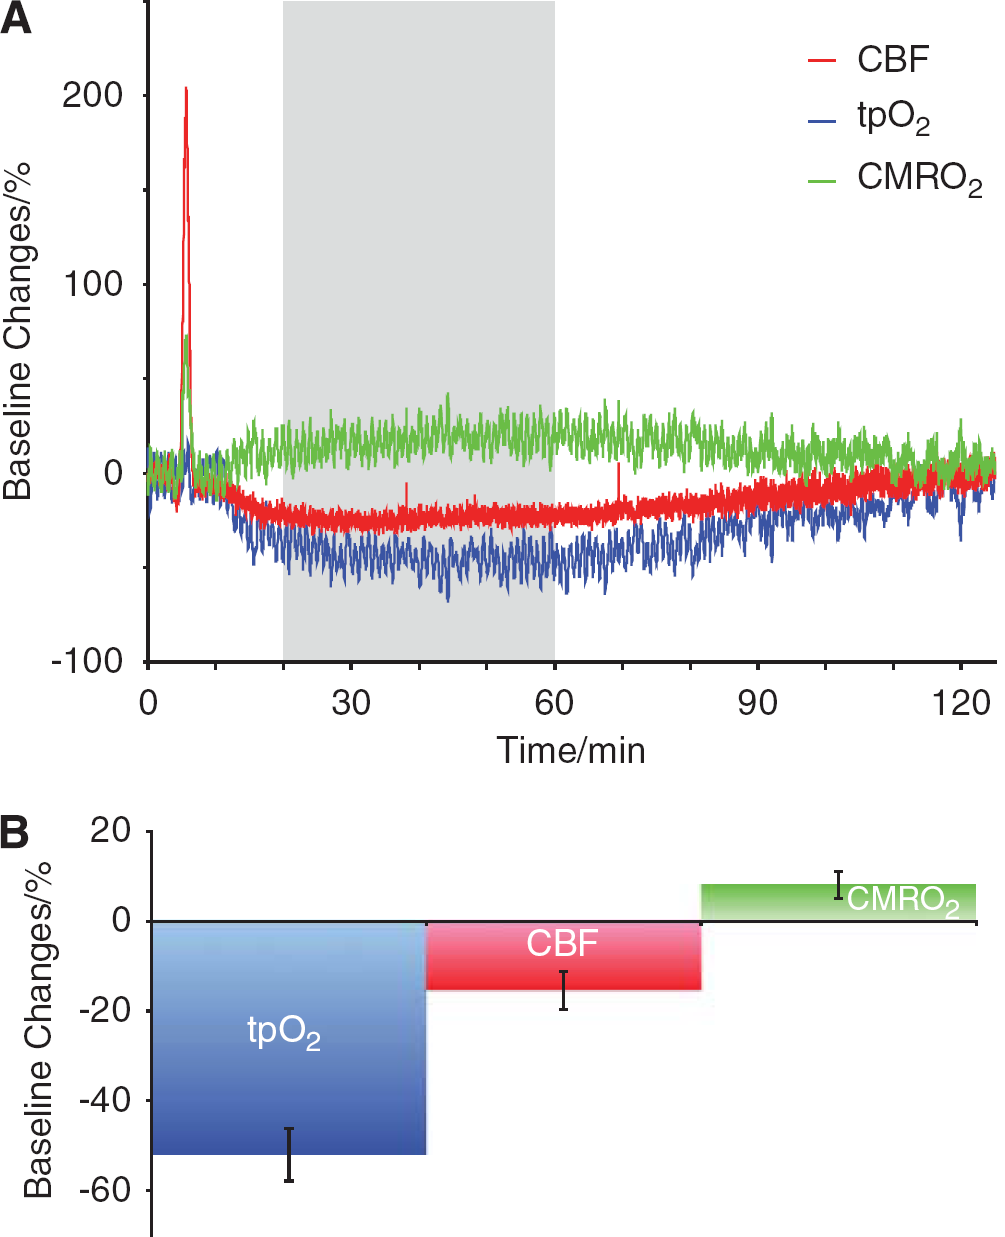
Time course of long-term baseline changes in CBF, tpO2, and CMRO2 after a single episode of CSD. CBF and metabolic rate increased dramatically in the first minutes after onset of CSD (also indicated in Figure 2). (
Frequency Dependency of Evoked Synaptic Responses Before, During, and After CSD
Synaptic transmission in the TC pathway is glutamatergic and results in activation of postsynaptic glutamate and GABA receptors (Kawaguchi, 1992). TC stimulation in 1 s lasting trains evoked reproducible, frequency-dependent LFP responses in the contralateral homologous somatosensory cortex. The recorded LFP responses (Figure 1C) were biphasic, consisting of an initial negative potential indicating synaptic excitation (EPSP) and a longer-lasting positive potential indicating synaptic inhibition (IPSP). Figures 4A and 4B depict the frequency-dependent response amplitudes up to the stimulation frequency at which LFP responses could be detected with certainty. The EPSP and IPSP response amplitudes declined as a function of the stimulation frequency, EPSPs became undetectable at stimulation frequencies above 20 Hz, IPSPs above 10 Hz.
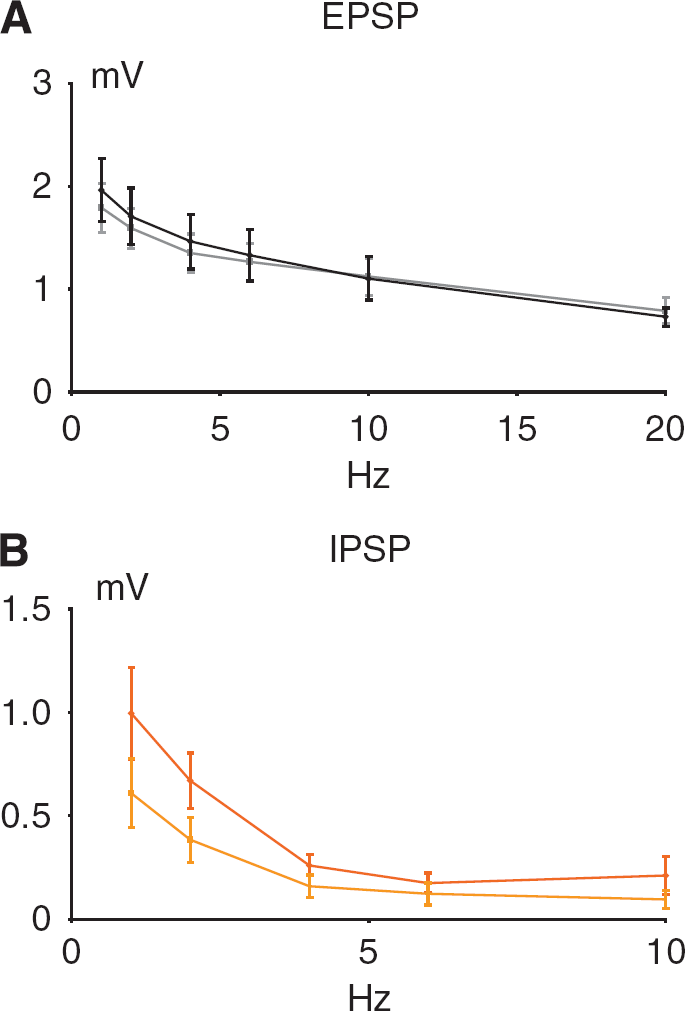
Frequency dependency of evoked synaptic responses before and after single episodes of CSD. The panels show the frequency dependency of the EPSP and IPSP as mean ±s.e.m. (
Cortical spreading depression abolished the evoked LFP responses for 1 to 2 mins, which slowly recovered simultaneously with the spontaneous ECoG activity. The response amplitude of the EPSP had returned to normal at 20 mins after the CSD (
Neurovascular and Neurometabolic Coupling Before and After a CSD
A summary of the stimulus- and frequency-dependent changes in tpO2, CBF, and CMRO2 after CSD is given in Figures 5A–5D. Linear regression with random effects (proc mixed) of evoked CBF responses versus frequency revealed an unchanged slope after CSD for the first 60 mins whereas there was a significant level difference between pre- and post-CSD (
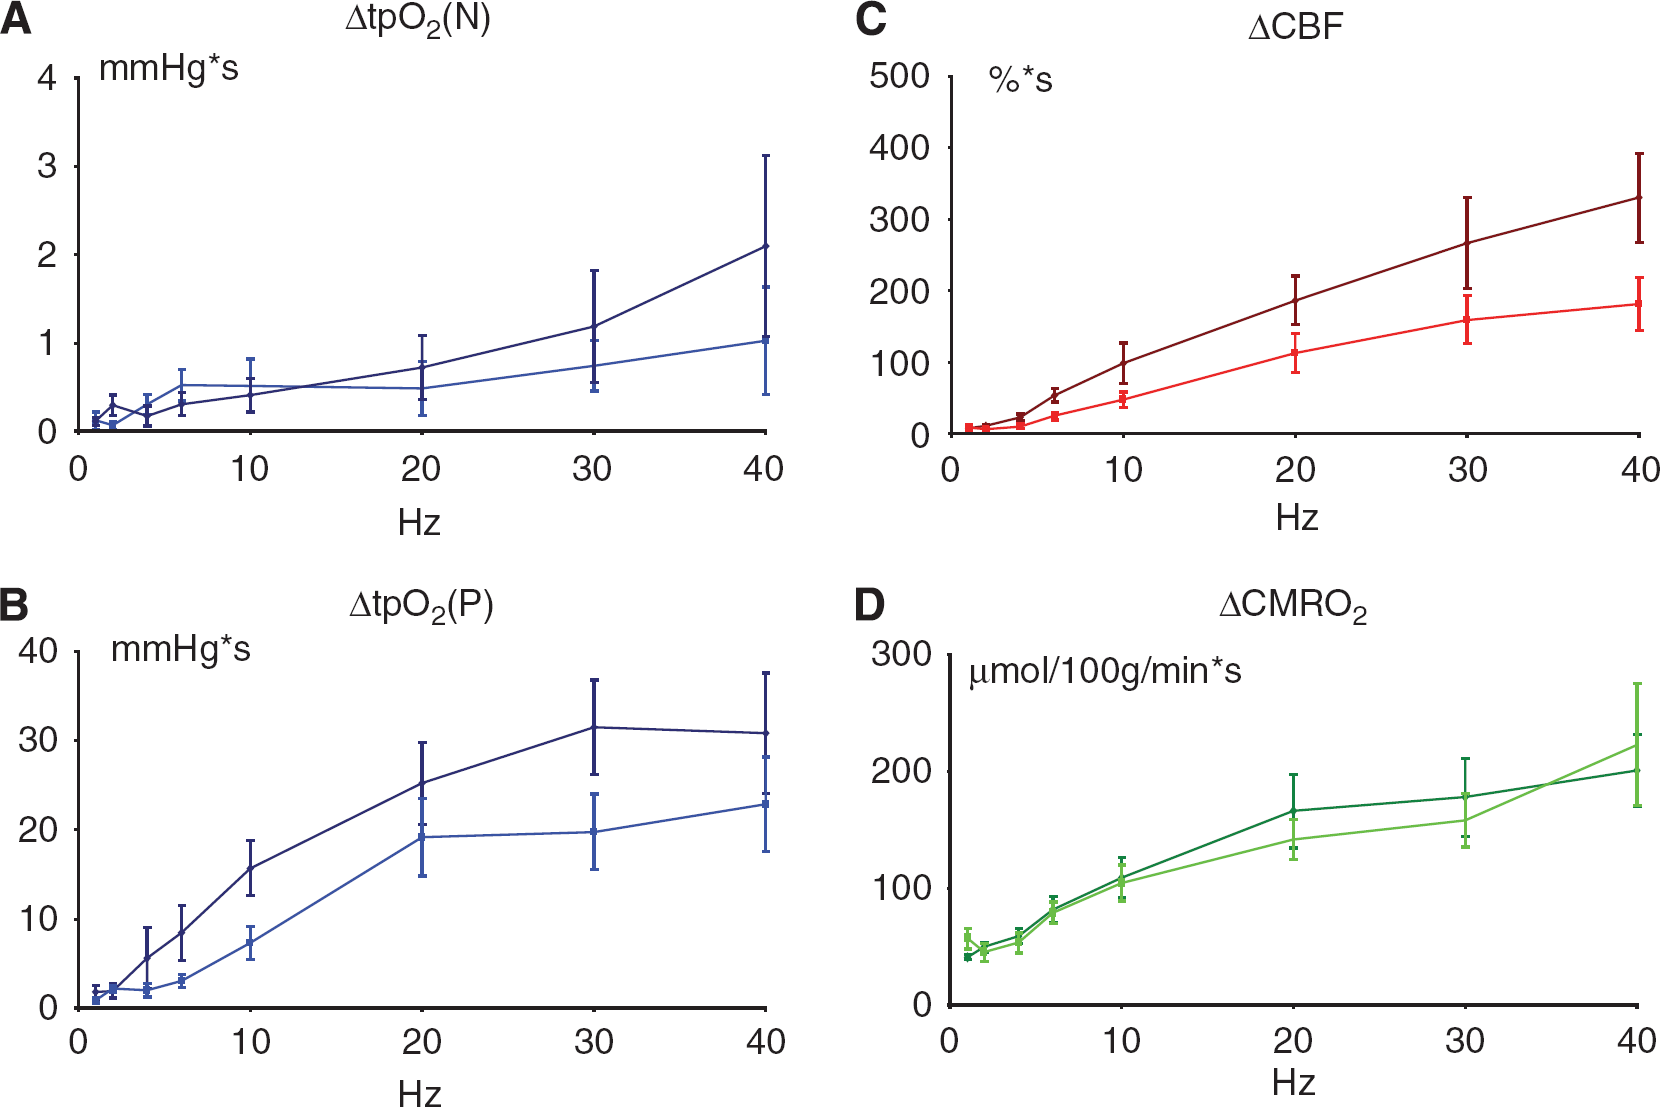
Stimulation frequency-dependent changes in vascular, and metabolic responses before and after a single CSD episode. Each panel shows the frequency dependency of the parameters as mean ± s.e.m. (
We then assessed neurovascular and neurometabolic coupling after CSD, defined as the correlation between excitatory synaptic activity and CBF-respective CMRO2. We calculated the summed EPSP response amplitudes (ΣEPSP) for each stimulus rate and experimental condition as indicator of the total excitatory synaptic activity during the stimulation period and plotted this variable versus the observed changes in CBF-respective CMRO2. Linear regression with random effects revealed no significant change in the slope of neurovascular coupling (ΔCBF versus ΣEPSP) because of CSD (Figure 6A) but showed a significant level difference after CSD (
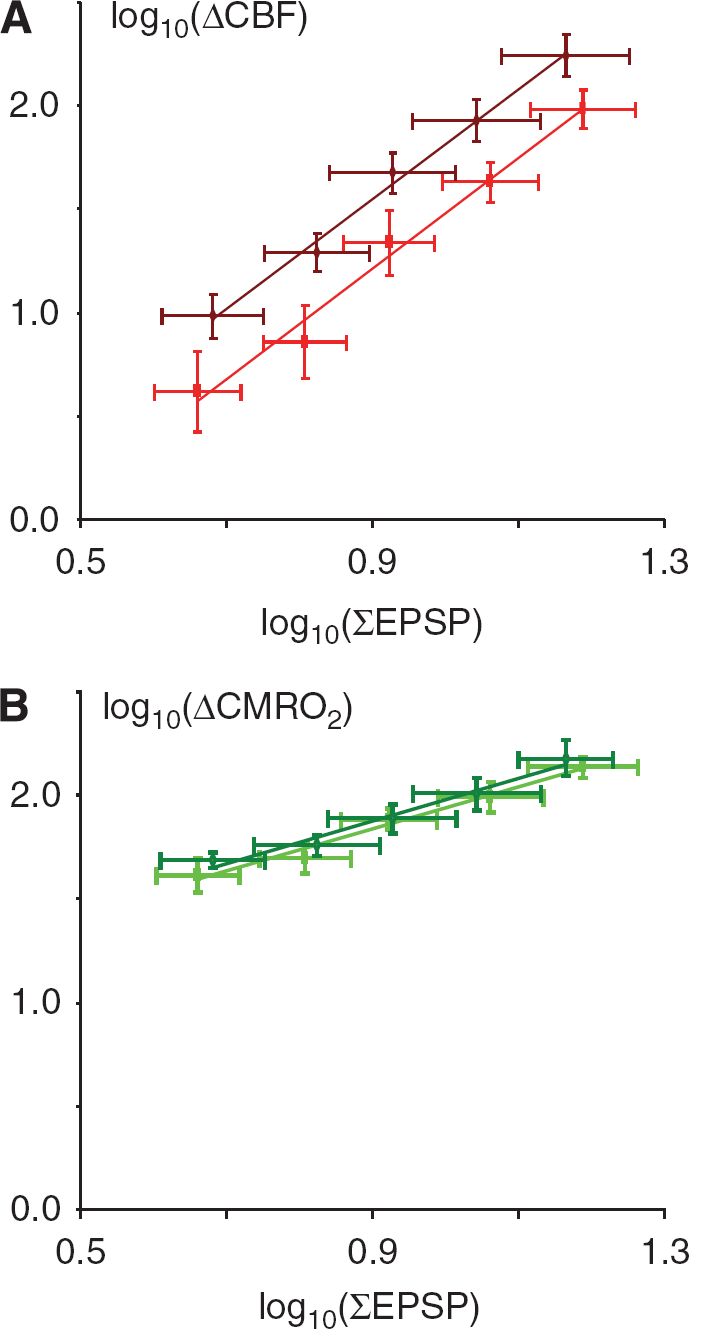
Neurovascular but not neurometabolic coupling is impaired after CSD. Each panel shows linear regression of log-transformed data of synaptic activity, as indicated by the summed LFP response amplitudes (ΣEPSP), versus ΔCBF and ΔCMRO2 (
Discussion
CSD causes a brief dramatic increase in CMRO2, which may be associated with a period of tissue hypoxia as described previously in the rat and mouse neocortex (Lukyanova and Bures, 1967; Lacombe et al, 1992; Takano et al, 2007). The acute changes are followed by a persistent reduction in baseline CBF and tpO2, and a rise in baseline CMRO2 as well as impaired neurovascular coupling for 2 h. The persistent reduction in baseline CBF and neurovascular coupling following CSD was not explained by suppression of spontaneous ECoG activity, which returned to normal at 10 to 20 mins after CSD (Leao, 1944; Bures et al, 1974), but may relate to reduced vascular reactivity (Wahl et al, 1987; Lacombe et al, 1992; Florence et al, 1994). In addition, others and we have observed that excitatory synaptic transmission is unaffected after CSD, whereas intracortical inhibition is selectively reduced as indicated by a decline of extracellularly recorded paired pulse inhibition (Kruger et al, 1996), and the persistent reduction of the evoked IPSP response amplitude as shown in this study. Intracortical inhibitory interneurons are activated by transcallosal stimulation and expected to release vasoactive molecules such as nitric oxide and vasoactive intestinal polypeptide when stimulated (Enager et al, 2009). On this background we hypothesize that reduced activity of intracortical interneurons may contribute to the observed suppression of neurovascular coupling after CSD. The persistent rise in basal CMRO2 following CSD may be the consequence of several mechanisms that relate to the control of metabolic fluxes as described in the following.
CSD Induces Brief and Huge Rise in CBF and CMRO2
We observed a brief rise in tpO2 concomitant with the initial rise in CBF at the time of tissue depolarization, which is consistent with a slight decrease in CMRO2 immediately preceding the depolarization wave (Lukyanova and Bures, 1967). The rise in tpO2 indicates that it takes a few seconds for oxidative phosphorylation to run at such speed that CMRO2 outlasts O2 supply (Figure 2B). Cerebral blood flow continued to increase for the following 1 to 2 mins, whereas tpO2 decreased to anoxic levels in one-third of the animals. This suggested that O2 use during this period was larger than O2 supply. The rise in CMRO2 corresponded to the phase where extracellular [K+] drops from 60 to 3 mmol/L and cells repolarize because of a pronounced increase in Na+/K+-ATPase activity (LaManna and Rosenthal, 1975), which triples glucose use (Shinohara et al, 1979) and lactate release (Cruz et al, 1999). The rise in CBF occurred gradually, but although the increments were in the range of 200 to 300%, this was insufficient to match the rise in CMRO2, as indicated by the reduction in tpO2. The results are consistent with data obtained in mice that reveal pockets of tissue hypoxia in the most distant supply territories of cortical capillaries during CSD (Takano et al, 2007) and emphasize that restoration of normal function following CSD is a serious metabolic challenge. We observed no correlation between the cortical tpO2 level and the duration of the DC shift, as reported for the mouse (Takano et al, 2007). Cortical spreading depression activates glycolytic pathways, as evidenced by the accompanying prolonged rise in brain lactate and reduction in brain glycogen, whereas the energy charge (i.e., the brain concentration of energy-rich phosphate compounds) remains preserved (Krivanek, 1958; Lauritzen et al, 1990). This is consistent with zones of oxidative metabolism in perivascular tissue, and glycolysis in supply territories further away from the capillaries (Takano et al, 2007). The initiation of glycolysis may be triggered by the low tpO2, but could also reflect rises in neuronal or astrocytic Ca2+ (Basarsky et al, 1998) and intracellular alkalinization (Chesler and Kraig, 1987), which activates glycogen Phosphorylase (Hof et al, 1988) and lactate production (Cruz et al, 1999; Hertz and Dienel, 2002). Whether energy failure prevails and delays recovery of cortical function depends on limitations in the blood-borne O2 and glucose supply, which may vary between species because of variations in the acute CBF response (Ayata et al, 2004). Interestingly, the ability of astrocytes to induce vasodilations over vasoconstrictions relies on the metabolic state of the rat brain tissue (Gordon et al, 2008). During CSD, oxygen availability is limited and astrocytic calcium concentration is elevated (Basarsky et al, 1998), which favors astrocytic glycolysis and lactate release. At the same time nitric oxide (Read et al, 1997) and free fatty acids (Lauritzen et al, 1990) are released, and converted to vasodilator prostaglandins and thromboxane (Busija et al, 2008). High levels of external lactate (Cruz et al, 1999) attenuate transporter-mediated uptake of prostaglandin E2 from the extracellular space, leading to accumulation of vasodilators (Gordon et al, 2008). We suggest that tissue hypoxia during recovery from depolarization will contribute to the CBF rise during CSD by such a mechanism.
Persistent Impairment of Neurovascular Regulation in Wake of CSD
Cortical spreading depression is followed by a persistent oligemia and a reduction in vascular reactivity (Lauritzen, 1984; Wahl et al, 1987; Florence et al, 1994), which are very similar to the changes in CBF and fMRI BOLD signals observed in patients during acute attacks of migraine with aura (Lauritzen, 1994; Hadjikhani et al, 2001). The reduction in cerebrovascular reactivity to chemical stimuli is independent of whether the persistent vascular reaction is vasodilatation or vasoconstriction (Wahl et al, 1987), and represents mainly a change in the response properties of the blood vessels themselves, because the reduced reactivity in part can be reproduced in rat middle cerebral arteries that are isolated after CSD
Persistent Increase of Basal CMRO2 in Wake of CSD
Basal CMRO2 increased persistently for 1 to 2 h after CSD. The rise in CMRO2 for the first 10 to 15 mins may be explained by oxidation of lactate converted to pyruvate and resynthesis of glycogen from glucose residues, but we cannot account for the rise in CMRO2 from 15 to 60 mins after the CSD. At this time brain glucose, lactate, and glycogen have returned to normal (Lauritzen et al, 1990) and glucose use is constant (Lauritzen and Diemer, 1986). Our work may relate to recently published microdialysis data in cats that showed that CBF and dialysate lactate remained increased, and dialysate glucose remained decreased at 30 mins after a CSD (Hashemi et al, 2009). Our finding is reminiscent of the small rise in the cerebral oxygen/glucose ratio during recovery from sensory stimulation that has been observed previously in awake rats, which was not explained by delayed consumption of hexacarbon or tricarbon compounds (Madsen et al, 1999). Glucose must traverse a series of intermediate metabolic pools before it is used directly for energy metabolism, and the size of the intermediate pools may enlarge during functional activation and CSD. The subsequent increase in CMRO2 serves to decrease the size of these pools to resting levels (Madsen et al, 1999) or to an increase in anaplerotic formation of glutamate (Serres et al, 2008) during CSD and subsequent glutamate oxidation (Hertz and Fillenz, 1999). The prolonged rise in CMRO2 after CSD also may relate to the concept of ‘oxygen debt’, known from studies of metabolism during muscle work, which denotes a persistent rise in oxygen consumption after exercise that relates to both oxidation of lactate and to replenishment of intermediate metabolic pools (Margaria et al, 1933).
In conclusion, we have shown that CSD induces a persistent rise in CMRO2, a reduction in basal CBF, and impairment of activity-dependent rises in CBF. The impairment of vascular function may relate to a direct effect of CSD on cortical blood vessels (Wahl et al, 1987) or to selective suppression of GABAergic function, whereas the mechanisms underlying the persistent rise in CMRO2 appear to be more complex. We suggest that the persistent vascular and metabolic changes may contribute to the pathologic changes in cortical thickness reported in patients with chronic migraines (DaSilva et al, 2007) and to the increased risk of stroke in migraine patients (Kurth, 2007). In addition we hypothesize that the observed abnormalities of perfusion and oxygen metabolism may contribute to the development of secondary brain damage in acutely injured human brain cortex, in which CSD or periinfarct depolarizations occur in a large proportion of patients (Fabricius et al, 2006, 2008; Dreier et al, 2006; Dohmen et al, 2008).
Footnotes
Acknowledgements
We thank Mrs Marianne Kureer for expert laboratory assistance.
The authors have no conflict of interest to declare.