
Abstract
This study investigated how a decrease in neuronal activity affects cerebral blood oxygenation employing a paradigm of acoustically triggered saccades in complete darkness. Known from behavioral evidence as saccadic suppression, electrophysiologically it has been shown in monkeys that during saccades an attenuation of activity occurs in visual cortex neurons (Duffy and Burchfiel, 1975). In study A, using blood oxygen level-dependent (BOLD) contrast functional magnetic resonance imaging (fMRI), the authors observed signal intensity decreases bilaterally at the occipital pole during the performance of saccades at 2 Hz. In study B.1, the authors directly measured changes in deoxyhemoglobin [deoxy-Hb] and oxyhemoglobin [oxy-Hb] concentration in the occipital cortex with near-infrared spectroscopy (NIRS). Whereas a rise in [deoxy-Hb] during the performance of saccades occurred, there was a drop in [oxy-Hb]. In a second NIRS study (B.2), subjects performed saccades at different rates (1.6, 2.0, and 2.3 Hz). Here the authors found the increase in deoxy-Hb and the decrease of oxy-Hb to be dependent on the frequency of the saccades. In summary, the authors observed a focal hypooxygenation in the human visual cortex dependent on the saccade-frequency in an acoustically triggered saccades paradigm. This could be interpreted as evidence that corresponding to the focal hyperoxygenation observed in functional brain activation, caused by an excessive increase in cerebral blood flow (CBF) over the increase in CMRO2 during decreased neuronal activity CBF, is more reduced than oxygen delivery.
Keywords
The coupling of brain cell function to the vascular system (Roy and Sherrington, 1890) is the basis of a number of functional neuroimaging methods relevant to human studies. Although it may seem obvious that an increase in cerebral blood flow (CBF) is needed to match a stimulus associated increase in oxygen and glucose consumption, the finding of an increase in brain activity associated with an increase in regional cerebral blood flow (rCBF) that was not matched by a proportional increase in oxygen consumption came as a surprise (Fox and Raichle, 1986; Fox et al., 1988). Originally termed as “focal uncoupling,” recently proposed models of the coupling of CBF and CMRO2 predict the observed, disproportionate change of the two physiologic quantities and show that the excess increase in rCBF is actually needed to sustain the smaller increase in oxygen consumption (Buxton and Frank, 1997).
The basic finding of a local hyperoxygenation associated with increased brain activity has also been reported both in a number of optical studies dealing with the exposed cortex (Malonek and Grinvald, 1996) and in humans with the use of the noninvasive near-infrared spectroscopy (NIRS) method (Meek et al., 1995; Villringer et al., 1993; Wenzel et al., 1996b). These studies found a stimulus associated increase in oxyhemoglobin concentration ([oxy-Hb]) paralleled a decrease in deoxyhemoglobin concentration ([deoxy-Hb]). The decrease in [deoxy-Hb] is the physiologic basis of the increased BOLD (blood oxygen level-dependent) contrast magnetic resonance imaging signal intensity during brain activation (Ogawa et al., 1990; Kwong et al., 1992).
A smaller amount of attention has been shown to the relation between a decrease in neuronal activity and in parameters relating to the vascular response. Positron emission tomography (PET) studies report deactivation phenomena other than activation, or the studies concentrate on deactivation as a drop in rCBF (Drevets et al., 1995; Paus et al., 1995; Wenzel et al., 1996a). It is unclear, however, how a deactivation, or decrease in neuronal activity, alters the parameters of cerebral blood oxygenation. Assuming that less neuronal activity is associated with less oxygen consumption, and that blood flow is regulated accordingly, the concentration of deoxyhemoglobin should not change. Therefore, BOLD contrast functional magnetic resonance imaging (fMRI) would not show any change in signal intensity because the decrease in blood flow would match the decrease in oxygen consumption. The authors addressed this question by employing a model of decreased neuronal activity elicited by the performance of saccades.
As described by Dodge (1900), a lack of perception during rapid eye movements (saccades) is easily demonstrated by attempting to see one's own eye movements in a mirror. Evidence of an inhibition associated with the eye movement was revealed later by psychophysiologic studies that reported an elevated threshold for detecting a brief visual stimulus during the saccadic eye movement. This elevation of threshold has been named saccadic suppression (Zuber and Stark, 1966; see Bridgeman et al., 1994 for a review). A recent behavioral study suggests that the M-pathway of the visual system is selectively suppressed during saccadic eye movements (Burr et al., 1994). Electrophysiologic correlates of oculomotor corollary discharge during saccades have been found in the striate cortex (Duffy and Burchfiel, 1975), parietal cortex (Duhamel et al., 1992), pulvinar (Robinson et al., 1990), and superior colliculus (Richmond and Wurtz, 1980) of the monkey. In single cell recordings Duffy and Burchfiel (1975) demonstrated that a decrease of firing rate in the striate visual cortex neurons of encéphale isolé monkeys is related to saccadic eye movements in total darkness. Saccade-related inhibition was directionally specific for the majority of striate cortex neurons. Recently, in humans, a PET study demonstrated rCBF decreases in the striate cortex, adjacent extrastriate cortex, and parietal cortex with increasing frequency of saccades (Paus et al., 1995).
Using saccadic suppression as a model for neuronal deactivation, the authors investigated associated changes in cerebral blood oxygenation in humans with the following two independent methods: (1) susceptibility sensitive fMRI, owing its signal mainly to concentration changes of deoxygenated hemoglobin (BOLD) and providing superior spatial resolution; (2) NIRS, directly measuring [deoxy-Hb] and [oxy-Hb], the second important parameter of blood oxygenation.
MATERIALS AND METHODS
Functional magnetic resonance imaging (study A)
Ten right-handed subjects (mean age 25.4, SD 5.3 years) served in the first experiment (three males). Informed written consent was obtained before scanning according to protocol approved by the Human Studies Committee of the Massachusetts General Hospital.
Scans were acquired on a 1.5 Tesla General Electric scanner with echo planar imaging (Advanced NMR Systems, Wilmington, MA, U.S.A.) with a 5-inch surface RF-coil over the occiput. Subjects laid in the scanner with their heads immobilized by a bite bar to avoid movement artifacts. Functional scans were collected in an oblique orientation parallel to the calcarine fissure, as determined by the midsagittal section in runs of 128 images per slice, using a T2* weighted asymmetric spin echo sequence designed to reduce contributions from large vessels (Boxerman et al., 1995) (repetition time = 2 seconds, 180° offset −25 milliseconds). Slice thickness was set to 6 mm (skip 1 mm between slices), with 3.125×3.125 mm in-plane resolution. Three to six slices per run were acquired in each experiment. T1 weighed inversion recovery echo planar images were acquired (inversion time = 1200 milliseconds, 1.563×1.563 mm in-plane resolution) in the same orientation as the functional runs to provide detailed anatomic information aligned to the functional scans.
Subjects performed alternating epochs of acoustically cued saccades (16 seconds) and rest (no eye movements, 16 seconds) in complete darkness with their eyes open (total runtime 256 seconds). Each subject completed 1 to 2 runs. Acoustic cues for the saccades were generated by a PC, amplified, and delivered binaurally to the subject through a pair of plastic tubes approximately 6 feet long. The plastic tubes were connected to a noise-protection headset for suppression of the ambient scanner noise. Beeps alternated on the left and right ear with a frequency of 2 Hz. Higher pitched beeps (440 Hz) indicated the subjects to perform a saccade towards the ear where the beep appeared. During lower pitched beeps (220 Hz) the subjects did not perform any eye movements. Synchronization of the stimuli to the magnetic resonance data acquisition was accomplished by manually starting the stimulus program at the same time as the magnetic resonance sequence.
Time series were visually inspected for motion artifacts and, if necessary, a motion correction (SPM-package) was applied. Analysis was conducted on data sets of individual subjects by first averaging all runs. Activation images were constructed using the nonparametric Kolmogorov—Smirnov statistic (Press et al., 1988; Stuart et al., 1991). Kolmogorov—Smirnov maps were created that showed signal increases or decreases above a P = 0.0001 threshold within each subject. Kolmogorov—Smirnov maps were constructed after an in-plane Hanning spatial filter was applied that smoothed adjacent voxels.
Near-infrared spectroscopy

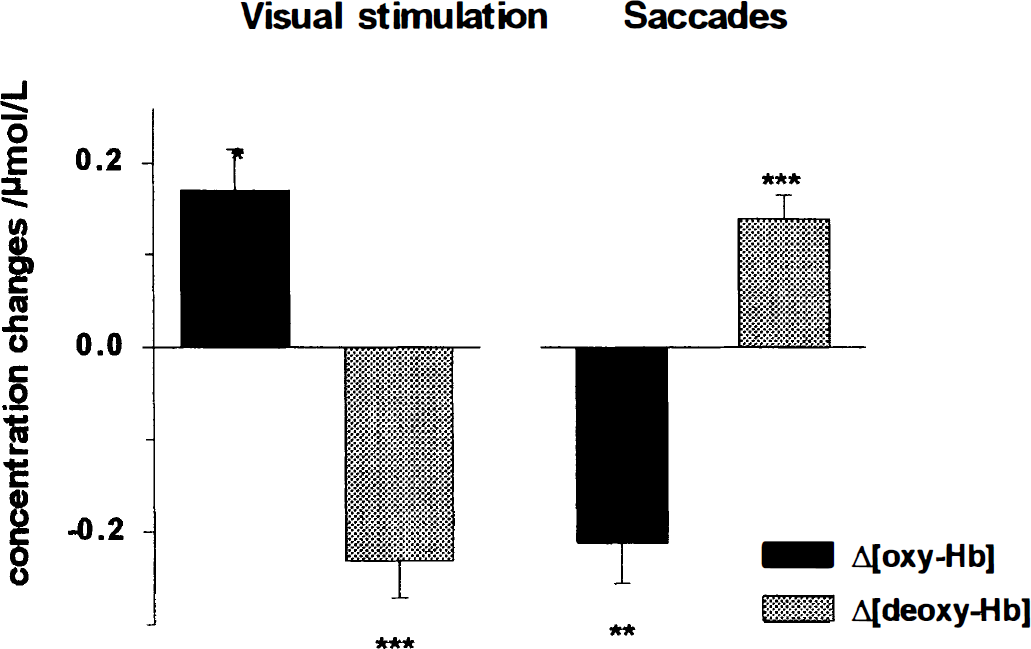
where ε is the specific extinction coefficient of the absorbing compound measured in μmol/L−1 cm−1; c is the concentration of the absorbing compound measured in μmol/L; and d is the distance between light emitting and receiving optical fiber (interoptode spacing) measured in centimeters. The differential pathlength factor (DPF) (Delpy et al., 1988) is defined as the gradient of the attenuation with respect to the absorption coefficient of the tissue. It is wavelength (λ) dependent and a nonlinear function of the tissue absorption and scattering properties. The additive term G accounts for scattering losses. Assuming that d, DPF, and G remain constant during the measurement period, concentration changes Δc can be calculated from changes in attenuation. Assuming that the attenuation changes ΔA(λ) are caused by changes in chromophore concentrations Δci, it can be written
The index i symbolizes the different chromophores and εi stands for the corresponding molar extinction coefficients.
Changes in concentration of a number of chromophores can be computed simultaneously from the changes in attenuation at a number of wavelengths using a least square regression algorithm incorporating the relevant extinction coefficients spectra for each chromophore (Wray et al., 1988). For known DPF, the concentration changes can be expressed in units of μmol/L.
The DPF and its wavelength dependence for the adult head have been estimated by time of flight methods (Arridge et al., 1992; Essenpreis et al., 1993; van der Zee et al., 1992) and in the frequency domain by phase shift measurements (Duncan et al., 1995). In this article all chromophore concentration changes are given in units of μmol/L assuming an absolute value of the DPF at 800 nm of 6.2 (Duncan et al., 1995).
The second NIRS experiment (study B.2) employed a different spectrometer than the first study. A spectroscopic system consisting of a grating spectrograph (SP-275; Acton Research, Acton, MA, U.S.A.) in combination with a halogen light source and a CCD detector with a 1024×256 pixel resolution (Princeton Scientific Instruments, Trenton, NJ, U.S.A.) was used to collect the diffusely reflected light (Cope et al., 1989; Matcher et al., 1994). For each volunteer 3000 to 6000 spectra were recorded for a wavelength range λ = 700 to 1000 nm with an exposure time of 500 milliseconds. To reduce the noise level, the chip was operated with pixel binning giving data from 94 separate wavelengths. The spectrograph was operated with a slit width of 1 mm, reducing the spectral resolution to 20 nm (free width half maximum).
The light was guided by optical fiber bundles (1 light emitting and 4 light receiving optodes) that were positioned and attached to the head with rubber strips. The optodes were positioned over the right occipital pole at the level of the calcarine sulcus according to high resolution structural MRI together with fiducial markers. The interoptode distance was 3.5 cm in both NIRS studies. Theoretical investigations of the photon path in a head model indicate that the gray matter is part of the sampling volume with this interoptode distance (Okada, 1997).
Concentration changes in deoxy-Hb, oxy-Hb, and the redox state of the cytochrome-oxidase (Cyt-ox) were calculated using Eq. 2 by a multi-component least square regression fitting procedure. For the fitting procedure the extinction coefficients of the chromophores were smoothed with a gliding average to account for the limited experimental spectral resolution of 20 nm. Changes in Cyt-ox, although included in the fitting procedure, were not reported in this article because the changes did not correspond with any physiologic parameter underlying the fMRI BOLD signal.
Stimulus presentation for the acoustically cued saccades was the same as described above for the fMRI setup, except that subjects were sitting in a comfortable position and his or her head was wrapped with a dark cloth to avoid detection of any ambient light. Acoustic cues were presented through stereo headphones with a frequency of 2 Hz (study B.1) or frequencies of 1.6, 2.0, and 2.3 Hz (study B.2) to test the frequency dependence of the evoked oxygenation changes. Sixteen seconds of saccadic eye movements alternated with a rest period of 32 seconds in each experiment. Each subject completed 16 cycles of stimulation and control condition in study B.1 for each paradigm. Each subject completed 8 stimulation cycles for each frequency in study B.2.
As a control condition, after dark adaptation subjects were exposed to a reversing green-red checkerboard (10 Hz) displayed on a computer monitor placed 0.6 m from the subject at eye level alternating with a blank screen (12 cycles of 30 second stimulation and 30 seconds rest). In study B.2, data from the optode position showing the highest correlation to this visual activation paradigm were analyzed.
In study B.2, after averaging consecutive cycles in the single subjects, the mean concentration changes were calculated by subtracting the mean of a 20-second time window during rest from the mean of a 10- to 20-second time window of maximum response. The calculated changes were then plotted against the respective saccade frequencies.
RESULTS
Functional magnetic resonance imaging (study A)
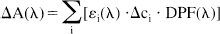
Comparing saccade epochs (ON) with the control period (OFF) revealed signal decreases bilaterally in occipital poles corresponding to V1/V2 and extrastriate visual areas in 6 out of the 10 subjects, whereas analysis of the other 4 subjects did not show any signal changes in the occipital cortex. Figure 1 exemplifies signal intensity decreases above a threshold of P = 0.0001—indicated in pseudocolor (Kolmogorov-Smirnov statistics)—in Asymmetric Spin Echo for a single subject.
Signal intensity decreases in T2* weighted asymmetric spin echo images (study A). Adjacent slices (6mm, skip 1 mm) parallel to the calcarine fissure from rostral
Near-infrared spectroscopy
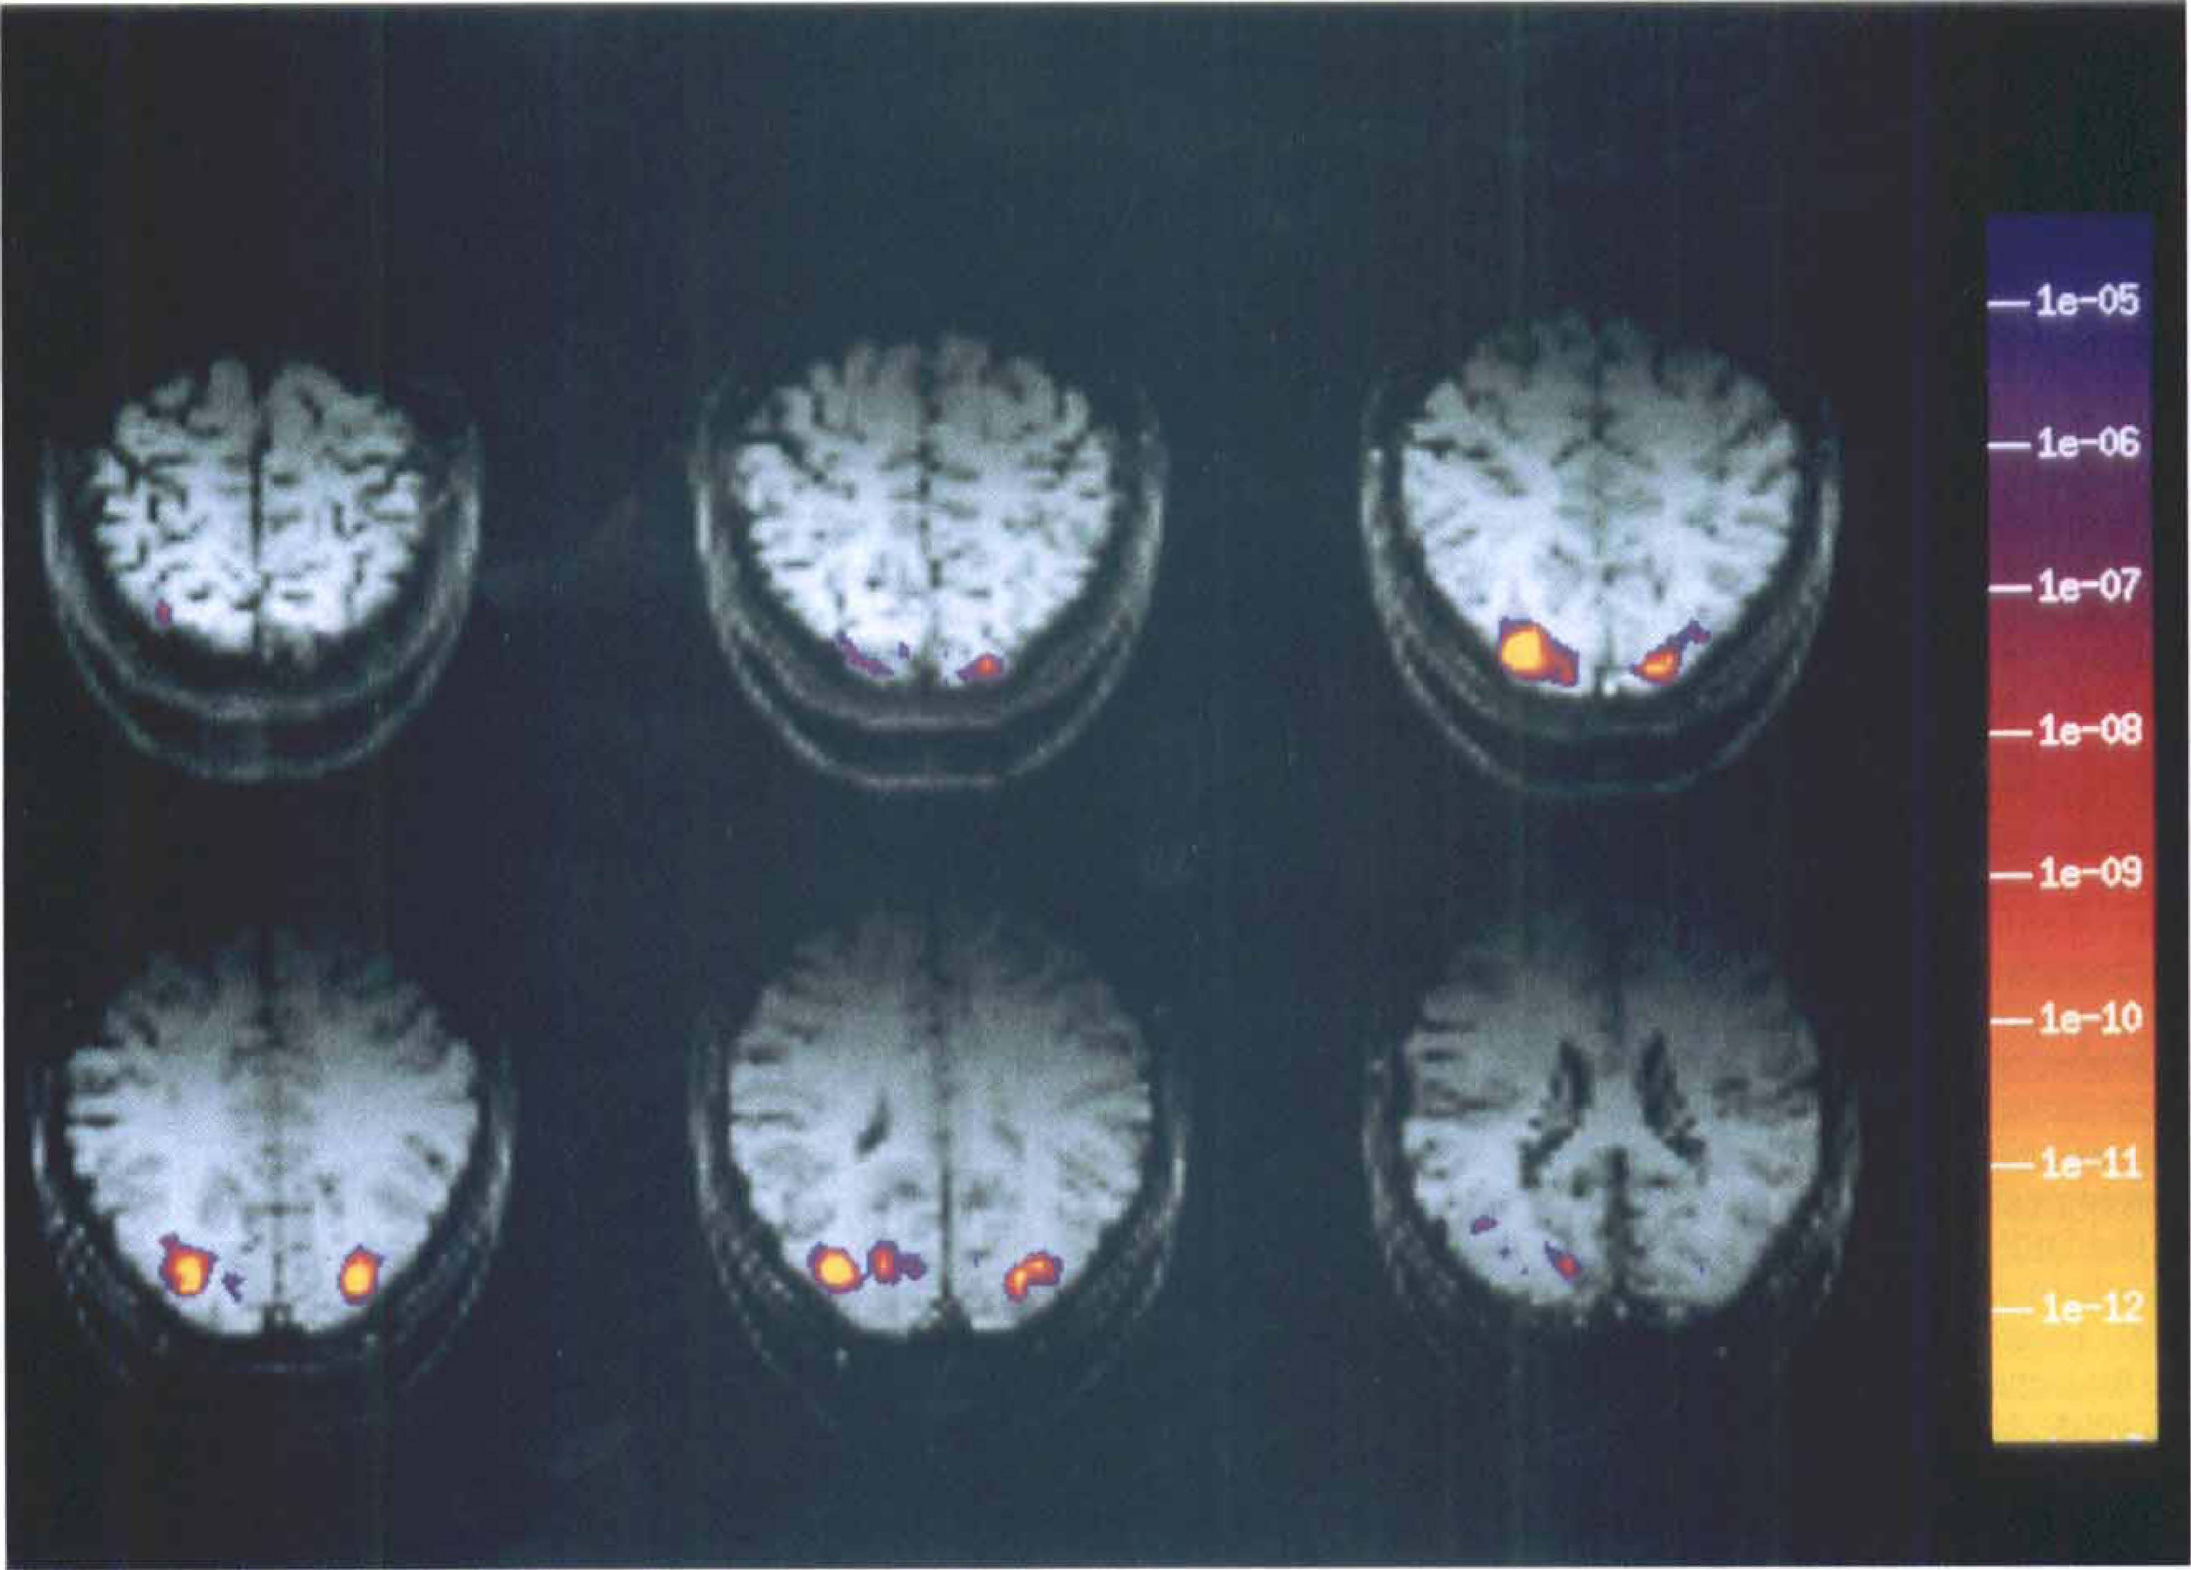
Time courses of [oxy-Hb] and [deoxy-Hb] during visual stimulation and performance of acoustically cued saccades (2 Hz). The figure gives the grand average over 11 subjects (error bars = SEM). Note the rise in [oxy-Hb] and the drop in [deoxy-Hb] with visual activation as opposed to the reversed pattern (decrease in [oxy-Hb], increase in [deoxy-Hb]) during performance of acoustically cued saccades. Changes in [oxy-Hb] and [deoxy-Hb] are given in μmol/L. The grey bars denote 16 seconds of visual stimulation and saccadic eye movements, respectively.
An increase [in oxy-Hb] and a decrease in [deoxy-Hb] during visual stimulation was present in all of the 11 subjects analyzed. The average [oxy-Hb] increase of 0.17 ± 0.05 μmol/L (± SEM) was statistically significant (P = 0.003, paired samples t-test, two-tailed, 10 degrees of freedom; compare Fig. 3). The mean change in [deoxy-Hb] was −0.23 ± 0.04 μmol/L (P < 0.001; compare Fig. 3).
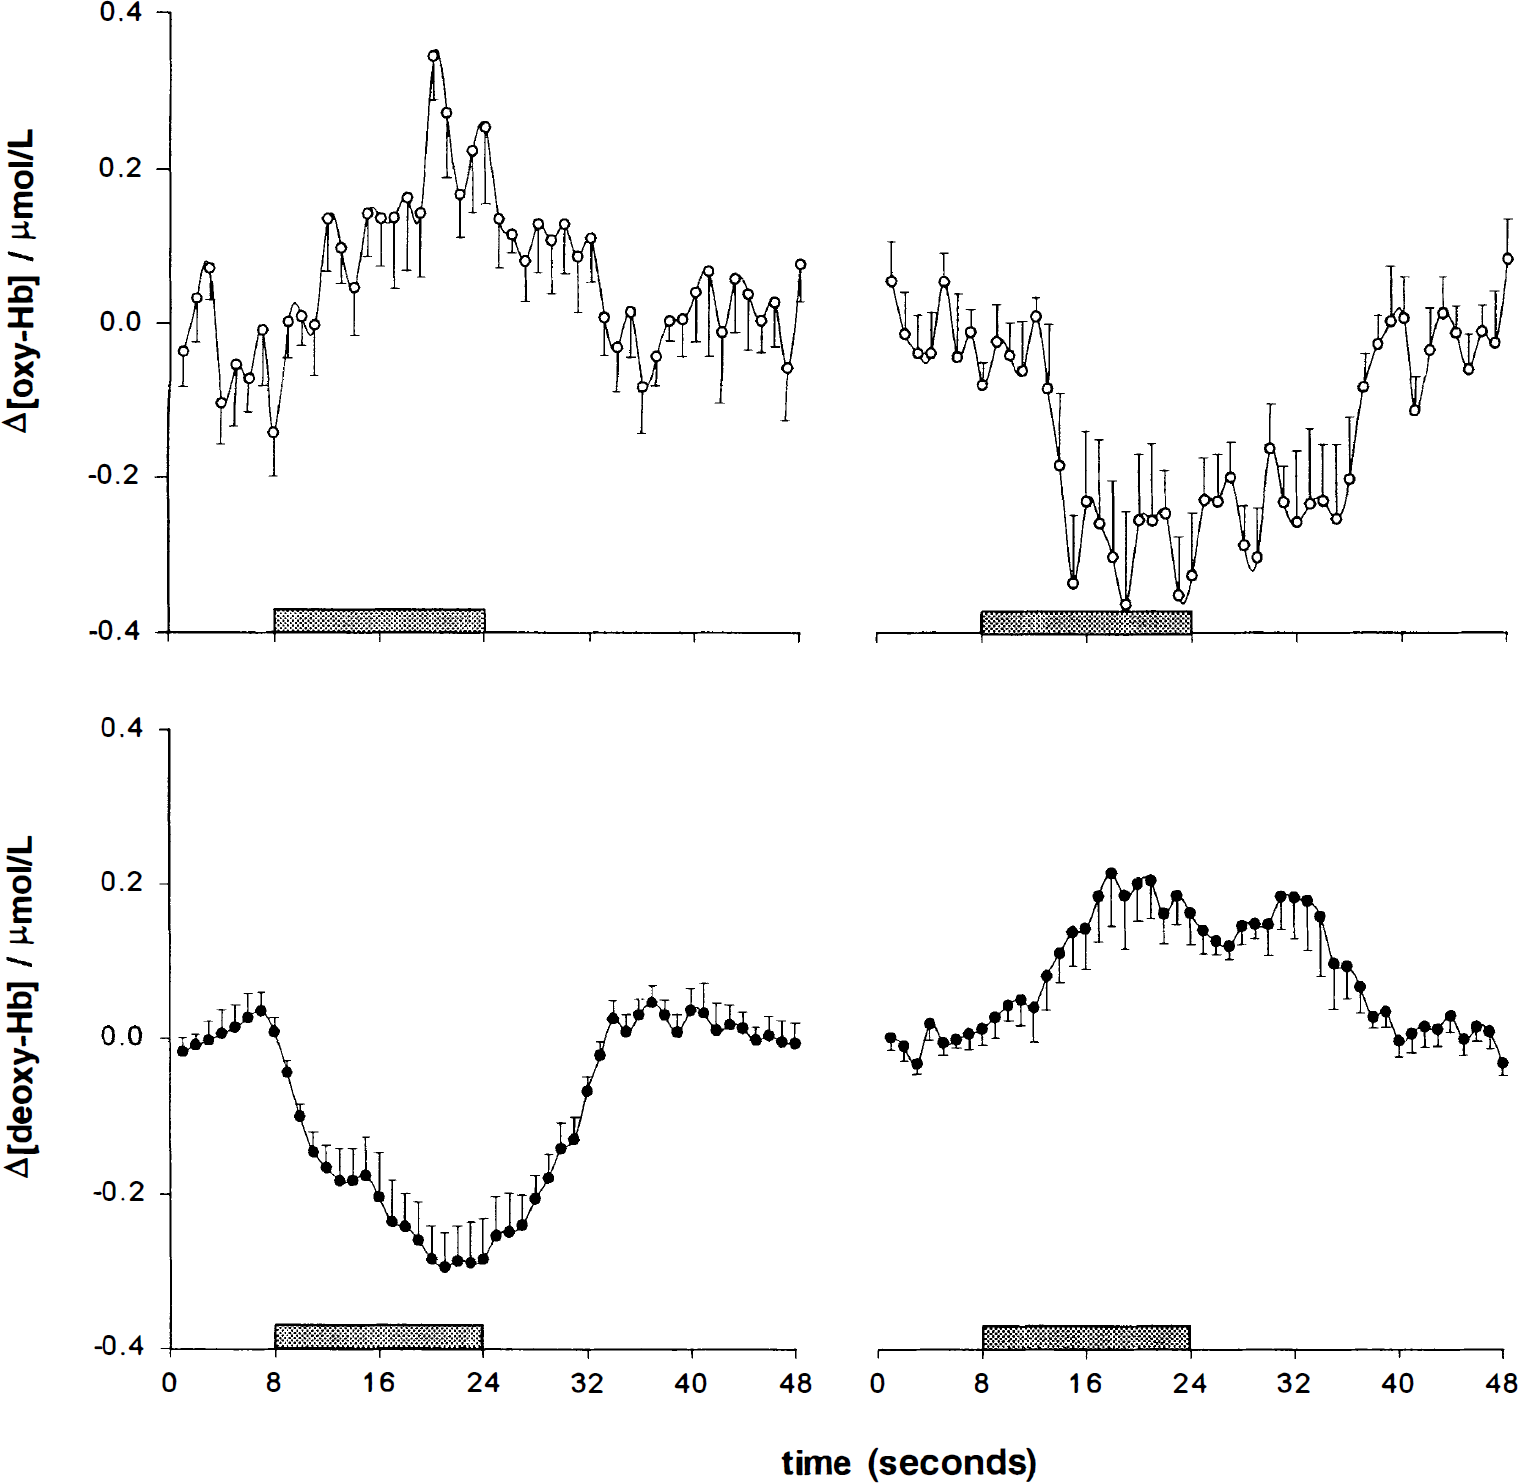
Mean concentration changes in oxy-Hb and deoxy-Hb during visual stimulation and performance of acoustically triggered saccades (n = 11). During visual stimulation a mean increase in [oxy-Hb] of 0.17 ± 0.05 μmol/L (mean ± SEM; P = 0.003), and a mean decrease in [deoxy-Hb] of −0.23 ± 0.04 μmol/L (P < 0.001) occurred; whereas during execution of acoustically triggered saccades a decrease in [oxy-Hb] −0.21 ± 0.04 μmol/L (P = 0.001), and an increase in [deoxy-Hb] 0.14 ± 0.03 μmol/L (P < 0.001) was observed. The differences between the conditions (Δ[oxy-Hb] = −0.38 μmol/L; Δ[deoxy-Hb] = 0.37 μmol/L) were statistically significant (P < 0.001 for both, paired t-test, two-tailed, 10 degrees of freedom).
Figure 3 compares the mean concentration changes during the two paradigms. The observed differences in [oxy-Hb] (Δ[oxy-Hb] = −0.38 μmol/L) and in [deoxy-Hb] (Δ[deoxy-Hb] = 0.37 μmol/L) were statistically significant (P < 0.001 for both, paired t-test, two-tailed, 10 degrees of freedom).
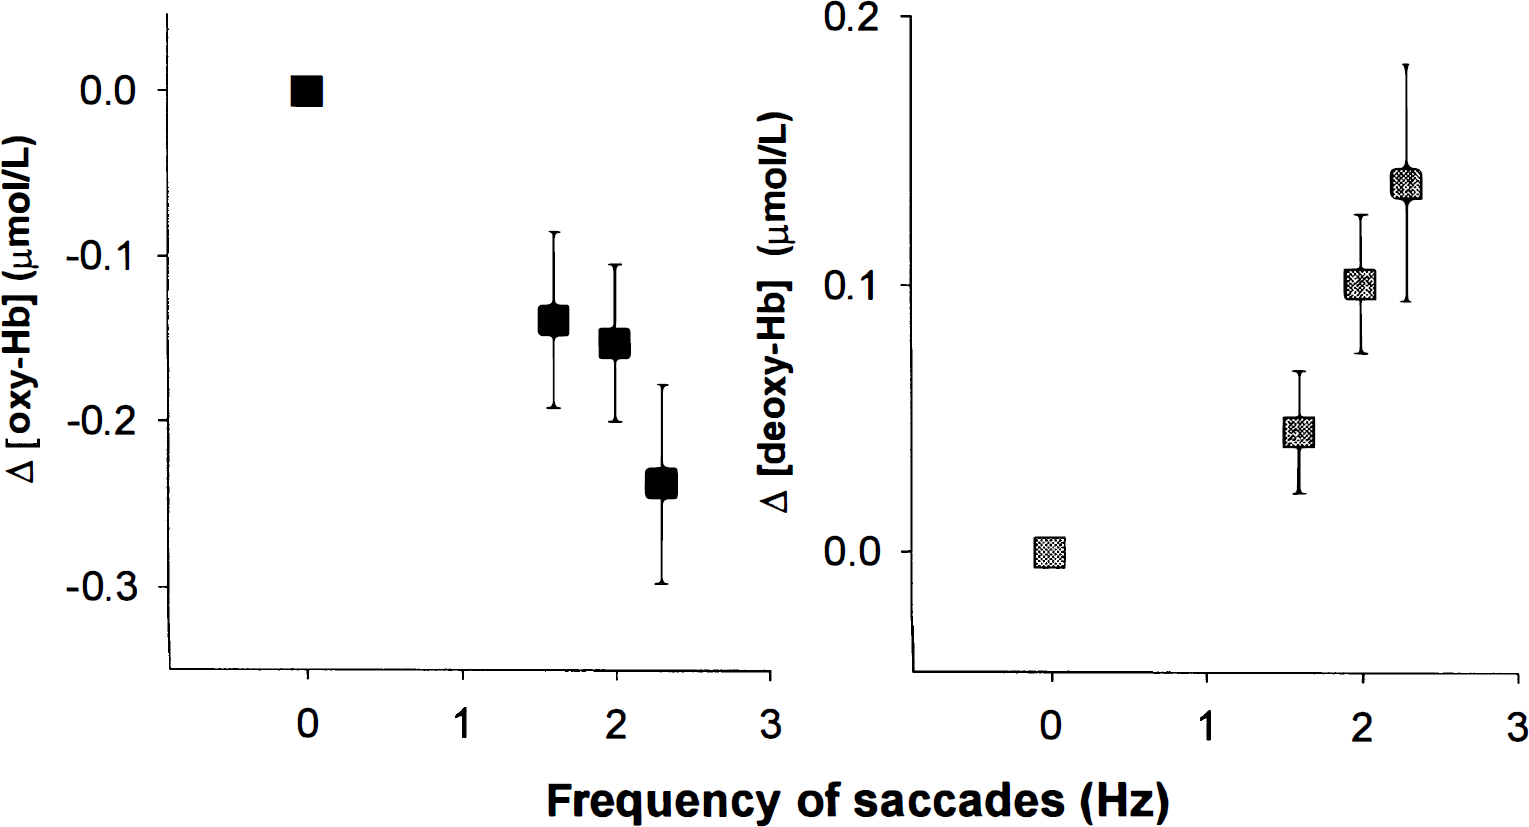
Mean [deoxy-Hb] (n = 7) and [oxy-Hb] (n = 5) responses averaged over subjects and plotted against the different frequencies. Error bars = SD.
DISCUSSION
We observed localized signal decreases bilaterally in the occipital cortex in fMRI Asymmetric Spin Echo images during the performance of acoustically cued saccades in darkness. The localization was in accordance with a previous PET study using O–15 labeled water for the determination of CBF changes (Paus et al., 1995). Using a similar paradigm, the previous PET study showed decreases in CBF at the same localization in the occipital cortex in which we observed signal decreases in fMRI. The authors attributed these blood flow decreases to a phenomenon known from the psychophysiologic and neurophysiologic literature as saccadic suppression. In single cell recordings, Duffy and Burchfiel (1975) reported attenuation of background activity in striate visual cortex neurons related to saccades. We suggest that the observed signal decreases in our fMRI study were related to saccadic suppression and corresponded to a decrease in neuronal activity.
It should be noted that, in the study of Paus et al. (1995) and in the current study, the observed CBF changes or signal changes, respectively, were relatively small. Also, Duffy and Burchfiel (1975) found only a subtle attenuation of the neuronal background activity in striate neurons in relation to saccades. The modulatory effect may be particular to location specific neurons. This may present as a problem of sensitivity and may explain the negative findings in 4 of the 10 subjects investigated. However, a specific effect is consistent with psychophysical data as saccadic suppression mainly affects visual processing along the magnocellular visual stream (Burr et al., 1994).
Because signal intensity increases in BOLD images are allegedly evoked by deoxy-Hb decreases (Ogawa et al., 1990; Kwong et al., 1992; Bandettini et al., 1992; Frahm et al., 1992; Ogawa et al., 1993), the observed drop in signal intensity may reflect an increase in [deoxy-Hb]. Analogous to hyperoxygenation, serving as an explanation for [deoxy-Hb] decreases during increased brain activity (Fox and Raichle, 1986; Fox et al., 1988; Buxton and Frank, 1997), this fMRI finding suggested a focal hypooxygenation during decreased brain activity. Although, it should be kept in mind that fMRI is an indirect method and [deoxy-Hb] is just one of a number of factors—for example, intrinsic T2, flow, and diffusion—influencing signal intensity. Hence, the necessity arises for collecting further evidence for the interpretation of the observed signal decreases as increases in deoxy-Hb reflecting transient hypooxygenation with an independent method. In a second study employing the same paradigm as in the fMRI experiment, we used NIRS to directly measure changes in [deoxy-Hb]. [Oxy-Hb], a second parameter provided by this method, and [deoxy-HB] together allowed for a judgment on changes in blood oxygenation. The sum of both, total hemoglobin, was an estimate for the corpuscular blood volume assuming a constant relation between hemoglobin concentration and erythrocyte volume. The localization of the regions with decreased signal intensity in the fMRI study at the occipital pole made them easily accessible for functional NIRS. We were able to demonstrate that, in contrast to an increase in [oxy-Hb] and a decrease in [deoxy-Hb] during a standard visual stimulation, at the same optode position during performance of acoustically cued saccades the opposite pattern (decrease of [oxy-Hb], increase of [deoxy-Hb]) occurred. The concentration of total hemoglobin decreased significantly during performance of saccades. The increase in [deoxy-Hb], paralleled by a decrease in [oxy-Hb], proved focal hypooxygenation as opposed to the hyperoxygenation that was seen during activation.
Because the fMRI (study A) and the first NIRS study (B.1) compare two different conditions, it could be argued that the observed changes were not related to the saccades, rather they represented an activation in the control task. Subjects might have tried to fixate while not moving their eyes, although all experiments were performed in complete darkness. Therefore, in the third experiment (study B.2) we sought to show that the rise in [deoxy-Hb] and the drop in [oxy-Hb] was actually dependent on the performance of the saccades by altering the saccade frequency over different runs. As shown in Figs. 4A and 4B, [deoxy-Hb] was more augmented and [oxy-Hb] was more reduced with higher saccade frequencies, thus excluding a simple subtraction effect.
The next challenge was interpreting our results with respect to the issue of neuronal activity and blood flow regulation. We know that increases in neuronal activity elicit an augmentation in blood flow that is not matched by an equal increase in oxygen consumption. Buxton et al. proposed a mathematical model for the delivery of O2 to the brain that predicts that disproportionately large changes in blood flow are required to support small changes in CMRO2 (Buxton and Frank, 1997). Assuming that delivery of oxygen to brain is barrier-limited at rest and increased flow shortens the capillary transit time, a large flow increase is required to accomplish a small increase in oxygen delivery. Further, this model predicts a higher oxygen extraction fraction for decreases in flow. Our data indicates that a similar type of mismatch between flow and oxygen delivery occurs when the neuronal firing rate decreases. Cerebral blood flow during saccadic suppression must be reduced more than oxygen consumption to explain the hypooxygenation we observed. This is in accordance with a model that predicts a higher oxygen extraction fraction for reduced CBF.
Footnotes
Acknowledgments
The authors thank Terrance Campbell and Mary Foley for technical assistance, and Bruce Rosen for collaboration, support, and discussion.