
Abstract
Chronic brain atrophy after traumatic brain injury (TBI) is a well-known phenomenon, the causes of which are unknown. Early nonischemic reduction in oxidative metabolism is regionally associated with chronic brain atrophy after TBI. A total of 32 patients with moderate-to-severe TBI prospectively underwent positron emission tomography (PET) and volumetric magnetic resonance imaging (MRI) within the first week and at 6 months after injury. Regional lobar assessments comprised oxidative metabolism and glucose metabolism. Acute MRI showed a preponderance of hemorrhagic lesions with few irreversible ischemic lesions. Global and regional chronic brain atrophy occurred in all patients by 6 months, with the temporal and frontal lobes exhibiting the most atrophy compared with the occipital lobe. Global and regional reduction in cerebral metabolic rate of oxygen (CMRO2), cerebral blood flow (CBF), oxygen extraction fraction (OEF), and cerebral metabolic rate of glucose were observed. The extent of metabolic dysfunction was correlated with the total hemorrhage burden on initial MRI (
Introduction
Traumatic brain injury (TBI) is a major cause of death and severe morbidity worldwide (Langlois et al, 2003). It results in immediate cellular death in a limited region of the brain directly involved in the insult, usually a brain contusion, while creating a more widespread state of metabolic dysfunction in remote areas of the brain (Feeney and Baron, 1986). Secondary cell loss takes the form of chronic diffuse atrophy in regions not directly involved in the primary injury or adjacent to the primary contusion (Marcoux et al, 2008). Chronic brain atrophy has been correlated with poor neurologic outcome (Sidaros et al, 2009) and seems to be progressive over a period ranging from months to years after the injury. The causes of atrophy are not well understood, and thereby limit efforts to secondarily prevent the process. This paper investigates the potential role of brain metabolism in the first week after injury in chronic brain atrophy.
Volumetric magnetic resonance imaging (MRI) studies of chronic TBI (Sidaros et al, 2009; Trivedi et al, 2007; Levin et al, 2000; Tate and Bigler, 2000; Verger et al, 2001; Yount et al, 2002) have reported that global and regional brain atrophy occurs over a period ranging from months to years after the injury. This atrophy seems to be dependent on the extent of the initial injury, can involve important structures such as the hippocampus, and correlates with deficits in long-term cognitive performance (Wilde et al, 2005; Levine et al, 2008). The mechanisms involved in this chronic atrophy have not been well studied. In an initial study (Marcoux et al, 2008), our group at UCLA (University of California at Los Angeles) evaluated the role of early metabolic dysfunction on subsequent brain atrophy. The principal finding was that the duration of persistent metabolic crisis as measured by the elevated lactate– pyruvate ratio is associated with the extent of regional frontal lobe atrophy. This result suggested that early brain metabolism was one determinant factor in chronic brain atrophy.
These results led us to hypothesize that the extent of regional brain atrophy is related to that of metabolic dysfunction, specifically to the reduction in oxidative metabolism. To investigate this possibility, we prospectively evaluated multiple lobar regions of the brain using positron emission tomography (PET) combined with volumetric MRI performed during the initial week after TBI, and compared these measures using coregistration techniques with chronic volumetric MRI in a within-subjects design.
Materials and methods
Patient Population
This study was approved by our Institutional Review Board and was conducted as part of the UCLA Brain Injury Research Center in patients with TBI. The main inclusion criteria were as follows: (1) a Glasgow Coma Scale (GCS) score of ≤8 or a GCS of 9 to 15 with computerized tomography brain scans showing intracranial bleeding; (2) sufficient medicophysiologic stability to perform PET and MRI scans in the acute period; (3) follow-up MRI 6 months after the primary injury; and (4) image quality sufficient for evaluation. Surrogate informed consent was obtained. A total of 32 patients were enrolled and subsequently studied with PET, as well as acute and long-term MRI. In all, 12 age-matched uninjured volunteers were also recruited for comparison.
General Management Protocol
The management protocol was outlined previously (Vespa et al, 2005). Briefly, all patients were admitted to the neuro-intensive care unit after initial stabilization in the emergency room or after surgery. Craniotomies were performed for evacuation of intracranial mass lesions and hematomas. Intracranial pressure (ICP), measured by ventriculostomy, was maintained below 20 mm Hg using a standardized treatment protocol including head of bed up to 301, mild hyperventilation (PaCO2 = 30 to 35 mm Hg), external ventriculostomy with cerebrospinal fluid drainage, moderate sedation with low doses of propofol, normoglycemia (80 to 120 mg/dL), and maintenance of mild hypernatremia (sodium = 140 to 145 mmol/L). Refractory ICP was managed by pentobarbital-induced burst suppression coma. Cerebral perfusion pressure was kept above 60 mm Hg with volume repletion and vasopressors. Continuous jugular venous oxygen saturation was monitored and kept at 60% to 70% through adjustments in cerebral perfusion pressure. Continuous electroencephalographic monitoring was performed to assess the presence of seizure activity and to monitor the effect of barbiturates when burst suppression was induced.
Positron Emission Tomography Protocol
Positron emission tomography was performed using a quantitative method described previously (Bergsneider et al, 2001; Wu et al, 2004). Patients were placed in the scanner and physiologic monitoring of ICP, end-tidal CO2, arterial blood gases, arterial blood pressure, continuous electroencephalography, core temperature, and heart rate were monitored using a portable intensive care unit monitoring system. These physiologic parameters were kept similar to those present in the intensive care unit. Intracranial pressure was kept under 20 mm Hg, CO2 was kept at 30 to 34 mm Hg, and temperature was maintained between 37.0°C and 37.6°C. Patients underwent serial O-15 PET scans (C15O, O15O, H215O) using dynamic blood sampling to determine regional cerebral blood flow (CBF, expressed as ml per (100 g/min)), oxygen extraction fraction (OEF, %), and cerebral metabolic rate of oxygen (CMRO2, ml per (100 g/min)). Images of OEF were generated using the initial 5 mins of the O15O study and were assessed by a compartmental model for oxygen that accounts for recirculated H215O (Ohta et al, 1992). The O15O raw images (voxel size: 1.471 × 1.471 × 2.45 mm3) were smoothed using a three-dimensional filter (in plane full-width at half-maximum = 2.942 mm, axial full-width at half-maximum = 2.45 mm) before OEF images were generated on a voxel basis. This was followed by a 2-Deoxy-2-[18F] fluoro-D-Glucose PET scan obtained using a quantitative technique for the calculation of the regional cerebral metabolic rate of glucose (CMRglc, mg per (100 g/min)). Each brain PET scan contained 63 slices, and each brain lobe contained 20 to 30 slices. Coregistration with volumetric MRI was accomplished using a six-parameter rigid-body transformation program and visual evaluation (Lin et al, 1994) with realignment and partitioning. Four slices with equal intervals were selected, and the regions of interest (ROIs) of the brain lobe were drawn manually with the contusion areas excluded (Figure 1). The Means of the ROIs over four planes were calculated as lobe metabolic parameters. All analyses were carried out using Janus Program version 6.3 (Los Angeles, CA, USA; http://149.142.143.7/BIRC/INDEX.HTML).
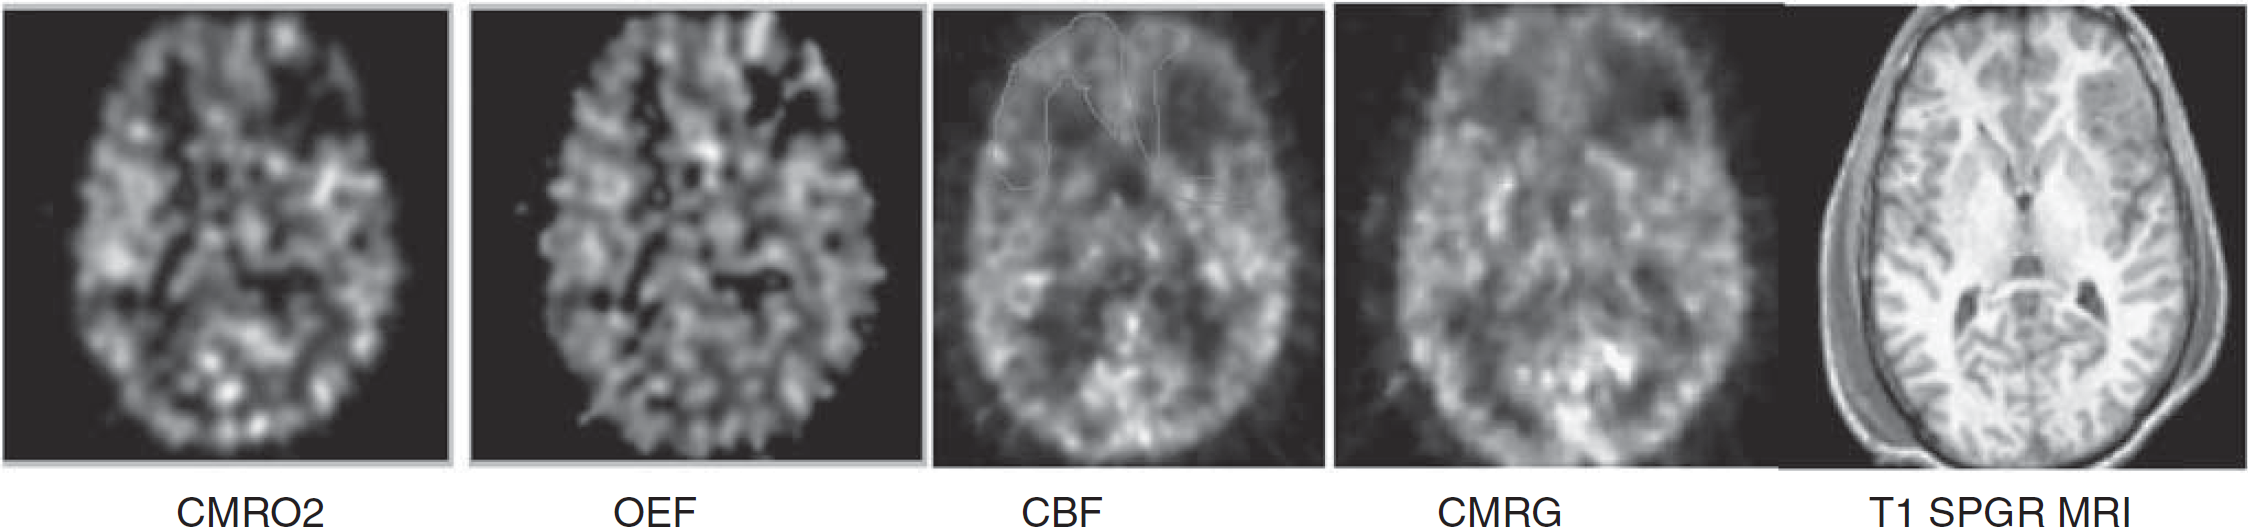
Comparison of coregistered acute MRI and PET images used for analysis. Regions of interest (ROIs) for each lobe were hand drawn for PET and MRI. An example of a single-slice ROI of the frontal lobe was drawn on the cerebral blood flow image to exclude the contusion on the left. CMRO2, cerebral oxidative rate of oxygen; OEF, oxygen extraction fraction; CBF, cerebral blood flow; CMRG, cerebral metabolic rate of glucose.
Imaging and Volumetric Analysis
Acute and chronic (6-month) MRI studies were conducted using a Siemens Sonata 1.5 T MRI unit (Siemens, Munich, Germany). Acute and chronic MRI scans included volumetric T1-weighted MP-RAGE (Magnetization-Prepared Gradient Echo) imaging (MP-RAGE: TR (repetition time) 1,900 msecs, echo time (TE) 3.5 msecs, FOV (field of view) 256 × 256, 1 mm slice thickness), axial FLAIR (fluid-attenuated inversion recovery imaging) (FLAIR: TR 9,590 msecs, TE 70 msecs, FOV 512 × 384, slice thickness 3 mm), axial diffusion weighted imaging (DWI: TR 6,000 msecs, TE 105 msecs, FOV 96 × 128, 7 mm slice,
Volumetric T1-weighted MR images were analyzed using the following process. For lobar volume analysis, lobar ROIs were drawn using home-written plug-in software for ImageJ (NIH, Bethesda, MD, USA) 1.37 v (http://rsb.info.nih.gov)—- to perform semi-automated lobar segmentation. Brainsuite Software (UCLA, Los Angeles, CA, USA) (Shattuck and Leahy, 2002) was used for final three-dimensional visualization. Images obtained using FLAIR were used to identify and exclude contusions. An ROI of each lobe was created using each of the relevant slices from the T1-weighted volume image. The dura mater, superior sagittal sinus, blood vessels, cranial nerves, and choroid plexus were excluded. Contusions were also excluded. Lobar boundaries were defined using a standard approach (Hayman, 1992) and an anatomic atlas (http://www.med.harvard.edu/AANLIB/cases/caseNA/pb9.htm). Examples of frontal lobe ROIs are provided in Figure 2. Lobar volumes were then determined using ImageJ, which counted the volume elements (voxels) in each lobar ROI, and multiplied by the voxel volume. Lobar volume measurements in chronic MRI were performed in the same manner, except that lobar ROIs from the acute study were used as a qualitative guide to exclude primary contusions. The primary contusion was judged to be the region containing a GRE hypointense lesion with a volume > 1 cm3. To accommodate for inherent shift, due to reabsorbing blood and resolving macroscopic edema, careful attention was paid to anatomic landmarks, including the septum pellucidum, pineal gland, falx cerebri, sylvian fissure, and central sulcus. In this manner, a consistent verification of lobar geographic limits was maintained. An independent physician radiology expert blinded to the clinical data performed the volumetric measurements.
Example of ROI drawing for volume analysis. A two-example series of manual ROIs drawn using a stereotactic atlas (
To control for brain edema, a separate independent computational approach used LONI Pipeline Software (UCLA, Los Angeles, CA, USA) (http://www.loni.ucla.edu/Software/Pipeline) as described by Dinov et al (2009) to measure whole brain volume for both acute and chronic time points in the patient and control groups. Volumetric T1-weighted MP-RAGE images were processed using an automated pipeline that (1) extracted brain volumes from the skull and scalp, (2) classified tissue voxels as background, normal gray matter (NGM), normal white matter or cerebrospinal fluid, and (3) measured brain volume as the sum of the normal gray matter and normal white matter voxel volumes. Images of the automatically generated volumes were manually checked for proper processing.
A search for acute ischemic injury occurring up to the time of MRI was conducted using a structured visual scoring approach for analysis of the DWI-ADC and GRE images. For this analysis, DWI-ADC and GRE image volumes were coregistered and all ADC hypointense lesions > 0.1 cm in diameter were visually identified. An ischemic lesion was defined as any lesion with > 0.1 cm diameter, which showed ADC reduced to a threshold of ≤550 μm2/sec without a reduction in GRE signal intensity. Diffuse axonal lesions were defined as lesions > 0.1 cm in diameter in which ADC was ≤550 μm2/sec with GRE hypointensity. Lesions having hyperintense FLAIR signal and ADC increase in the absence of GRE hypointensity were considered ischemic lesions that had progressed beyond the acute stage. This criterion provided the highest possible sensitivity for detecting ischemic lesions. The ischemic lesion burden was determined for each subject. A specific search was conducted for DWI-ADC lesions in the border zone regions of the anterior and middle cerebral arteries, specifically to address small vessel ischemia that may have been precipitated during the early posttraumatic period because of to elevated ICP, hypotension, or hypoxemia.
Outcome Measures
Patients were contacted monthly by telephone by the study nurse to assess recovery status over a course of 6 months. Patients were also tested in person at 6 months using the GOS-e (extended Glasgow Outcome Scale) (Wilson et al, 1998).
Statistical Analysis
Statistical procedures were conducted using R version 2.9.1 (R Development Core Team, 2009). Statistical computations included mixed model analyses as well as Pearson's correlations and both conventional and robust
Results
Patient Characteristics
A total of 32 patients were studied, with 28 men and 4 women. The mean age was 33 ± 15 years. The GCS distribution was skewed with 22/32 GCS total scores of > 8. The mechanism of injury was blunt injury in most cases, with 22 motor vehicle accidents (69%) (including pedestrian or bicyclist hit by car), 6 falls (19%), 3 skateboarding accidents (14%), and 1 gunshot case (3%). Contusion with or without hematoma was found in 18 patients, contusion combined with subdural hematoma in 11, and contusion combined with epidural hematoma in 2 patients. Diffuse axonal shear hemorrhages were present in 30 cases. The PET study was conducted at a median of 5 days after trauma, acute MRI at a median of 8 days, and chronic MRIs at a median of 195 days after trauma. The mean GCS best score in 8 h after admission was 8. The mean GOS-e at 6-month follow-up was 5. Overall, 12 age- and gender-matched controls (mean age 31.8, male:female ratio 12:0) were included for comparison of global brain volumes (see Table 1).
Demographic and longitudinal monitoring data
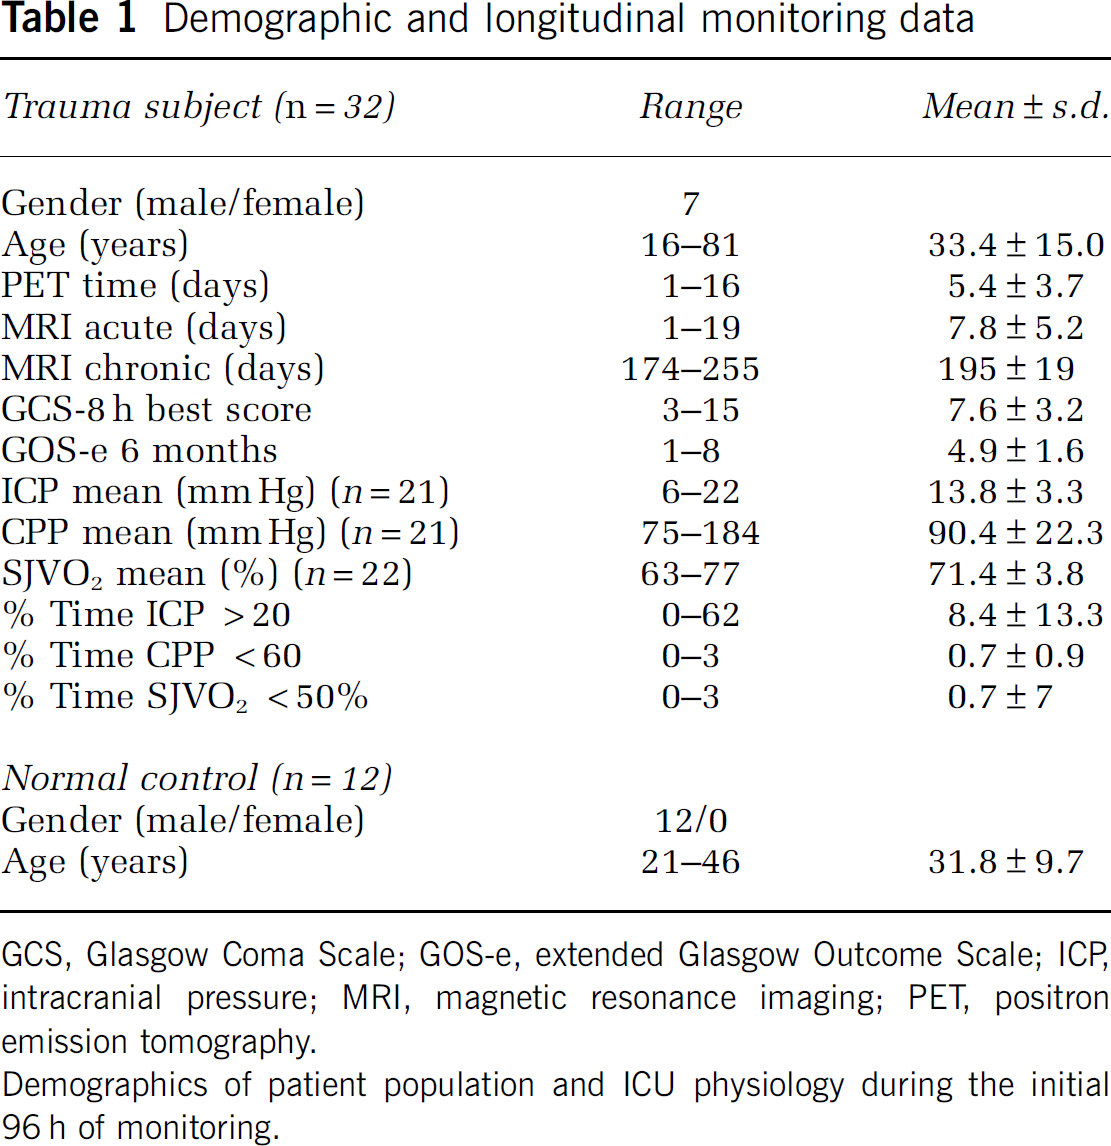
GCS, Glasgow Coma Scale; GOS-e, extended Glasgow Outcome Scale; ICP, intracranial pressure; MRI, magnetic resonance imaging; PET, positron emission tomography.
Demographics of patient population and ICU physiology during the initial 96 h of monitoring.
A total of 11 patients underwent surgery within 24 h after trauma to evacuate a mass lesion and 2 of them had bones removed. Overall, 21 patients had intraventricular ICP monitoring, and 22 had SJVO2 monitoring. Table 1 summarizes the demographic data of the study population and the longitudinal monitoring data with incidence of increased ICP, reduced cerebral perfusion pressure (CPP), and reduced jugular venous oxygenation (SJVO2). Mean ischemia incidence was 0.5% (SJVO2 < 50%).
Ischemic and Hemorrhagic Lesion Structural Characterization
On acute MRI, measurements of ischemic and hemorrhagic lesions were performed. Isolated ischemic DWI-ADC lesions on MRI were seen in one subject, with lesions present diffusely in the white matter, corpus callosum, and arterial border zones between the anterior and middle cerebral arteries. In the remaining patients, DWI-ADC lesions were colocalized with the hemorrhagic shear lesions seen on GRE images. The number of hemorrhagic shear lesions ranged from 2 to 50 across subjects with a mean diameter of 0.3 ± 0.2 cm. These were mostly confined to the white matter, centrum semiovale, thalamus, and the rims of extra-axial subdural hemorrhages. The DWI-ADC lesions were confined to the anatomic space of the hemorrhage in all but one case. In hemorrhagic lesions with > 5 cm3 volume, a rim-like DWI-ADC restriction was seen in three patients. Figure 3 shows a single subject with ischemic DWI-ADC, and a representative subject with the more common finding of diffuse hemorrhagic injury.
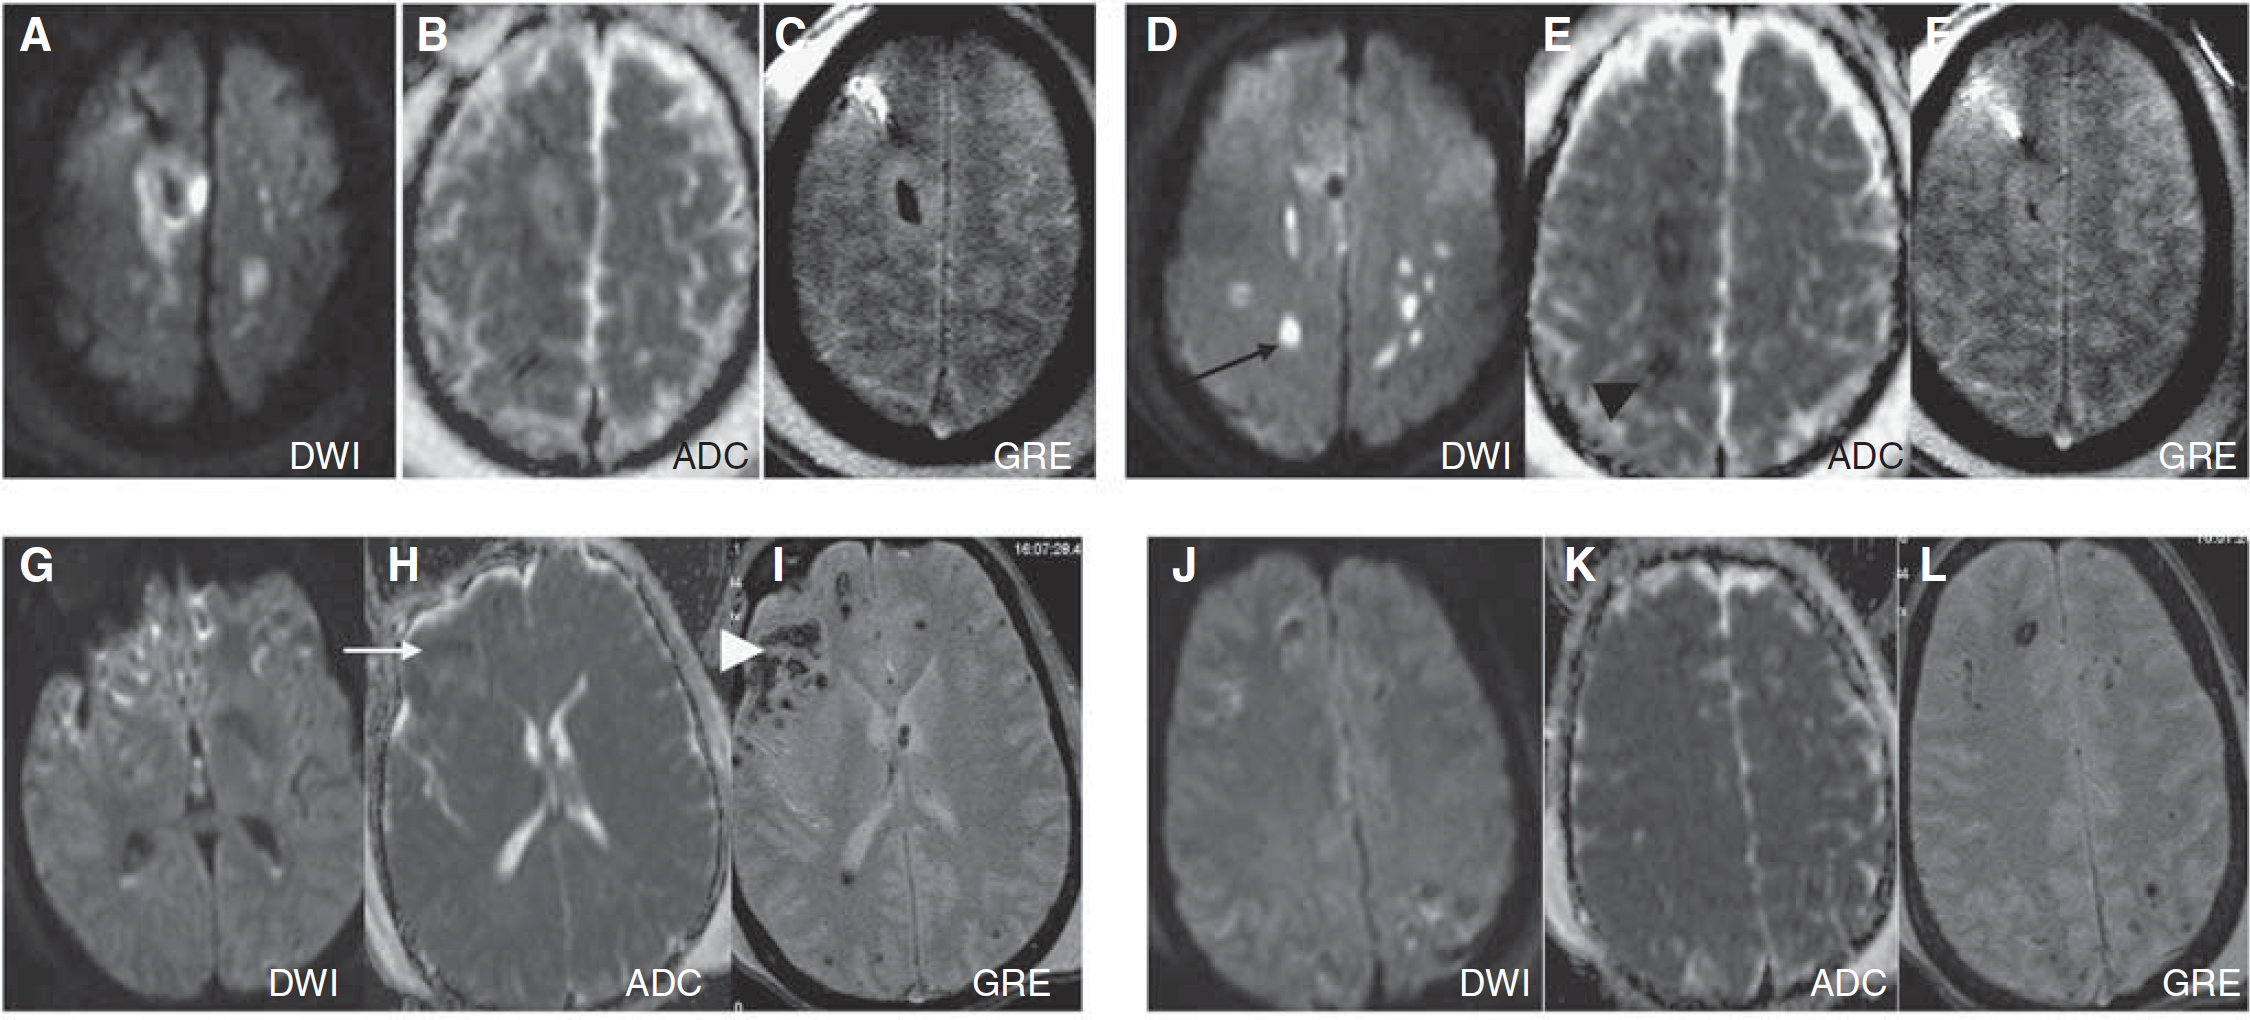
Example of structural lesion characterization: Two different patients are shown (
Cerebral Metabolism in Acute Period Detected by Positron Emission Tomography
Table 2 presents PET parameters during the acute posttrauma period. Cerebral blood flow was low in all lobes but was significantly higher in the occipital lobes compared with the frontal and temporal lobes (
Cerebral PET metabolism in acute period
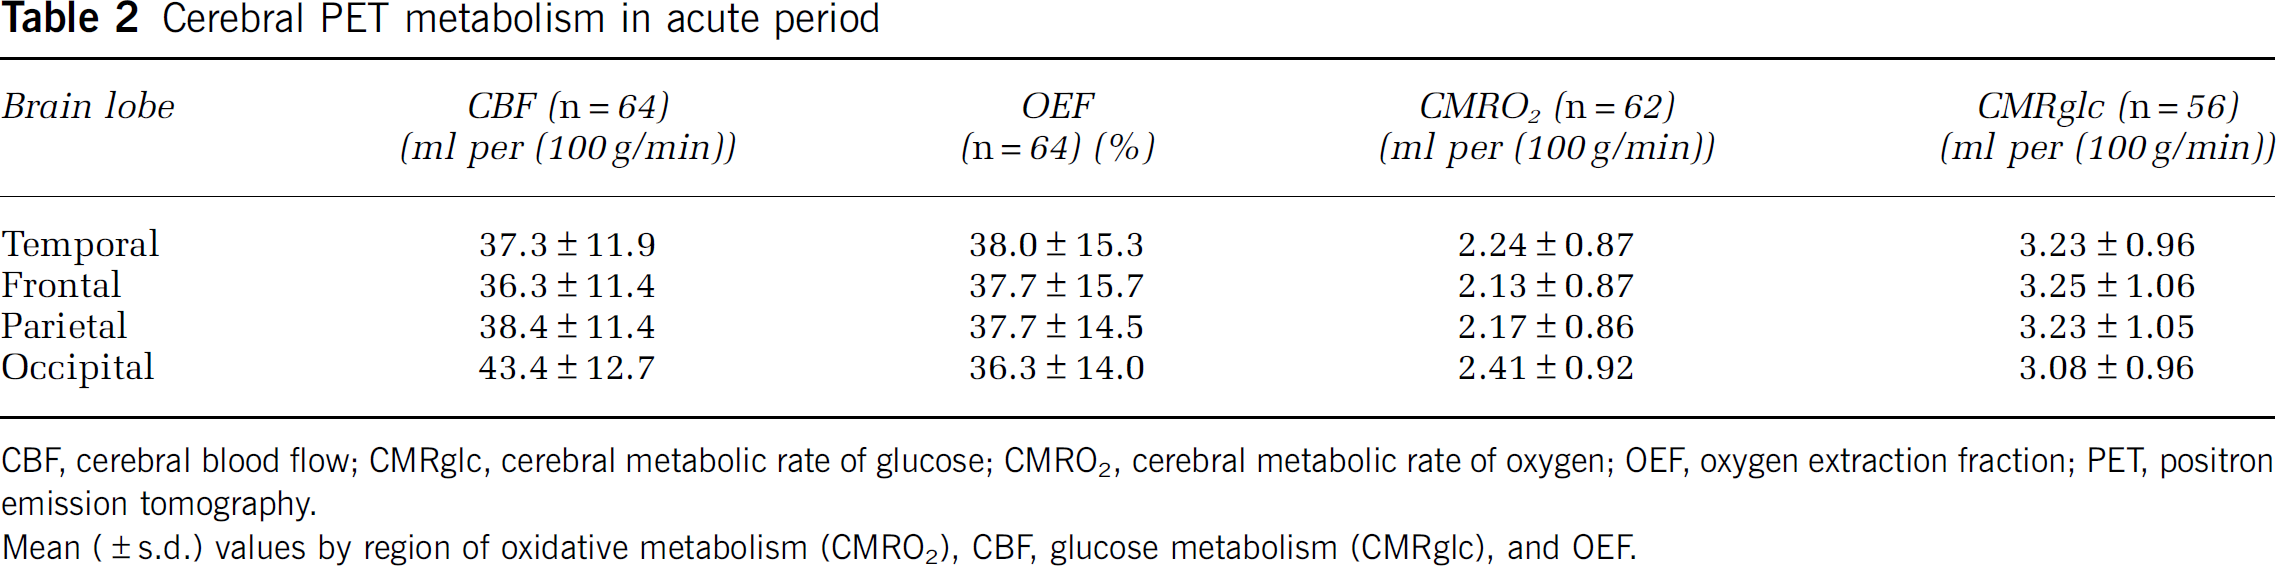
CBF, cerebral blood flow; CMRglc, cerebral metabolic rate of glucose; CMRO2, cerebral metabolic rate of oxygen; OEF, oxygen extraction fraction; PET, positron emission tomography.
Mean (±s.d.) values by region of oxidative metabolism (CMRO2), CBF, glucose metabolism (CMRglc), and OEF.
Regional and Global Brain Atrophy
The mean volumes and atrophy of the different lobes are presented in Table 3. Significant change of volume of all lobes in acute and chronic MRI (
Acute and chronic brain lobar volumes
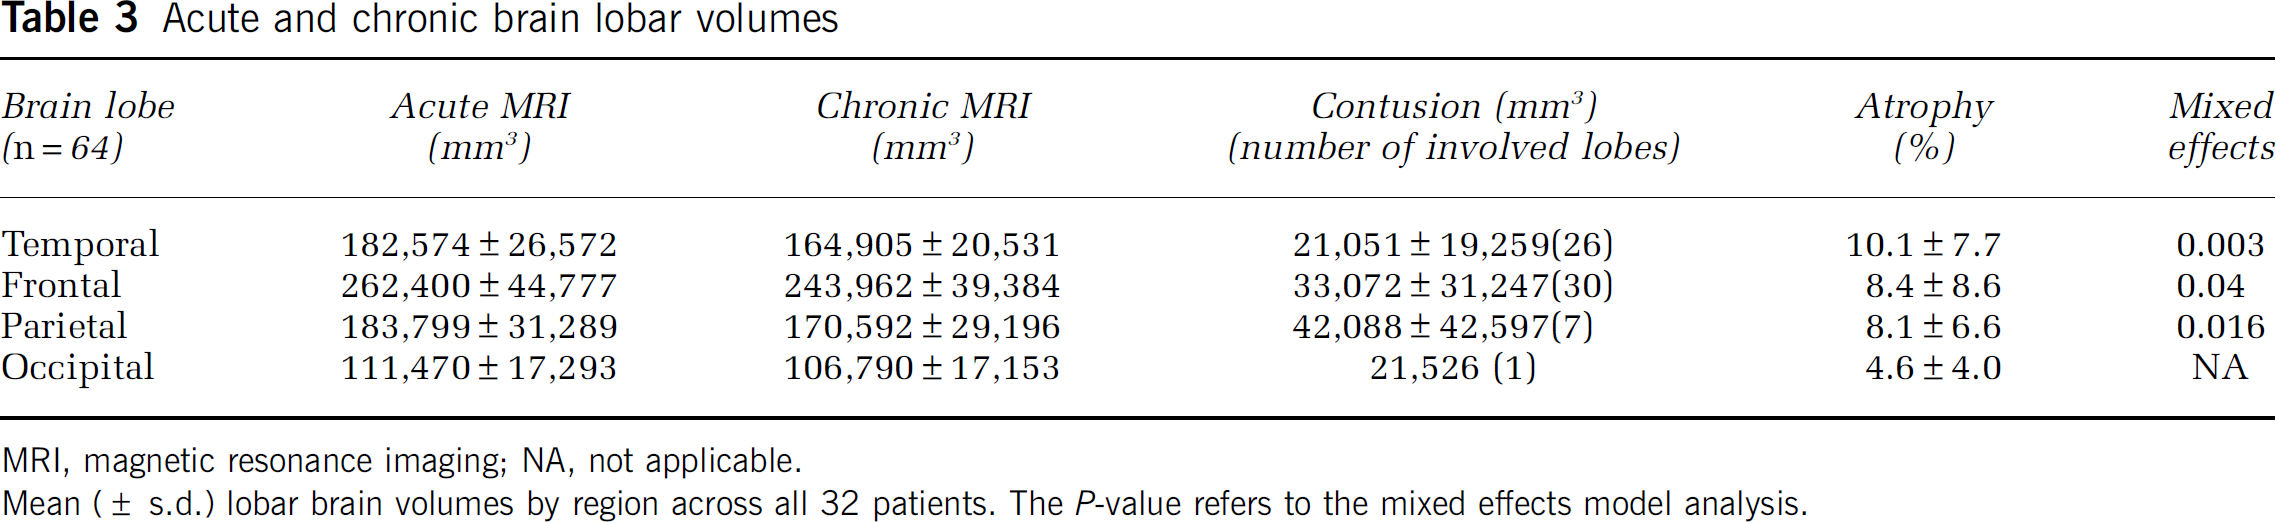
MRI, magnetic resonance imaging; NA, not applicable.
Mean (± s.d.) lobar brain volumes by region across all 32 patients. The
Univariate analysis for risk factors for regional or global brain atrophy showed that neither age, gender, initial GCS, percentage time SJVO2 < 50%, mean SJVO2, nor CPP contributed significantly (
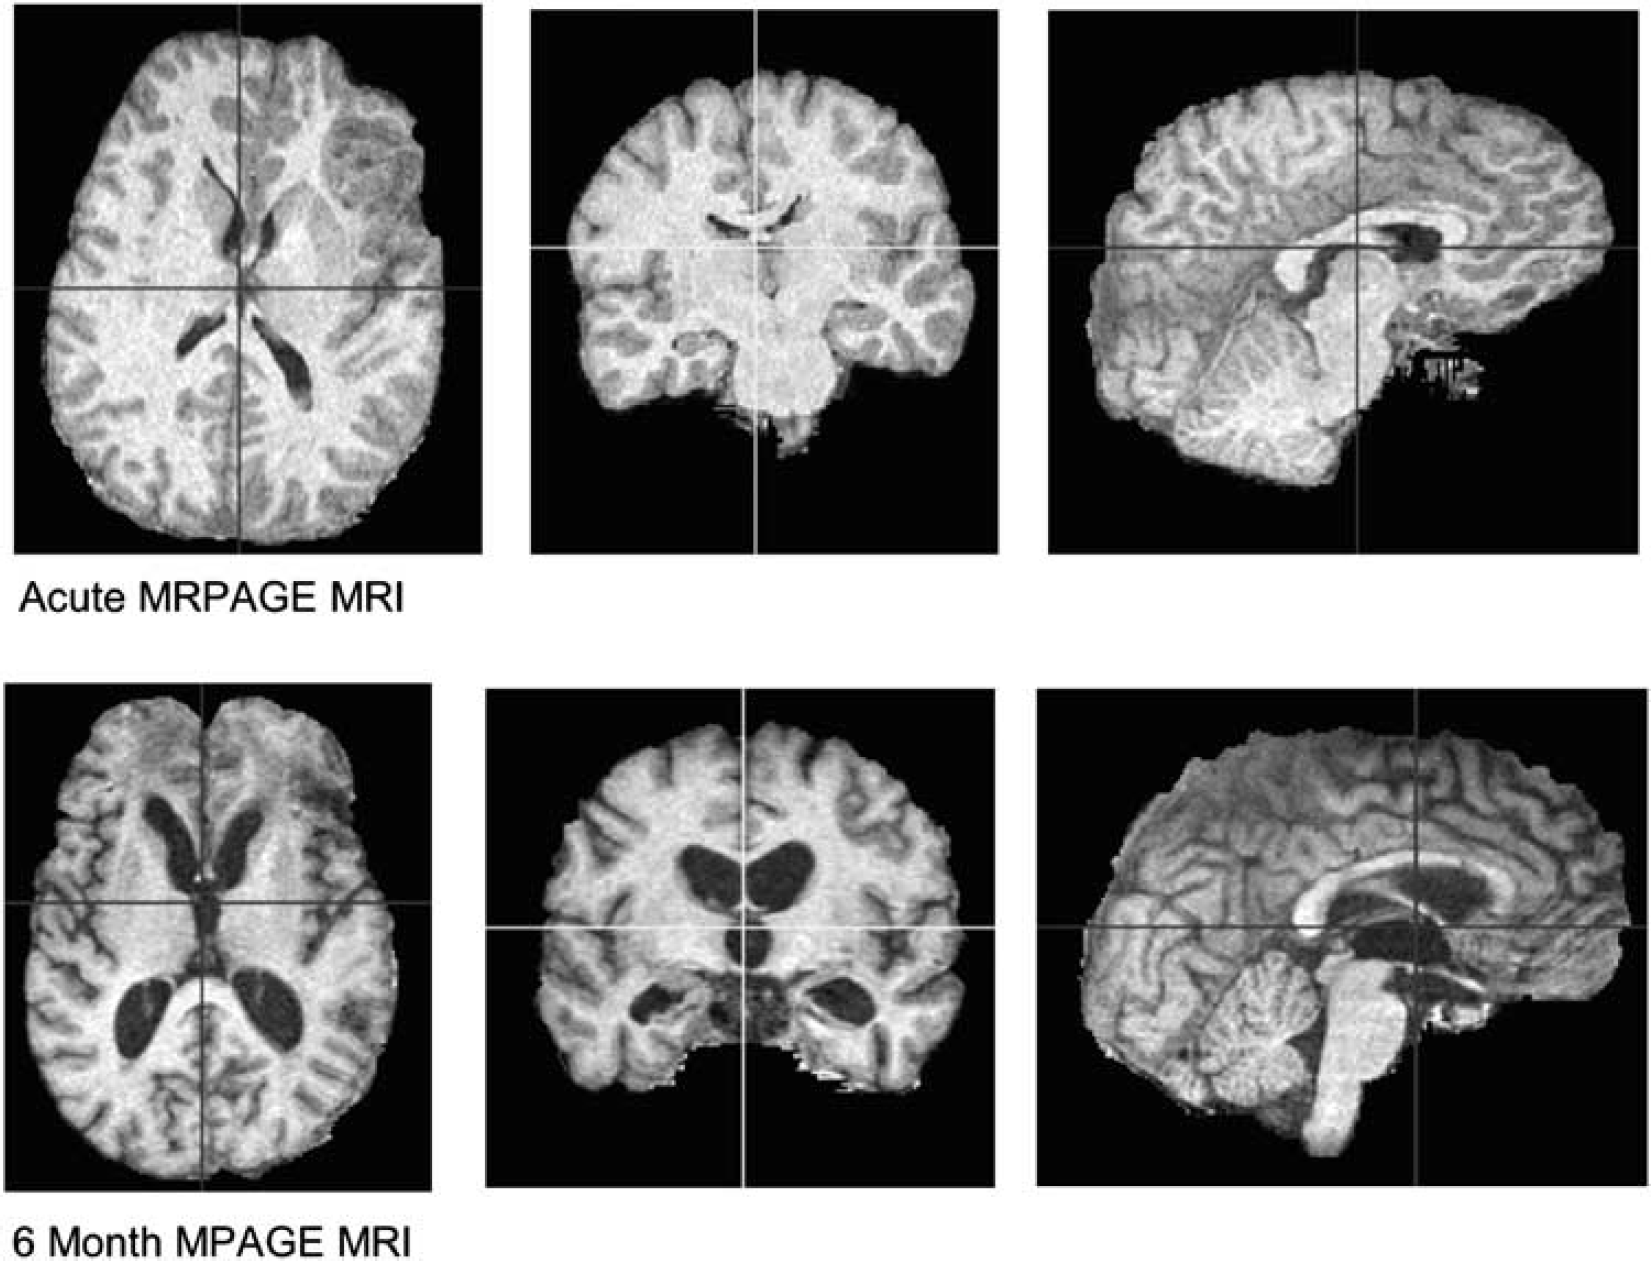
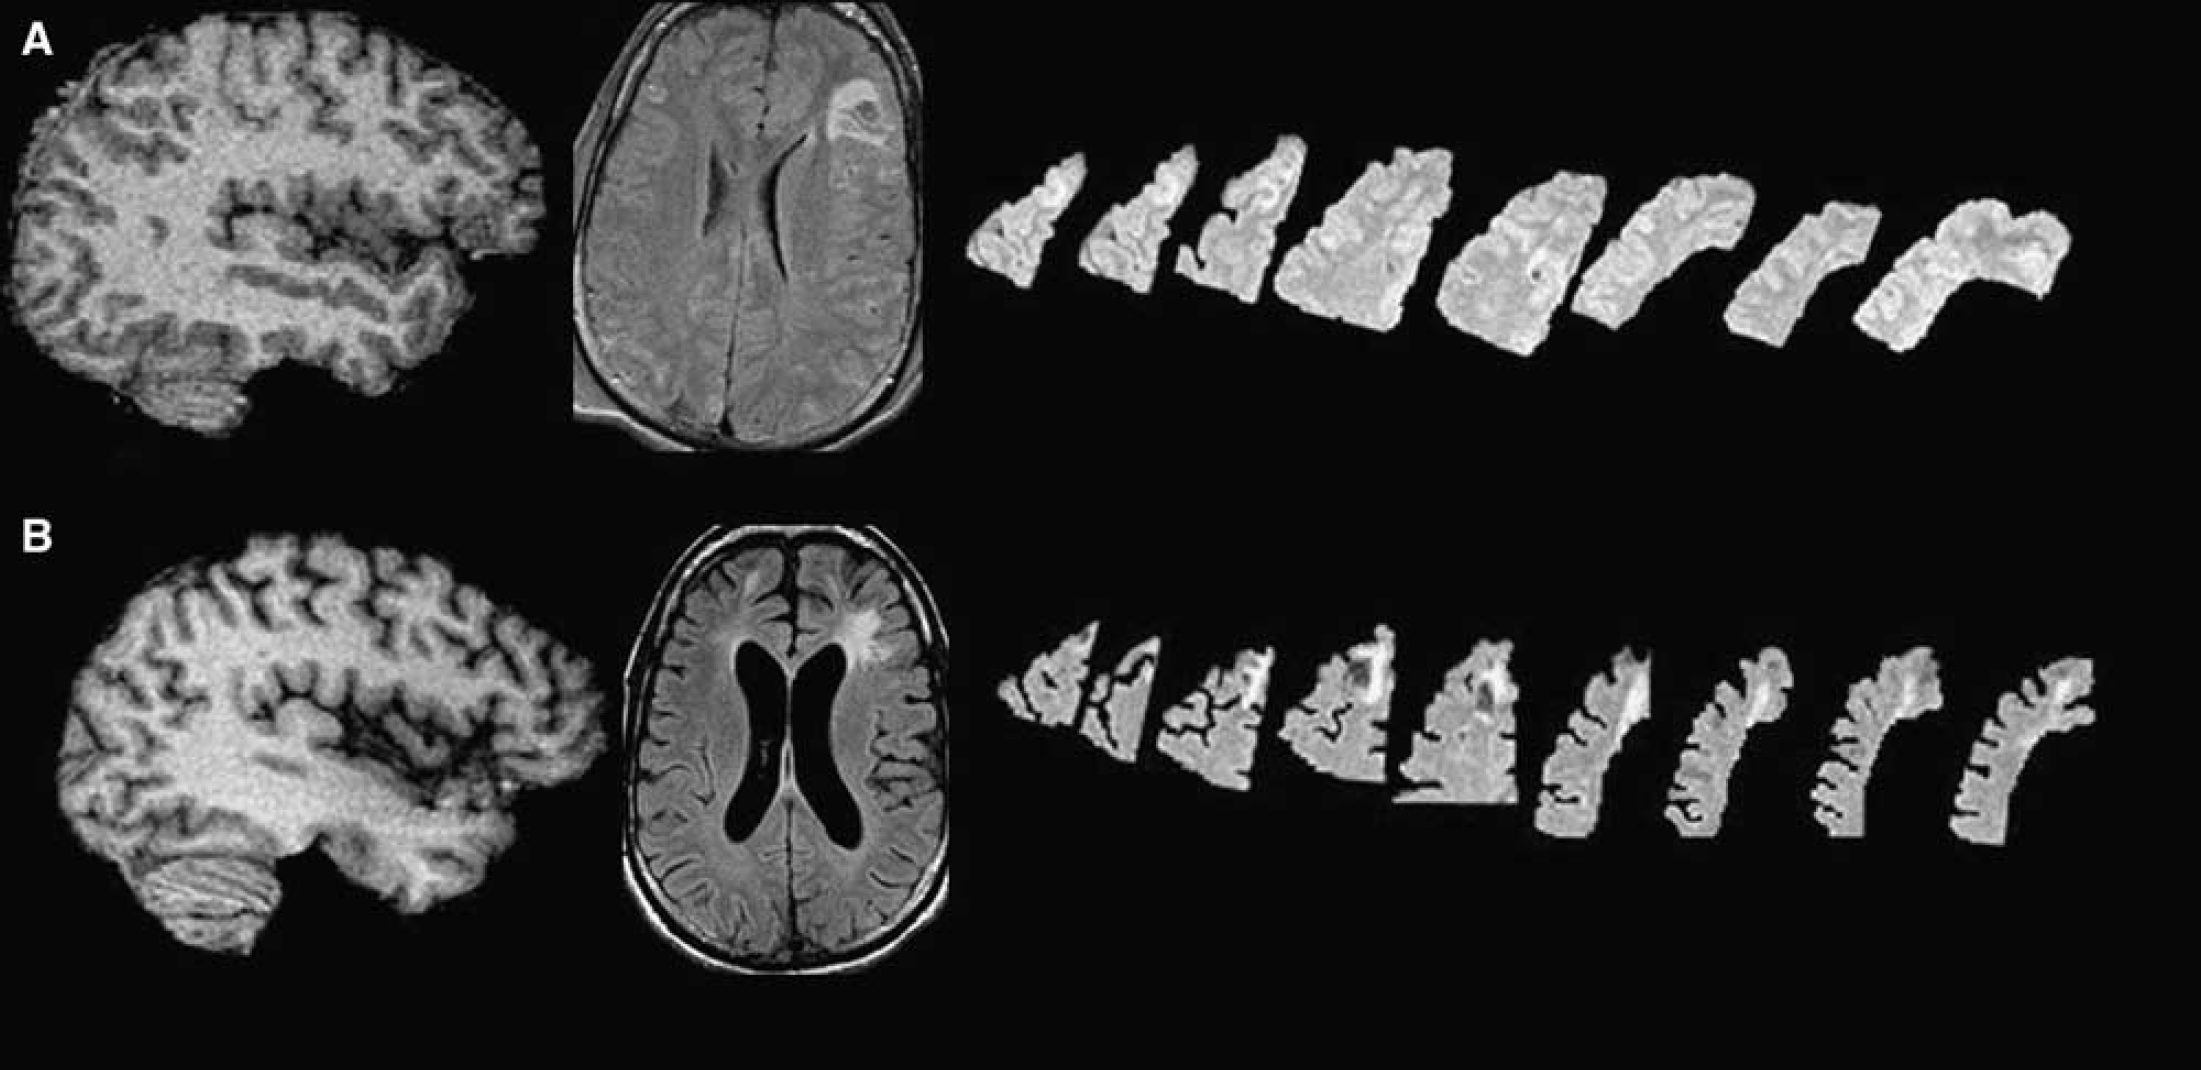
Example of chronic brain atrophy: Three-dimensional rendering of skull-stripped SPGR MRI T1 image in an example patient. The top row shows the acute MRI and the bottom row shows the chronic MRI at 6 months after trauma. The widespread atrophy, sulcal enlargement, and ventricular enlargement must be noted.
Correlations between ICP and brain lobe atrophy
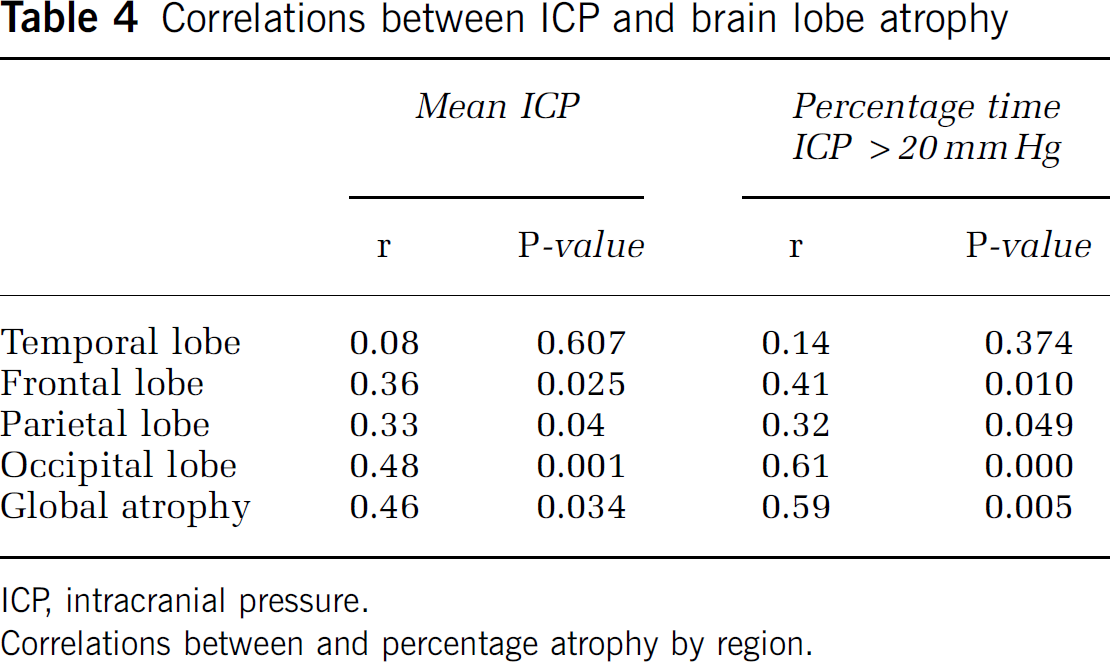
ICP, intracranial pressure.
Correlations between and percentage atrophy by region.
Acute TBI volumes were slightly but nonsignificantly larger than normal controls (
Whole brain volume comparisons
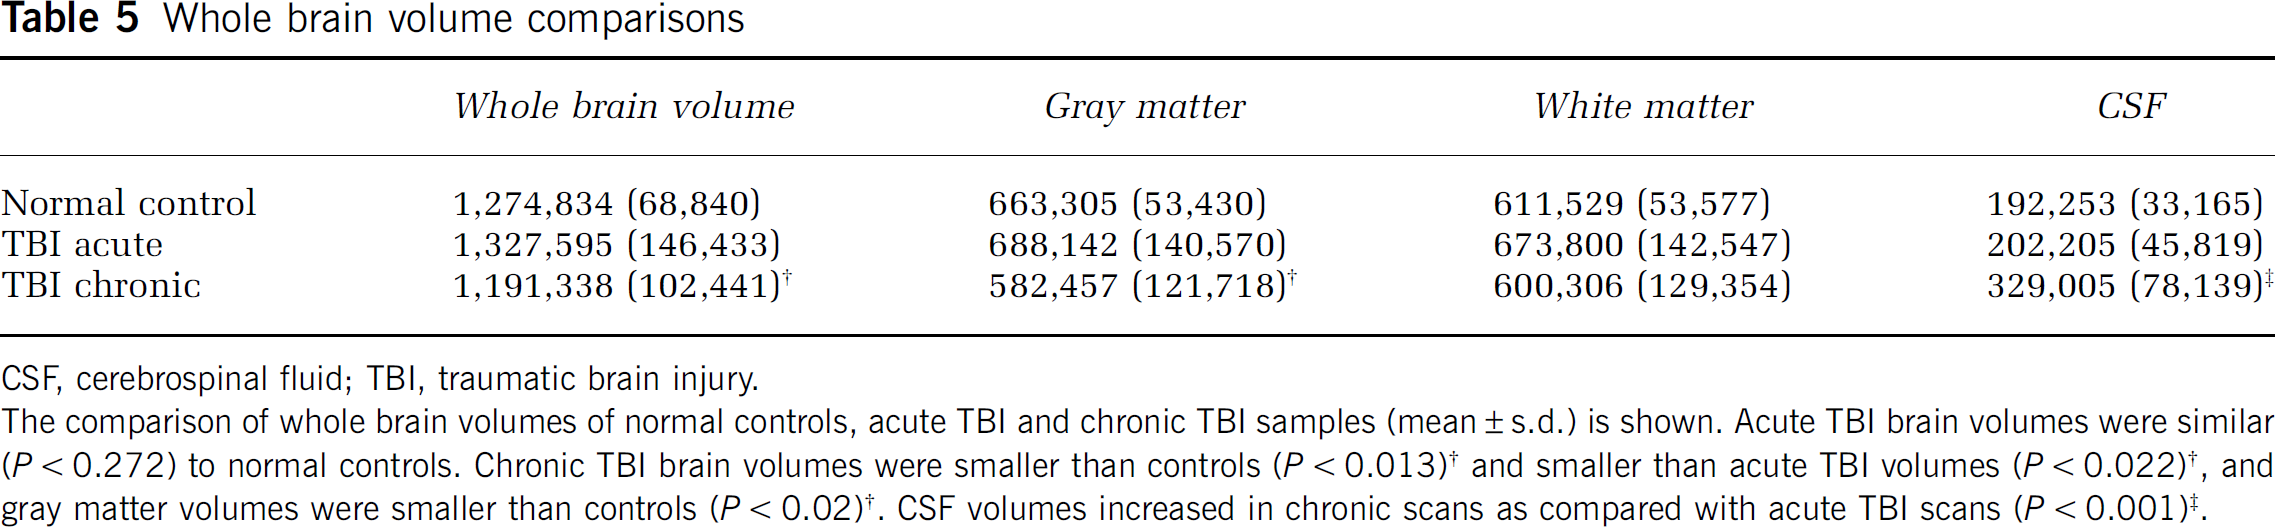
CSF, cerebrospinal fluid; TBI, traumatic brain injury.
The comparison of whole brain volumes of normal controls, acute TBI and chronic TBI samples (mean ± s.d.) is shown. Acute TBI brain volumes were similar (
Regional Metabolic Parameters Compared with Brain Atrophy
Regional measures of metabolism (CBF, OEF, CMRO2, and CMRglc) were compared with regional atrophy using coregistered image analysis (Table 6). Regional brain atrophy was correlated with CMRO2 in the frontal (
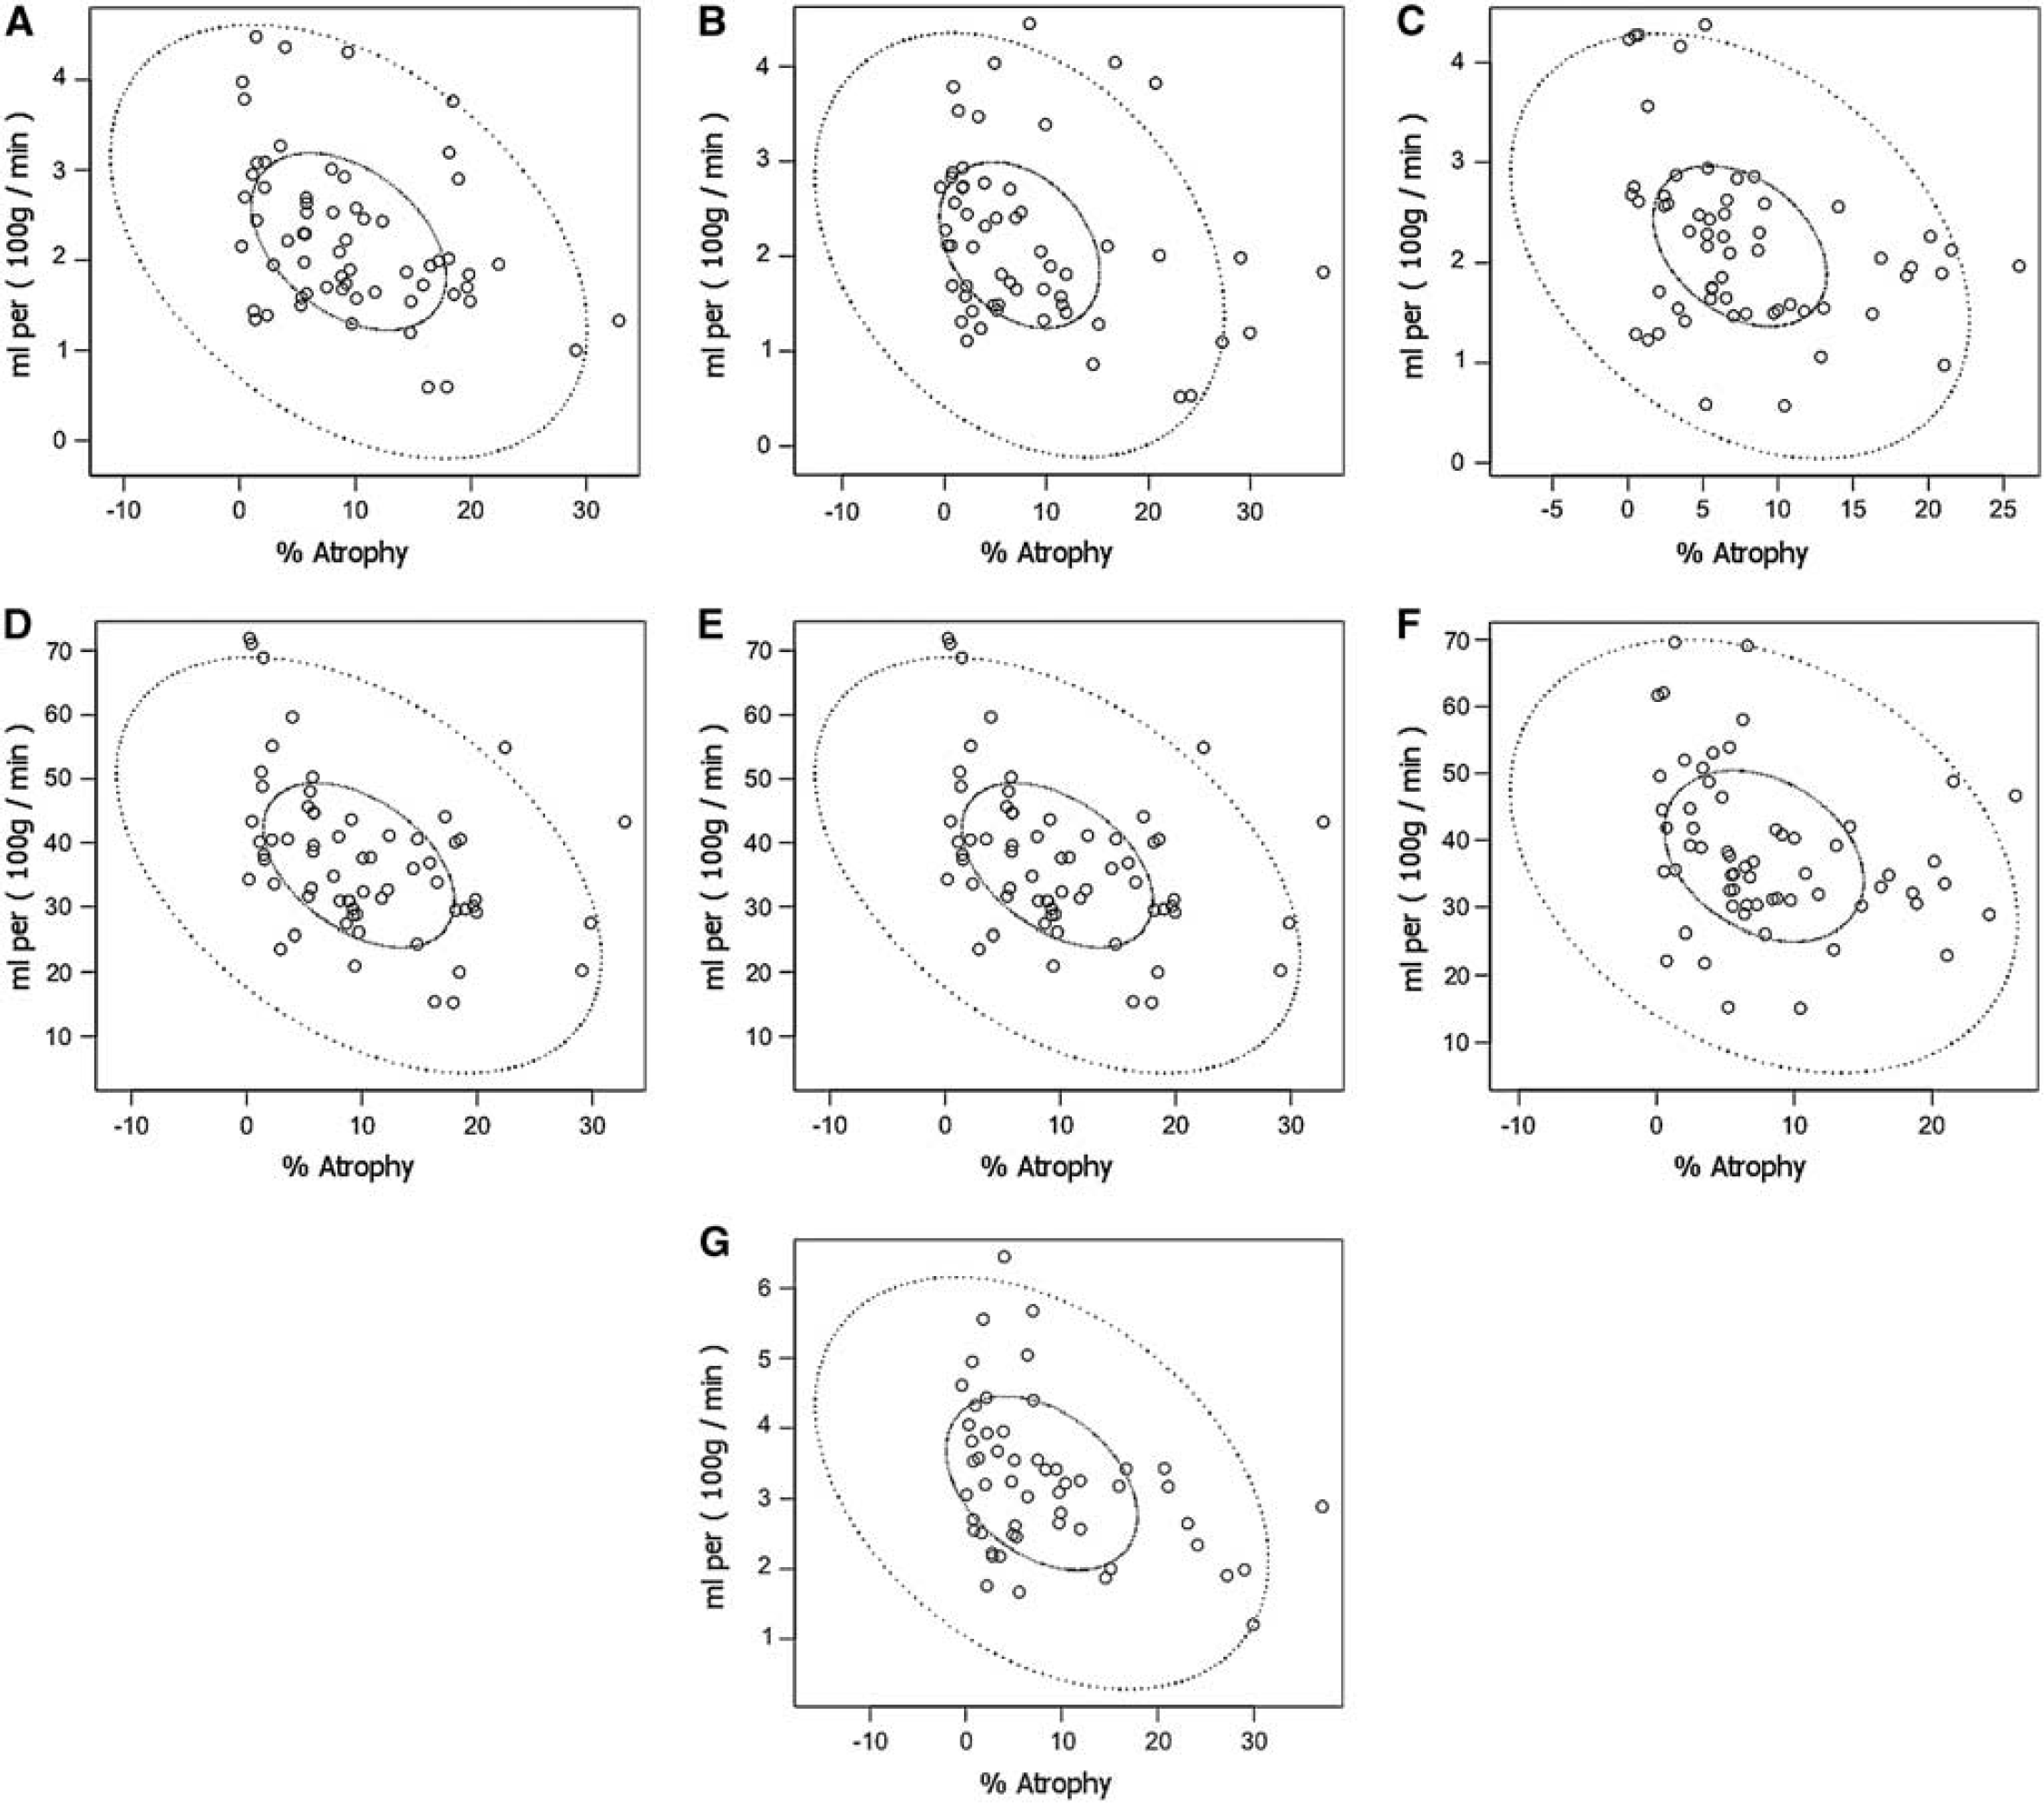
Correlations between CMRO2 and atrophy in the temporal (
Correlations between metabolism and brain lobe atrophy
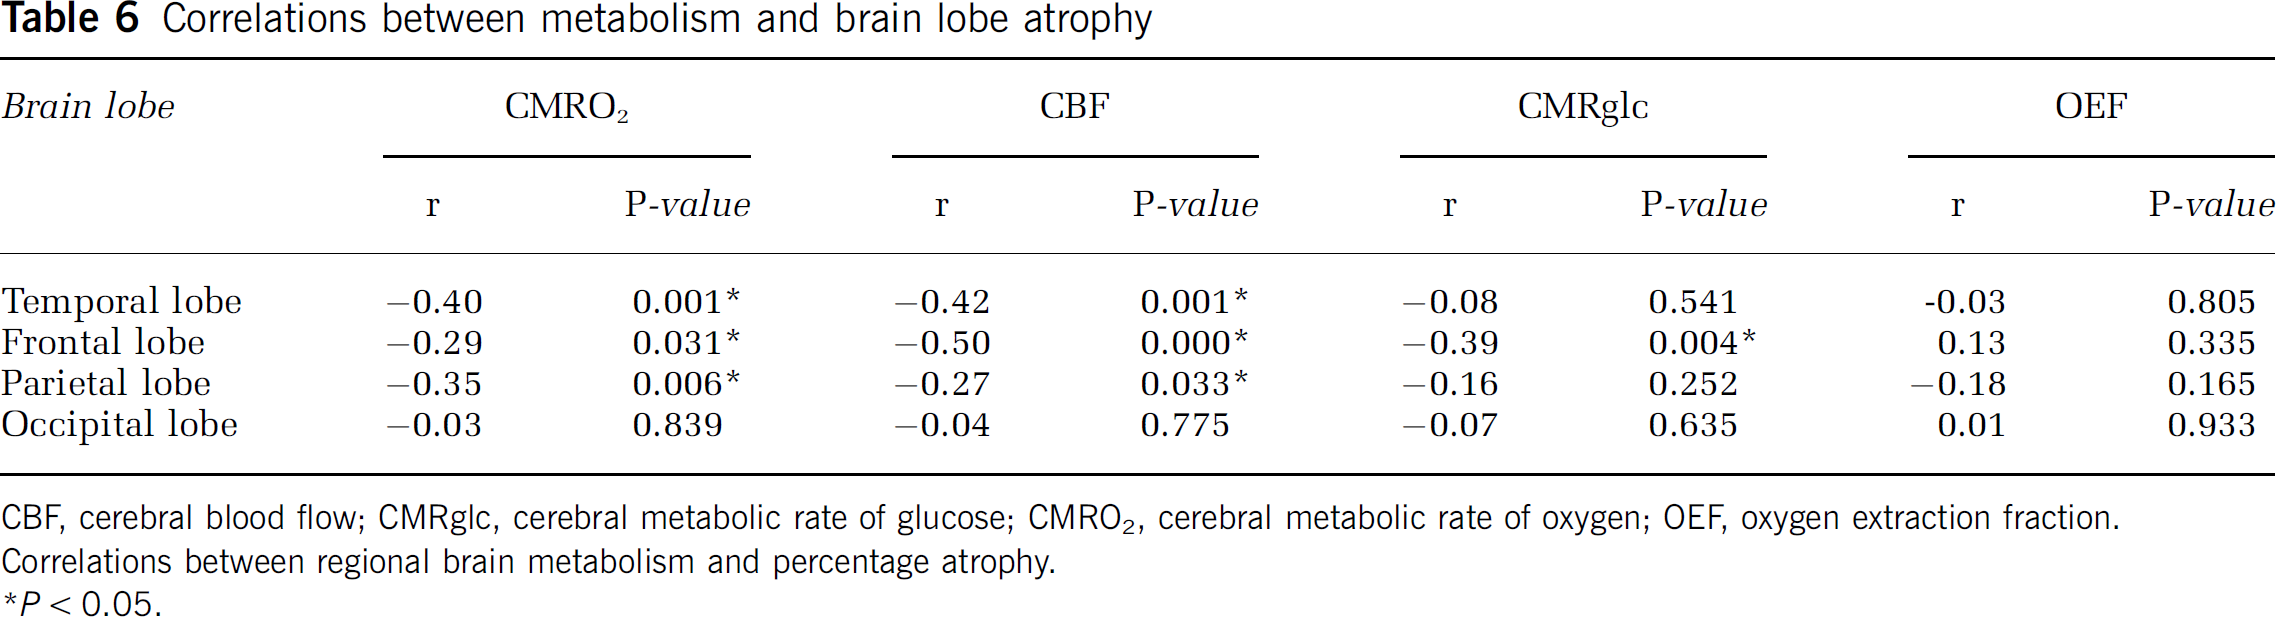
CBF, cerebral blood flow; CMRglc, cerebral metabolic rate of glucose; CMRO2, cerebral metabolic rate of oxygen; OEF, oxygen extraction fraction.
Correlations between regional brain metabolism and percentage atrophy.
Atrophy Compared with Neurologic Outcome
Regional lobar atrophy correlated poorly with GOS-e at 6 months. The specific correlations between atrophy and GOS-e were: temporal lobe (
Discussion
The principal findings of this study are as follows: (1) chronic brain atrophy occurred in all brain regions with the greatest atrophy in the temporal and frontal lobes and less atrophy in the occipital lobes; (2) the extent of brain atrophy was associated with the initial total volume of brain hemorrhage (either isolated contusions or combined diffuse axonal hemorrhagic injury); (3) widespread reduction in glucose and oxidative metabolism as measured by PET was seen, involving normal-appearing regions of the brain; (4) the extent of chronic brain atrophy correlated with nonischemic metabolic parameters regionally; and (5) regional irreversible brain ischemia was infrequently found on both PET OEF and MRI DWI-ADC imaging. These findings are novel and extend the body of knowledge regarding brain atrophy after TBI, highlighting the fact that atrophy is related to early brain metabolism, especially in normal-appearing brain tissue that was not primarily injured.
Brain Atrophy after Traumatic Brain Injury
Several longitudinal MRI studies have quantitatively examined progressive atrophy after TBI. The extent of atrophy varies among different studies according to the delay time from injury to imaging, the severity case mix, and the specific morphometry methods. MacKenzie et al (2002) reported a longitudinal change in the brain parenchymal volume of −4.16% on average compared with −1.49% in healthy controls. In that small study, the time from injury to the first scan varied between 7 and 430 days, thus conflating early and late atrophy. Trivedi et al (2007) published a study applying structural image evaluation, using normalization of atrophy (SIENA) (Smith et al, 2002) to evaluate global brain volume change between ∼79 and 409 days after TBI in 37 patients with mild-to-severe TBI. The authors found a reduction in brain volume of 1.43% relative to healthy controls. In a recent longitudinal study, using a similar acute versus chronic within-subject design, Sidaros et al (2009) compared brain volumes at ∼8 weeks and ∼12 months after injury. The brain volume was already reduced by 8.4% on average in patients compared with controls, whereas a mean of 4.0% (median 2.9%) volume loss occurred in patients during the scan interval. This indicates that a decrease in brain volume occurs in the subacute period. In this study, acute and chronic MRI scans were performed 8 and 195 days, respectively, after trauma on average, and we found global brain atrophy with a mean of 7.8 ± 7.2%. This result is similar to that of our previous study, also on voxel-based morphometry, which showed a mean tissue loss of 8.5 ± 4.5% in the whole brain (Marcoux et al, 2008). As the first MRI was performed in the acute period, it is possible that the clearing of brain edema over time might be responsible for some brain tissue volume loss. We attempted to control for this by comparing results with normal controls. Future studies should be conducted with multiple scan time points to better characterize the time course of progressive atrophy after TBI.
Our findings suggest spatial specificity of brain lobe atrophy after TBI. The temporal and frontal lobes showed greater atrophy than did occipital lobes. These findings are similar to the previous pediatric traumatic brain study (Wilde et al, 2005). The frontal and temporal lobes are among the areas most vulnerable to injury in TBI. Even after excluding contusion volumes from the calculation, the most frequently injured lobes displayed the greatest atrophy. The association between regional contusion size and regional atrophy in those areas containing contusions early on, and the correlation between total contusion volume and global brain atrophy suggest that atrophy is related to the immediate and/or prolonged effects of these contusions. Others have reported a dose-response effect of contusions on regional atrophy (Levine et al, 2008). As metabolic distress is the most severe in regions surrounding contusions (Vespa et al, 2007), atrophy may be due to regional metabolic distress. One speculation is that the cumulative local toxic effects of iron deposition may lead to oxidative stress and metabolic dysfunction, resulting in greater regional long-term global atrophy. A relationship between iron deposition and atrophy has been seen in primary intracerebral hemorrhage (Okauchi et al, 2009).
Metabolic Crisis After Traumatic Brain Injury is Correlated with Atrophy
The assumption that reduction in brain metabolism is well tolerated and benign is not supported by our data. The reduction in brain metabolism instead suggests that the tissue is in a metabolic crisis, despite the absence of markers of ischemia. Indeed, in a preliminary study, we used a combination of early PET imaging and longitudinal cerebral microdialysis monitoring to study metabolic disturbance in the acute period after trauma. In that study, we reported that the burden of microdialysis lactate–pyruvate ratio correlated negatively with CMRO2 (Vespa et al, 2005). Factors responsible for global or regional brain atrophy have not been explored in depth. On the basis of our previous finding that in the frontal lobe, persistent metabolic crisis as measured by elevated lactate–pyruvate ratio monitored by microdialysis is associated with tissue loss, we hypothesized that metabolic crises in other eloquent regions also correlate with tissue loss. Hence, areas of reduced CMRO2 seen in this study may represent areas of the brain in metabolic crisis. The association of brain atrophy with reduced CMRO2 offers further support to this hypothesis. The correlation between atrophy and elevated ICP lends indirect credence that the patients' brains were in distress. It is noteworthy that despite ICP elevation and the absence of irreversible ischemia on PET and MRI, long-term atrophy occurred in our study patients. Amplifying our previous microdialysis study by showing that the duration of regional metabolic crisis correlates with the extent of regional atrophy, this study provides information regarding the relationship between regional metabolism and regional atrophy in areas not monitored by microdialysis.
Our PET metabolic data are in agreement with our previous work (Wu et al, 2004). In this study, CMRO2, CBF, and CMRglc were decreased in the acute period after trauma compared with normal healthy volunteers, but the OEF was similar to normals (Wu et al, 2004). In our current data, the OEF was similar in the nonischemic range. The pericontusional tissue does not display ischemia as determined by the OEF in either our current data or in that of Wu et al (2004). Hence, our data do not support perilesional ischemia.
Most PET studies performed in TBI patients in the acute period after the injury have failed to show widespread brain ischemia. Coles et al (2004) reported finding ischemia in ∼6% of whole brain volume overall, but a few patients had large volumes of ischemia associated with acute subdural hemorrhage. Our PET imaging was delayed in relation to imaging by Coles
Limitations of the Study
Limitations of the study include its small sample size and cross-sectional design. This limitation, combined with a gross measure of chronic neurologic outcome, may have affected our ability to correlate atrophy with neurologic function. More specific cognitive testing that measures function of the frontal and temporal lobes might have provided a stronger correlation between atrophy and outcome. The brain tissue is often swollen during the initial week after TBI. However, we are reassured that brain volume calculations of acute MRI volumes were similar to age-matched controls. In addition, the percentage atrophy reported herein is similar to that in other studies of severe TBI. Hence, we do not believe that the observed atrophy is an artifact of acute brain edema. Conversely, the timing of chronic MRI in this study may have been too early to detect final changes, as atrophy appears to reach a maximum after 8 to 12 months and perhaps longer (Ng et al, 2008). The nature of traumatic lesions in patients may cause bias in the characteristics of lobe atrophy. Positron emission tomography is a snapshot examination and does not reveal long-term metabolic disturbance. Our PET imaging could have missed early ischemia. Ischemic changes may occur before or after PET. However, we coupled MRI ADC measures (to detect ultra-early ischemia that would show up as a stroke for many days) with continuous monitoring of brain oxygen (for detection of ischemia during the intensive-care period), to determine any possible occurrence of ischemia. We failed to detect ischemia as the major pathologic entity underlying the metabolic dysfunction using our current approach. It is noteworthy that normalization of ADC reduction occurs in large artery strokes treated with recanalization (Kidwell et al, 2000; Kidwell et al, 2002; Fiehler et al, 2002). The extent of the correction seems to be dependent on recanalization. Hence, this study may have missed early ADC reduction and thus early brain ischemia. However, this is a difficult issue as normalization of ADC after recanalization for ischemic stroke results in long-term tissue survival and not focal atrophy. Hence, a transient early ischemic event missed by our MRI imaging protocol would likely not contribute to the long-term atrophy that we report in this study. In some cases of ischemic stroke, the normalized ADC again becomes abnormal on MRI at day 7 after stroke despite early ADC normalization (Kidwell et al, 2000). Given that we imaged patients in a delayed manner in the acute setting (mean of 8 days), we theoretically would see late ADC signs of ischemia even if reperfusion had occurred after an early ischemic event. In contrast to our study, Menon and colleagues (Cunningham et al, 2005) have presented data indicating the importance of cellular edema, vascular compression, and microvascular ischemia leading to cellular injury; hence, our results are controversial. Overall, we acknowledge the potential of early ischemia after TBI, but to the best of our abilities, keeping the above experience in stroke ADC imaging in mind, we were not able to find substantive evidence of ischemia after TBI.
Conclusions
Chronic brain atrophy is regionally specific and is regionally associated with reductions in oxidative brain metabolism. The atrophy does not seem to be based on the occurrence of irreversible brain ischemia, as measured by PET and MRI DWI-ADC. Although the mechanisms leading to brain atrophy are as yet undetermined, the above- data suggest that impaired oxidative metabolism has a central role.
Footnotes
The authors declare no conflict of interest.