
Abstract
This study was aimed at evaluating the metabolism of reactive astrocytes in the brains of patients with multiple sclerosis by quantitative 1-C-11 acetate positron emission tomography (PET). Magnetic resonance imaging and 1-C-11 quantitative PET were performed in eight patients with multiple sclerosis and 10 normal control subjects. The efflux rate (k2) of 1-C-11 acetate, which reportedly reflects the metabolic rate of 1-C-11 acetate, was calculated based on the one-tissue compartmental model. Fractional anisotropy was also determined to evaluate the integrity of the neuronal tracts. The values of k2 in the patients with multiple sclerosis were significantly higher than those in the normal control subjects, in both the white matter (p = 0.003) and the gray matter (p = 0.02). In addition, the white matter/gray matter ratio of k2 was significantly higher in the multiple sclerosis patients than in the normal control subjects (p = 0.02). Voxel-based statistical analysis revealed most prominent increase in k2 in the neuronal fiber tracts, as well as decrease in fractional anisotropy in them in the multiple sclerosis patients. The present study clarified that the pathological changes associated with astrocytic reactivation in multiple sclerosis patients could be visualized by quantitative 1-C-11 acetate PET.
Introduction
Multiple sclerosis is a neuronal inflammatory disease that is characterized by demyelination and/or axonal damage, with a vast spectrum of manifestations, including motor or sensory deficits, cognitive impairment, cerebellar ataxia, and bladder/rectal disturbances. Although structural imaging by magnetic resonance imaging (MRI) is a representative and unique imaging modality for diagnosis and evaluation of disease progression, 1 functional imaging for inflammation in multiple sclerosis (MS) can also yield useful findings from the clinical or pathological standpoint. 2 Activation of astrocytes is a cardinal feature of inflammation in MS.3,4 Acetate has been reported to be selectively taken up and metabolized by astrocytes in the central nervous system.5,6 We have already clarified by qualitative positron emission tomography (PET) imaging that the 1-C-11 acetate uptake is significantly elevated in MS patients. 7 It has been reported that metabolism of acetate in astrocytes can be evaluated quantitatively by measuring the efflux of 1-C-11 acetate from the brain tissue by dynamic PET imaging.8,9 The present study was aimed at assessing the astrocyte reactivity in MS patients by quantitative 1-C-11 acetate PET.
Subjects and methods
Subjects
Eight patients with MS (male/female: 2/6, age(SD): 42.1(6.3)) were enrolled (MS group) in the study (Table 1). Two of the eight patients had secondary progressive MS (SPMS) and the remaining patients had relapsing-remitting MS. Patients who had been asymptomatic for the previous five years were excluded from the study. All the patients included in this study satisfied the 2010 revisions of the McDonald criteria. 10 Although the two patients MS2 and MS4 were also recruited in our previous study, 7 PET examinations of them in this study were different from the previous ones. In addition, 10 healthy volunteers (male/female: 5/5, age(SD): 45.8(8.4)) were recruited as normal control subjects (NC group). Participants gave written informed consent according to the Declaration of Helsinki. This study was performed with the approval of the institutional ethics committee of Osaka University Hospital.
Patient information.
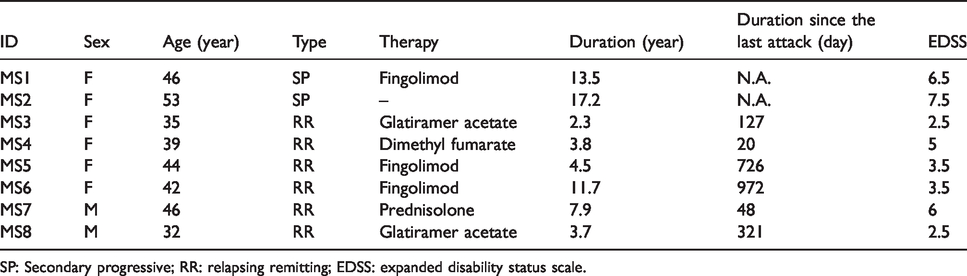
SP: Secondary progressive; RR: relapsing remitting; EDSS: expanded disability status scale.
MRI
MRI was performed using the Discovery MR750 3.0 T (GE Healthcare Japan Co, Tokyo, Japan) system. Three-dimensional (3 D) MRI was performed using a T1-weighted spoiled gradient recalled (SPGR) sequence (sagittal plane; slice thickness, 1.0 mm; matrix size, 256 × 256; in-plane resolution, 0.94 × 0.94 mm; field of view, 240 mm; repetition time, 7.20 ms; echo time, 2.74 ms; flip angle, 11°) and fluid attenuation inversion recovery (FLAIR) sequence (sagittal plane; slice thickness, 1.4 mm; matrix size, 512 × 512; in-plane resolution, 0.47 × 0.47 mm; repetition time, 6000 ms; echo time, 90 ms; flip angle, 90°). Diffusion tensor imaging (DTI) data were acquired using a single-shot echo-planar imaging sequence (sagittal plane; slice thickness, 2.6 mm; matrix size, 256 × 256; in-plane resolution, 0.94 × 0.94 mm; repetition time, 15000 ms; echo time, 81.9 ms; flip angle, 90°; motion probing gradient, 15 axes; b value, 1000 s/mm2). Postprocessing of DTI to calculate the fractional anisotropy (FA) on a pixel-by-pixel basis was performed using the FuncTool software (GE Healthcare).
PET
1-C-11 acetate was synthesized by carbonation of the Grignard reagent, followed by acid hydrolysis. C-11 carbon dioxide was allowed to react with methylmagnesium bromide, followed by hydrolysis with hydrochloric acid to yield C-11 acetic acid. 11 The radiochemical purity of the tracer was greater than 98%.
Every subject underwent PET scanning in the Eminence SOPHIA SET-3000 BCT/X (Shimadzu Co, Kyoto, Japan) system in the three-dimensional acquisition mode. Before the emission scan, transmission data were acquired using a rotating Cs-137 point source for attenuation correction. A brain emission scan for 60 min was initiated simultaneously with the start of the 60-s injection of the radiotracer (400 ± 50 MBq) into the antecubital vein at the rate of 5.2 mL/min. Multi-frame tomographic images were reconstructed using the Dynamic Row-Action Maximum Likelihood Algorithm (DRAMA) with an image matrix of 128 × 128, yielding a voxel size of 2.0 × 2.0 × 3.25 mm3. Each image data consisted of 35 frames (10 s × 9 frames, 15 s × 6 frames, 20 s ×3 frames, 30 s × 4 frames, 60 s × 4 frames, 180 s × 4 frames, 360 s × 3 frames, 600 s × 2 frames). The voxel values of the PET images were transformed from cps/ml to the Bq/ml based on the cross calibration factor.
Blood sampling
For the purpose of measurement of the input function, arterialized venous blood samples were obtained instead of arterial blood, to minimize invasion. A 22-gauge catheter was placed in an antecubital vein contralateral to the injection site for blood sampling. Then, the forearm was heated using an electric blanket from 30 min before the blood sampling to the end of scanning. After warming the arm, venous blood samples were collected for measurement of the blood gas profile.
Repeated blood samplings were performed at 20 s, 40 s, 60 s, 80 s, 100 s, 120 s, 150 s, 180 s, 210 s, 4 min, 5 min, 7 min, 10 min, 15 min, 20 min, 40 min, and 60 min after the start of the scan. The radioactivity and weight of the whole blood or plasma extracted by centrifugation (3,000 round/min, 5 min) were measured with a well scintillation counter (BSS; Shimadzu Co, Kyoto, Japan), and the radioactivity concentration of each blood sample (cps [count per second]) was corrected for decay from the scan start time.
Input function
The blood data were corrected for metabolites according to following equation derived in and verified by previous studies9,12

Assessment of 1-C-11 acetate metabolism in the brain
In the present study, the metabolic rate of 1-C-11 acetate in the brain tissue was calculated based on the one-tissue compartment model established in a previous animal and human study. 9 The first compartment of this model represents the radioactivity concentration of 1-C-11 acetate in the plasma, i.e. the input function. The second pool represents the total brain tissue activity of the tracer. This pool is the summation of the radioactivity of all the metabolites of 1-C-11 acetate. The label transfer rate between the two compartments can be calculated as rate constants K1 and k2, where K1 represents the influx of 1-C-11 acetate and k2 expresses the clearance of total radioactive molecules resulting from metabolism of acetate in the brain. The clearance rate constant k2 is thought to reflect the production of C-11 CO2 and therefore to show a close relationship to the oxidative metabolism of 1-C-11 acetate. 8 The rate constants K1 and k2, and the distribution volume (Vt) of C-11 radioactivity based on the one-tissue compartment model were calculated using the PXMOD module in the PMOD 3.5 software package (PMOD Technologies Ltd, Zurich, Switzerland).
Voxel-based statistical analysis
The averaged image of all the dynamic PET frames was coregistered to the T1-weighted 3 D MR images in each subject by the mutual information-based coregistration method. The k2 parametric image was also coregistered to the MR images with the same transfer matrix as above. T1-weighted 3 D MRI was anatomically segmented into probability maps for the gray and white matter and for the cerebrospinal fluid, and normalized based on the unified segmentation model 13 with the Statistic Parametric Mapping 8 (SPM8) software using the “Unmodulated Normalized” option to preserve the image concentration. The coregistered PET images and the FA image were also normalized by the same transfer matrix derived from the unified segmentation. After anatomical normalization, the k2 and FA images were skull-stripped and smoothed by an isotropic Gaussian kernel with a FWHM of 6 mm and 10 mm, respectively, for matching the spatial resolutions.
After the preprocessing, statistical comparisons were performed with the “two-sample T-test” using SPM8 without global scaling of the voxel value or explicit masking to limit the area for comparison. The mean T-score in each white matter region was calculated based on the JHU white matter atlas. 14 The statistical power of the present analysis was not sufficiently high, because the sample size was small. The statistical data were, therefore, corrected for multiple comparisons using cluster-level inference, based on the random field theory, instead of voxel-level inference.
VOI analysis
The mean k2 values in the gray and white matter segments were evaluated by volume of interest (VOI) analysis of the k2 parametric images, using the gray and white matter masks derived from the tissue probability map described in the previous section, based on the following condition

Cognitive testing
The brief repeatable battery of neuropsychological tests (BRB-N) that was developed as a brief screening battery for cognitive impairment in MS patients 15 was used to assess the cognitive status of all the subjects.
Assessment of lesions on MRI
T1 black holes were defined as focal regions of hypointensity on the T1-weighted images co-localized with high signal intensity regions on the T2-weighted images. 7 The T1 black hole lesions in the cerebrum, cerebellum and brain stem were independently evaluated and counted visually by three neurologists.
Statistics
Statistical comparison of the average values of the measured parameters between the two groups was analyzed by Mann–Whitney’s U test. Calculation of Spearman’s partial correlation coefficient was performed for evaluation of the association between the BRB-N test scores and the FA or k2 values of 1-C-11 acetate. Spearman’s rank correlation coefficient was calculated to evaluate the concordance of the distribution of the significantly involved neuronal fiber tracts between the MRI and PET images. SPSS 17 was used for the statistical analyses.
Results
Time-courses of C-11 radioactivity in the brain tissue and in the plasma of arterialized venous blood were demonstrated in Figure 1. VOI analysis based on segmentation revealed that the mean K1 and k2 values in both the white matter (p = 0.009, 0.003) and gray matter (p = 0.02, 0.02) were significantly higher in the MS group than in the NC group. The white matter/gray matter k2 ratio was also significantly higher in the MS group than in the NC group (p = 0.02) (Figure 2(a) to (i)). FA reduction was significant in the MS group as compared to the NC group (p = 0.009) (Figure 2(j)). The anatomically normalized k2 map showed an apparent decrease in contrast between the gray matter and white matter in the MS group as compared to the NC group (Figure 3).
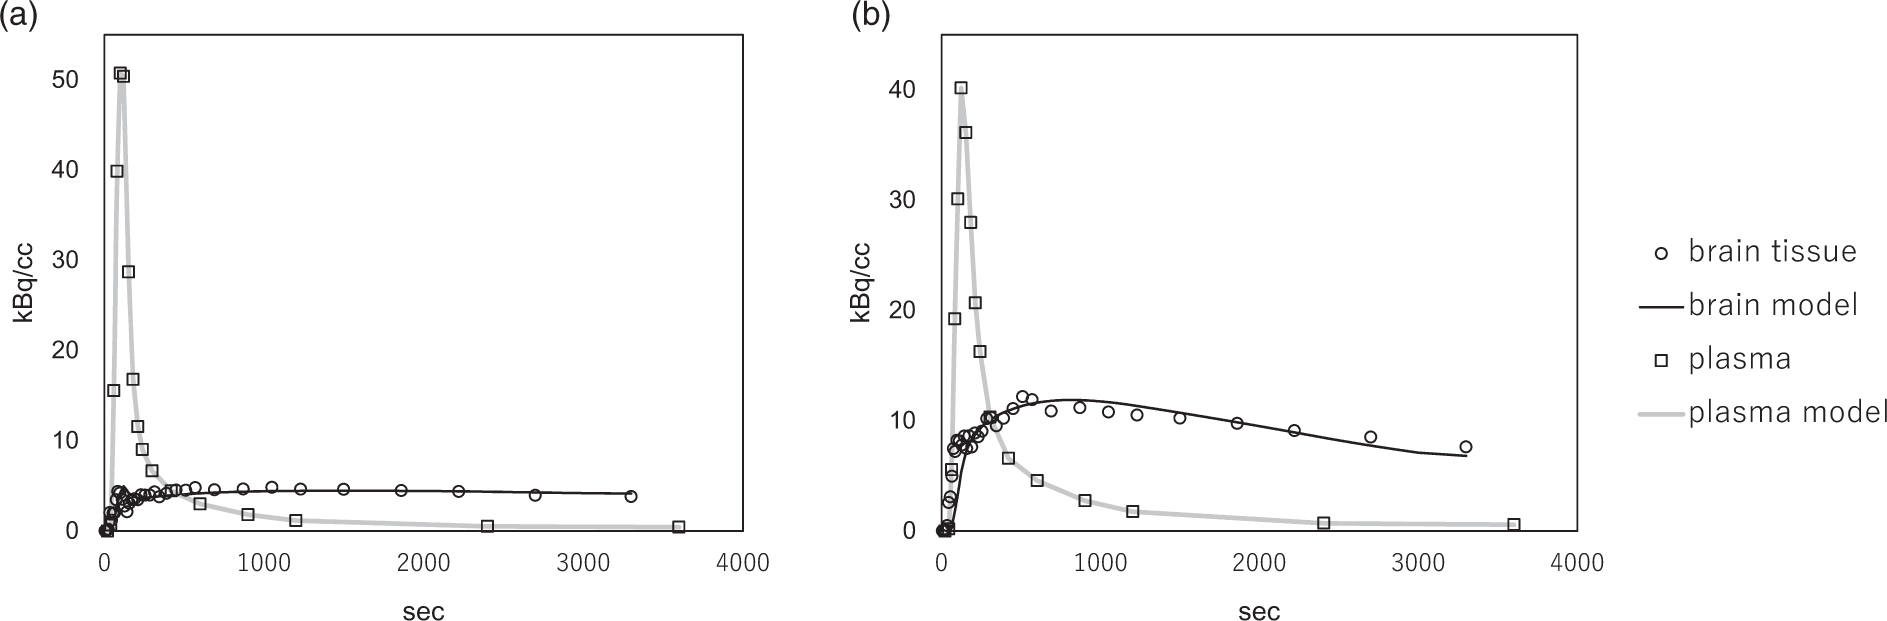
Time-course of C-11 radioactivity in the brain tissue obtained over 60 min (open circles), in the plasma of arterialized venous blood (open squares). In additional, the model fits of the plasma input function (gray line) and that of brain tissue (black line) are also shown. (a) Normal control; K1 = 0.038, k2 = 0.010, Vt = 3.81. (b) MS patient; K1 = 0.096, k2 = 0.023, Vt = 4.20.
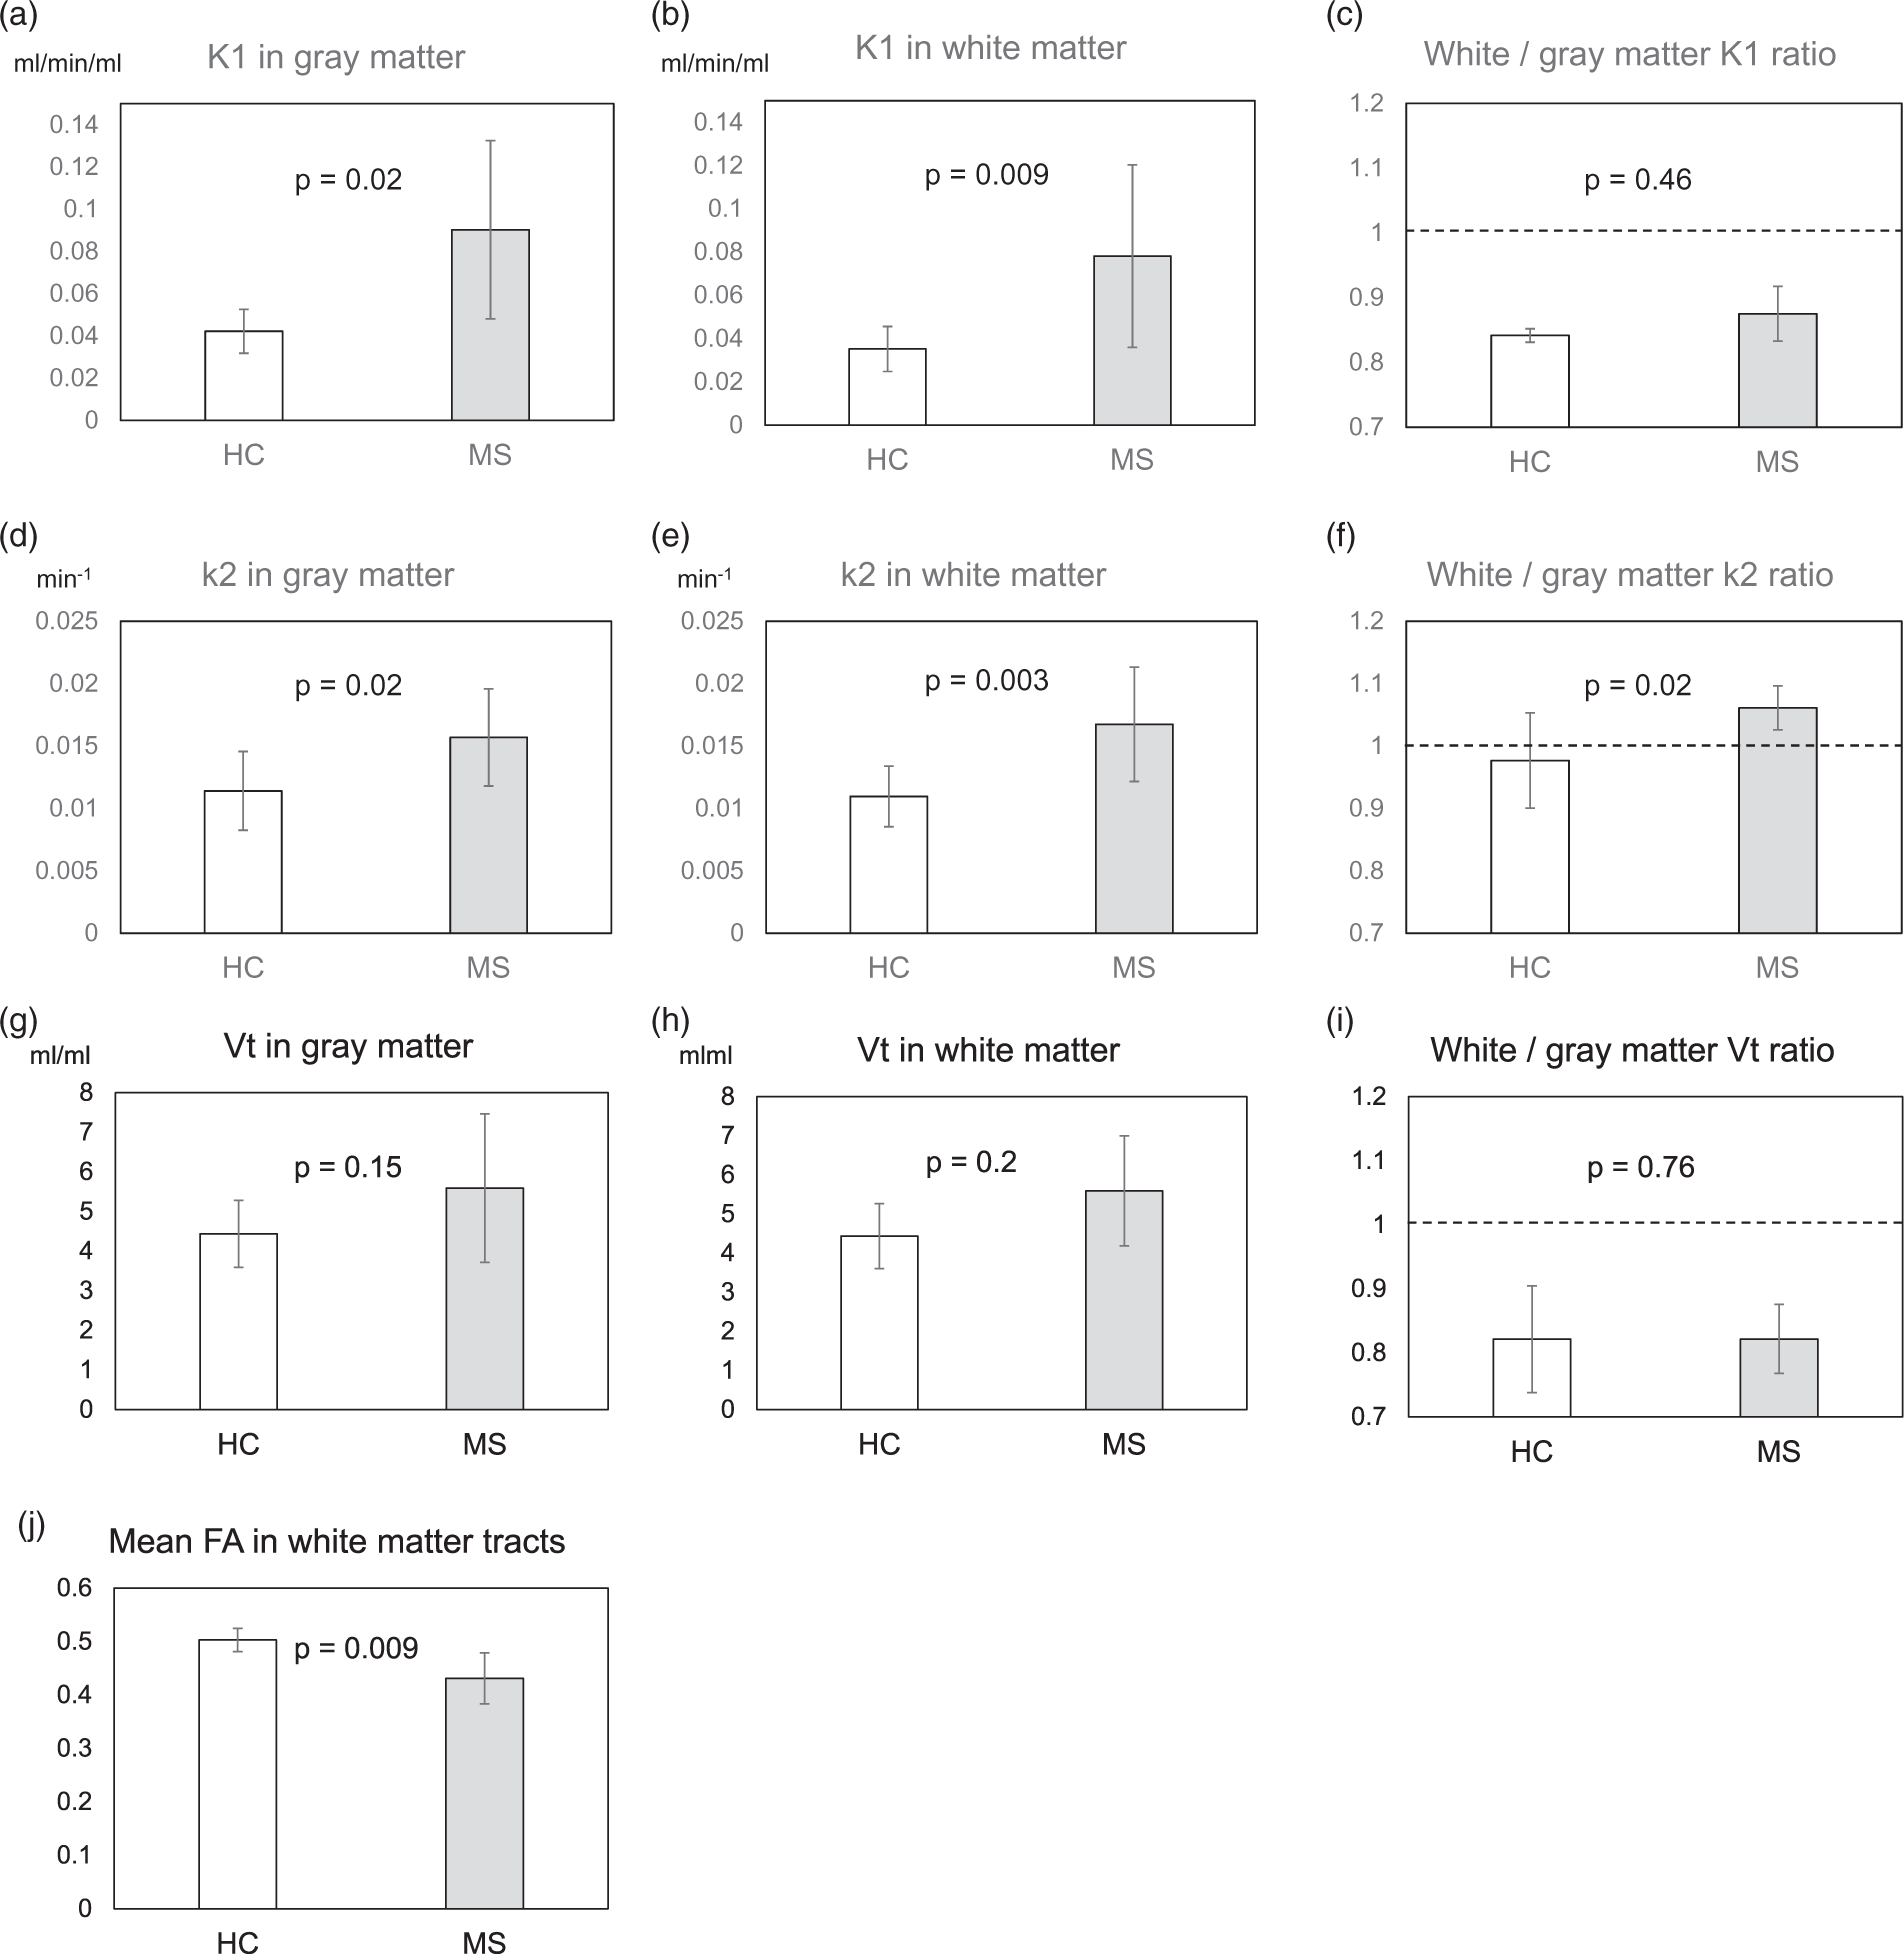
1-C-11 acetate k2 parametric maps were constructed and anatomically normalized by using the density preserving warping method in SPM8. 1-C-11 acetate K1 (a, b, c), k2 (d, e, f), and Vt (g, h, i) were evaluated using grey matter (a, d, g) and/or white matter (b, e, h) binary masks based on automatically segmented MRI. Note: The white matter/gray matter K1 (C), k2 (F), and Vt (I) ratios were also evaluated in the NC and MS groups. The FA values (j) were assessed by applying the fiber tract-based atlas to the anatomically normalized individual FA images, as described in the text. Statistical comparisons between the two groups were performed by Mann-Whitney’s U test. The error bars indicate standard deviation.
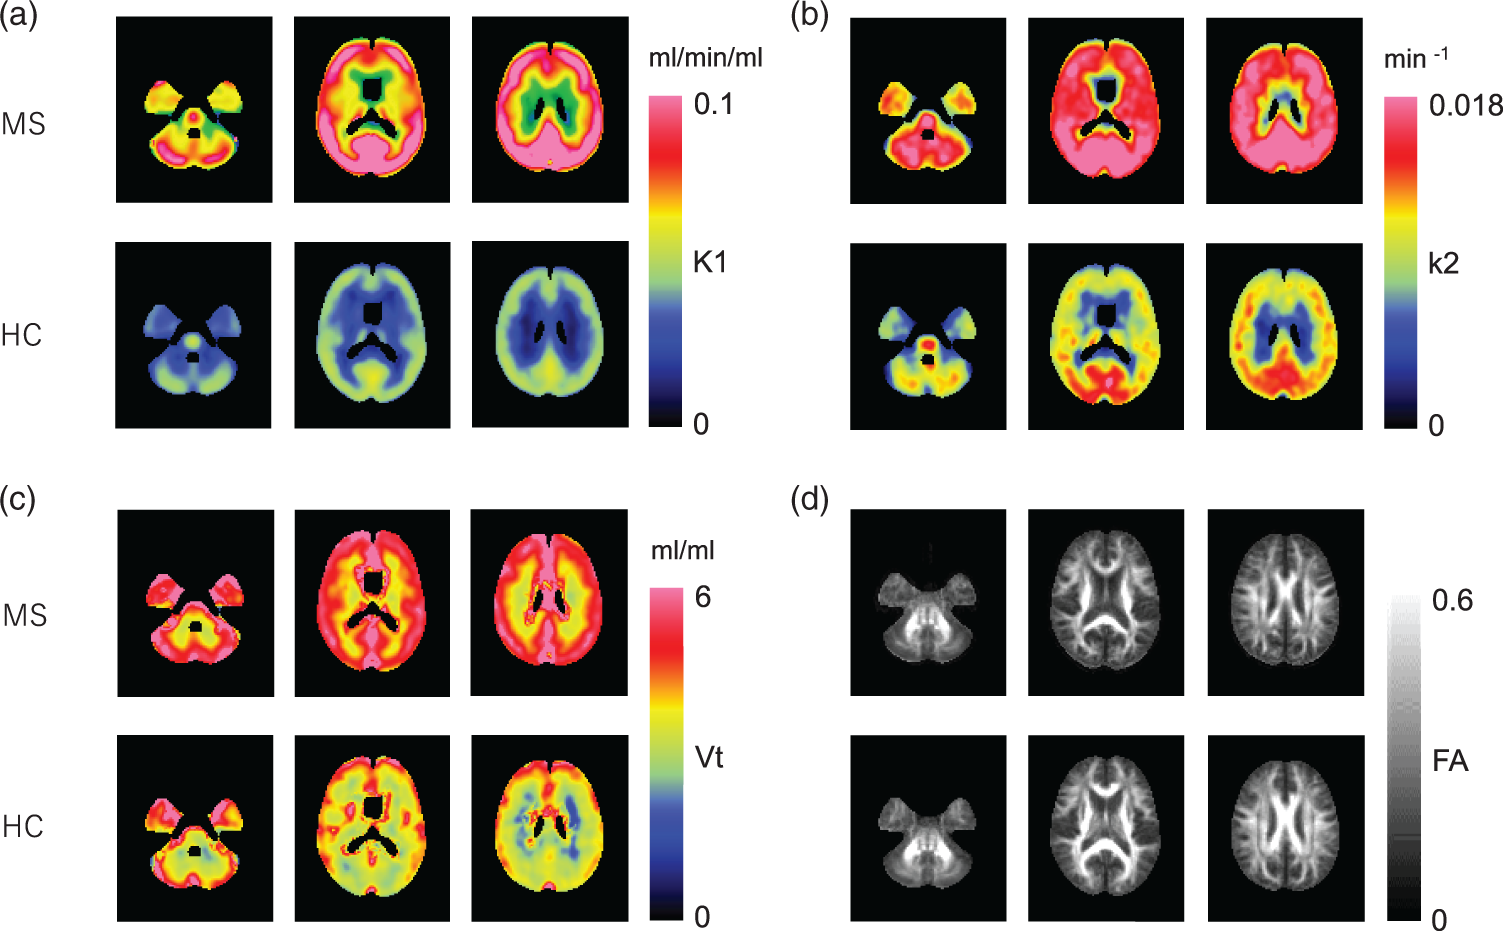
Anatomically normalized group mean images of 1-C-11 acetate K1 (a), k2 (b), Vt (c), and FA (d) in the MS and NC groups.
Voxel-based analysis revealed most prominent increase in k2 in the neuronal fiber tracts (Figure 4(a)), as well as decrease in FA in them (Figure 4(b)) in the MS group. The regional distribution of the mean T-score based on the JHU white matter atlas revealed no significant correlation between k2 and FA (ρ = 0.080, p = 0.58). There was no significant correlation between the duration of disease and the k2 or FA values (ρ = 0.024, −0.167, p = 0.955, 0.693, respectively).
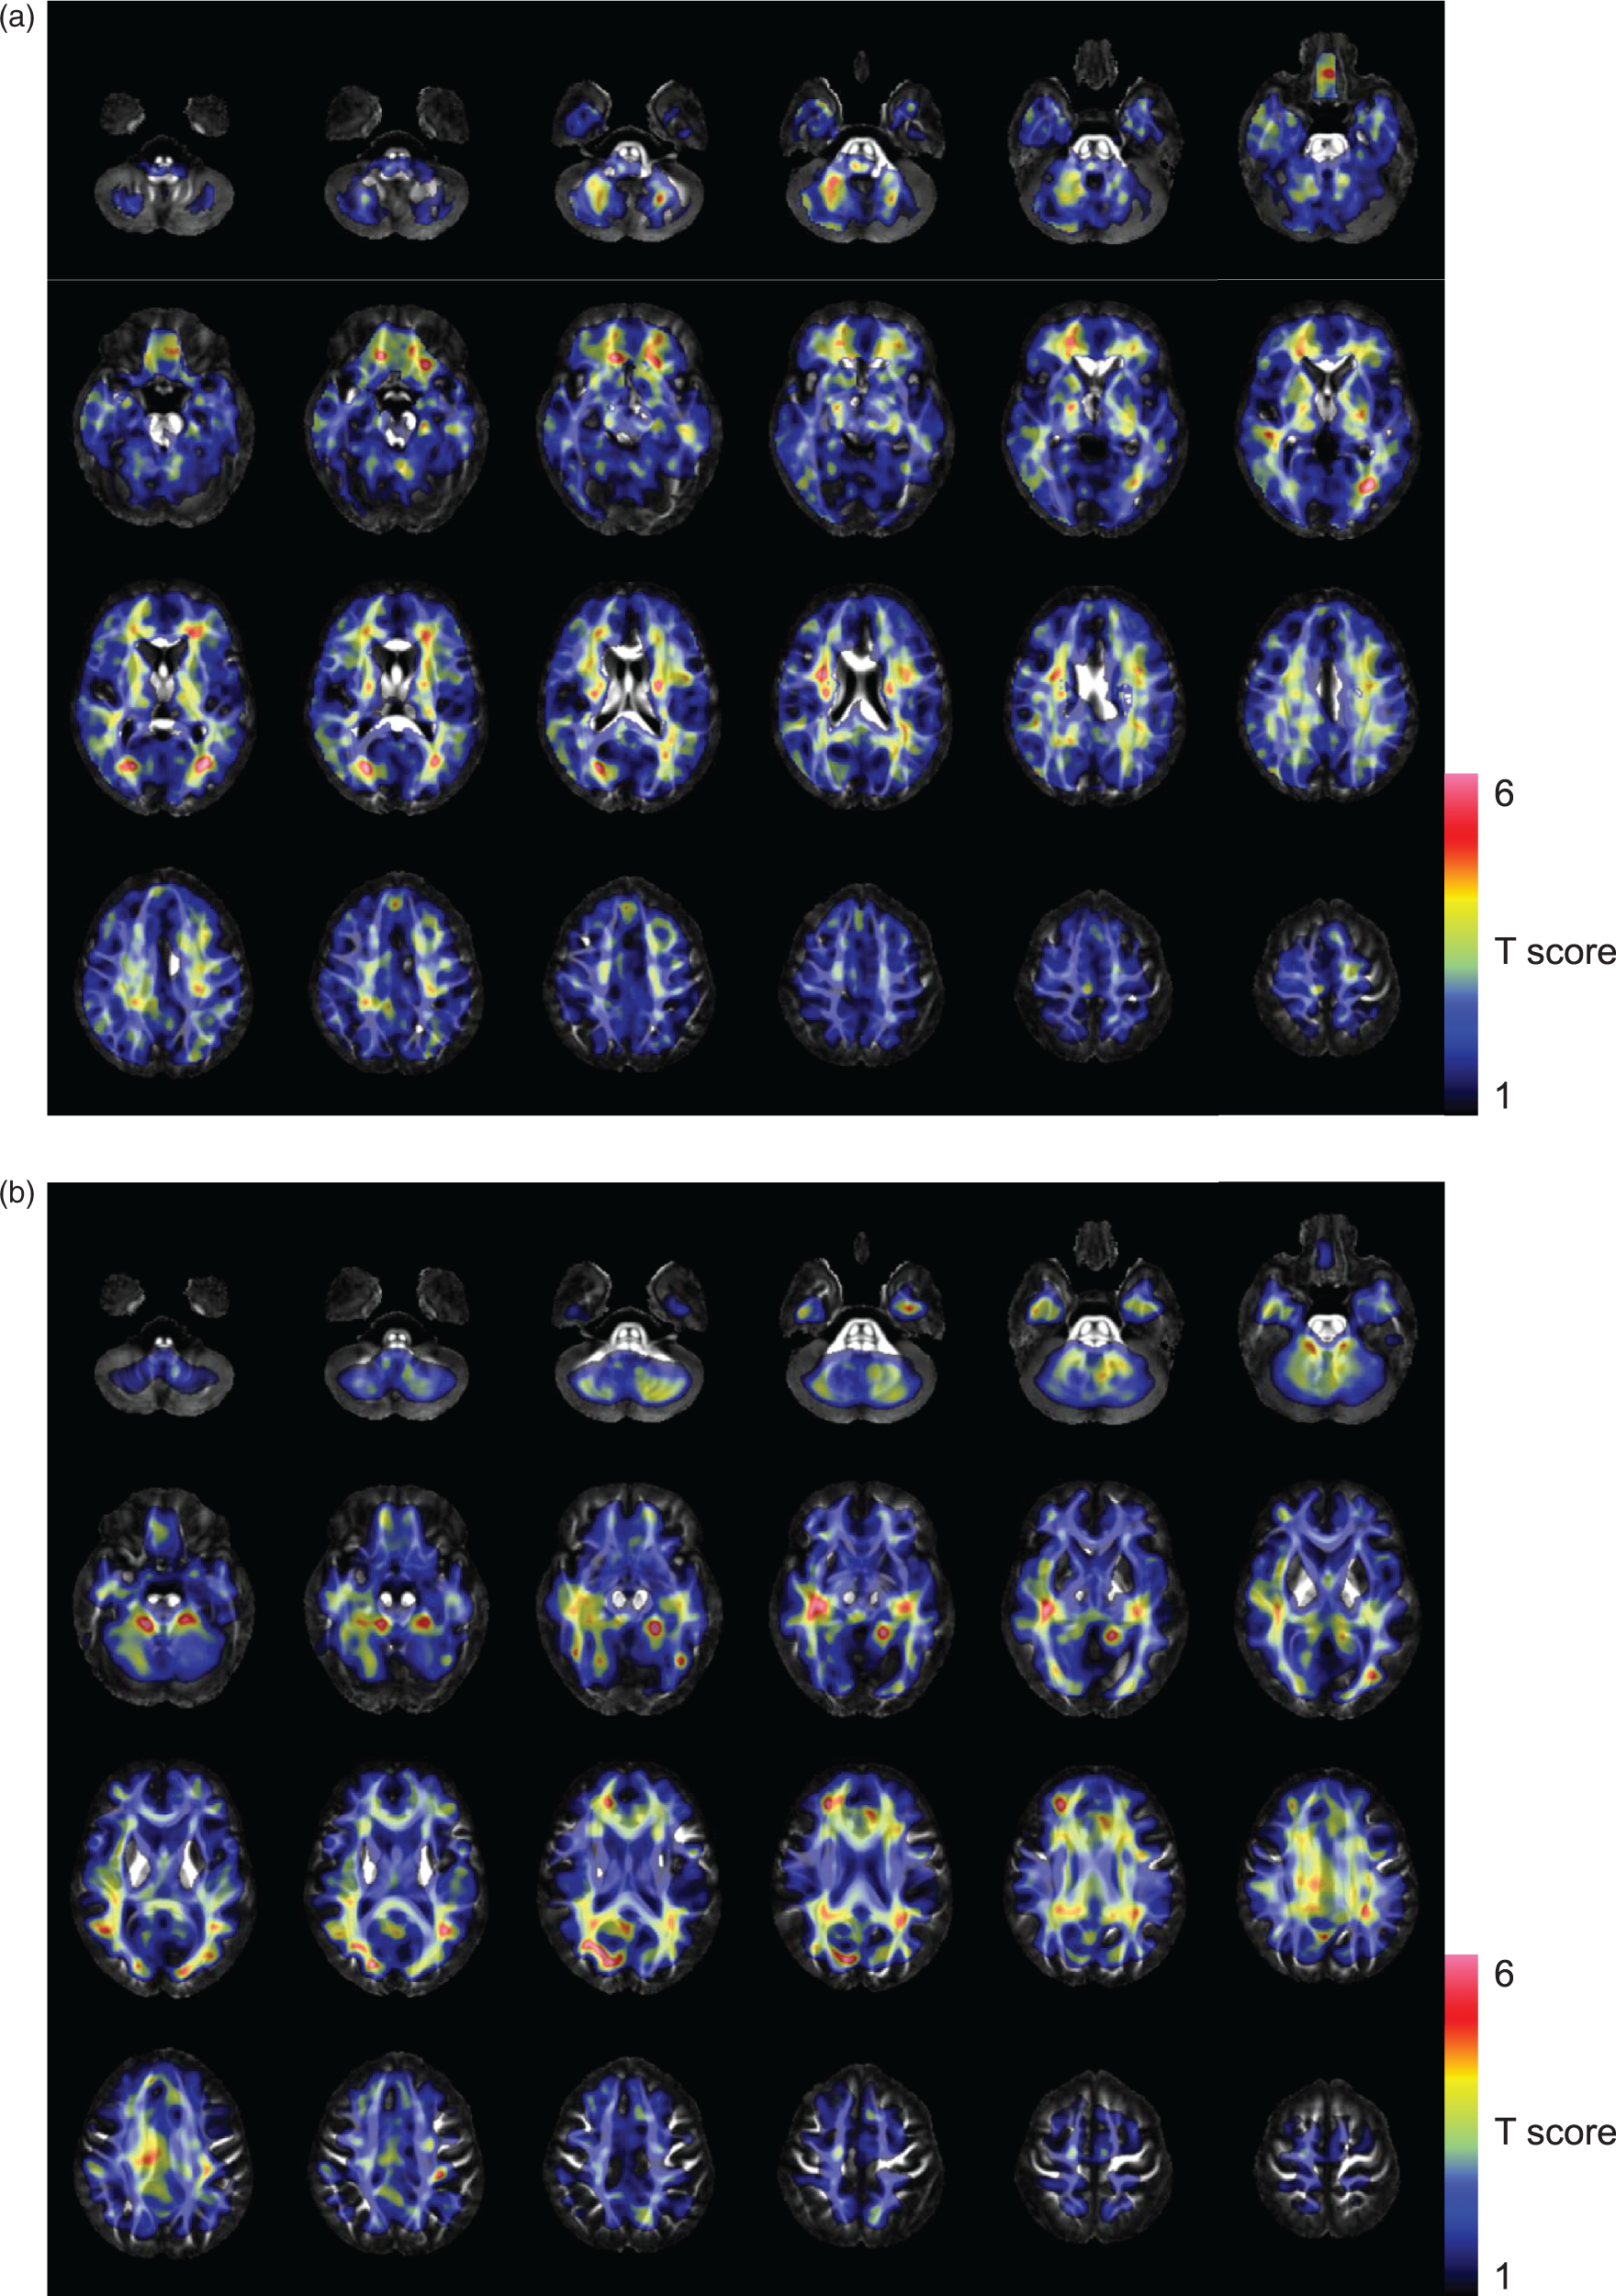
The SPM analysis results are overlaid onto the FA template. Colored voxels indicate T-scores showing increased k2 values of 1-C-11 acetate (a), and decreased FA values (b) in the MS group as compared to the NC group. Each image was anatomically normalized using the transformation matrix obtained by normalization of the coregistered T1-weighted 3 D MRI. FA images were smoothed for the analysis using a 10-mm FWHM isotropic Gaussian kernel for matching of the spatial resolution with the 1-C-11 acetate k2 images.
No significant difference in the O2 saturation in the arterialized-venous blood (SaO2) samples was detected between NC and MS groups (Mann-Whitney’s U test).
MS patients showed significantly lower scores in the paced auditory serial addition test (PASAT) 2 and PASAT3 in the BRB-N test than the NC group (Table 2), even after adjustments for the age and gender. In the patients with MS, the scores of the symbol digit modalities test (SDMT) and the word list generation test (WLG) in the MS patients were significantly correlated with the FA values on the tracts (ρ = 0.935, 0.905, p = 0.006, 0.01 respectively), even after adjustments for the age and gender. However, there was no significant association between the BRB-N test scores and the k2 value of 1-C-11 acetate. The total number of T1 black holes in the blain was significantly correlated with mean FA on the tracts and the SDMT score (ρ = −0.714, 0.952, p = 0.04, <0.001 respectively), but not with k2 value of 1-C-11 acetate.
Results of the brief repeatable battery of neuropsychological tests in patients with multiple sclerosis (BRB-N).
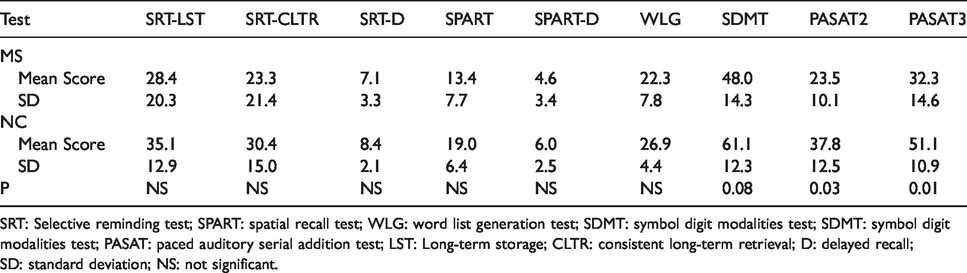
SRT: Selective reminding test; SPART: spatial recall test; WLG: word list generation test; SDMT: symbol digit modalities test; SDMT: symbol digit modalities test; PASAT: paced auditory serial addition test; LST: Long-term storage; CLTR: consistent long-term retrieval; D: delayed recall; SD: standard deviation; NS: not significant.
Discussion
Although astrocytic activation is known to be one of the key factors in the pathogenesis of MS, few in-vivo imaging studies have attempted to elucidate/visualize the disease status based on this phenomenon. It has been argued that the loss of tracer is mainly because of back diffusion of C-11 CO2, and that the rate of this tracer loss, described by the k2 value, reflects the production of CO2 and is therefore closely related to oxidative metabolism. 8 According to a previous report, 5 at first, 1-C-11 acetate is taken up only by astrocytes and not by neurons. Thereafter, radio-labeled CO2 is produced from 1-C-11 acetate in the second turn of the tracer in the TCA cycle, and washed out of the brain tissue with a slight delay. 5
Although it is impossible to completely deny that the loss of radioactive tracer would also include unmetabolized 1-C-11 acetate, labeled glutamine/glutamate from astrocytes, and C-11 CO2 from neurons, the contributions of these to the tracer efflux during the approximately 30-min image acquisition period may be considered to be negligible.9,16,17 In this study, the PET acquisition time was longer than 30 min. Even though a certain fraction of labeled glutamine/glutamate was transferred to the neurons in a later phase, the contribution of neuronal C-11 CO2 production could be expected to be small, because of the substantially low capacity of neurons to metabolize glutamate in terms of the enzyme expression. 17 It has been reported that energy metabolism in myelinating oligodendrocytes is not dependent on the mitochondrial activity in vivo. 18 The expression of acetate-derived acetyl CoA in oligodendrocytes was shown to be very low when the cells were incubated in the presence of C-11 acetate. 19 The contribution of radioactive metabolites derived from oligodendrocytes is also thought to be substantially small. Macrophages infiltrating MS lesions have been shown to express monocarboxylate transporters (MCTs).20,21 It has been reported that acetate enhances the immune response by indirectly activating macrophages. 22 Although k2 values are considered to reflect the rate of acetate metabolism in astrocytes, the contribution of the metabolism in the infiltrating immune cells remains to be elucidated. There is little evidence, until date, to suggest acetate metabolism in the microglia. Microglia have been shown to express MCTs in the normal human brain, however, no disease-related alterations of the MCT expression have been reported in MS patients. 21 On the other hand, studies using translocator protein PET have recently suggested mitochondrial activation in the microglia in MS. 23 Thus, the contribution of microglia to the increase of acetate turnover in MS remains a possibility.
In this study, a significantly higher washout rate of 1-C-11 acetate from the central nervous system was observed in MS patients as compared to NC subjects. This increase in the value of the pharmacokinetic parameter, k2, was more pronounced in the white matter than in the gray matter (Figure 2), and thus the parametric images of k2 were clearly different in terms of the gray/white matter contrast between the MS patients and NC subjects (Figure 3).
Interestingly, voxel-based comparison of k2 images showed that most prominent changes in k2 were located along the neuronal fiber tracts (Figure 4(a)), implying that mainly astrocytes in the proximity of myelin or axons are activated in MS. On the other hand, statistics of FA by the method like voxel-based morphometry revealed a distribution of tracts with low FA in the neuronal fiber tracts in MS (Figure 4(b)). Although interpretation of the changes in FA remains under debate, it has been reported that decrease of the FA reflects demyelination and/or axonal injury.24,25 In the present study, in fact, the total number of T1 black holes showed a significantly negative association with the mean FA values along the neuronal tracts. Neuronal fiber tracts with axonal damage have been reported to coexist with MRI lesions in the brain of MS patients, 26 and to be correlated with lower FA values, 27 implying the existence of an association between FA and demyelination and axonopathy in MS. Thus, our results lend support to the notion that reactive changes of astrocytes is, at least in part, spatially and temporally associated with the resultant demyelination or axonal loss of neuronal fibers. 28
In the present study, a significant decrease of the FA value was not associated with a significant increase of the k2 value in terms of the T-score in the fornix, corpus callosum, including the tapetum, cingulate gyrus or sagittal striatum. The lack of association seems to indicate that the increased k2 was unrelated to the microstructural changes in some regions. Reduction of the FA value found here may thus be due to secondary degeneration of damaged axons associated with astrocyte activation in remote regions within or even outside the corpus callosum, cingulate gyrus or sagittal striatum (e.g. Wallerian degeneration). 29 Although no decrease of the FA was found in the internal capsule in MS patients, as previously reported,30,31 marked increase of the k2 value was observed, especially in the posterior limb of the internal capsule. This finding may be related to the dual roles of astrocytes; that is, not only may reactive astrocytes cause axonal degeneration and demyelination, but they may also promote remyelination 32 and have protective actions on axons. Astrocyte activation may be temporal and not necessarily cause regional microstructural changes. Hence, longitudinal evaluations by 1-C-11 acetate PET and MRI in a single subject are expected to be useful to elucidate the roles of reactive astrocytes in MS.
As reported in a previous study conducted in Japanese patients with MS, 33 cognitive function decline was found in MS patients by the SDMT and PASAT, which are known as sensitive measures of cerebral integrity, 34 especially, sustained attention and concentration, in the BRB-N test. 15 In the patients with MS, the SDMT and/or WLG scores were negatively correlated with the total number of black holes in the T1-weighted MR images and the global axonal integrity based on the FA values; on the other hand, there was no significant association between the BRB-N scores and the astrocyte reactivity based on the k2 value of 1-C-11 acetate. Although axonal damage is thought to underline the neuro-functional decline in MS, including in the cognitive function decline, 31 astrocyte activation may precede the demyelinating process 35 or may activate protective processes to prevent demyelination and/or axonal damage causing cognitive function abnormalities. No significant correlations between the expanded disability status scale (EDSS) score and the image parameters were found, although the EDSS score has been shown to be associated with the FA value in MS patients. 36 This is possibly because the range of variation of the EDSS scores was relatively small in this study.
K1 values in the gray and white matter were found to be significantly increased in patients with MS. K1 is the product of the cerebral blood flow and the extraction fraction, which is relatively low (18% ± 5%) 8 and has room to increase in pathological conditions. A number of studies have demonstrated reduced cerebral blood flow in the gray and white matter in MS patients.37–39 These findings suggest an increase of the extraction fraction of 1-C-11 acetate in both the gray and white matter in patients with MS. Although the mechanism underlying this phenomenon is unknown, increased expression of MCTs in the astrocytes in MS 21 can promote extraction of monocarboxylate in association with increased metabolism. The moderately high Vt values observed in patients with MS may account for the higher accumulation of labeled glutamine/glutamate derived from 1-C-11 acetate. We have reported higher brain accumulation of 1-C-11 acetate in patients with MS than in NC subjects 20–40 min after administration of the compound, using static PET. 7 This phenomenon was speculated as being reflective of the increased extraction of 1-C-11 acetate observed in this study.
The present study had limitations. The patients in this study were not homogeneous from the viewpoint of the disease phenotype, clinical status or therapy received. Further investigation is needed to determine the effects of therapy, clinical status of MS, and subtype of the disease on the astrocyte metabolism.
Arterialized venous blood sampling using an electric warming pad was performed instead of arterial blood sampling so as to obtain minimally invasive estimation of the input function. 40 Use of a forearm warming device has been known to decrease PaO2 in arterialized venous blood, 41 whereas it increases arteriovenous shunting. The average oxygen saturation of arterialized venous blood was 92.2 ± 5.8% (mean ± SD) in this study. According to a previous study, even with an oxygen saturation level of only 92.5% in arterialized blood, metabolic substrate concentrations were shown to be comparable with those in true arterial blood. 18 In relation to the reversible inhibitor of brain MAO-A, C-11 befloxatone, venous sampling tended to underestimate the peak of the input function in the very early phase after tracer injection as compared to arterial sampling, whereas both yielded remarkably similar input curves immediately after the peak until the end of the scanning. 42 Although quantitative measurement of k2 may be affected by intersubject variability of estimation of the early phase input function, the degree of arterialization of the venous blood samples did not differ between the two groups, as mentioned above. Even if early-phase arteriovenous gap in the tracer concentration caused some error, the results of the group comparison of the efflux parameter would still be reliable.
Concordance of the ratio of C-11 CO2/total C-11 radioactivity in the arterial and venous blood was demonstrated within 1 min after the injection of 1-C-11 acetate in swine in the resting state. 43 According to this finding, extraction of 1-C-11 acetate as it passes through capillaries or arteriovenous shunts is thought to be negligible, because C-11 CO2 is a unique metabolite of 1-C-11 acetate in the blood. 8 Although Buck et al. suggested that metabolite correction could be performed using a mathematical method in close agreement with the measured values, 12 possibilities of perturbation due to MS pathology cannot be eliminated. According to a whole-body 1-C-11 acetate PET study, the organs that show the highest accumulation of 1-C-11 acetate are the pancreas, bowel, kidneys, spleen, heart, and liver. 44 Pathological changes in these organs are not common in MS, and no functional abnormalities of these organs were identified in the MS patients in the present study. It is, therefore, unlikely that ratio of the unmetabolized tracer significantly changes in patients with MS. Further studies are, however, required to validate this approximation under pathophysiologic conditions to increase the accuracy of the measurements.
The partial volume effect is theoretically small on the k2 values, but not on the K1 or Vt values, especially in small lesions. However, no partial volume correction was performed in this study, because cerebral atrophy was not evident in any of the patients with MS in this study, and lesion-based analysis was not performed in the present study.
In conclusion, the present study clarified that the pathological changes in relation to astrocytic reactivation in MS patients could be visualized by quantitative 1-C-11 acetate PET. It is expected that treatment-related changes in gliosis in MS or of the inflammatory activities in other neurodegenerative diseases can be evaluated by this imaging modality.
Footnotes
Acknowledgements
We thank Dr. Hisashi Tanaka and Dr. Yoshiyuki Watanabe of the Department of Radiology and the staff of the Department of Nuclear Medicine and the cyclotron staff of Osaka University Hospital for their technical support in performing this study. We also acknowledge the help of the entire staff of the Department of Nuclear Medicine, Osaka University Graduate School of Medicine, with the PET data acquisition and care of the subjects.
Authors’ contributions
HK performed the analysis and interpretation of the data and also wrote the article. TO, TK, MS, and KI were involved in the acquisition of the data and in the analysis and interpretation of the data. TO and TK were engaged in the cognitive testing and interpretation of data. TO and MS performed interpretation of the MRI and detected the lesions. HM, YN, and JH contributed substantially to the conceptualization and design of the study. All the authors revised the article carefully and critically, and approved the final version submitted for publication.
Declaration of conflicting interests
The author(s) have no potential conflicts of interests to declare with respect to the conduct of the research, the authorship, and/or publication of this article.
Funding
The author(s) disclosed receipt of the following financial support for the research, authorship, and/or publication of this article: This work was supported by JSPS KAKENHI Grant Number JP 18975747 and 15K093339.