
Abstract
Positron emission tomography (PET) with [11C]raclopride has been used to investigate the density (Bmax) and affinity (Kd) of dopamine D2 receptors related to several neurological and psychiatric disorders. However, in assessing the Bmax and Kd, multiple PET scans are necessary under variable specific activities of administered [11C]raclopride, resulting in a long study period and unexpected physiological variations. In this paper, we have developed a method of multiple-injection graphical analysis (MI-GA) that provides the Bmax and Kd values from a single PET scan with three sequential injections of [11C]raclopride, and we validated the proposed method by performing numerous simulations and PET studies on monkeys. In the simulations, the three-injection protocol was designed according to prior knowledge of the receptor kinetics, and the errors of Bmax and Kd estimated by MI-GA were analyzed. Simulations showed that our method could support the calculation of Bmax and Kd, despite a slight overestimation compared with the true magnitudes. In monkey studies, we could calculate the Bmax and Kd of diseased or normal striatum in a 150 mins scan with the three-injection protocol of [11C]raclopride. Estimated Bmax and Kd values of D2 receptors in normal or partially dopamine-depleted striatum were comparable to the previously reported values.
Introduction
Positron emission tomography (PET) with [11C]raclopride has been widely used to investigate the availability of striatal dopamine D2 receptors in vivo (Farde et al, 1985; Köhler et al, 1985; Hall et al, 1988). A number of postmortem studies have shown that the abundance of dopamine D2 receptor is elevated in striatum samples from untreated patients with Parkinson's disease (Guttman and Seeman, 1985; Seeman et al, 1987) and in schizophrenic patients who had never taken antipsychotics (Cross et al, 1981; Joyce et al, 1988). The PET measurements have made it possible to quantify in vivo the density and apparent affinity of receptors by systematically varying the specific activity (or mass) of an administered radioligand (see for example, Farde et al, 1986). A study of Parkinson's disease by Rinne et al (1995) with in vivo PET showed increased density and unchanged affinity of dopamine D2 receptors in the putamen in comparison with healthy controls. In corresponding studies of schizophrenia, early findings with [11C]N-methylspiperone indicated elevated D2 binding, which was not replicated in some subsequent studies with [11C]raclopride (Wong et al, 1986; Farde et al, 1987, 1990). Dysfunction of dopamine receptors has also been suggested in other neurodegenerative or psychiatric diseases (e.g., multiple-system atrophy, progressive supranuclear palsy, and attention-deficit hyperactivity disorders); however, there have been only a few studies that examined receptor function directly related to density and affinity. This might be due to the inherent difficulty in measuring absolute receptor abundance based on PET recordings.
In PET scans, to determine the density and affinity of receptors directly as parameters of kinetic model, it is necessary to apply a compartmental analysis based on a two-tissue compartment five-parameter model including density of receptors Bmax (pmol/mL), bimolecular association rate constant kon (mL/pmol/min), and unimolecular dissociation rate constant koff (min−1) (Farde et al, 1989). However, since data from a single PET scan are not enough to determine the Bmax and kon individually, multiple PET scans should be taken with different molar amounts of injected ligand. In addition, model parameters are estimated by a nonlinear least squares fitting with the metabolite-corrected plasma input function, so the solutions are often unstable and sensitive to statistical noise, and invasive arterial sampling is required to use this method.
Farde et al (1986, 1989) determined the value of Bmax and apparent affinity Kd ( = koff/kon) by a graphical analysis using a time-activity curve (TAC) of the specifically bound target region and a reference region where specific bindings are negligible. In this method, the ratio of specific bound and free ligand concentrations at the equilibrium state are plotted versus the concentration of specific bound ligand, and Bmax and Kd are estimated from the slope and intercept of the regression line. Other groups also used the value of distribution volume ratio — 1 estimated from the graphical analysis of Logan et al (1996), instead of the ratios of specific bound and free concentration, to obtain stable values of the y-axis quantity (Logan et al, 1997; Doudet and Holden, 2003; Doudet et al, 2003). These methods are practical, because they do not require arterial blood sampling, and their respective estimation processes are easy to carry out. However, to estimate the regression line of a graphical plot, multiple PET scans (at least two or three) are required under variable molar amounts of administered ligand, so scans have been performed on separate days. Even in quantitative PET scans, the separate day protocol may suffer from interday or intraday variations in physiologic conditions, such as cerebral blood pressure, flow, and receptor bindings, which may affect the accuracy of the estimates.
We developed a method, called the multiple-injection simplified reference tissue model (MI-SRTM), to measure the change in binding potential (BPND = k3/k4 (Mintun et al, 1984)) of dopamine D2 receptors from a single session of PET scanning with multiple injections of [11C]raclopride (Watabe et al, 2006; Ikoma et al, 2009), and we showed that this method could detect the change in BPND because of an increase in mass of administered [11C]raclopride in a short scanning period, which is a prerequisite for measuring the saturation binding parameters as steady state. In this study, we extend our earlier report for estimating Bmax and Kd from a single session of PET scanning with triple injections of [11C]raclopride using MI-SRTM and the graphical analysis, and we validated the proposed method by performing numerous simulations and studies on monkeys using PET and [11C]raclopride.
Materials and methods
Theory
Graphical Analysis with a Reference Region for Estimation of Density and Affinity:
Graphical analysis based on the Scatchard plot (Scatchard, 1949) has been used to estimate the values of Bmax and Kd from as series of PET recordings with various molar amounts of administered ligand (Farde et al, 1986). In brief, the ratios (B/F) of specific bound ligand concentration (B [pmol/mL]) and free ligand concentration (F [pmol/mL]) at equilibrium are plotted versus B. In this plot, the slope and x-intercept represent -1/Kd and Bmax, respectively. In general, for graphical analysis without arterial blood sampling, the total radioligand concentration in the reference region (Cr [Bq/mL]), where specific bindings are negligible, is used as an estimate of the free radioligand concentration in the target region (Cf [Bq/mL]), that is Cfref = Cr, and the specific binding radioligand concentration in the target region (Cb [Bq/mL]) is defined as radioactivity in the target region (Ct [Bq/mL]) reduced with Cr, that is Cbref = Ct-Cr (Figure 1). The radioactivity concentrations of Cfref and Cbref, at the point in time when d Cbref/dt is 0 (Teq), are divided by a specific activity of the administered ligand, and used as F and B at the transient equilibrium in the graphical analysis (Farde et al, 1989). In our study, we use the nomenclature Bref and Fref to represent the concentrations otherwise known as B and F. The value of the y axis, Bref/Fref, is sometimes replaced by the binding potential estimated by the graphical analysis of Logan et al (1996) or some other method (Logan et al, 1997; Doudet and Holden, 2003; Doudet et al, 2003).
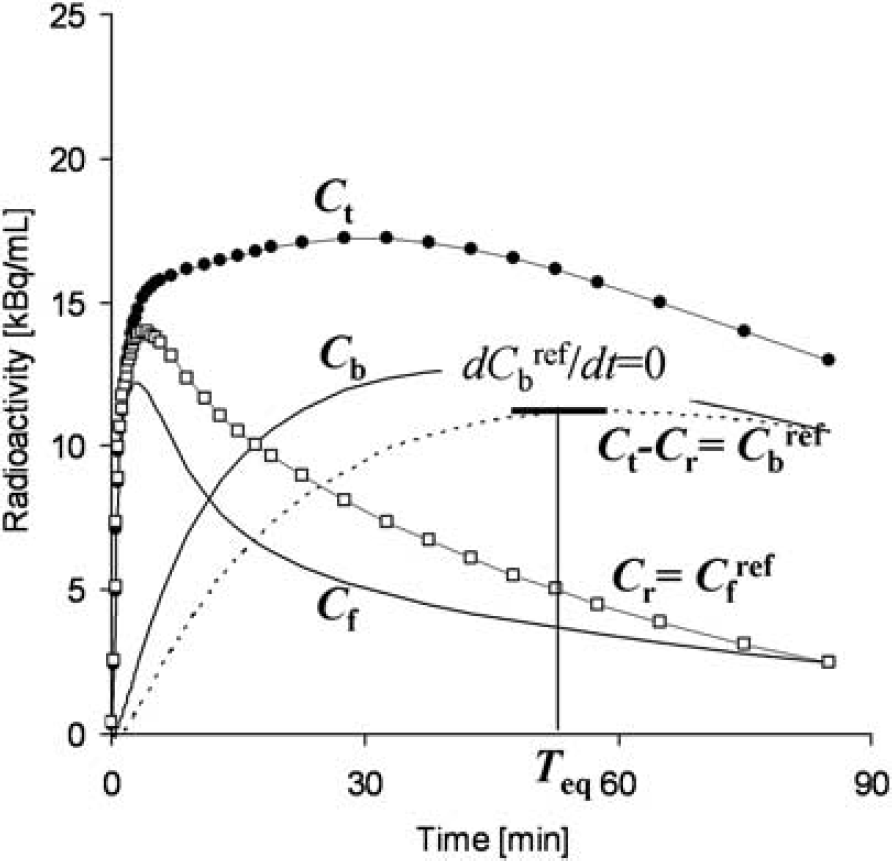
An example of simulated TACs for the striatum (Ct), free (Cf), and specific bound (Cb) concentrations in the striatum, the cerebellum used as a reference region (Cr) and bound concentration in the striatum estimated using a reference region (Cbref = Ct–Cr) with K1 = 0.033, K1/k2 = 0.59, kon = 0.0033, Bmax = 25.7, k4 = 0.034 for the striatum, and K1 = 0.034, K1/k2 = 0.36, k3 = 0.022, k4 = 0.034 for the cerebellum. The time point of dCbref/dt =0 (Teq) is considered the transient equilibrium, and bound concentration at the equilibrium (Bref) is obtained from the radioactivity concentration of Cbref at Teq.
Multiple-Injection Simplified Reference Tissue Model for Estimation of Binding Potential:
A simplified reference tissue model (SRTM) can provide three parameters (R1, k2, BPND) without invasive arterial blood sampling by using a TAC of the reference region (Lammertsma and Hume, 1996). The MI-SRTM extended this SRTM for sequential multiple injections in a single session of PET scanning by taking into account the residual radioactivity in the target tissue at the time of each injection. As such, the magnitude of BPND for the ith injection is described in the following terms (Ikoma et al, 2009):
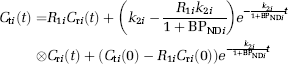
where Cti and CTi are the radioactivity concentrations in the target and reference region, respectively, and t is the time from the start of the ith injection.
Multiple-Injection Graphical Analysis for Estimation of Density and Affinity:
The conventional graphical analysis was applied to the Bmax and Kd estimations with the multiple-injection approach. In this multiple-injection graphical analysis (MI-GA), the BPND calculated for each injection using MI-SRTM was plotted as a function of the concentration of specific bound raclopride at the transient equilibrium (Bref [pmol/mL]) within the scan duration for each injection, and Bmax and Kd were estimated from the regression line.
In this study for [11C]raclopride, the TAC of the cerebellum was used as the reference TAC. Each parameter in the MI-SRTM was estimated by nonlinear least squares fitting with iteration of the Gauss–Newton algorithm. It should be noted that the transient equilibrium condition is required for each injection in the MI-GA.
Simulation Analysis
Simulations were performed to determine the range of administered mass of three injections and to evaluate feasibility of the MI-GA to estimate the Bmax and Kd.
Effect of Injected Mass on BPND Estimates:
To investigate the effect of the administered molar amount of [11C]raclopride on BPND estimates and to determine the molar amount of three injections for monkey studies, a relationship between BPND and Bref was obtained by a computer simulation. Noiseless TACs of the striatum and cerebellum were generated with a measured plasma TAC and assumed parameter values derived from measurements taken from the monkey studies. The TAC of the cerebellum was simulated with a conventional two-tissue compartment four-parameter model with assumed parameter values obtained earlier in our monkey studies: K1 = 0.034 (mL/mL/min) K1/k2 = 0.36, k3 = 0.022 (min−1), k4 = 0.034 (min−1). Meanwhile, the TAC of the striatum was simulated with a two-tissue compartment five-parameter model expressed as Equation (2) by solving these differential equations with the numerical analysis of fourth-order Runge–Kutta method with assumed parameter values K1 = 0.033 (mL/mL/min), K1/k2 = 0.59, kon = 0.0033 (mL/pmol/min), Bmax = 25.7 (pmol/mL), k4 = 0.026 (min−1), and SA = 37 (GBq/μmol):
where Cf and Cb are the concentrations of radioactivity for free and specifically bound [11C]raclopride in tissue, respectively; and SA is the specific activity of administered [11C]raclopride.
As reference, the relationships between Bref and BPND or Bref/Fref were investigated in the case of a single injection of [11C]raclopride by varying injected mass. TACs of the striatum and cerebellum for the single injection with a 50 mins scan were generated using the measured plasma TAC of a single injection in which the input plasma TAC was amplified, such that the corresponding mass increased from 1 to 500 nmol per injection. In each simulated TAC, BPND values were estimated by the SRTM, and then, Bref/Fref and Bref were calculated by the transient equilibrium with the cerebellum TAC.
Next, TACs of the striatum and cerebellum for three injections at 50 mins intervals were generated using the plasma TAC of three sequential injections in which the input plasma TAC was amplified so that the mass of the first and second injections would be 1.5 and 10 nmol/kg, and the mass of the third injection would be 1.5 to 150 nmol/kg. In each simulated TAC, BPND values were estimated by the MI-SRTM, and Bref/Fref and Bref for the third injection was calculated by the transient equilibrium with the cerebellum TAC. The relationships between Bref and BPND or Bref/Fref for the third injection were investigated, and compared with that for the single injection.
Estimation of Bmax and Kd Values by the Multiple-Injection Graphical Analysis:
The reliability of Bmax and Kd estimates by the graphical analysis was investigated for the proposed sequential multiple-injection approach (single PET scan) and compared with that for the conventional nonsequential approach (three PET scans on different days, such that no residual mass remained). Noiseless TACs of the striatum and cerebellum were simulated using assumed parameters of the two-tissue compartment model mentioned above and the plasma input function for three injections in which the magnitude of each ‘virtual’ input function was adjusted so that the injection mass would be 1.5, 10, or 30 nmol/kg determined from the simulation study mentioned above, with 50 mins intervals as reported by Ikoma et al (2009). In the striatum TACs, Bmax values were varied from 10 to 50 pmol/mL at 5 pmol/mL intervals with other parameters fixed (Kd = 7.9 pmol/mL), or Kd was varied from 3 to 15 at 2 pmol/mL intervals by changing kon with other parameters fixed (Bmax= 25.7 pmol/mL). For each TAC, Bmax and Kd were estimated by the MI-GA from three points obtained by MI-SRTM for the single PET scan approach and they were estimated by the graphical analysis from three points obtained by the conventional SRTM for the three PET scan approach. Then, estimates were compared with the true values. In the single PET scan approach, Bmax and Kd were also estimated without reference TAC by the MI-GA from three points of BPND and B obtained by the two-tissue compartment four-parameter model with the plasma input function shown in the Appendix.
Analysis of Monkey Studies
PET studies were performed on three cynomolgus macaques (weight 6.9 ± 2.1 kg) with the multiple-injection approach. One animal (monN) was a healthy monkey aged 5 years, and the others had a syndrome acquired Parkinsonism. Of these, one (monUP, aged 7 years) had hemiparkinsonism induced by injecting the selective neurotoxin, N-methyl-4-pheny1–1,2,3,6-tetrahydropyridine (MPTP) (0.4 mg/kg) into the right carotid artery (Bankiewicz et al, 1986), whereas the other (monBP, aged 5 years) had bilateral Parkinsonism induced by injecting MPTP (0.4 mg/kg) intravenously and intermittently (twice a week for a total of 14 injections) (Takagi et al, 2005). Each Parkinsonian animal showed typical Parkinsonian symptoms in the limbs (motor slowness, tremor) unilaterally or bilaterally. The PET scan was performed after the symptom reaching stable (6 months after the first injection of MPTP). Anesthesia was induced with ketamine (8.4mg/kg, intramuscularly) and xylazine (1.7 mg/kg, intramuscularly) and maintained by intravenous propofol (6 mg/kg/h) and vecuronium (0.02 mg/kg/h) during the scan. The monkeys were maintained and handled in accordance with guidelines for animal research on Human Care and Use of Laboratory Animals (Rockville, National Institutes of Health/Office for Protection from Research Risks, 1996). The study protocol was approved by the Subcommittee for Laboratory Animal Welfare of the National Cardiovascular Center.
After the synthesis of [11C]raclopride, nonradioactive raclopride was added so that targeted molar amount of raclopride would be administered for three injections (1.5, 10, and 30 nmol/kg); this was done by dividing the [11C]raclopride diluted by nonradioactive raclopride into three portions with different volumes, containing the intended masses of raclopride. For the first injection, 1.9 ± 0.16 nmol/kg (57.0 ± 5.7 MBq) of [11C]raclopride was administered by a bolus injection at the beginning of the scan. Fifty minutes later, the second [11C]raclopride injection, 11.1 ± 0.56 nmol/kg (60.4 ± 8.8 MBq at the time of second injection) was administered by a bolus, and 50 mins after that, a bolus of 31.1 ± 2.1 nmol/kg (30.8 ± 4.4 MBq at the time of third injection) of [11C]raclopride was administered again. Data were acquired for 150 mins (10 secs × 18, 30 secs × 6, 120 secs × 7, 300 secs × 6; total 50 mins for each injection). The specific radioactivity was 4.7 ± 2.2 GBq/μmol at the time of the first injection.
PET scans were performed using a PCA-2000A positron scanner (Toshiba Medical Systems Corporation, Otawara, Japan) that provides 47 planes and a 16.2 cm axial field-of-view. The transaxial and axial spatial resolution of the PET scanner were 6.3 and 4.7mm full width at half maximum (Herzog et al, 2004). A transmission scan with a 3-rod source of 68Ge-68Ga was performed for 20 mins for attenuation correction before the administration of [11C]raclopride. Radioactivity was measured in the three-dimensional mode and the data were reconstructed by a filtered back-projection using a Gaussian filter (3 mm of full width at half maximum). Region-of-interests (ROIs) were defined manually over the left and right striatum and cerebellum for PET images, and the radioactivity concentrations in these regions were obtained. For the left and right striatum, R1, k2, and BPND for each injection were estimated by the MI-SRTM. In addition, parametric images were generated, estimating each parameter voxel by voxel, using the MI-SRTM with a basis function method in which the model Equation (1) was solved using linear least squares for a set of basis functions, which enables the incorporation of parameter bounds (Gunn et al, 1997; Ikoma et al, 2009). Bmax and Kd were estimated by the MI-GA from these BPND values of left and right striatum for three injections.
In the unilateral Parkinsonian animal, three PET scans with conventional single injection with different masses of [11C]raclopride were also performed for comparison with results by the multiple-injection single PET scan approach. A PET scan with a bolus injection of 2.1 nmol/kg (50.6 MBq), 11.3 nmol/kg (60.4MBq), or 31.1 nmol/kg (30.8 MBq) of [11C]raclopride was obtained on separate days. PET data were acquired for 50 mins with the same protocol as the single PET scan approach. The values of R1, k2, and BPND were estimated by the SRTM, and Bmax and Kd were estimated by the conventional graphical analysis.
Results
Simulation Study
Effect of Injected Mass on BPND Estimates:
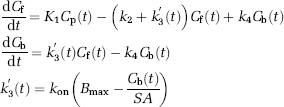
In the simulations, the value of BPND, estimated by the MI-SRTM, decreased as injected molar amount of raclopride increased, that is, concentration of bound raclopride became larger. The relationship between BPND and Bref had a good linear correlation to some extent; however, it did not remain linear for large Bref (Figure 2A). The regression line where Bref < 20 pmol/mL was BPND = −0.091 Bref + 2.4, R2 = 0.997 for the first injection. In the relationship between BPND and Bref, BPND values of the third injection were higher than those of the first injection when Bref was lower than 20 pmol/mL. The ratio Bref/Fref was almost the same as the BPND estimated by MI-SRTM, though it was a little smaller when Bref was lower than 5 pmol/mL (Figure 2B).
Relationship between specifically bound concentration and BPND
Estimation of Bmax and Kd Values by the Multiple-Injection Graphical Analysis:
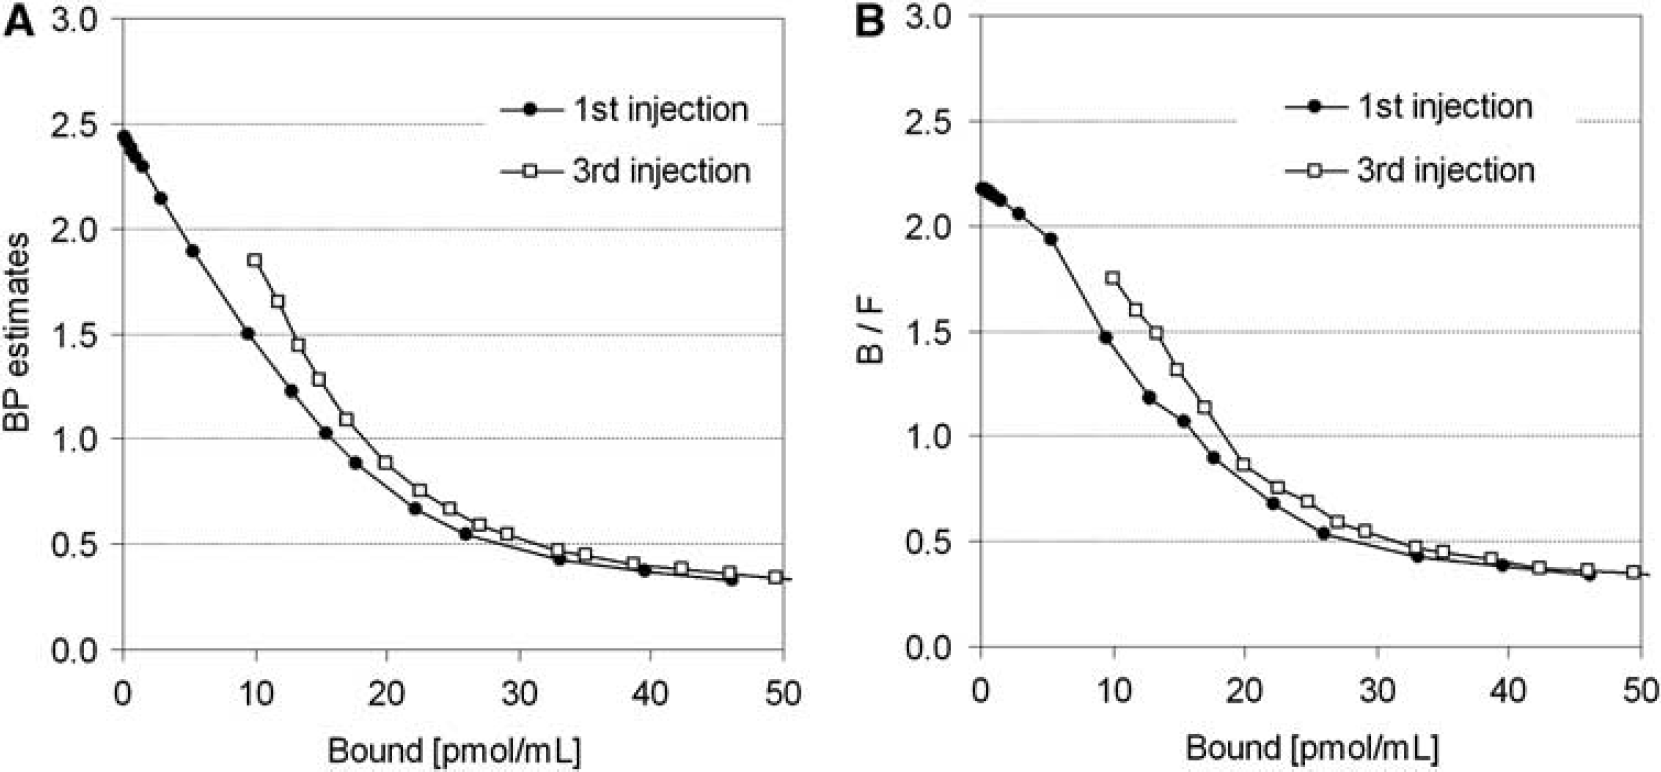
The TACs were calculated for a range of possible Bmax and Kd values, and the relationship between true and estimated Bmax or Kd values was investigated for conventional three PET scan and the proposed single PET scan approaches. When Bmax was varied, Bmax and Kd were overestimated compared with the true values in both three PET scan and single PET scan approaches (Figures 3A and 3B). However, a good correlation was observed between true and estimated Bmax, and there was little variation in estimated Kd when Bmax was set higher than 20 pmol/mL. Similarly, when Kd was varied, although Kd and Bmax were overestimated in both approaches, there was a good correlation between true and estimated Kd, and estimated Bmax was constant (Figures 3D and 3E). In both cases, Bmax and Kd estimates in the single PET scan approach were higher than those in the three PET scan approach. In the TAC simulated with Bmax = 25.7 and Kd = 7.0, estimated Bmax and Kd were 27.8 and 10.5, respectively, in the three PET scan approach, and 32.3 and 12.6, respectively, in the single PET scan approach. In contrast to these approaches with the reference TAC, the overestimation of Bmax and Kd was scarcely observed in the MI-GA with the plasma input function (Figures 3C and 3F).
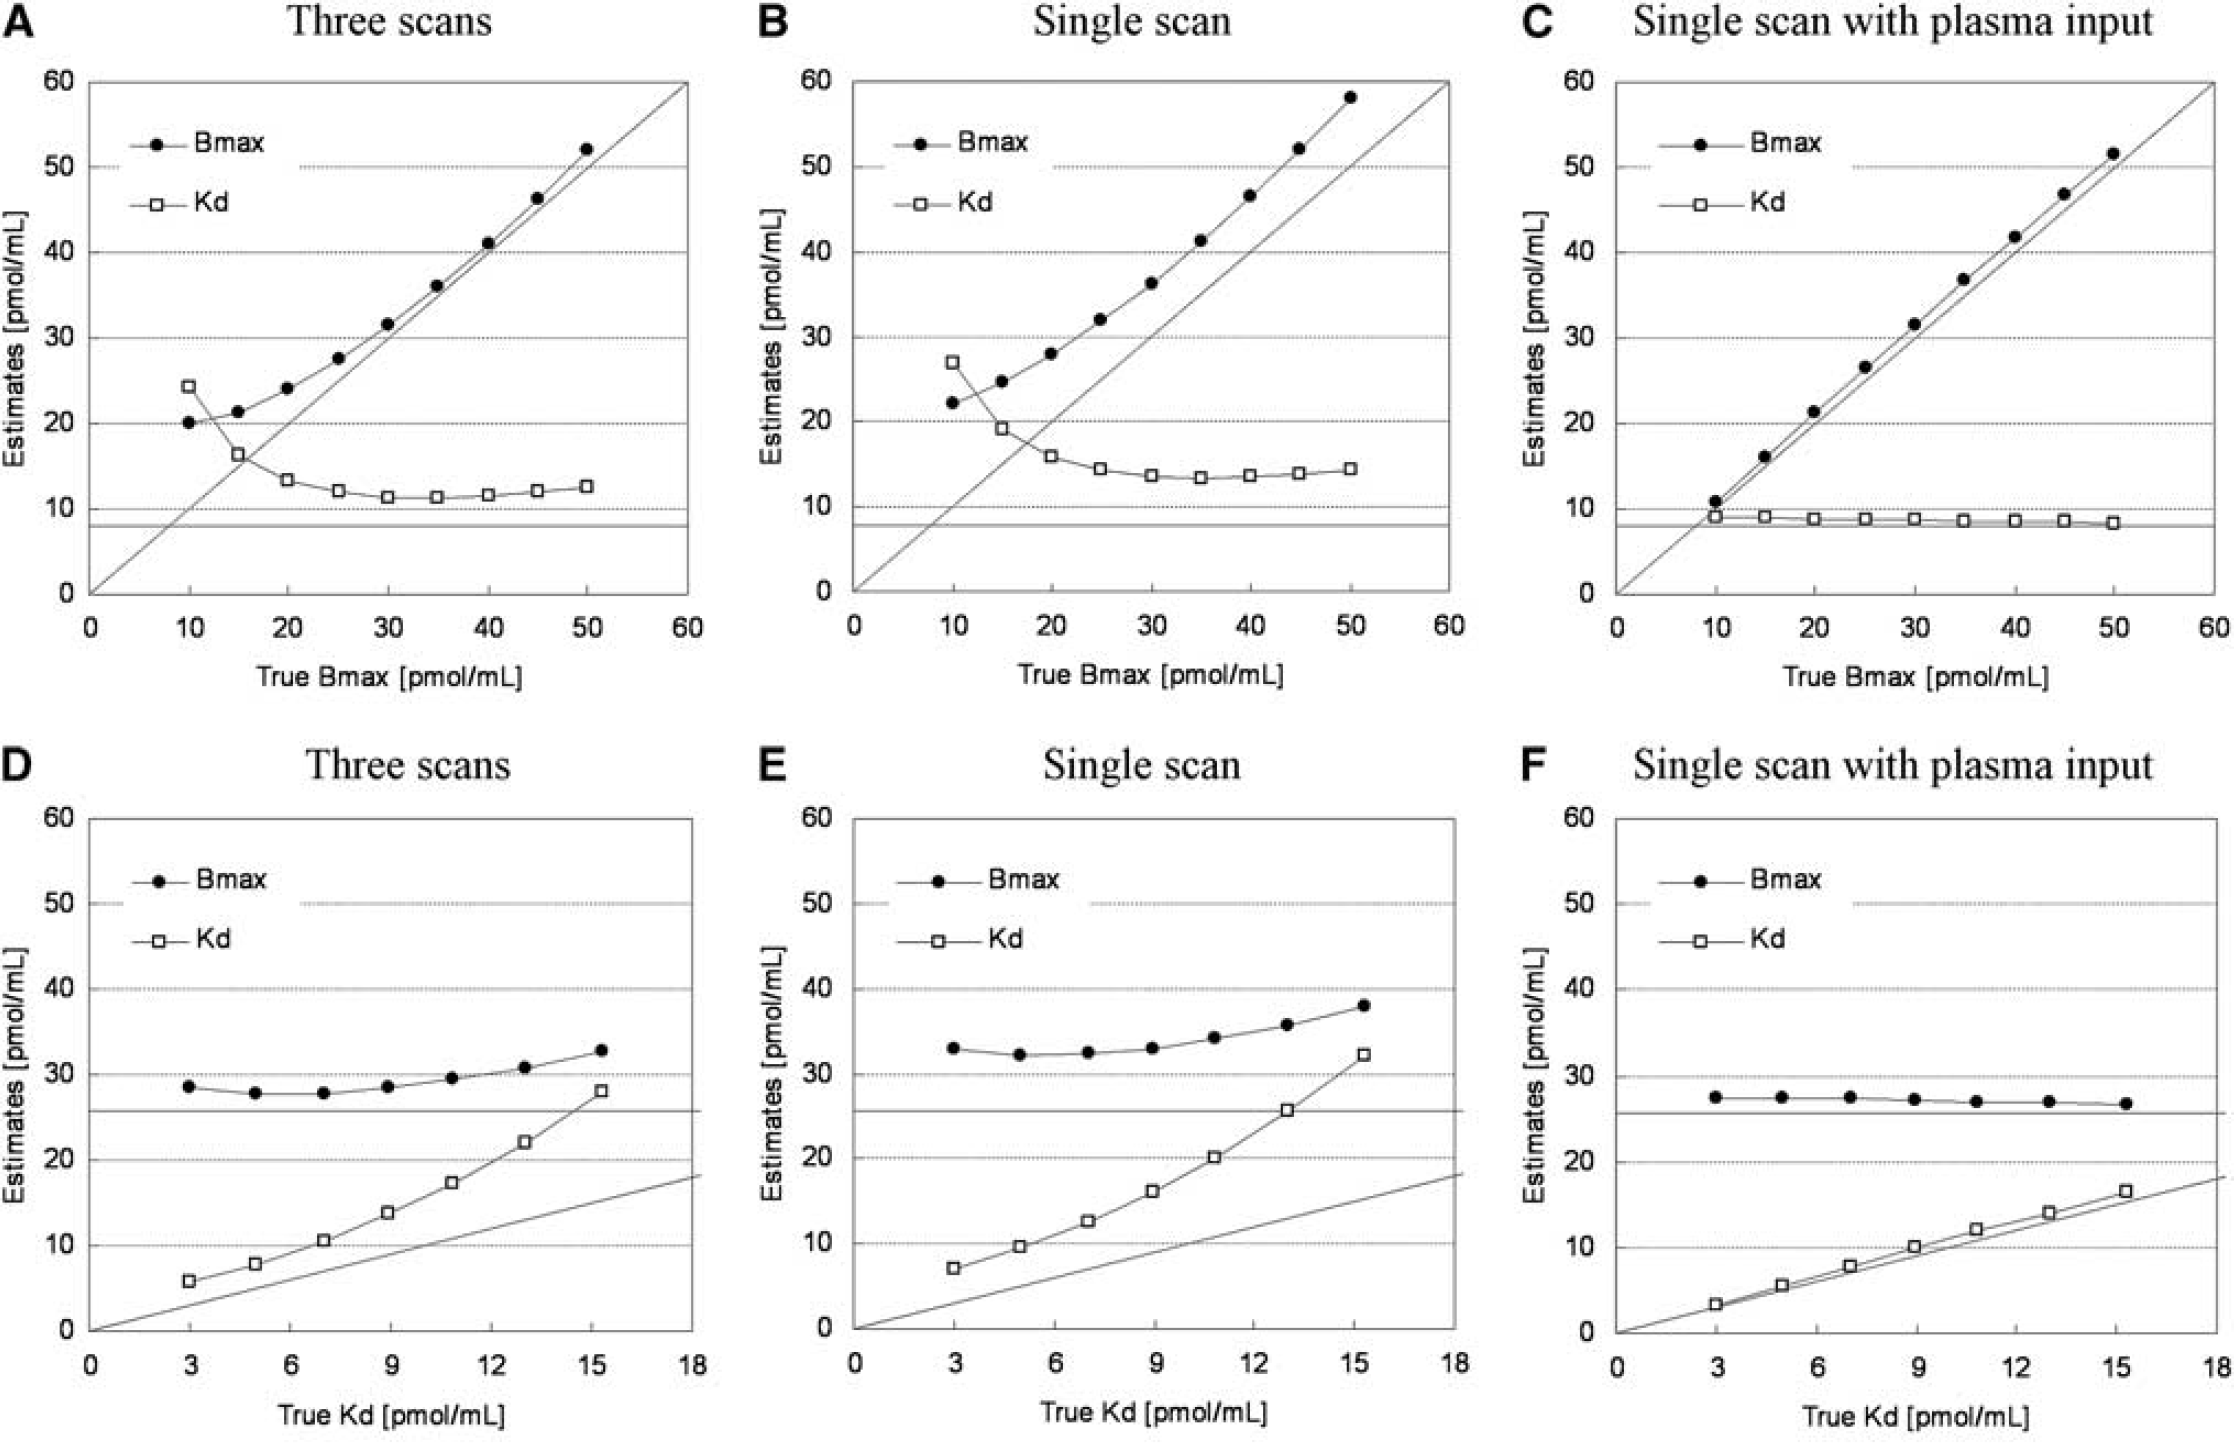
Relationships between estimates and true values of Bmax and Kd for simulated TACs with various Bmax and fixed Kd
Monkey Studies
Typical examples of TACs for the striatum and the cerebellum in the multiple-injection study are shown in Figure 4, and the parametric images of BPND for the first, second, and third injection, and images of Bmax and Kd for the voxels in which BPND1 was higher than 1.5 are shown in Figure 5. The estimated BPND decreased as the injected molar amount of [11C]raclopride became larger in the second or third injection. Estimated BPND1, BPND2, and BPND3 values were 2.3, 1.4, and 0.74, respectively, in the left striatum, and 2.6, 1.9, and 0.87, respectively, in the right striatum. The reduction in BPND was also observed in the parametric images.
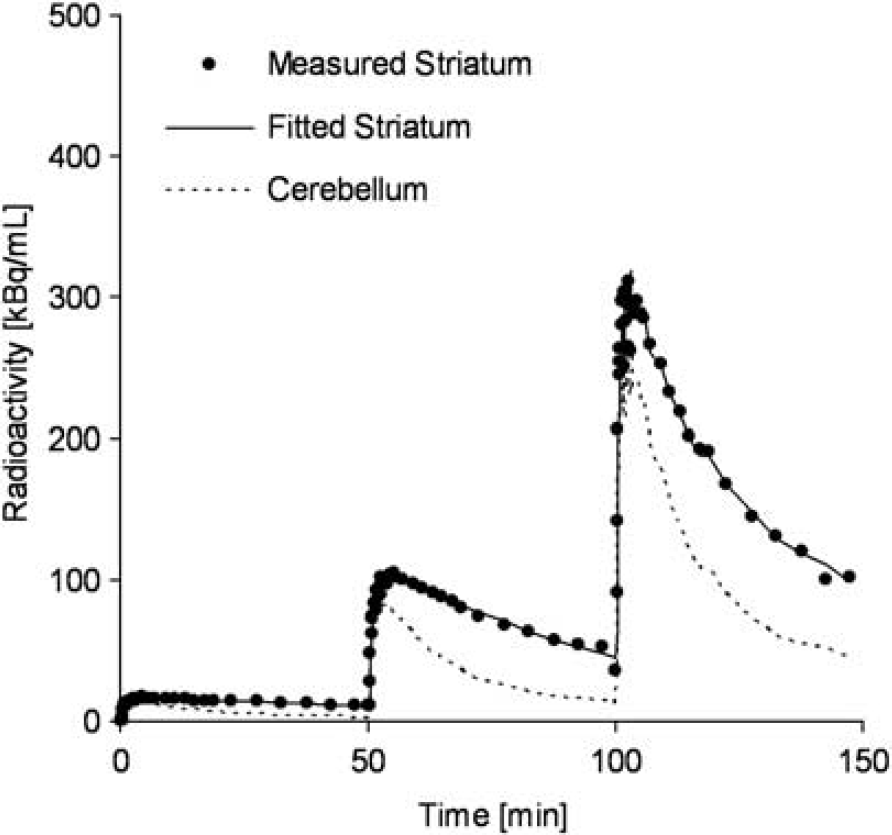
Measured TACs of the striatum and cerebellum and a fitted curve for the striatum using MI-SRTM in the monkey study by a single scan with sequential three injections of [11C]raclopride.
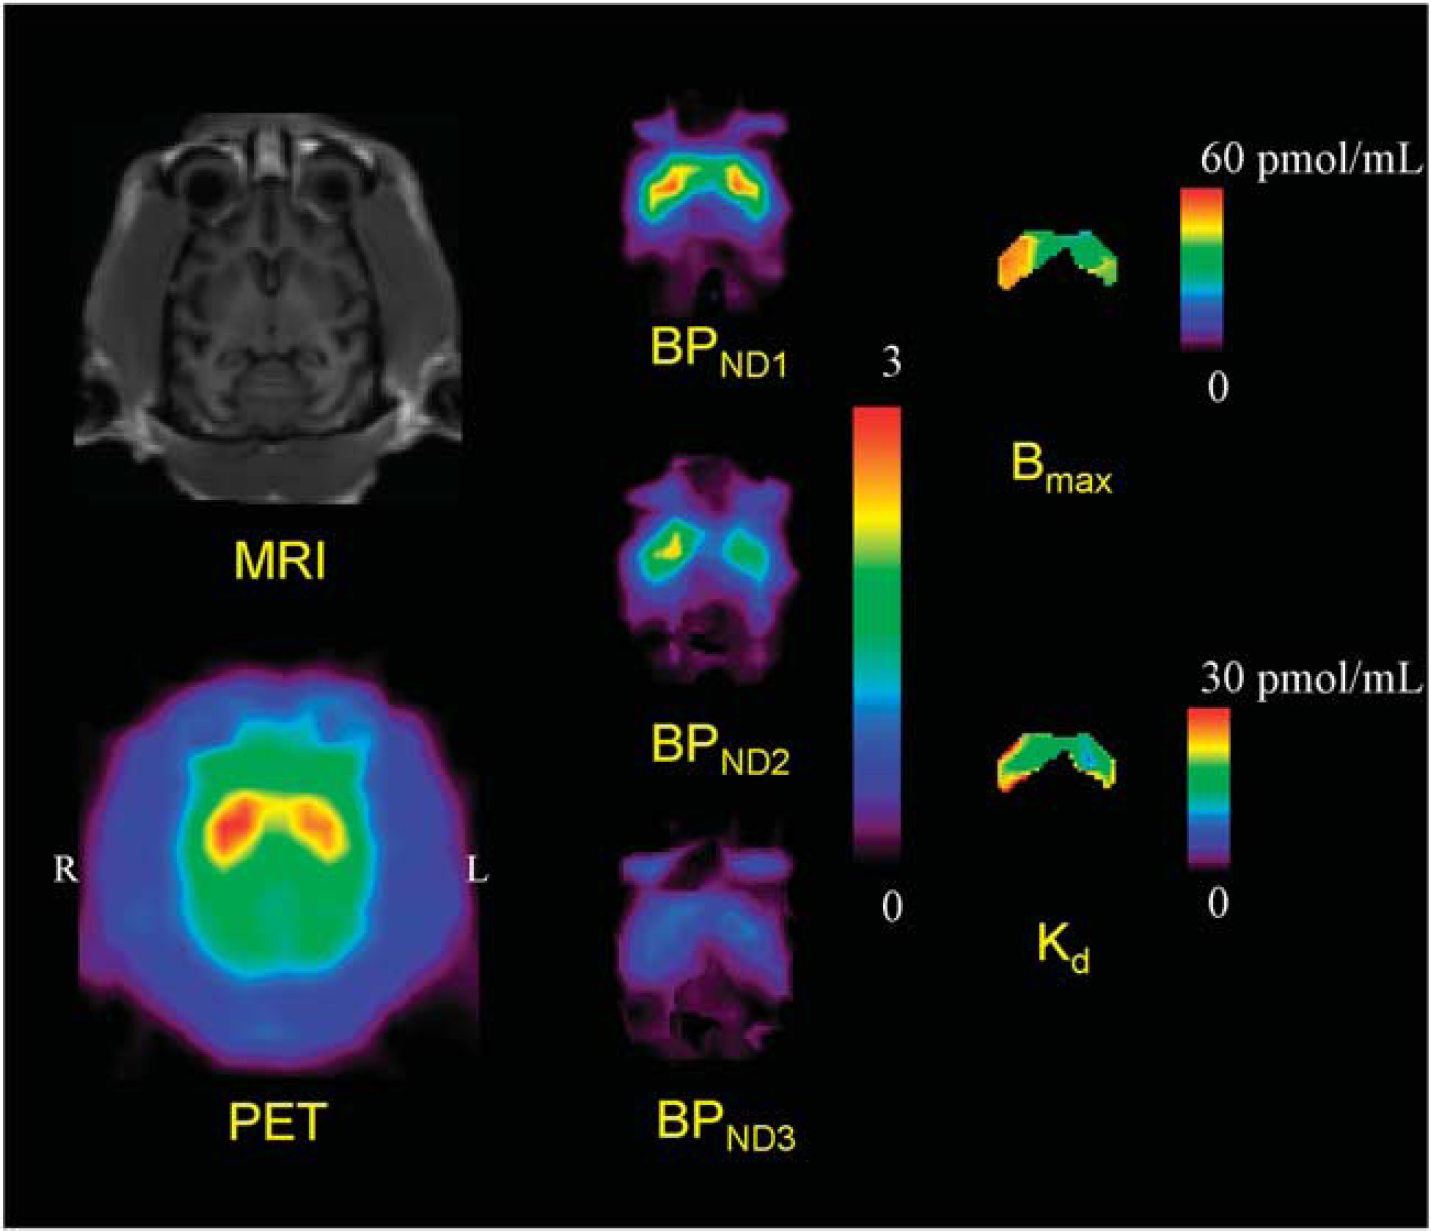
MRI and PET summation image (left) and parametric images of BPND for the first, second, and third injection (center) and parametric images of Bmax and Kd for the voxels in which BPND1 is higher than 1.5 (right) in the unilateral Parkinsonian (monUP) monkey study by a single scan with three sequential injections of [11C]raclopride. Although ROI analysis disclosed higher Bmax values in the MPTP-infused side of the striatum, the parametric image showed more evident increase of Bmax in the dorsal and posterior parts of the striatum.
The plots of MI-GA are shown in Figure 6. Plots of MI-GA for each of three animals were on the line, and Bmax and Kd could be estimated as summarized in Table 1. Using the single scan approach for the hemiparkinsonian animal, Bmax was 42.3 pmol/mL and Kd was 15.2 pmol/mL in the affected (right) striatum, and Bmax was 32.3 pmol/mL and Kd was 13.0 pmol/mL in the contralateral (left) normal striatum. Corresponding estimates for the three scan approach were Bmax = 36.4 and Kd = 13.3 pmol/mL in the right striatum and Bmax = 29.2 and Kd =11.6 pmol/mL in the left striatum. Both Bmax and Kd of the single PET scan approach were slightly higher than those of the three PET scan approach. However, importantly, both approaches found that Bmax in the affected striatum was higher than that in the normal striatum. The bilateral Parkinsonian animal showed Bmax values of left = 39.6 pmol/mL, right = 38.7 pmol/mL, both of which were higher than those of the striatum of the normal animal or the normal striatum of the unilateral animal, but were very close to the affected striatum of the unilateral animal. The Kd values of the bilateral animal were not so different from other striatums.
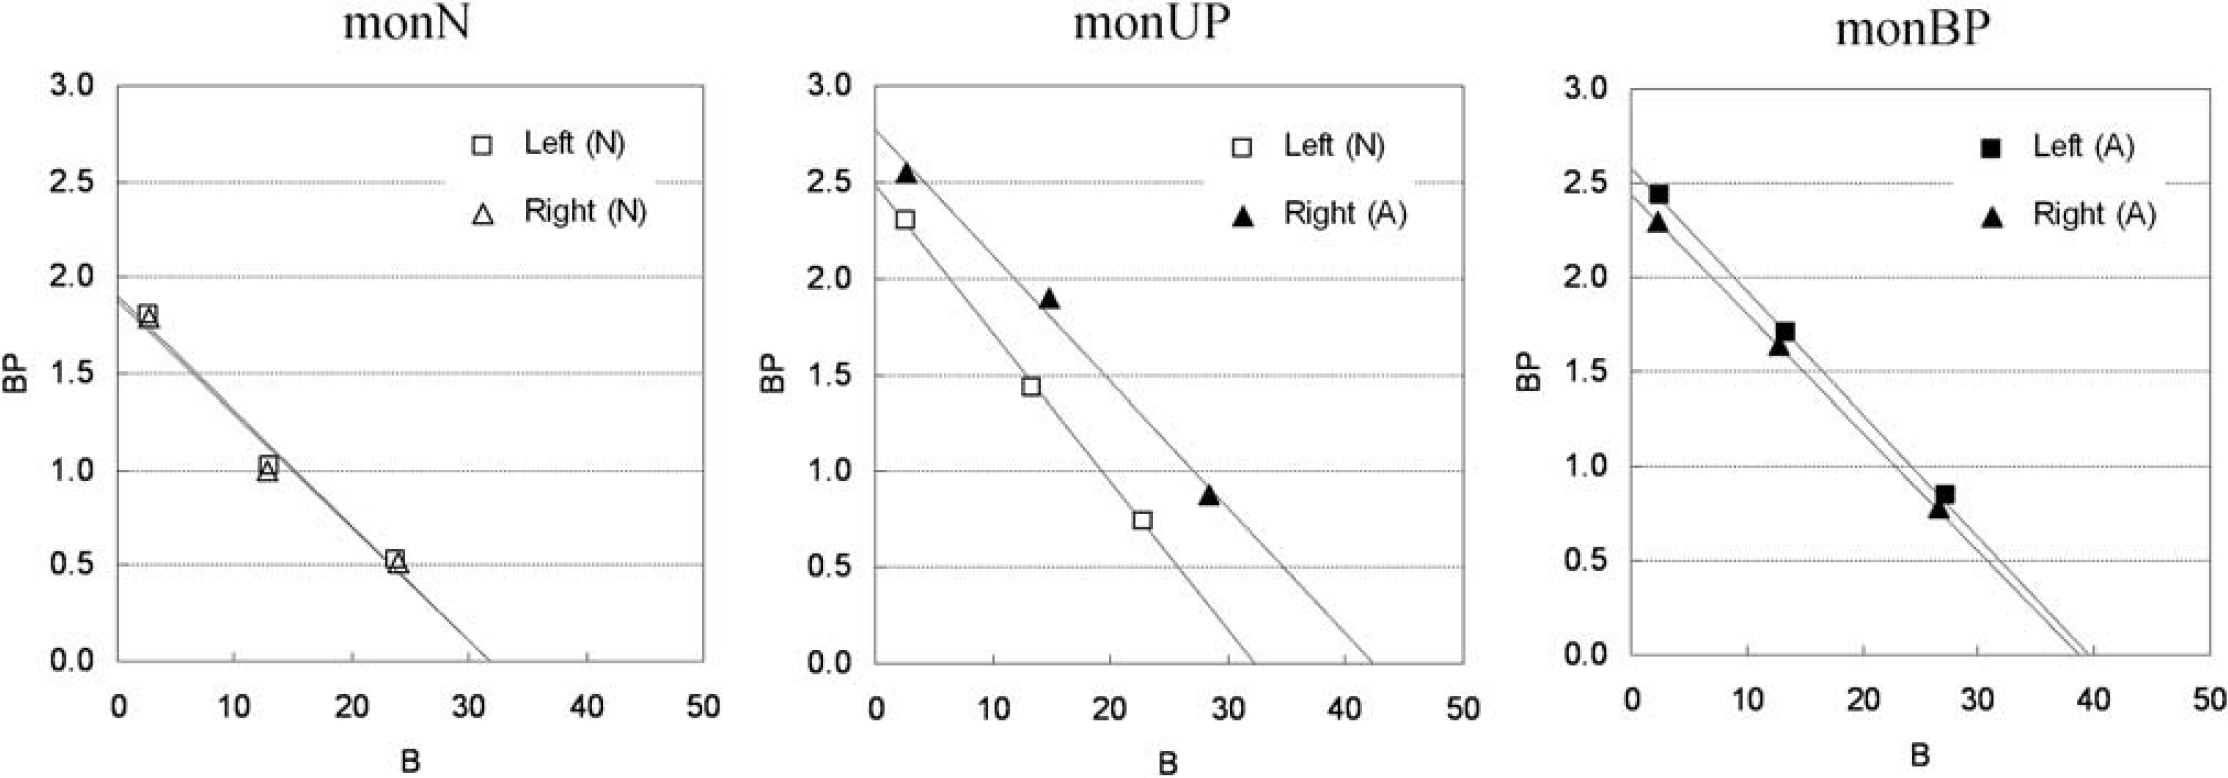
Single-scan, multiple-injection graphical analysis for normal (N) or affected (A) region of the left or right striatum in three monkeys that were normal (monN), unilateral Parkinsonian (monUP), and bilateral Parkinsonian (monBP).
Estimated Bmax and Kd values in three monkey studies
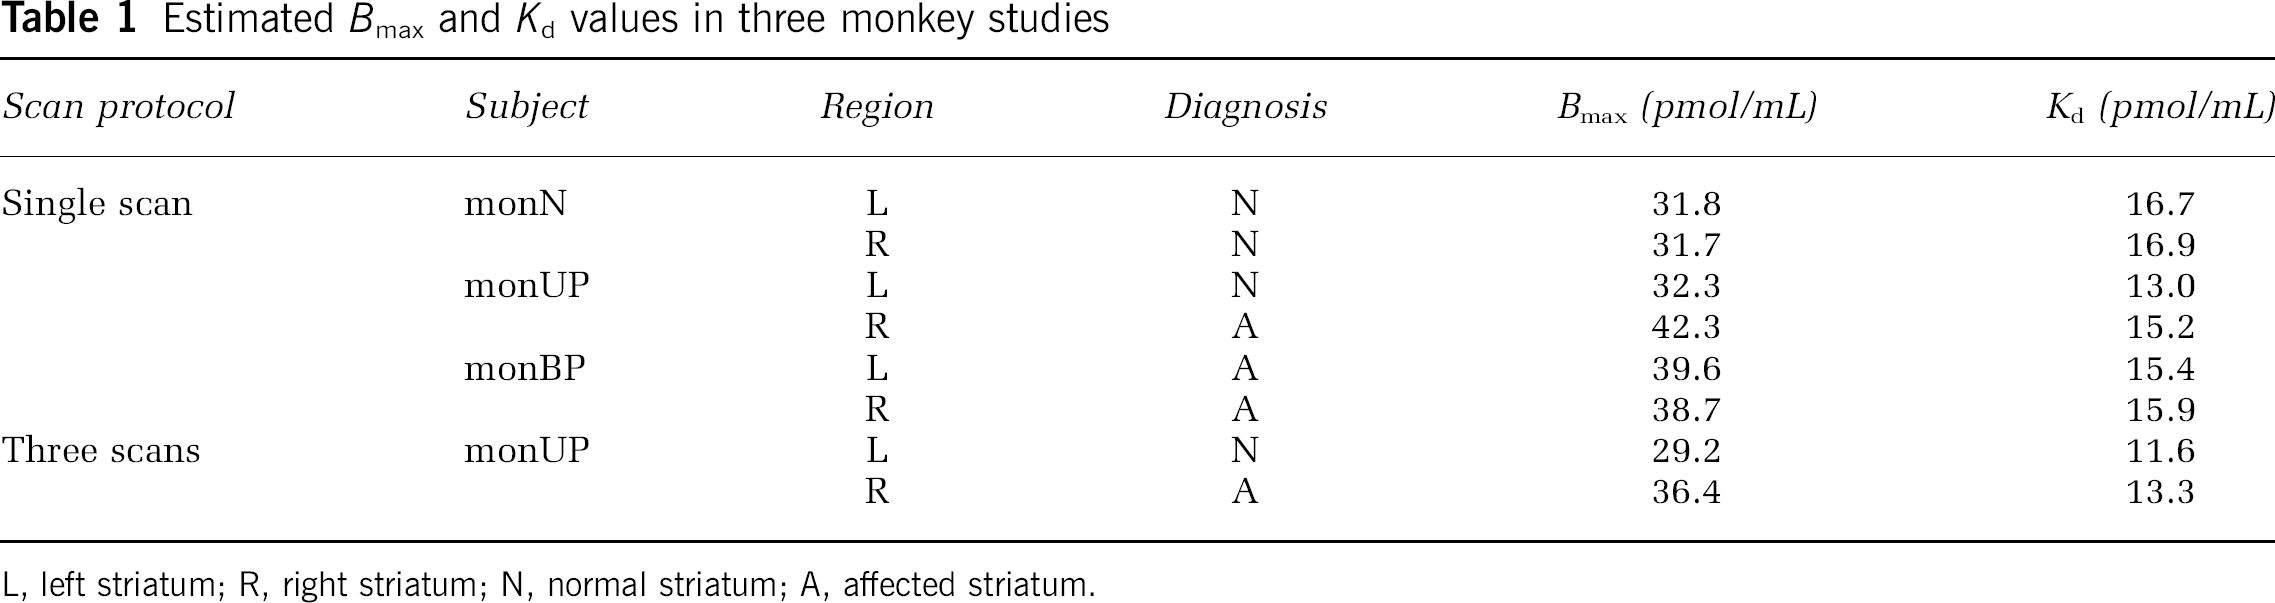
L, left striatum; R, right striatum; N, normal striatum; A, affected striatum.
Discussion
Density and Affinity Determination by Graphical Analysis with the Reference Region
In the graphical analysis for PET receptor studies, the values of Bmax and Kd were estimated from the relationship between the ratio of bound to free concentrations and bound concentration at the time of transient equilibrium, using the TAC of the reference region (Farde et al, 1986). Some groups have used the value estimated from the distribution volume ratio — 1, instead of the Bref/Fref value of the y axis, because the values of Bref/Fref could change considerably with small changes in the time point of the transient equilibrium Teq determined as the maximum Cbref (Logan et al, 1997; Doudet and Holden, 2003; Doudet et al, 2003). Distribution volume ratio or BPND is estimated from the kinetic analysis with TACs of target and reference regions, so it is not affected by the error of estimated Teq. On the other hand, the value of k′3(t) in Equation (2) varies according to the concentration of bound raclopride, and estimates of BPND are considered to be an averaged value of specific binding over time, which is influenced by the dynamics of the free and bound raclopride. Despite this, in our simulation study of [11C]raclopride, there was little difference between Bref/Fref and BPND estimated by the SRTM, and both had a linear correlation with Bref (Figure 2). However, Bref/Fref became smaller than BPND and deviated from the linear relationship between Bref/Fref and Bref in the region with low Bref (Figure 2), especially for the TACs with high Bmax. This may be a result of imperfect attainment of the transient equilibrium within the 50 mins scan duration for the TAC with high binding. There was little effect of the error of Bref for the graphical analysis, in which Bref varied widely among three injections, whereas the error of Bref/Fref because of nonachievement of transient equilibrium had much effect on the graphical analysis as compared with BPND. Therefore, we estimated Bmax and Kd by the graphical analysis with the relationship between BPND and Bref.
In the simulations with various injected masses of [11C]raclopride, it was shown that the relationship between BPND and Bref became linear to some extent. However, BPND deviated from the linear relationship and approached a nonzero value when Bref became larger (Figure 2). Therefore, in the Bmax and Kd estimation by the graphical analysis with the reference TAC, points must be plotted within the range of the linear relation. As the relationship between BPND and B estimated from Cb using the plasma input function, without the reference TAC, remained linear even when B became large and the estimated BPND approached 0 (data not shown), this apparent saturation seemed to be owing to the reference region. Strictly speaking, the time course of free radioligand Cf is different from that of the reference region Cr (Figure 1) and Cf changes according to the specific binding that was affected by kon, Bmax, or administered mass of raclopride as pointed out by Ito et al (1998). Therefore, the time of the transient equilibrium estimated using Cbref was different from that estimated using Cb, and Bref was often different as well. In addition, the value of BPND estimated by SRTM was lower than the BPND estimated from the two-tissue compartment model with the plasma input function.
This difference between the target and reference TAC affected the Bmax and Kd estimates as well. In the simulated TACs with various Bmax or Kd values, the Bmax and Kd were overestimated compared with the true values even in the conventional three PET scan approach (Figure 3). On the other hand, the overestimation was not observed when Bmax and Kd were estimated by the graphical analysis using Cf and Cb without the reference TAC (Figure 3), demonstrating that graphical analysis could determine Bmax and Kd precisely if Cb were obtained correctly. However, the free and bound concentrations in the target region cannot be distinguished from the total concentration measured by PET scanning without arterial blood sampling, and in practical PET data, estimation of rate constants with the plasma input function is unstable and impractical. Therefore, in the usual graphical analysis, the TAC of reference region is used as the free radioligand concentration in the target region (Farde et al, 1989). The effect of the reference TAC on Bmax and Kd estimates depends on the kinetics of the tracer in each region, which depends in turn on the particular tracers and species. In the simulated TACs of monkeys with [11C]raclopride, there was a good correlation between true and estimated Kd or Bmax, though estimates were biased. Therefore, we concluded the graphical analysis with reference TAC is practical for [11C]raclopride studies, because it can detect the value of Bmax or Kd in neurological or psychiatric disorders without arterial blood sampling.
Estimated Density and Affinity by the Multiple-Injection Approach
We applied the multiple-injection approach to the graphical analysis for Bmax and Kd determination in an effort to shorten the total duration of the scanning protocol, and to obviate the need for several radiosyntheses for each animal. From the relationship between the BPND estimates and injected mass in the simulation study (Figure 2), the molar amounts of three injections were set as 1.5, 10, and 30 nmol/kg, so that the estimated BPND would be high, intermediate, and low within the range in which the linear correlation held. The injection interval was set to 50 mins, because it has been reported in monkey studies that 50 mins scan duration could provide reliable BPND estimates even for TACs with high and low BPND values (Ikoma et al, 2009). In our present studies on monkeys with this protocol, injected masses increased with each successive injection, but amounts of administered radioactivity remained fairly constant, i.e., 57, 60, and 31 MBq. Therefore, the signal to noise ratio of image quality did not change seriously for each injection.
In the usual graphical analysis by nonsequential multiple PET scans, the molar amount of administered [11C]raclopride for each scan is adjusted by varying the specific activity of administered [11C] raclopride. Several investigators have attempted to perform multiple injections of ligands with PET studies to obtain receptor density and affinity by changing specific activity with a detailed model equation (Delforge et al, 1995; Millet et al, 1995; Morris et al, 1996; Muzic et al, 1996; Christian et al, 2004; Gallezot et al, 2008). Meanwhile, our approach requires only one synthesis of [11C]raclopride, which is split to three with different mass of raclopride with same specific activity. By keeping the specific activity throughout scan, we can directly interpret PET counts in pmol/mL unit.
In the simulations of Bmax and Kd estimation with this single PET scan approach, Bmax and Kd were overestimated compared with the true values, just as seen in the three PET scan approach. Furthermore, estimates of both parameters were higher than those in the three PET scan approach. In the single PET scan approach, the error because of assumptions of the reference tissue approach could be more severe than for the three PET scan approach, because the residual radioactivities at the times of the second and third injections could propagate to error of Bref or BPND estimates. This was shown to be the case in the simulation study, in which the relationship between the BPND and Bref in the third injection was a little different from that in the first injection (Figure 2). Furthermore, our approach assumes that BPND is promptly altered by the next injection, but this is in fact not exactly the case. We showed the bias of the estimated BPND related to this assumption (Ikoma et al, 2009), and the estimated Bmax and Kd in this paper consequently could be biased. However, in the simulations, Bmax and Kd estimated by the MI-GA changed according to the variation of the true values (Figure 3), demonstrating this approach could be applied to the quantitative evaluation of Bmax and Kd from a single session of PET scanning.
Monkey Studies
In the simulations, we demonstrated that the MI-GA could detect density and affinity of dopamine D2 receptors. Furthermore, we demonstrated the validity of the proposed method using actual data from monkeys. As a result, the three BPND data points calculated from the single PET scan with three sequential injections of different administration masses were almost on a straight line, and estimated values of Bmax and Kd were very close to those previously obtained in vitro (Bmax =25.7 pmol/g) (Madras et al, 1988) or in vivo by the conventional method in monkeys (Bmax = 22 pmol/mL, Kd = 13.5 nmol/L) (Doudet et al, 2003). The estimates by the single PET scan approach were slightly higher than those by the three PET scan approach, and this was consistent with the results from the current simulations.
Although we investigated only three monkeys in this study, the values of Bmax in the partially denervated striata was higher than in normal striatum, whereas the apparent affinity was unaffected by the MPTP lesions. Likewise Rinne et al (1995) reported a 35% increase in the D2 Bmax in the putamen contralateral to the side of predominant motor symptoms, without any discernible effect on apparent affinity. In our monkey measurements, in the hemilesioned monkey, the Bmax was elevated by 31% on the denervated side. In the animal with bilateral MPTP lesion, the Bmax in both striata was higher than in the normal animal, or in the unlesioned side of the hemiparkinsonian animal, despite no significant changes in Kd values: the results were consistent with those of the previous report.
In addition to the results of ROI analysis, which disclosed bulk D2 receptor characteristics in the whole striatum, parametric imaging of Bmax and Kd (as shown in Figure 5) suggested a potential significance in regional estimation of D2 receptor characteristics. Although ROI analysis disclosed higher Bmax values in the MPTP-infused side of the striatum, the parametric imaging showed the increase of Bmax was more evident in the dorsal and posterior parts of the striatum. A similar finding of preferential lesion in dorsal and posterior parts of the striatum has been reported based on neurochemical and pathological assessments of MPTP-lesioned monkeys (Oiwa et al, 2003). As the current parametric imaging may have significant artifacts, such as those arising from low signal-to-noise ratio, partial volume effects, small number of points, the situation should be improved through the use of a higher resolution PET scanner.
Potential Limitations of the Multiple-Injection Graphical Analysis
The multiple-injection approach is able to assess the Bmax and Kd for receptor studies in a single PET scan with single radiosynthesis, and shortened study period as compared with a conventional approach. This approach might also be applicable to other PET ligands and receptor types, but with several caveats: First, it is necessary to evaluate whether the reference region can be used as the free TAC of the target region. The kinetics of the target and reference regions is affected by the value of each rate constant, i.e., K1, k2, Bmax, and Kd, that differ between species and radioligands. The difference between Cref and Cf often causes an error in Bref, and the estimated Bmax and Kd should be interpreted with caution when the reference region has considerably different kinetics. Second, the molar amounts of administered ligand need to be selected such that the resultant BPND will be within the range in which the linear relationship between BPND and B holds. In the case of regions with low BPND, and small extent of the necessary linear relationship, it may be difficult to determine Bmax and Kd reliably. Third, the interval of three injections should be determined so that the free ligand TAC has a transient equilibrium within the scan duration of each injection, especially when the injected mass is small, i.e., BPND is high. The radioligand [11C]raclopride dissociates rapidly from the receptors, allowing equilibration of binding to be established in vivo within the time span of PET experiments (Farde et al, 1989; Ito et al, 1998). However, those ligands with slow kinetics, such as [18F]fallypride require a longer scan duration such that the present graphical analysis may not be suitable in all instances. Despite these limitations, by optimizing the administered mass and the time interval between three injections of [11C]raclopride, we have shown that the multiple-injection approach can determine Bmax and Kd values as effectively as an approach using three separate scans, but within a single scan time of 150 mins.
Moreover, the bias of Bmax and Kd estimated by the single scan approach with two injections was not larger than that by the single scan approach with three injections in the simulations (data not shown), and points of the second and third injections in MI-GA were almost on the same line in the monkey studies (Figure 6). Therefore, there is a possibility of reducing scan time and exposure further using only two injections, though the effect of statistical noise on estimates should be considered.
Conclusion
We developed the method for estimating Bmax and Kd values in a single session of PET scanning with multiple injections of [11C]raclopride. Our simulations showed that the MI-GA could detect Bmax and Kd values by using the optimal injection protocol. We also demonstrated in monkey studies that Bmax and Kd values estimated by our proposed approach were proper compared with previous monkey studies or our studies by the conventional method. The proposed method made it possible to determine the dopamine D2 receptor density and affinity by a 150 mins PET scan with three injections of [11C]raclopride at 50 mins intervals.
Footnotes
Acknowledgements
We thank Dr Jun Takahashi (Kyoto University) for providing us animals for this study. This research was supported by the Ministry of Education, Culture, Sports, Science and Technology of Japan (MEXT) grant-in-aid for Young Scientists (B) (No. 20790839), grant-in-aid for Scientific Research (C) (No. 09019855) (TH), Kobe Cluster I and II, and the Ministry of Health, Labour, and Welfare of Japan (MHLW) Health Science Research Grant, H17-025 (TH, HI). We are grateful to members of Department of Investigative Radiology, National Cardiovascular Center Research Institute, for their support of PET experiment and for helpful suggestions.
The authors declare no conflict of interest.
Appendix
The multiple-injection two-tissue four-parameter compartment model is based on the following differential equations:
where Cp is the radioactivity concentration of metabolite-corrected plasma, Cf and Cb are the concentrations of radioactivity for free and specifically bound ligand in tissue, respectively.
Equations (A1) and (A2) are solved with the radioactivity concentration of Cf and Cb at the time of injection, that is Cf(0) and Cb(0), then Cf(t), Cb(t) and total radioactivity concentration in tissue Ct(t) are expressed as following equations: