14. Analysis of the dopamine D3/D2 system with [11C]PHNO: subcortical parcellation of anatomy and signal
A. Tziortzi1, G. Searle1, S. Tzimopoulou1, J. Beaver1, E. Rabiner1 and R. Gunn1,2
1Clinical Imaging Centre, GlaxoSmithKline, Imperial College, London; 2Department of Engineering Science, University of Oxford, Oxford, UK
Objectives: [11C]PHNO is a D3/D2 agonist radioligand with preferential affinity for D3 receptors. As the [11C]PHNO pinding potential (BPND) is a mixture of D3 and D2 signal, assessment of the D3 component of [11C]PHNO binding relies on regional differences in D3 and D2 receptor numbers.1 A robust delineation of regions of interest (ROI) with a relatively homogenous proportion of D3:D2 receptors is therefore important for accurate quantification of the components of [11C]PHNO binding. We report the development of robust criteria to define ROI for the analysis of human [11C]PHNO scans. Both manual and automated definitions of these ROI are evaluated and the reproducibility and accuracy of these methods are assessed.
Methods: The striatum (ST) was subdivided into 6 subregions incorporating information from connectivity/autoradiography studies and the distribution of [11C]PHNO. Putamen (PU) was subdivided into precommissural dorsal/ventral (preDPU, preVPU) and postcommisural (posPU). Caudate (CD) was divided into precommissural/postcommisural (preCD, posCD), while accumbens and the medial-ventral parts of PU and CD were designated as ventral-striatum (VST). ST and globus-pallidus (GP) ROI were delineated on T1-MR images. Substantia-nigra (SN) was defined on PET integral images using a fixed-size ROI. [11C]PHNO PET and T1-MR images from 12 subjects were analysed. Each subject's PET data was motion corrected and coregistered to their T1-MR image. ROI were defined using three different approaches: I. Manual definition of regions on two occasions (>one month apart), II. Manual definition of regions according to a previously published method developed for raclopride2 to provide a benchmark for reproducibility, III. Automated definition using a nonlinear deformation of regions defined on the MNI_T1 template according to the criteria in Method I (except SN). Time activity curves (TAC) were derived and SRTM was applied with cerebellum as reference region to determine regional BPND estimates. ROI volume overlap (DICE) and BPND variability (VARBP), were assessed for; (i) intra-operator reproducibility for Methods I and II, (ii) inter-method agreement for Methods I and III.
Results: The average inter-subject BPND values, obtained with Method I, in order of magnitude are, GP = 3.0±0.4, VST = 2.9±0.3, preVPU = 2.7±0.2, preDPU = 2.3±0.2, posPU = 2.2±0.1 preCD = 1.9±0.2 SN = 1.6±0.3 and posCD = 1.3±0.2.
Intra-operator agreement was high for volume overlap and BPND for both Methods I and II (DICE; Method I: preCD = 91±1%, posCD = 85±2%, preDPU = 92±2%, preVPU = 92±1%, posPU = 91±2%, VST = 89±2%, GP = 85±3% and SN = 80±13%, Method II: preCD = 89±5%, posCD = 82±5% prePU = 89±2%, posPU = 86±4% and VST = 78±3%.
The agreement between Methods I and III was generally good. (DICE: preCD = 75±4%, posCD = 56±16%, preDPU = 65±11%, preVPU = 74±9%, posPU = 58±13%, GP = 76±6%, VST = 67±10%, VARBP; preCD = 6.4±4%, posCD = 7.3±6.2%, preDPU = 4.4±2.8%, preVPU = 5.9±4.5%, posPU = 3.3±3.4%, VST = 5.8±6%, GP = 4.9±4.5%). Note that the lower DICE coefficients for the posCD and posPU are not reflected in those for the gross regions (DICE: CD = 76±4%, PU = 77±8%).
Conclusions: The criteria developed for the analysis of [11C]PHNO scans provide robust and reproducible results for the manual delineation of ROI. The automated ROI, approach the performance of the manual at the level of CD, PU and VST.
160. Off-line motion correction methods for multi-frame PET data
J.E.M. Mourik, M. Lubberink, F.H.P. van Velden, A.A. Lammertsma and R. Boellaard
Nuclear Medicine and PET Research, VU University Medical Center, Amsterdam, The Netherlands
Background and aims: Patient motion during PET acquisition may reduce spatial resolution and alter time-activity curves, especially for small region of interests, thereby affecting outcome of tracer kinetic analyses. Currently, on-line optical motion tracking systems are available.1,2 Although these systems show some important advantages, e.g. in-frame motion correction, there are also some drawbacks. First, old datasets, scanned without an on-line motion tracking system, cannot be corrected. Second, most on-line motion tracking systems require that PET data to be acquired in list-mode, which is not possible on older scanners. Third, application of these systems is not always possible due to limited view within the gantry in case of auxiliary equipment. Off-line (mathematical) motion correction methods do not have these disadvantages. Aim of the present study was to evaluate several off-line frame-by-frame motion correction methods for correcting patient motion.
Methods: Four different motion correction methods were evaluated. They differed in the way realignment parameters were derived, based on:
sum of first × frames of normal PET scan,
sum of first × frames of non-attenuation corrected PET scan,
attenuation map and
attenuation map divided by measured attenuation correction factors.
In method 2 to 4 realignment was included in a final image reconstruction process to correct for attenuation and emission mismatch as well. Two simulation studies were performed, based on [11C]flumazenil and [11C]PK11195 datasets, respectively. In both simulation studies kind (rotation, translation) and amount of motion were varied. Simulated PET scans were corrected for motion using all four correction methods. Next, optimal settings derived from the simulation studies were used to evaluate two clinical datasets each of [11C]flumazenil, [11C]PK11195 and [11C]PIB. For the clinical datasets, volume of distribution (VT) values, obtained with Logan analysis,3 were compared before and after motion correction.
Results: Optimal results were obtained when realignment parameters were based on method 2, where differences in regional VT values were <2.8% and <3.5% for [11C]flumazenil and [11C]PK11195 simulation studies, respectively. In comparison, differences up to 22%, 62% and 46% were observed in regional VT values for method 1, 3 and 4, respectively. For the clinical datasets, visual inspection revealed that motion was no longer visible after correction using these optimal settings. Differences in VT of up to 433% before and after motion correction were found for the clinical data. Moreover, when no motion was present in the original (clinical) dataset, differences in VT before and after motion correction were <1.5±1.3%, indicating that method 2 can always be used without degrading quantitative accuracy.
Conclusions: When no optical tracking system is available or when old datasets have to be reanalyzed, the presented frame-by-frame motion correction method, using the sum of first × frames of non-attenuation corrected PET scans, provides a means to analyse data in which the patient has moved.
Acknowledgments: Financial support provided by the Netherlands Organisation for Scientific Research (NWO, VIDI Grant 016.066.309).
209. In vivo simultaneous functional and morphological brain imaging using integrated PET/MRI (iPET/MRI) system in small animals
M. Imaizumi1, S. Yamamoto2, Y. Kanai1, M. Tatsumi1, H. Kato1, I. Higuchi1, M. Kawakami3, M. Aoki3, E. Shimosegawa1 and J. Hatazawa1
1Department of Nuclear Medicine and Tracer Kinetics, Osaka University Graduate School of Medicine, Suita; 2Kobe City College of Technology, Kobe; 3Hitachi Metals. Ltd., NEOMAX Company, Saga, Japan
Background and aims: Simultaneous measurements of positron emission tomography (PET) and magnetic resonance imaging (MRI) is a promising strategy for direct comparison of functional and morphological information. Therefore, development of PET/MRI is currently on-going for experimental researches and clinical applications. An integrated PET/MRI (iPET/MRI) system has been constructed that combines an optical fiber based MR-compatible PET with a low magnetic field permanent magnet MRI for small animals. Our aim is to investigate the feasibility of in vivo simultaneous imaging using the iPET/MRI system.
Methods: The iPET/MRI system consists of depth-of interaction block detectors made of LGSO, optical fibers (∼80 cm), and position sensitive photomultiplier tubes for PET, and radio-frequency coil (φ 76 mm) and 0.3T Nd-Fe-B permanent magnet (Hitachi Metal, NEOMAX Co., Ltd) for MRI. To test this system, small animals (Wistar rat, Male, N = 6∼) were anesthetized by MR-compatible inhalation device with 1.5% isoflurane and injected approximately 37 MBq of 18F-FDG with MR contrast medium intravenously. Simultaneous PET (list mode) and MR (fast low angle shot <FLASH> T1-weighted sequence, TR/TE = 50/5 ms) imaging were performed 30 to 90 mins after 18F-FDG injection. During MRI acquisition, PET data were acquired in 3 axial positions by shifting the PET detector ring to cover ∼5 cm axial field of view.
Results:18F-FDG images showed high uptake in the brain, harderian glands, heart and kidneys, consistent with known distribution. In the cranium and cervical portions, MR images with contrast medium provided superior anatomic information such as cerebral basal ganglia, cerebellum, brainstem, spinal cord, oral cavity structures and cervical brown adipose tissue with excellent soft-tissue contrast. MR angiography depicted internal jugular vein, transverse sinus, superior sagital sinus, and superior and inferior vena cava. Simultaneous PET/MR images were obtained successfully without noticeable distortion in either PET or MR image sets. The excellent quality of these integrated images enables us to clearly identify small structures in the cranium of rats.
Conclusions: We confirmed that our iPET/MRI system can be used for in vivo simultaneous brain imaging of small animals.
Research support: Program for Promotion of Fundamental Studies in Health Sciences of the National Institute of Biomedical Innovations (No. 06-35).
259. Robust PET-MR image registration methods for non-human primates using mutual information measures
C. Sandiego, D. Weinzimmer and R.E. Carson
Yale University PET Center, New Haven, Connecticut, USA
Objectives: Analysis of PET brain data from non-human primates (NHP) usually involves registration of PET and MR data. Typically, an early summed PET image (e.g., 0 to 10 mins) provides high contrast between gray and white matter, important for a successful registration. However, kinetics and distribution vary dramatically between tracers, especially in studies involving pharmacological agents. This poses difficulties for PET-MR registrations, where algorithms sometimes fail due to relatively high activity outside the brain within the scanner field-of-view. The aim of this study is to develop a robust, automated method for PET-MR NHP registration for application to a wide variety of PET studies. The approach is to register different time periods of PET data to the MR and select the best transformation.
Methods: Forty-six PET datasets using five tracers were evaluated from rhesus monkey brains, acquired on the high resolution research tomograph (HRRT). T1-weighted MR images (M) were acquired on a 3T scanner, using an extremity coil. The PET-MR intrasubject registration was a two step process. First, the automated image registration (AIR) algorithm was used as an initialization step; this was followed by FLIRT (FSL) using normalized mutual information (NMI) to obtain the transformation. From each dynamic dataset, n = 6 summed PET images, Pi, were created using different time intervals: 0 to 10, 0 to 30, 10 to 30, 30 to 60, 60 to 90, and 90 to 120 mins. Using the registration algorithms between M and Pi, n transformations (Ti) were determined using each of the images Pi. The n transformations, Tk, k = 1,…,n, were then applied to each PET summed image, Pi, i = 1,…,n, to yield n2 resliced PET images in MR space, Pik = Tk{Pi}. Each Pik was masked with a binary image created from the MR image to eliminate outside brain activity. NMI was then computed as a similarity measure between each resliced PET and the MR image due to the transformation applied, i.e., Nik = NMI(M,Pik) for j = 1,…,n. To choose the optimal transformation, T*, the total NMI score was calculated across PET images (Sk = Σi Nik) and T* was chosen as the transformation that provided the best S value. The quality of PET-MR registrations was assessed visually as either good or misregistered.
Results: Transforms from all time periods showed some misregistrations: T0−10 (11%), T0−30 (4%), T10−30 (4%), T30−60 (28%), T60−90 (37%), and T90−120 (65%). Low brain uptake (with respect to extra-brain uptake) and noisy images contributed to the poorer registrations. For the new method, the optimal transform T* varied across studies with respect to the selected time interval: T0−10 (19.6%), T0−30 and T10−30 (28.3%), T30−60 (15.2%), T60−90 (6.5%), and T90−120 (2.2%). For all studies evaluated, the chosen transform T* corresponded to an image designated as visually good.
Conclusions: A new method for automated PET-MR registration for NHP studies based on NMI measures is proposed, in order to handle the great variability in PET studies with different ligands. This initial evaluation suggests that the method is robust, i.e., no algorithm failures were detected. To further validate this approach, a more extensive quantitative evaluation must be performed with more tracers.
277. Comparison of manual and automated methods for measuring striatal D2 receptor binding in primary dystonia: a PET study with [11C]Raclopride
S. Peng1, Y. Ma1, M. Carbon1, S. Bressman2, V. Dhawan1 and D. Eidelberg1
1Center for Neurosciences, The Feinstein Institute for Medical Research, Manhasset; 2Department of Neurology, Beth Israel Medical Center, New York, New York, USA
Objectives: Primary dystonia is one of genetic brain disorders resulting from dysfunction in the neurotransmission of dopamine D2 receptor systems. Brain imaging with PET has revealed different degrees of loss in striatal D2 receptor availability in subjects with DYT1 and DYT6 genotypes. Many analytical techniques have been proposed to quantify D2 receptor binding with various levels of complexities. The objective of this work was to evaluate the use of simplified approaches to evaluate loss in D2 receptor binding in dystonia gene carriers.
Methods: [11C]raclopride (RAC) PET and MR images were acquired from 22 DYT1 gene carriers (age 52±15 yr), 12 DYT6 gene carriers (age 34±16 yr) and 11 normal controls (age 42±16 yr). MR scans were correlated with PET to define striatal volumes of interest (VOI) either manually in the native space or automatically following the spatial normalization into Talairach space. Binding indices in caudate and putamen were measured by distribution volume ratio (DVR) over 30 to 70 mins or striatal-to-occiptal ratio minus 1 (SOR) at 60 mins post injection. Differences in RAC binding among subject groups were evaluated statistically by using parameters computed from different analysis methods. Subject age was included as a covariate in the design of a multivariate general linear model.
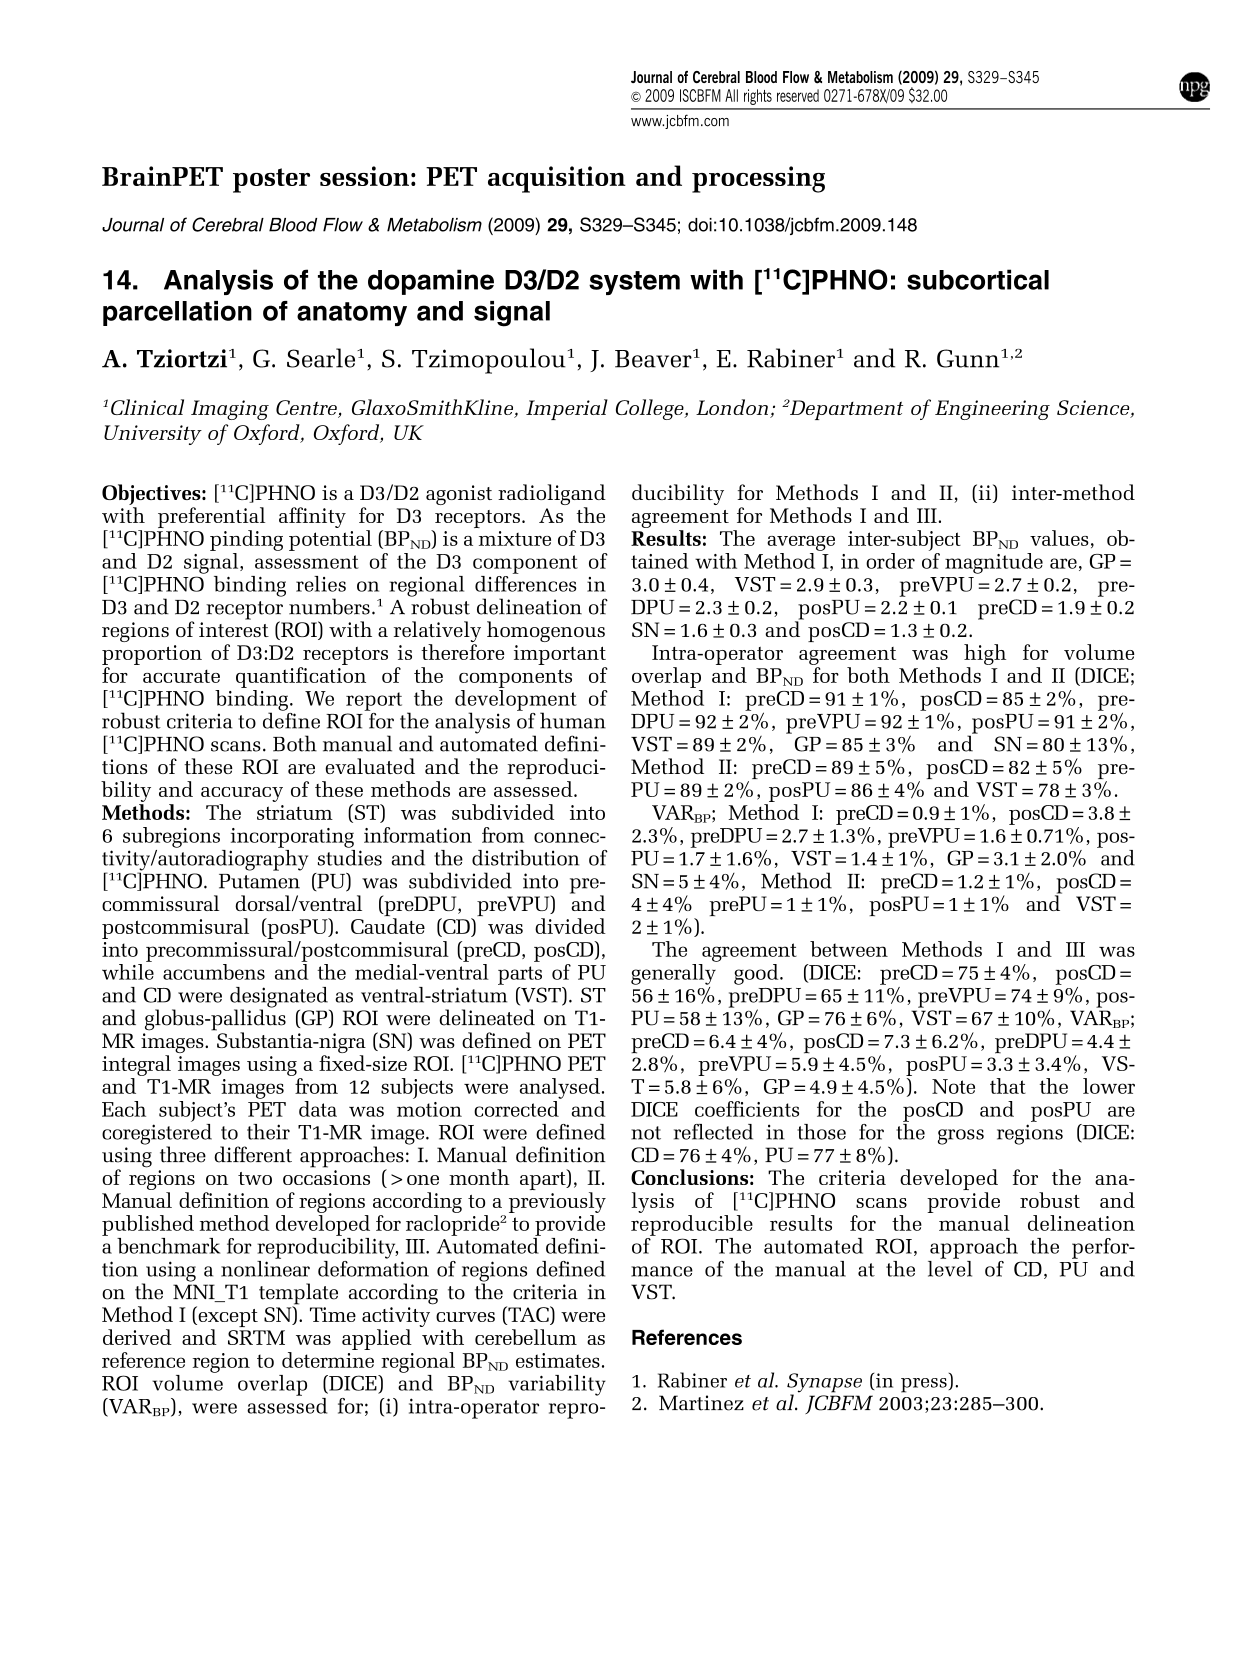
Results: All analyses showed that striatal RAC binding in the DYT1 and DYT6 groups was reduced compared to normal mean (e.g. Figure 1). The reduction in the DYT6 group was 2 to 3 times larger than that in the DYT1 group, with the mean values predicted from the statistical model. DVR values from the manual analysis in the native space revealed that RAC binding decreased in the caudate (F = 4.3; P<0.02) and the putamen (F = 4.9; P<0.013). On the other hand, SOR values from the manual analysis demonstrated almost twice as much decrease than DVR in RAC binding in the caudate (F = 19.3; P<0.0001) and the putamen (F = 18.4; P<0.0001). In addition, SOR values calculated from the automatic analysis yielded similar results as those from the manual analysis in the caudate (F = 17.8; P<0.0001) and putamen (F = 18.2; P<0.0001).
Dystonia v.s. normal control (NC).
Conclusions: Analyses with different binding parameters and VOI strategies have revealed significant losses in striatal D2 receptor binding in dystonia gene carriers. The striatal-to-occipital uptake ratio obtained from a static frame is more sensitive in discriminating subject groups than the distribute volume ratio from dynamic data acquisition. This simple parameter can be computed automatically in the standard brain space to permit rapid brain mapping analysis on a VOI or voxel basis. This method may be valuable in quantifying topographic evolution in D2 receptor availability in other neuropsychiatric disorders.
400. A noise reduction method for graphical analyses with KL-expansion during transient equilibrium condition
K. Sakaguchi1, M. Naganawa1, M. Sakata2, M. Shidahara1, C. Seki1, K. Ishiwata2 and Y. Kimura1
1National Institute of Radiological Sciences, Chiba; 2Tokyo Metropolitan Institute of Gerontology, Tokyo, Japan
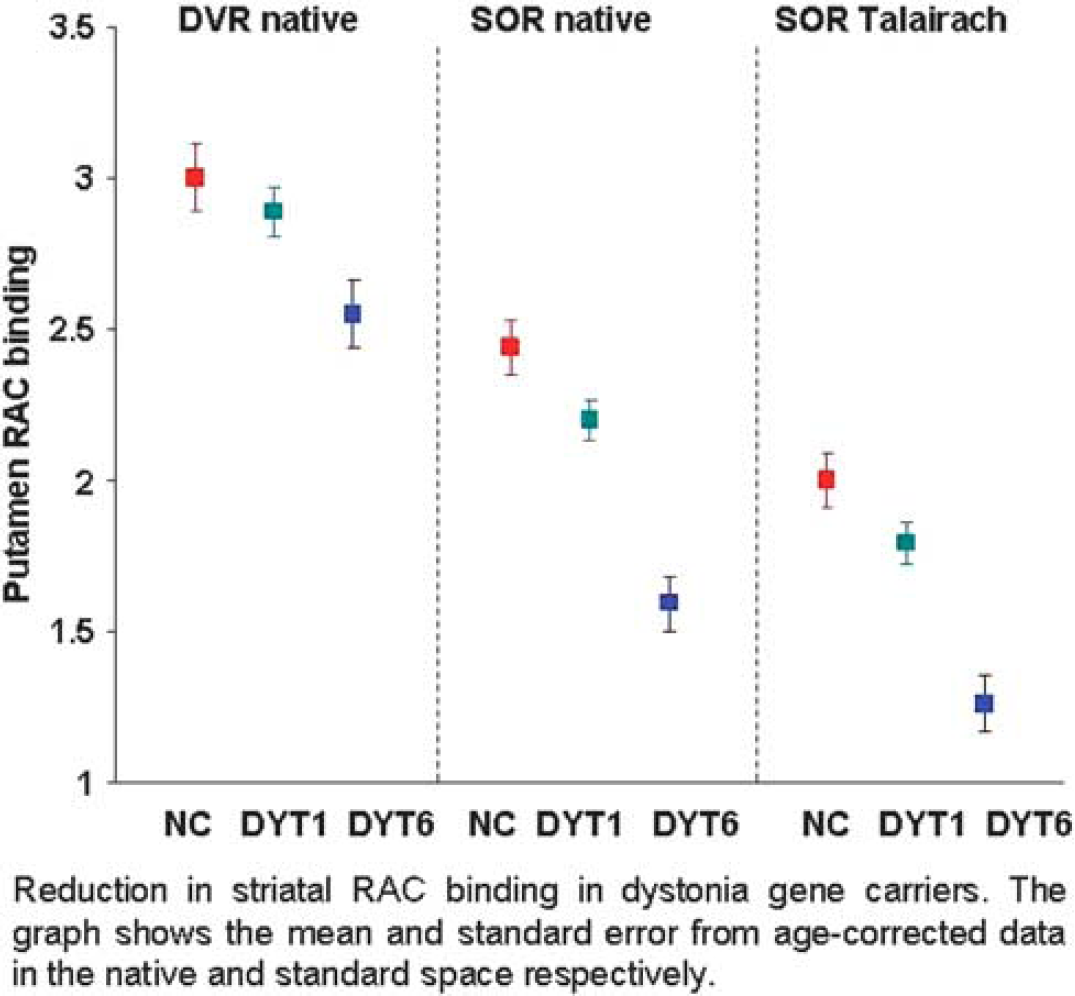
Objectives: Graphical analyses have advantages in unnecessary for the assumption of the number of compartments and fast computation. However, there is a large noise-induced bias or variability in the estimation of total volume of distribution (VT).1 Principal component analysis based method (mPCA) was proposed for a noise reduction in Logan graphical analysis (LGA),2 which might lead to a deformation of kinetics of time-activity curves (TACs). This study proposes a new noise reduction method for graphical analyses by Karhunen-Loève expansion (mKLE), which aims to maintain kinetics of voxel-based TACs.
Methods: mKLE is based on the assumption that the ratio of a TAC to the input function is approximately constant after a certain time (t*) (transient equilibrium condition). Then the TAC after t* can be represented by one basis function. The basis function is expressed as an axis which passes across the origin and minimizes the distance from TACs in feature space. mKLE was applied to a set of TACs to calculate the basis function. The noise-reduced TACs were obtained by projecting voxel-based TACs onto the basis function. mKLE was tested on human PET data of [11C]TMSX, an adenosine A2A antagonist radioligand.3 Dynamic PET scans were acquired for 1 h, and metabolite-corrected arterial input function was obtained. We tested 3 versions: without noise reduction and with mKLE or mPCA. The dynamic data were analyzed by LGA and multilinear analysis (MA1) to calculate the parametric VT images. The regional mean value of VT was calculated from the striatum drawn on the summed PET image. For all graphical methods, t* was set to be 30 mins postinjection.
Results: Figure (A) shows a typical example of TAC from a voxel: an original TAC, the noise-reduced TACs by mKLE and mPCA, and the ROI-averaged TAC. The mKLE-estimated TAC agreed well with the ROI-averaged TAC. Figure (B) shows the VT images from the same subject of Figure (A). In the ROI-averaged TAC, the estimated VT values of LGA and MA1 were the same as 1.23 mL/cm3. The lowest value of VT was given by LGA without noise-reduction (1.12±0.17 mL/cm3). Both mKLE and mPCA similarly improved VT values estimated with LGA (1.23±0.19 mL/cm3 for mKLE, 1.24±0.18 mL/cm3 for mPCA). On the other hand, only mKLE improved VT estimated with MA1 (1.24±0.18 mL/cm3), while mPCA caused overestimation and large variability (1.37±3.21 mL/cm3).
Conclusions: The experimental results suggest that the proposed method is promising for noise reduction of VT imaging by graphical analyses.
449. Testing the performance of iterative reconstruction at low statistics via listmode sub-sampling in high resolution brain PET
M.D. Walker1, P.J. Julyan1,2, P.S. Talbot1 and J.C. Matthews1
1Wolfson Molecular Imaging Centre, The University of Manchester; 2North Western Medical Physics, Christie Hospital NHS Trust, Manchester, UK
Background: It has been reported that the scatter correction on the HRRT PET scanner becomes erroneous for frames with low statistics.1 Also reported is that iterative reconstruction (OP-OSEM) leads to significant bias for such frames.2 This bias is problematic for dynamic PET scanning, and may be present on other scanners.
Objectives: This study investigates low-statistics induced bias for HRRT images. We test the hypothesis that the bias is a property of the image reconstruction, and not the result of performing scatter correction on data of low statistical quality.
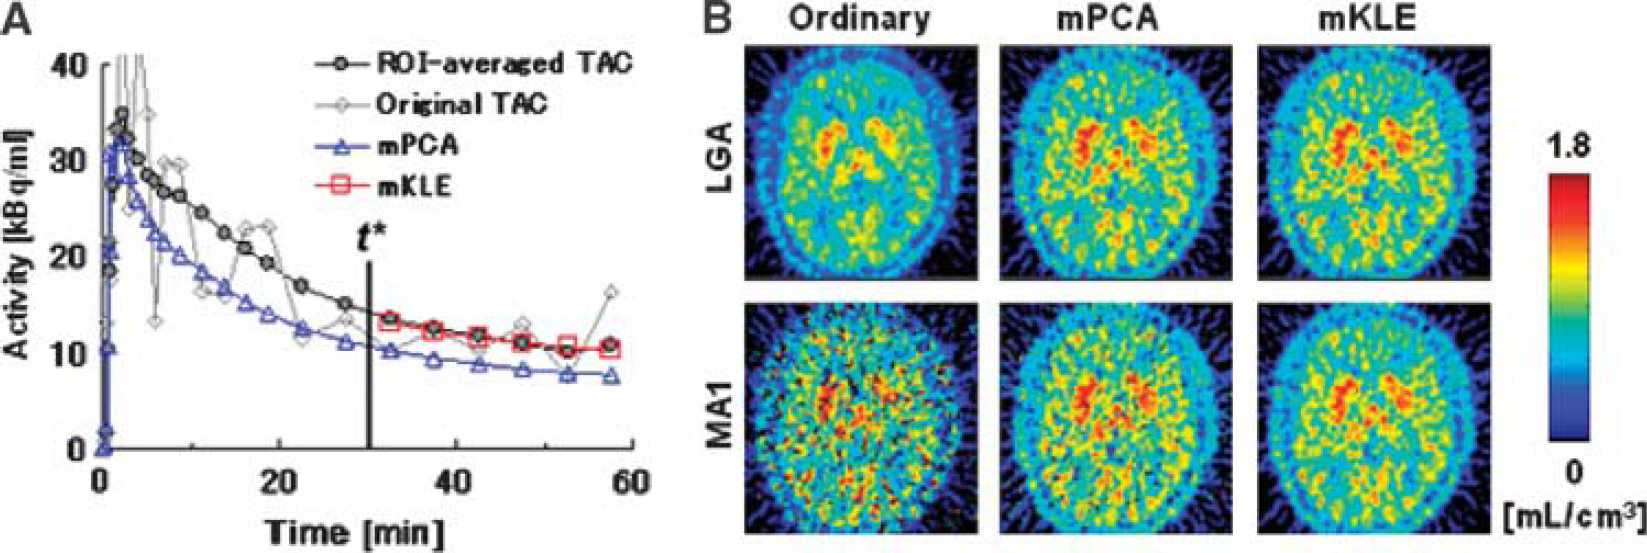
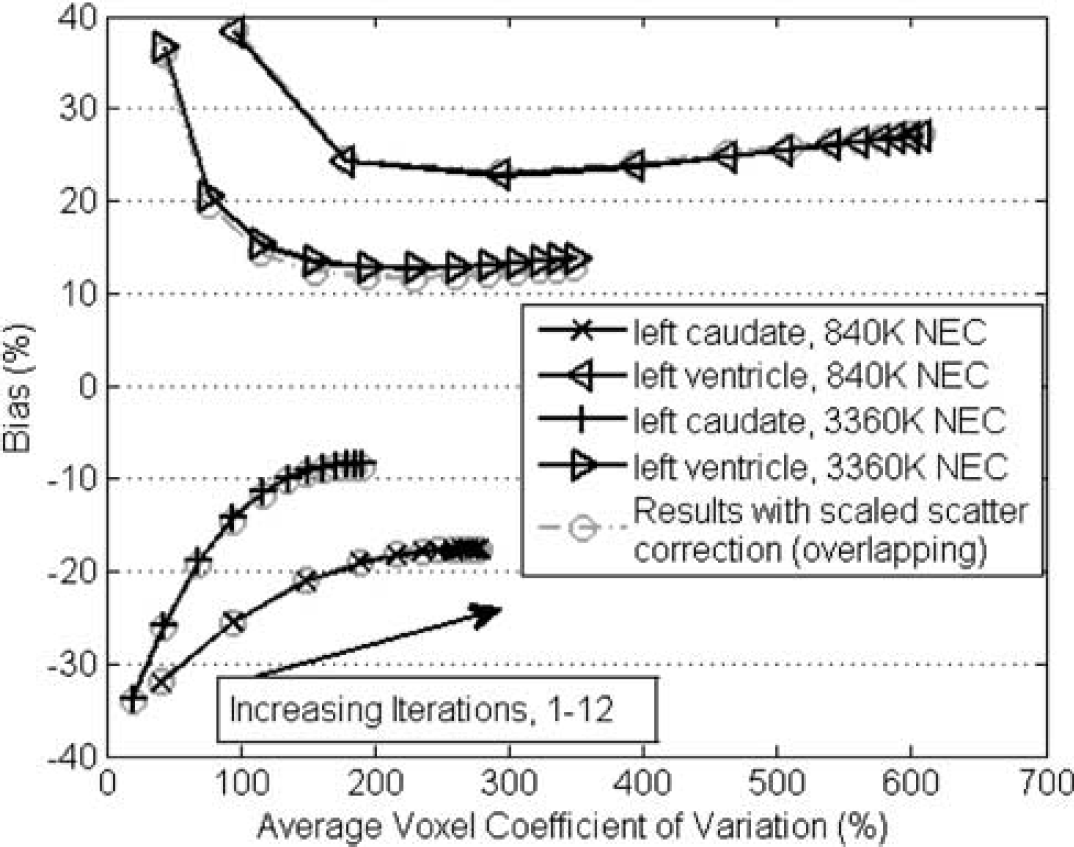
Methods: Statistically independent, low-count replicates of listmode data ([40 replicates of 15 secs, 840 K NEC];[10 replicates of 60 secs, 3360K NEC]) were created from a high statistics human dataset (391 MBq [11C]-DASB, 600 secs frame starting at 5 mins post injection, 33.6 M NEC, 197 M prompts, 40% randoms). This was achieved by sub-sampling the listmode data, creating replicates with equal expectation values but with independent noise. A scatter correction sinogram was calculated from each replicate. A second scatter correction sinogram was calculated by scaling the high-statistics (smooth) scatter correction sinogram. Each replicate was reconstructed with both scatter correction sinograms via OP-OSEM [3,4] (12 iterations, 16 subsets). The replicate images were summed and compared with the high statistics image. Bias was defined as the percentage difference between the summation image and the high statistics image. The inter-replicate voxel variance was also calculated.
Bias and variance effects at low statistics, calculated by comparison of low statistics images()[15 s, 840 K NEC];[60 s, 3360 K NEC]) with a high statistics image ([600 s, 33.6 M NEC]).
Results: The regions investigated had adequately converged by the final iteration. Images generated at low-statistics showed significant differences compared to the high statistics image. The use of a scatter correction derived from high-statistics data did not reduce this difference, nor did it reduce the inter-replicate voxel variance. The low-statistics images exhibit a negative bias in regions of high tracer uptake (−17%, caudate head), and a positive bias in regions of low tracer uptake (+27%, ventricles).
Conclusions: Bias can occur in low statistics frames using OP-OSEM reconstruction. Low and high statistic scatter corrections did not significantly alter the bias or variance. The observed bias is likely to be a property of the image reconstruction. Care must be taken in the use of iterative reconstruction with dynamic data.
479. From medium to ultra high field MR-BrainPET
H. Herzog and N.J. Shah
Forschungszentrum Juelich, Juelich, Germany
Objectives: Hybrid MR-PET scanning which allows simultaneous measurements of the two modalities will lead to new horizons for multi-parametric imaging observed by modality specific features in regard to functions and anatomy. Here, we report on a project at the Forschungszentrum Jülich where two hybrid MR-PET scanners constructed by Siemens and dedicated for human brain studies are being installed, one at 3T MRT and the other at 9.4T MRT.
Methods: The 3TMR-PET consists of a commercial MRI MAGNETOM Tim-Trio and a newly developed PET detector with avalanche photodiodes (APD) as readout electronics rather than magneto-sensitive photomultiplier tubes. The PET detector, called BrainPET, with an outer diameter of 60 cm fits in the MR bore. It consists of 32 copper shielded cassettes each with six compact detector modules. The detector front-end has 12 × 12 LSO crystals of 2.5 × 2.5 × 20 mm3 which are read out by an array of 3 × 3 APDs. Each cassette is linked by a 10 m long cable to the filter plate of the MRI room the data acquisition electronics on the outside. A combined transmit/receive RF coil is placed inside the BrainPET.
The 9.4T magnet is a newly developed centre piece of a whole-body scanner and has a bore size of 90 cm and a weight of 57 t. To perform brain MRI within the ultra-high magnetic field a new multi-channel transmit system is being implemented. New sequences to study nuclei such 23Na, 17O, and 19F have been developed. Adaption and testing of the BrainPET to the 9.4T MR environment is planned. Some preliminary tests of the BrainPET concerning resolution, scatter fraction, count rate performance, and image quality were carried out in the 3TMR-PET. Currently, the 9.4T instrument is producing MRI images; the adaption of the BrainPET is due to commence shortly.
Results: The tangential resolution (FWHM) was about 2.4 mm (r = 0 to 5 cm) in a central transversal plane with r = 0 to 5 cm, whereas radial resolution ranged from 2.1 mm to 5.5 mm. Within the 15 central image planes the axial resolution was 2.5±0.2 mm at r = 0 cm and 3.1±0.2 mm at r = 5 cm. When images of a cylindrical phantom with three cold rods were OSEM3D reconstructed and attenuation corrected, a scatter fraction of 27% was found in the air filled rod. Using a 25 cm long cylinder of 20 cm diameter filled with 18F the peak prompt-minus-delayed count rate was 680,000 cps at 50 kBq/mL. Furthermore, first tests of possible interferences of the BrainPET towards the 3T MRT yielded only minimal changes of the MR performance.
Conclusions: After first promising tests with the 3TMR-PET further detailed tests will be performed and the experiences will be transferred to the 9.4TMR-PET.
503. Highly detailed anatomically accurate 3D brain phantoms for PET with 3D printing
M.A. Miller and G.D. Hutchins
Department of Radiology, Indiana University School of Medicine, Indianapolis, Indiana, USA
Objectives: The quantitative capabilities of positron emission tomography, coupled with targeted radiotracers, are leading to the application of this technology as a neuroimaging biomarker with increasing frequency. Neuroimaging based biomarker studies are now being incorporated into multicenter trials using PET imaging systems with varying intrinsic performance and stability characteristics. Phantom studies are usually performed in order to evaluate the system performance and variability among PET imaging sites used in a given study. An ideal phantom would precisely model the shape and activity distribution of the brain. A commonly used brain phantom is the Hoffman 3D phantom.1 While this phantom is very well suited for some types of measurements, the apparent activity distribution in the phantom depends on the resolution of the camera making it difficult to use in addressing quantitative issues that require the full resolution of modern PET cameras. Our objective is to develop a method for manufacturing phantoms that accurately model realistic anatomy and are not dependent on imaging system performance.
Methods: We have developed a method of creating phantoms using rapid prototyping technology (3D printing). The system allows us to create phantoms based on any geometric model, including those derived from high resolution anatomical images. The method consists of incorporated radioactive tracer as a dye in the printing system of a powder-based rapid prototyping system. We use a Z Corp Z510 3D printer [Z Corporation, Burlington, MA]. Printing with 0.18 mm slice thickness at 600 dpi, our custom software allows us to accurately place activity throughout phantom volumes as large as 254 × 356 × 203 cm3. Software that uses digital atlases as input allows us to specify the activity concentration at the level of individual voxels.
Results: Printed activity distributions are linearly variable and reproducible to better than 2%. We have printed and imaged human brain phantoms based on the SPL human brain atlas2,3 and rat brain phantoms based on the Paxinos and Watson atlas.4
Conclusions: We have developed a practical method for making complex radioactive phantoms that model realistic anatomy at resolutions well below current or anticipated PET resolutions. Further development will produce phantoms with long lived isotopes. We intend to create a phantom library that models the distributions of [18F]FDG and [11C]PIB for a patient at multiple stages of Alzheimer Disease. This library will allow us to effectively image the same patient longitudinally on multiple scanners at multiple sites, providing us with detailed data on PET reproducibility and variability.
Supported by the Indiana Genomics Initiative (INGEN). INGEN is supported in part by Lilly Endowment, Inc.
603. Development of steady-state method combining bolus and increscent injection with a multi-programming syringe pump
M. Kobayashi1, Y. Michibata2, R. Maruyama1, Y. Higaki3, Y. Kiyono1, T. Kudo1, T. Tsujikawa1, Y. Yoshii1, A. Waki1, K. Kawai1,3, Y. Fujibayashi1 and H. Okazawa1
1Biomedical Imaging Research Center, University of Fukui; 2Faculty of Engineering, University of Fukui, Fukui; 3Graduate School of Medical Science, Kanazawa University, Kanazawa, Japan
Objectives: Multipoint arterial blood sampling after radiotracer injection is usually required for precise quantification on PET study. When multiple scans are required in the same animal, however, the number of blood sampling is limited because of small blood volume in animals. In this study, we developed a new tracer injection method to apply the H215O steady-state (SS) method which needs only a few blood sampling points to measure cerebral blood flow (CBF).
Methods: We designed a program for H215O injection combining bolus and slowly increscent (B/I) injection manner to reduce time for achieving an equilibrium of blood radioactivity in the H215O SS method. In this program, H215O was injected rapidly for 45 secs to fill the dead volume of injection tube and increase blood radioactivity, followed by gradual administration to compensate decay of 15O radioactivity in the blood. Efficacy of the program of H215O B/I injection to achieve fixed radioactivity was evaluated using a dose meter. Then, eight rats were studied with a small animal PET scanner. Small catheters were inserted into the femoral artery for blood sampling and the femoral vein for H215O administration. Before emission scans, a transmission scan was performed for 60 mins using 68Ge/68Ga. Six-minute list-mode PET scans were initiated at intravenous administration of 555 MBq/mL H215O using the B/I injection program with the syringe pump. Arterial blood was sampled every 1 mins during PET scans. Fifteen minutes after the H215O PET scan, N-isopropyl-p-[125I]-iodoamphetamine (125I-IMP) was injected in the same rat and arterial blood was withdrawn at a constant rate for 10 mins after tracer administration using the syringe pump. The rat brain was immediately removed and exposed to imaging plate for autoradiography. We selected similar 3 slices from H215O PET and 125I-IMP autoradiography images. Regions of interest (ROIs) were placed at whole brain on the slices in each radiotracer image. CBF from H215O SS method and that calculated from 125I-IMP-autoradiography based on microsphere model were compared.
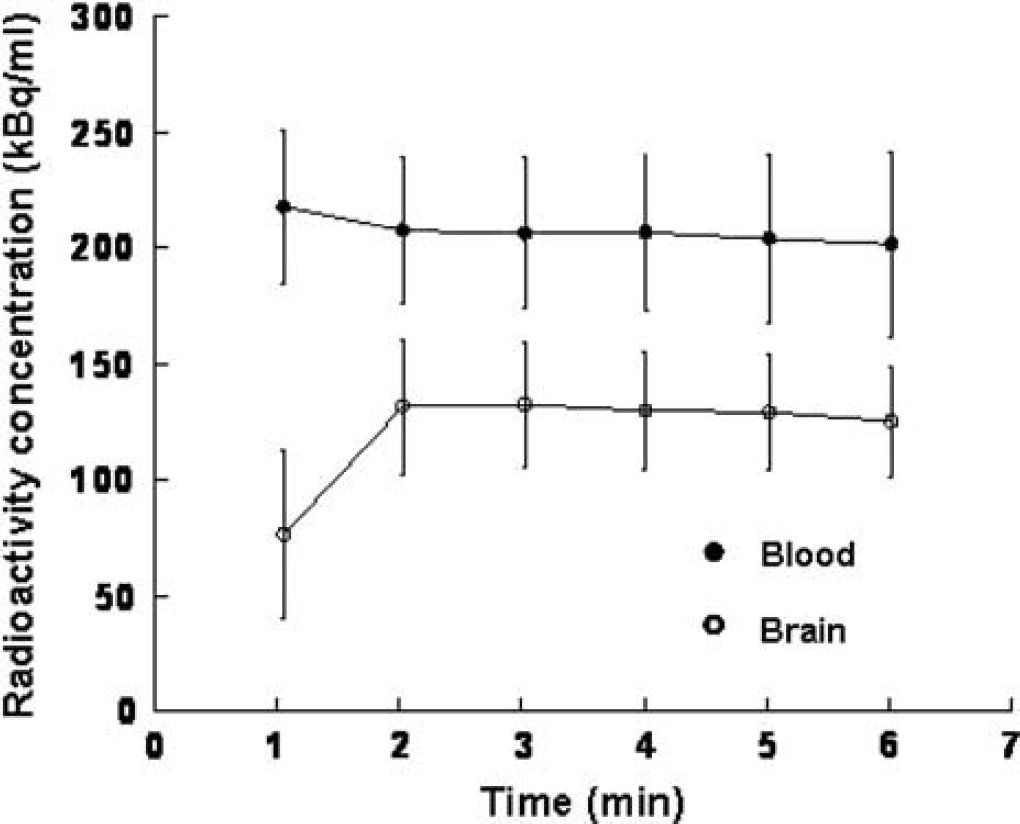
Results: The radioactivity of H215O administered by the B/I injection program achieved equilibrium at approximately 20 MBq in a dose meter. In the rat study, radioactivity concentration of H215O rapidly achieved equilibrium in the blood and brain at apploximately 2 mins after administration (Figure). Correlation of the CBF values of H215O (48.6±5.8 mL/100 g/min) using SS method and those of 125I-IMP (48.8±5.8 mL/100 g/min) was excellent (y = 0.99x+0.21, R2 = 0.98).
Radioactivity concentration in blood and brain.
Conclusion: The SS method with the B/I injection is useful for CBF measurement on small animal study and can be applied for animal and human PET studies using many radiotracers with short half life.
635. Template based attenuation correction for brain MR-PET scanners
E. Rota Kops and H. Herzog
Institute of Neuroscience and Medicine, Forschungszentrum Juelich, Juelich, Germany
Objectives: A primary prerequisite that positron emission tomography is regarded as a quantitative imaging procedure is its ability to correct sufficiently for attenuation. While in dedicated PET scanners attenuation correction is usually based on measured transmission data, in the new combined MRI-PET scanners the attenuation coefficients must probably be obtained with help of the anatomical T1-weighted images. This work investigates template based attenuation correction (TBA) of PET scans, the procedure of which was described in a previous report,1 in comparison to conventional PET based attenuation data (PBA).
Methods: Several templates were created. Inputs for these templates were gender specific attenuation maps recorded by PET transmission scans as well as a female CT image converted into linear attenuation coefficients in cm−1 at 511 keV.2 For the gender specific attenuation maps we used four male and four female transmission images and registered non-linearly three of them to the fourth. Furthermore, we took all eight images and registered non-linearly seven of them to a male eighth or to a female eighth. Finally, averages of these four registered groups were calculated resulting in four transmission based attenuation templates txAT (4mAT and 4fAT, 8mAT and 8fAT), for which the corresponding MR templates were obtained in the same way. The converted female CT image and its corresponding MR image built a CT based attenuation template (ctAT). Following the procedure described elsewhere,1 PET scans of 5 male and 5 female subjects of an ongoing study were attenuation corrected using the five groups of ATs and the reconstructed emission data were compared to PET images which were attenuation corrected using the conventional PBA data. Regions of interest (ROI) were drawn in cortical and subcortical relevant areas. Relative differences between PBA and the TBA images were calculated and averaged over all ROI and over each group.
Results: While in case of ATs, which have been created by referring to a female image, the means were positive with very similar standard deviations (4fAT: 1.04±3.73%, 8fAT: 0.13±3.57%, ctAT: 1.86±3.50%), the corresponding values obtained with ATs, which have been referred to a male image, showed a slight underestimation (4mAT: −2.84±3.63%, 8mAT: −2.46±3.52%). Between the mixed gender (8fAT: 0.13±3.57% and 8mAT: −2.46±3.52%) and the gender-related templates (4fAT: 1.04±3.73%, 4mAT: −2.84±3.63%, and ctAT: 1.86±3.50%) no significant differences could be found.
Conclusions: The presented results show that the mixed gender templates (8fAT and 8mAT) as well as the gender-related templates (4fAT, 4mAT, and ctAT) are appropriate for attenuation correction in a MR-BrainPET scanner.
656. The effects of iterative deconvolution partial-volume correction on beta-amyloid PET
B. Thomas1, L. Thurfjell2, J. Rinne3, S. Ourselin4 and B. Hutton1
1Institute of Nuclear Medicine, University College London, London; 2Medical Diagnostics R&D, GE Healthcare, Amersham, UK; 3Turku PET Centre, Turku, Finland; 4Centre for Medical Image Computing, University College London, London, UK
Objectives: To investigate the effects of partial-volume (PV) correction on the discrimination between Alzheimer's disease (AD) patients and healthy aging controls (HC) using novel amyloid imaging candidate [11C]-AH110690.1
Methods: The effect of partial-volume correction (PVC) was assessed using data from a previously acquired study. Nine AD patients and nine HC underwent a baseline and 12-month [11C]-AH110690 PET scan (Siemens ECAT EXACT HR+) and T1 MRI.
PV correction was applied using the Van-Cittert (VC) iterative deconvolution technique. A position-invariant point spread function (PSF) of 5.1 mm full-width at half-maximum (FWHM) was used for PVC, based on measurement.
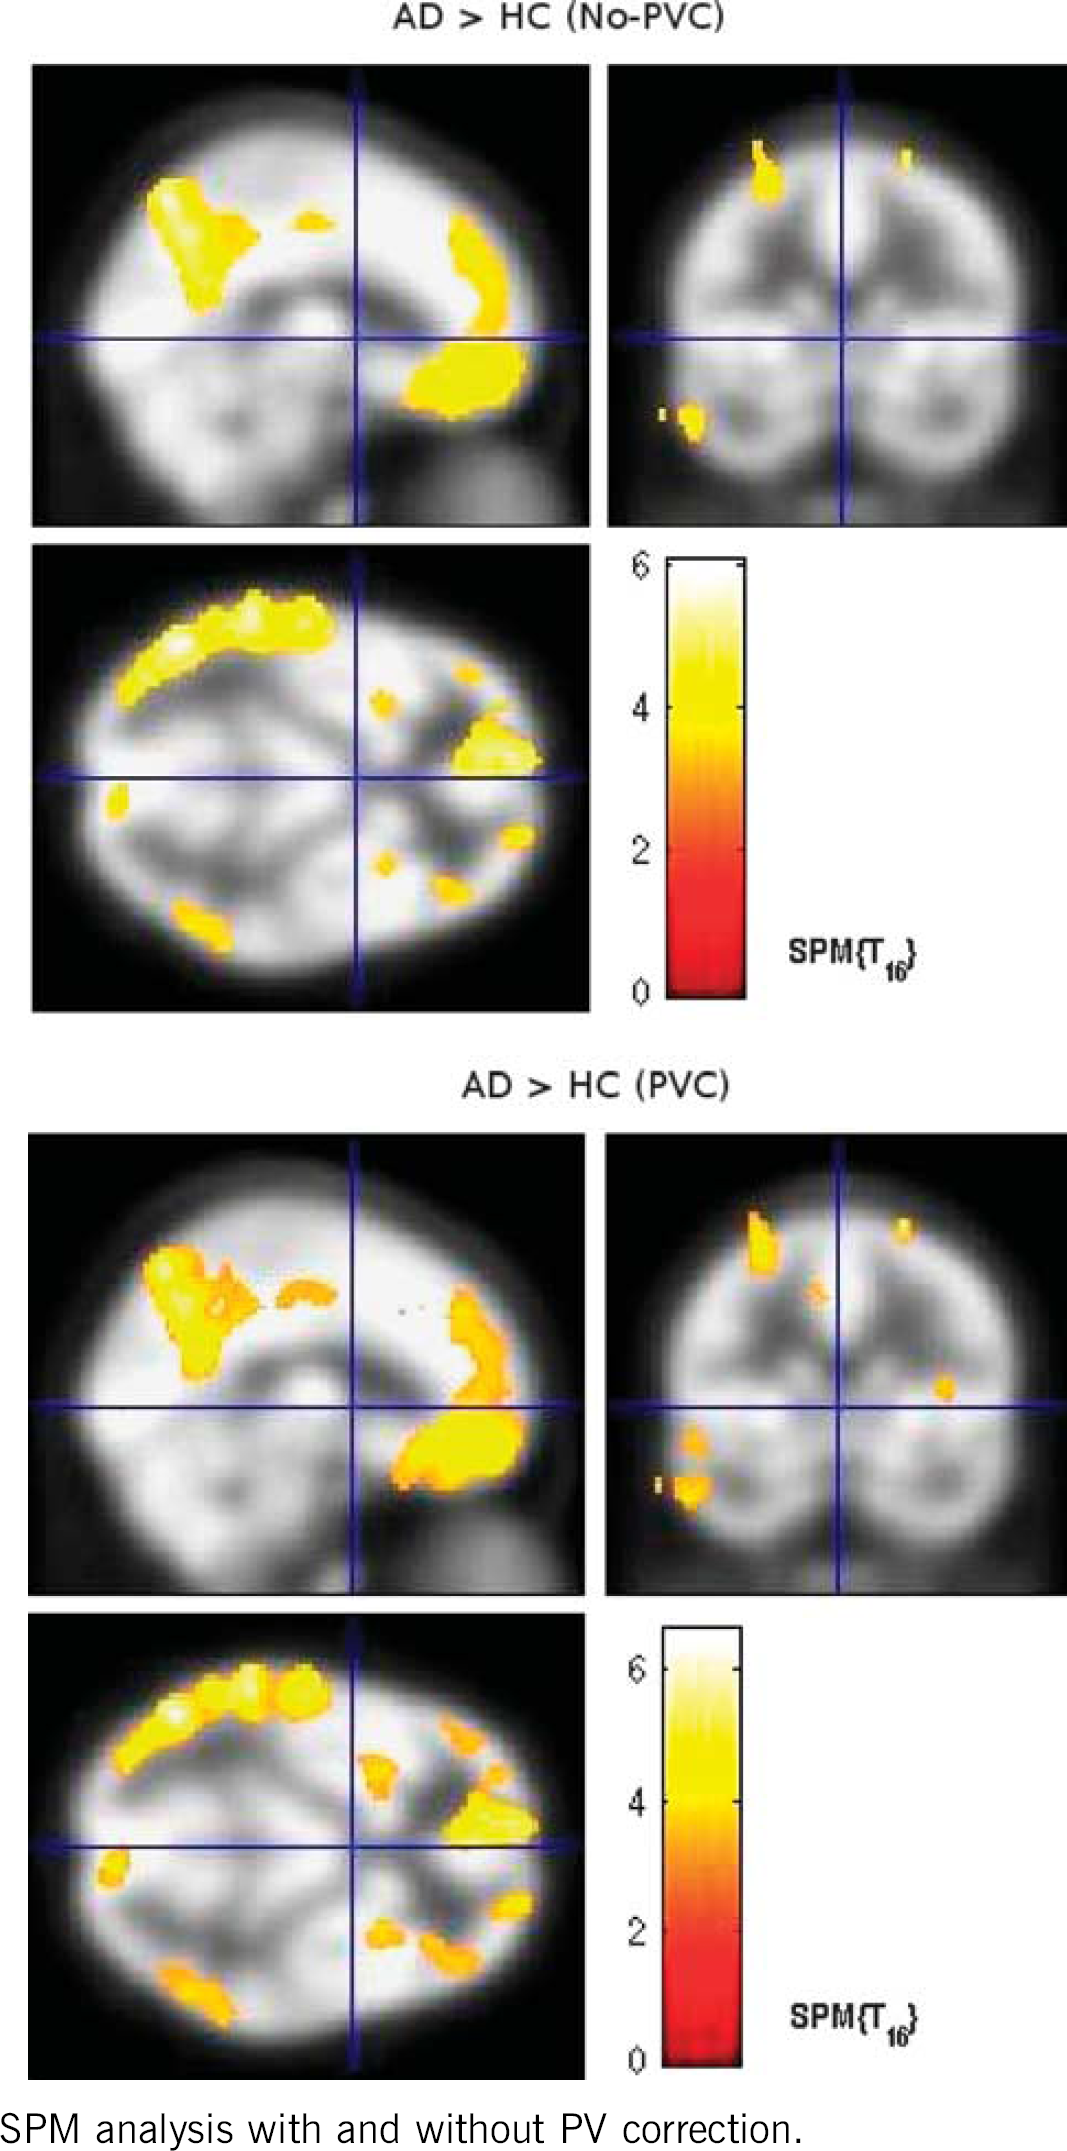
Standardised Uptake Value Ratio (SUVr) images of both the PV corrected and uncorrected data were created by normalising summed images (50 to 70 mins post-injection) using cerebellar grey matter as a reference region. The summed images were rigidly registered to the patient MR and spatially normalised to Montreal Neurological Institute (MNI) space. The summed images were then warped to MNI space using the parameters from the MR-MNI normalisation and smoothed by 8 mm. Statistical Parametric Mapping (SPM5) analysis was carried out on the cohort. Two-sample t-tests, AD>HC, were performed on the uncorrected and PV corrected data. P-values were corrected for multiple comparisons using False Discovery Rate (FDR) (P = 0.03) with an extent threshold of k = 25 voxels.
SPM analysis with and without PV correction.
Results: The VC deconvolution tends to amplify noise during subsequent iterations of the scheme. All images reached the stopping criteria at 30 iterations or fewer. Partial volume correction for each of the PET images of matrix size 128 × 128 × 63 took less than 2 mins on an AMD Athlon XP 1700+ with 1792MB RAM and running Windows XP.
The SPM group analysis between Alzheimer's patients and control subjects detected significant clusters in the frontal (No-PVC P = 0.021, PVC P = 0.016) and parietal lobes (No-PVC P = 0.018, PVC P = 0.014). Both clusters increased in size after PVC (frontal +9.03%, parietal +3.26%). The total number of clusters detected increased from 25 to 37 with PVC.
Conclusions: This work has shown that the application of partial-volume correction increases the spatial extent of significant clusters using SPM analysis. The appearance of small clusters in the PV corrected image, absent from the uncorrected image, suggests that PV correction improves discrimination.
678. Accurate measurement of arterial input function during FDG PET using a beta microprobe
G. Warnock1, C. Lemaire1, X. Langlois2, A. Luxen1 and A. Plenevaux1
1Centre de Recherches du Cyclotron, Universite De Liege, Liège; 2Johnson and Johnson Pharmaceutical Research and Development, Division of Janssen Pharmaceutica N.V., Beerse, Belgium
An accurate arterial input function is essential for many kinetic models with PET and beta microprobe data. This includes functional data such as glucose metabolism, measured using FDG, and receptor binding using radioligands. The usual method for determining input function is manual blood sampling at specific time points followed by counting of the radioactivity in a given volume. However, the measurement of input function via arterial blood sampling generally has poor time resolution and can lead to significant blood loss in small rodents.
Beta microprobe systems have recently become commercially available as an affordable alternative to PET. These systems utilise implantable probes consisting of a small (0.25 to 1 mm) scintillation crystal bonded to a fibre optic cable, which can be stereotactically located in a specific region of the rodent brain. Scintillation in the crystal is carried by fibre optic to a photomultiplier tube from which a time-activity curve is generated.
Pain et al1 used two beta microprobes to measure input function with one probe directly in the femoral artery. However, in this method the activity in surrounding tissues influenced the accuracy of the input function. Weber et al2,3 used an arteriovenous shunt and coincidence counter to measure input function while using beta microprobes in the brain. We have combined these two techniques to accurately measure FDG input function with high temporal resolution (1 secs) and no loss of blood. Using our apparatus a beta microprobe is placed directly in the blood flow of an arteriovenous shunt. The bi-exponential conversion for FDG described by Weber et al2,3 can then be used to generate the arterial plasma input function. Via the shunt it is also possible to infuse tracer or treatment compounds, and to continuously measure blood pressure.
We have used our apparatus to measure input function in beta microprobe studies of the brain, and furthermore have combined the measurement of input function in this way with PET scanning in rats. Our method for the measurement of input function will be extended to further studies with additional radioligands. Thus, kinetic modelling can be carried out without the need for a reference region or less accurate estimation of input function.
721. Design, construction, and testing of RF coil and animal body holder for simultaneous PET/MRI imaging of rat brain
L.A. Lopas, J.M. Moirano, K.N. Kurpad, S.A. Hurley and A.K. Converse
University of Wisconsin-Madison, Madison, Wisconsin, USA
Background and aims: Recent advances in technology have allowed for simultaneous Positron Emission Tomography (PET) and Magnetic Resonance Imaging (MRI) experiments. Our goal is to compare and validate several different techniques for measuring quantitative regional cerebral blood flow (rCBF) using a simultaneous PET/MRI system in rats. This synthesis of existing technologies raises new pragmatic concerns. Due to space limitations we could not use a standard animal RF coil and head holder. Using an eight section birdcage RF coil schema, we constructed a system that integrates into the RF coil the necessary PET requirements and a stereotactic device that will reliably and repeatably position the rat brain with respect to the PET insert.
Methods: The RF coil is made of acrylic tubing, 51 mm OD, 44 mm ID, and 56 mm in length. Blunt and tapered 6 mm threaded rods serve as ear bars. 19 mm slots were cut into the coil allowing a U-shaped tooth bar holder to be fixed in place. A 17 mm wide tooth bar adjusts to fit the subject and can be locked in place by a screw at the bottom of the U of the tooth bar holder. In an effort to limit positron annihilation photon attenuation caused by the RF coil, minimal material was used throughout construction.
Because the position sensitive avalanche photodiodes (PSAPD) of the PET insert need to be kept at −10°C for optimal performance, we designed an insulated body holder to keep the subject at 37°C. To accomplish this, the body holder will shield the subject from the cooling system for the PSAPD while allowing for warm air to be blown on the subject. The body holder will be comprised of two half-cylinders that can be securely fitted together during the scan. This design allows for easy set up and positioning of the subject and the lines running to and from the subject.
Results: Initial scans were performed on a 4.7T (300 MHz) Varian MRI scanner (Palo Alto, CA). A 33 mm diameter 30 mL cylindrical saline phantom was scanned to demonstrate good coil uniformity and signal to noise ratio. In vivo scans of a rat brain were performed and uniformity was verified using a flip angle calibration method. From these results, we expect the RF coil to provide good coverage of the rat brain and accurate quantitative imaging results.
Conclusion: We have constructed an integrated RF coil/head stereotactic device and are working on a body holder that meets the unique requirements of simultaneous PET/MRI studies. Phantom scans have demonstrated the reliability and effectiveness of our design. Future work will include incorporation of PET/MRI fiducials and heating of the subject.
804. Arterial input function sampling via an intra-arterial positron (+) probe: human H215O validation
K. Lee, P. Fox and J. Lancaster
Research Imaging Center, University of Texas Health Science Center at San Antonio, San Antonio, Texas, USA
Objectives: An important advantage of positron emission tomography (PET) relative to other functional imaging methods is its capacity for quantification in physiological units. For physiological quantification, the arterial-radiotracer concentration must be measured throughout the tracer-uptake period. Typically, this is done by sampling the arterial blood during scanning, to obtain an arterial input function (AIF). The goal of this study was to validate use of an intra-arterial β+ probe for measuring the AIF in humans. In a within-subject design, AIFs obtained via a β+ probe placed in the radial artery were compared to AIFs obtained by dynamic imaging of the descending aorta.
Methods: Eight healthy, normal volunteers participated. Each subject underwent 12 PET scans (6-thorax; 6-brain) and 2 MRI scans (1-thorax; 1-brain). Thoracic images were used to obtain intra-aortic AIFs. For each PET scan, 555 MBq of H215O in 6-mL saline was injected as an intravenous bolus. Image acquisition consisted of 90 two-sec frames, beginning ∼20 secs before injection. MRI was used to determine aortic diameter and location. Aortic ROIs created on MRI images were transferred to PET images for AIF. From the ROI, an aortic AIF was obtained. The aortic ROI values were corrected for partial volume effects using the recovery coefficient method. Radial AIFs were obtained using a β+ probe fabricated in-house.1 The probe consists of a 0.5-mm-diameter plastic scintillating fiber coupled to a photosensor module and was placed in the radial artery via a 22-gauge catheter. Intra-arterial β+-probe counts were corrected for gamma interactions using an identical external probe attached to the wrist. Both β+ probes were sampled at 1 Hz. The time-delay between the aortic and radials AIFs was measured and then corrected for prior to statistical comparison of the two AIFs. Full-width half maximum (FWHM), peak amplitude, area and correlation coefficient were used to characterize and compare the radial and aortic AIFs.
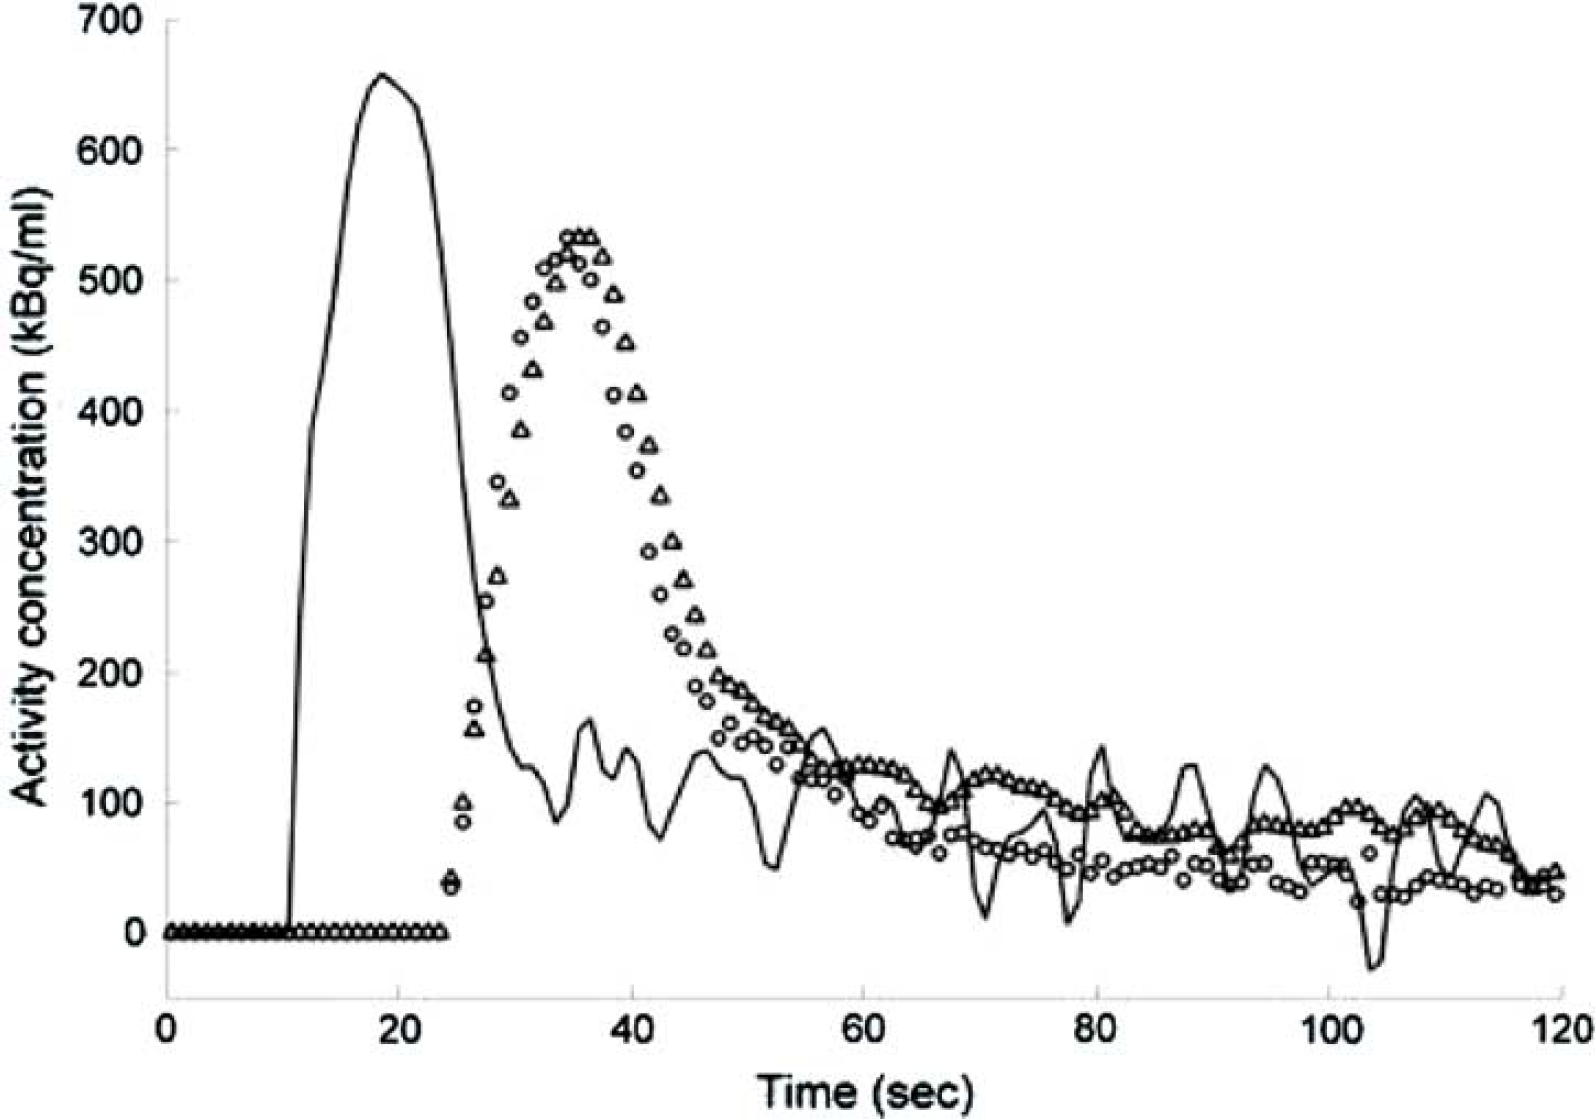
Results: Good-quality radial (circles) and disperse-corrected aortic (triangles) AIFs were successfully obtained for every injection in every subject (Figure). The time delay between the disperse-uncorrected aortic (solid-lines) and radial bolus arrival times was 19.6 secs (±1.8 secs, SD). AIF-curve shapes were appropriate for a rapid bolus injection and frame-to-frame variability (noise) was very low. Radial AIFs were more dispersed than aortic AIFs. After delay and dispersion correction, the shapes of the two AIFs curve did not differ. This was statistically confirmed (paired-t test) by comparing the FWHMs (P = 0.401), peak amplitudes (P = 0.889), and areas under the curves (P = 0.401), none of which differed. The correlation between the aortic and radial AIFs was excellent (r = 0.90±0.07 (mean±s.d.)).
An image-derived aortic and radial AIFs.
Conclusion: An intra-arterial β+ probe is reliable, low-noise, high-temporal-resolution, method for obtaining an AIF for PET quantitative.
810. Arterial input function sampling via an intra-arterial positron probe: human proof-of-concept application
K. Lee, P. Fox and J. Lancaster
Research Imaging Center, University of Texas Health Science Center at San Antonio, San Antonio, Texas, USA
Objectives: An important advantage of positron emission tomography (PET) relative to other functional imaging methods is its capacity for quantification in physiological units. For physiological quantification, the arterial radiotracer concentration must be measured throughout the tracer uptake period. Typically, this is done by sampling the arterial blood during scanning, to obtain an arterial input function (AIF). As an alternative to blood extraction, we have developed an intra-arterial, positron-detecting probe (β+ probe) system for measuring the AIF.1 The goal of this study was to demonstrate the use of the β+ probe system for H215O PET studies in humans. In a within-subject design, H215O PET measurements of cerebral blood flow (CBF) were obtained during normal ventilation and volitional hyperventilation, a maneuver know to lower whole-brain CBF.
Methods: Eight healthy, normal volunteers participated. Each subject underwent 12 PET scans (6 thorax; 6 brain) and 2 MRI scans (1 thorax; 1 brain). Thoracic images were used to validate the β+ probe-derived AIFs relative to aortic, image-derived AIFs (reported in a separate abstract2). Brain images were used to compare brain blood flow in the two physiological states. For each H215O PET scan, 555 MBq of H215O in 6 mL of saline was injected as an intravenous bolus. For the six brain scans, physiological state was alternated between normoventilation and hyperventilation. Radial artery AIFs were obtained using the β+ probe system, which consists of a 0.5 mm-diameter plastic scintillating fiber coupled to a photosensor module (Hamamatsu, H7826P) via a luer-lock hub. The probe fiber was placed in the radial artery via a 22-gauge catheter. Intra-arterial β+ probe counts were corrected for gamma interactions using an identical external probe attached to the wrist. Both β+ probes were sampled at 1 Hz. Global CBF (mL/100 g/min) was calculated using the Ohta method.3 CBF values were computed with and without dispersion correction using two-sample pair t-tests.
Results: Values for whole-brain CBF were in excellent agreement with literature values3 for both physiological states, both with and without dispersion correction. In normal ventilation, whole-brain CBF values were 51.7±7.7 (mean±s.d.) uncorrected and 50.6±6.8 corrected, which were not significantly different. In hyperventilation, whole brain CBF values were 35.6±4.8 (mean±s.d.) uncorrected and 34.0±4.8 corrected, which also were not significantly different. As expected, hyperventilation dramatically lowered whole-brain CBF, this change being highly significant (P<0.0002).
Conclusion: Physiologically quantitative PET studies can be obtained using an intra-arterial, positron-detecting probe system to obtain the arterial input function. This internal tracer quantification method is safer, simpler and more convenient than methods which rely on external counting of blood samples removed from the subject. Dispersion correction of AIFs obtained by this method is not necessary.
925. A brain phantom study of iterative deconvolution versus anatomical-based partial-volume correction techniques
B. Thomas1, K. Erlandsson1, S. Ourselin2, L. Thurfjell3 and B. Hutton1
1Institute of Nuclear Medicine; 2Centre for Medical Image Computing, University College London, London; 3Medical Diagnostics R&D, GE Healthcare, Amersham, UK
Objectives: Partial-volume (PV) correction techniques require a measure of the scanner point-spread function (PSF) to operate. Two anatomical-based partial-volume correction (PVC) methods were evaluated: Müller-Gärtner (MG) and Multi-target correction (MTC). An iterative deconvolution method, Van-Cittert (VC), that requires no anatomical data, was also applied. The objective is to evaluate whether the performance of Van-Cittert deconvolution is comparable to anatomical PVC techniques when faced with measurement errors and noise.
Methods: Synthetic phantom images were generated using the Zubal phantom in Matlab with a 4:1 grey matter (GM) to white matter ratio. 10% variability in regional GM concentrations was applied. The image was forward projected with attenuation, adding approximations for scatter and randoms. Poisson distributed noise was added to the sinograms. Reconstruction was performed using filtered back-projection (FBP) with a Ramp filter. Ten realisations were generated at each noise level. Images were analysed in terms of recovery coefficient (RC) and standard deviation (s.d.) across noise realisations. A position-invariant PSF of 7.75 mm was found by measurement.
MG and MTC were executed in Matlab. The VC method was implemented in C++ and uses a Deriche-style recursive approximation Gaussian filter. MTC is a ‘hybrid’ anatomical PVC method, performing a Geometric Transfer Matrix (GTM) PV correction and using the estimated regional values as a basis for voxel-based PV correction. PVC was executed with PSF errors of ±2 mm (5.75 to 9.75 mm). MG and MTC PV correction was performed with perfect VOIs. Five count levels were tested (1.20e+07 to 3.84e+08).
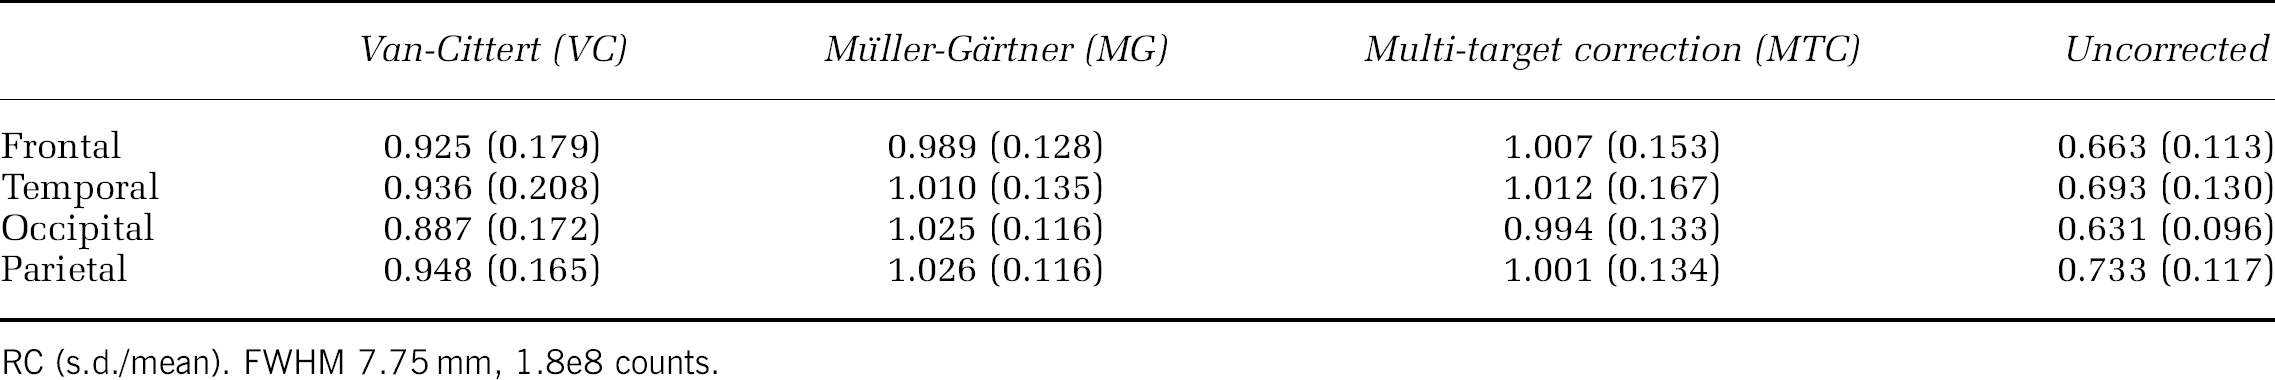
Results: The results indicate that VC performance degrades at higher noise levels. Both MTC and MG were more reliant on an accurate measure of the PSF than VC. Errors in the PSF alter the number of iterations performed during VC PV correction, changing recovery and noise. The table below shows performance of the PVC techniques for one noise level.
Van-Cittert (VC)
Müller-Gärtner (MG)
Multi-target correction (MTC)
Uncorrected
Frontal
0.925 (0.179)
0.989 (0.128)
1.007 (0.153)
0.663 (0.113)
Temporal
0.936 (0.208)
1.010 (0.135)
1.012 (0.167)
0.693 (0.130)
Occipital
0.887 (0.172)
1.025 (0.116)
0.994 (0.133)
0.631 (0.096)
Parietal
0.948 (0.165)
1.026 (0.116)
1.001 (0.134)
0.733 (0.117)
RC (s.d./mean). FWHM 7.75 mm, 1.8e8 counts.
Conclusions: Where a perfectly registered and segmented anatomical image is available, MTC outperforms both MG and VC in terms of recovery. However, MTC requires anatomical parcellation. MG is unable to account for variability in grey matter. VC does not achieve the same level of recovery as the other two methods, but has the advantage of requiring no anatomical information. VC is a viable alternative to anatomical PV correction.
930. Three-dimensional realistic brain phantom containing bone and grey matter structures for evaluating PET/SPECT imaging techniques
H. Iida1,2,3, E. Imabayashi2, K. Ishida1, H. Matsuda2, A. Yamamoto1 and C. Svarer3
1Department of Investigative Radiology, National Cardiovascular Center Research Institute, Osaka; 2Department of Nucl Med, Saitama International Medical Center, Saitama Medical University, Saitama, Japan; 3Neurobiology Research Unit, Rigshospitalet, Copenhagen, Denmark
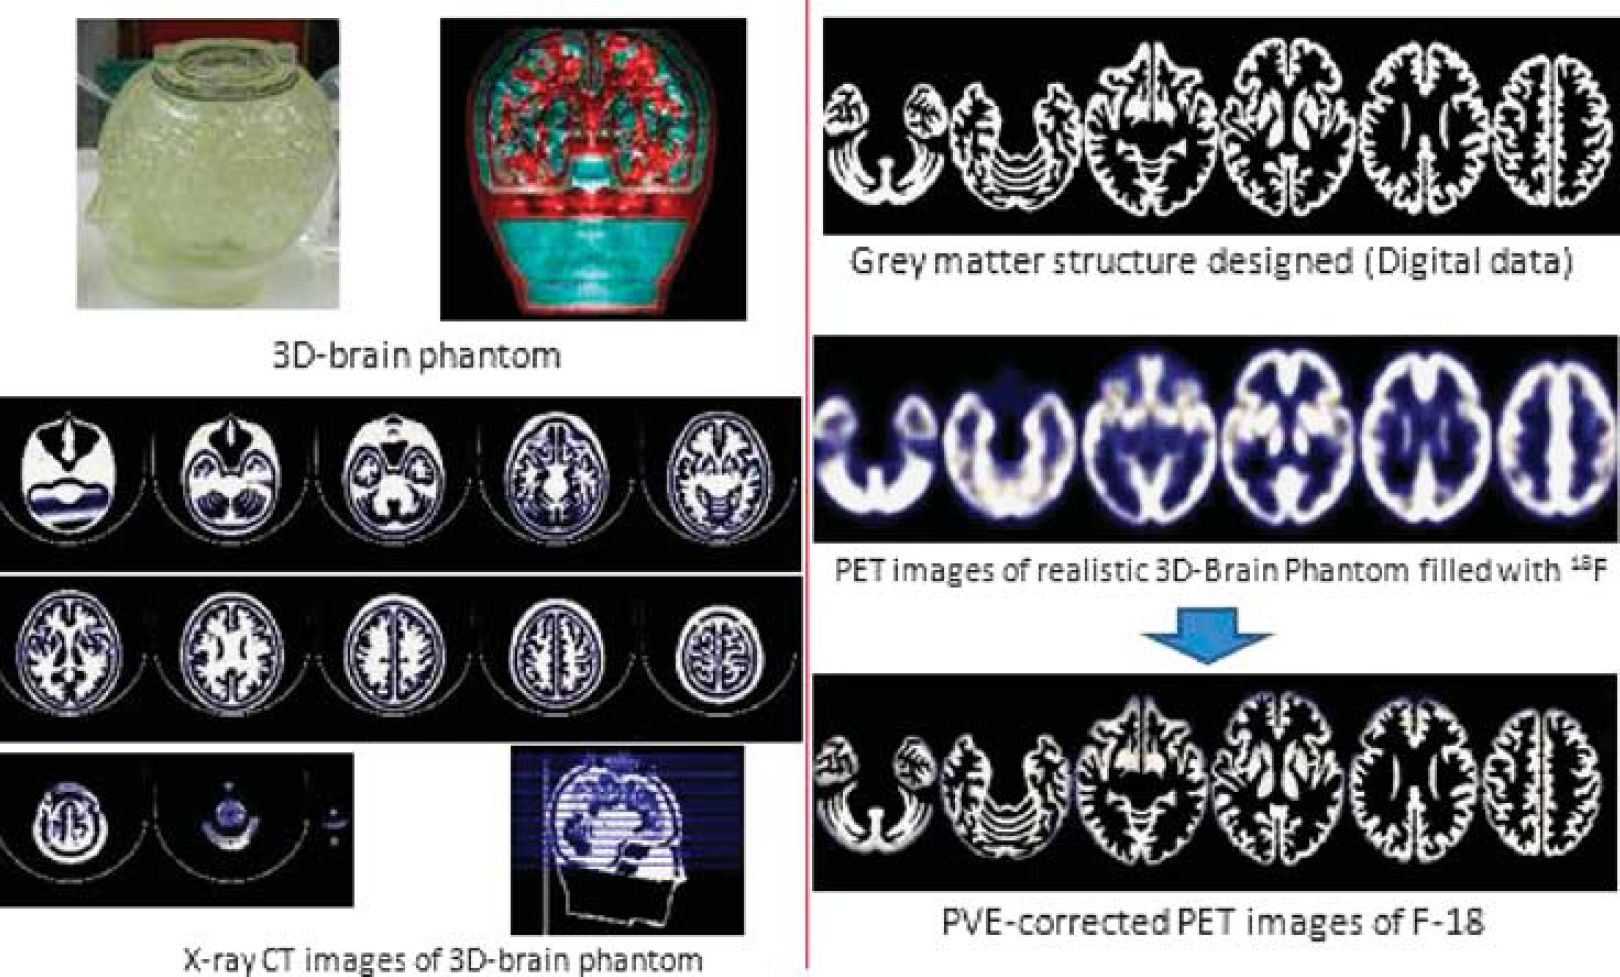
Introduction: A sophisticated 3-dimensional brain phantom simulating a realistic head model that contains bone and detailed grey matter structures has been developed. Adequacy of the laser-modeling technique for constructing a detailed structure and its usefulness for evaluating a partial-volume effect (PVE) has been tested for PET/SPECT imaging.
Materials and methods: The phantom was made of transparent photo-curable polymer of density 1.09 g/mL, and constructed with the laser-modeling technique. The grey matter structure was designed slice-by-slice by tracing a high-resolution MRI on a healthy volunteer, consisting of cortical grey matter regions, striatum, thalamus, and the cerebellum. Additional component was made for skull structure, to which bone-equivalent solution of K2HPO4 was inserted. These multiple slice images were combined to establish two volume compartments, in which axial interpolation was made carefully so that each component does not lose connection. This volume data was then deformed 3-dimensionally to fit to a mannequin head model. Careful attention was made so that the liquid can be diluted to each component without air-bubble contamination. X-ray CT images were acquired to confirm the design structure, and also the bubbles not being contaminated. PET images were then acquired using Siemens ACCEL tomograph with F-18. A sophisticated program for correcting for the partial-volume effect, PVElab1 has been applied, and the accuracy of the correction was tested.
Phantom design and results for PVE correction.
Results and discussion: The volume of the grey-matter component was 550 mL, and the bone 250 mL. The apparent attenuation coefficient for the whole brain was 0.173 cm-1 for Tc-99m, slightly higher than typical values for normal volunteers (0.168 cm−1). Air bubbles have been removed relatively easily from each of compartments, as confirmed with the X-ray CT. X-ray CT also demonstrated a good agreement with the original design of the phantom, suggesting adequacy of the laser-modeling technique. PET images also showed a good agreement with the design after smoothing. The pixel counts in the grey matter area, which varied from region to region, became closer after the PVE correction, as shown in Figure. Counts in frontal and temporal regions relative to striatum was 0.92 and 0.89, which became 0.96 and 0.92, respectively. However, counts in the occipital, parietal, cerebellum regions did not show improvement after PVE correction, which might partly be attributed to misalignment between PET and the anatomical image.
Conclusion: Use of the realistic 3D-brain phantom may be an adequate approach for evaluating accuracy of various PVE correction techniques in brain PET.
1037. HAMNET: A toolbox for connectivity analysis from neuroimaging data
S. Bose1, R. Wise2,3, S. Brownsett2,3, G. Torresan1 and F. Turkheimer1,3
1PET Methodology, MRC Clinical Sciences Centre; 2MRC Clinical Sciences Centre, Imperial College; 3Division of Neuroscience and Mental Health, Imperial College, Hammersmith Hospital, London, UK
Objectives: To present a methodological platform for effective connectivity analysis for positron emission tomography (PET) or functional MRI (fMRI). It works with an input dataset composed from the activation time course of specific brain regions for several subjects under study and gives as outputs the estimation of the connectivity coefficient between the regions, the corresponding P-values, the regression coefficients and the acceptance value of the FDR and the Hochberg tests for the significance level of the connectivity detected.
Methods: Partial correlation has been considered as an effective measure of functional connectivity between a given pair of brain regions by removing the effects caused by other regions (Marrelec, 2008). We combined data from two studies of focal activation in response to the different conditions, which had two identical conditions, the implicit processing of passages of narrative speech and their spectrally-rotated (unintelligible) transformations. The partial correlation values were calculated using a fixed effect model whereas one regional data-point was extracted from each PET [O15]water PET and all scans for all subjects were pooled together in the same data matrix. Individual regional values were normalized to the global brain radioactivity; this was achieved by using the average of brain counts as additional variable in the partial correlation analysis. Partial correlation coefficients were then transformed in normal z-scores using the Fisher z-transform. The ensuing set of P-values was thresholded using the false positive rate correction (0.05 false positive rate) calculated using the adaptive methodology detailed in Benjamini and Hochberg1 that used an estimator of the number of true null hypothesis presented in (Turkheimer et al.2).
Results: The pattern of connectivity indicated that the angular gyrus exerts top-down influence over activity within the part of the language network distributed across left posterior temporal cortex, contrary to other influential models of speech comprehension. In addition, there were also anterior temporal lobe functional connections, incorporating top-down influence from the anterior part of Broca's area in the inferior frontal gyrus; and between a number of mirror regions in the left and right cerebral hemispheres.
Conclusions: This work demonstrates that the partial correlations between pairs of brain regions can be a useful tool for effective connectivity analysis. This allows the effect of other nodes in the network to be subtracted (as well as removing the effect of nuisance factors such as global radioactivity counts), leaving a more accurate approximation of the interaction between pairs of regions.
Availability: The software is available free for academic use upon request.
1046. A comparison of linear and nonlinear methods for registration of PET images
J. Rowley1, E. Kobayashi2, J. Hall2, F. Andermann2, F. Dubeau2, M. Diksic3, G. Massarweh3 and P. Rosa-Neto4
1Translational Neuroimaging Laboratory, Douglas Hospital-McGill University; 2Department of Neurology and Neurosurgery; 3Brain Imaging Center, Montreal Neurological Institute, McGill University; 4Translational Neuroimaging Laboratory—MCSA, Douglas Hospital, McGill University, Montreal, QC, Canada
Objective: Anatomical differences between healthy and neurologically affected populations may constitute a significant confounding factor when PET images are analyzed using voxel based statistics. Non-linear registration of PET images based on MRI information can potentially minimize the impact of anatomical variability on group analysis of PET data. Here we compare the effect of MRI-based non-linear registration in voxel-based t-statistics maps contrasting [11C]ABP688 binding potential (BPND) between normal controls (Ctrls) and patients harboring unilateral temporal lobe epilepsy (TLE). MRI examination of TLE patients commonly reveals atrophy of the temporal structures, especially in the hippocampus.
Methods: 10 TLE patients (5 right, 5 left; mean age 34 +-14 std) and 9 Ctrls (mean age 40+−20 std) had a dynamic scan conducted in a ECAT HR+ after injection of 370 MBq of [11C]ABP688 IV followed by a 15 mins transmission scan. Images were reconstructed using filter back projection and subsequently analyzed using the Logan's reference tissue method with the cerebellum as a reference region. All participants had a T1 weighted 1 mm isotropic MRI for coregistration purposes. Individual PET-MRI images were linearly registered using rigid body transformation. The MRIs were then linearly registered to the MNI157 space using 9 parameters. The PET images subsequently underwent a nonlinear registration using a deformation field to warp the image to the best possible fit. Patients with right TLE had their PET flipped in the x-direction prior to registration in order to keep the epilepsy hippocampus in the left side. T-statistics were calculated by comparing the left hemisphere of TLE patients versus Ctrls with linear and nonlinear registration.
Results: Unilateral abnormalities in the epileptogenic hippocampus of TLE patients could be clearly identified with both linear and nonlinearly-treated images, with significant declines of [11C]ABP688 BPND (t (linear) = 6.6 as compared to t(nonlinear) = 5.6). However, nonlinearly registered maps could identify the maximum peak within subiculum-CA1 regions, whereas linearly registered images showed a more homogeneous cluster involving the whole hippocampal head. Hippocampal cluster peaks were 5 mm apart and maximum t-value was higher for linearly coregistered maps (6.6 as compared to 5.6). No difference in cluster extent was observed (voxels of t>3.0 within the hippocampal clusters: 2906 versus 2896).
Conclusions: In TLE, we were able to show that in a group of patients with structural abnormalities involving small and complex structures such as the hippocampal formation, linear registration might bias the anatomical location of PET information. In the particular case of TLE, receptor binding studies such as [11C]ABP688-PET can provide detailed information that can be later correlated with pathological findings of cell loss and gliosis within specific hippocampal subfields.
Footnotes
1
In subsequent studies the compound is referred to as GE-067.
References
1.
Rabiner. Synapse (in press).
2.
Martinez. JCBFM2003;23:285–300.
3.
Goldstein. IEEE Trans Med Imaging1997;16:17–27.
4.
Bloomfield. Phys Med Biol2003;48:959–78.
5.
Logan. Nucl Med Biol2000;27:661–70.
6.
AsanumaK. Decreased [11C] raclopride binding in striatum in non-manifesting DYT1 carriers. Neurology2005;64:347–9.
PaxinosGWatsonC. The Rat Brain in Stereotaxic Coordinates. 4th ed.Academic Press, 1998.
18.
KopsRota E. IEEE San Diego2006.
19.
BurgerC. Eur J Nucl Med2002;29:922–7.
20.
RinneJuha OWilsonIan AThurfjellLennartNågrenKjellSolinOlofLehikoinenPerttiKoikkalainenJuhaLötjönenJyrkiAaltoSargoVirtanenKirsiKailajärviMaritaScheininMikaFarrarGill, ‘Follow-up study of a new brain amyloid tracer, 11C-labelled 3′-F-PIB ([11C]AH110690)’, in Alzheimer's disease, Submitted.
21.
TohkaJussiReilhacAnthonin. Deconvolution-based partial volume correction in Raclopride-PET and Monte Carlo comparison to MR-based method. NeuroImage2008;39:1570–84.
22.
PainF. J Nucl Med2004;45:1577–82.
23.
WeberB. Eur J Nucl Med2002;29:319–23.
24.
WeberB. J Cereb Blood Flow Metab2003;23:1455–60.
25.
Lee. Rev Sci Instrum2008;79:064301-1-7.
26.
Lee. Rev Sci Instrum2008;79:064301-1-7.
27.
Lee. Abstract of the XXIV International Symposium on Cerebral Blood Flow, Metabolism and Function, 2009, A-164-0011-00804.
28.
Ohta. J Cereb Blood Flow Metab1996;16:765–80.
29.
ErlandssonKjellWongAndrewParseyRaminvan HeertumRonaldMannJ. A new voxel-based partial volume correction method for PET and SPECT. J Nucl Med Meeting Abstracts2006;47:191P.
30.
TeoBoon-KengSeoYounghoBacharachStephen L.CarrasquilloJorge A.LibuttiSteven K.ShuklaHimanshuHasegawaBruce H.HawkinsRandall A., and FrancBenjamin L.. Partial-Volume Correction in PET: Validation of an Iterative Postreconstruction Method with Phantom and Patient Data. J Nucl Med2007;48:802–10.
31.
SvarerC. Neuroimage2005;24(4):969–79.
32.
Benjamini and Hochberg. J Educ Behav Stat2000;25:60–83.
33.
Turkheimer. Neuroimage2001;13:920–30.
34.
FranssonPMarrelecG. Neuroimage2008;42:1178–84.
35.
AshburnerJFristonKJ. Nonlinear Spatial Normalization Using Basis Functions. Human Brain Mapping1999;7:254–66.
36.
MyersR. The application of PET-MR image registration in the brain. The British Journal of Radiology2002;75:S31–5.