
Abstract
The effect ethanol exerts on the human brain has not yet been addressed by longitudinal magnetic resonance (MR) spectroscopic experiments. Therefore, we longitudinally characterized cerebral metabolite changes in 15 healthy individuals by proton magnetic resonance spectroscopy (1H-MRS) subsequent to the ingestion of a standard beverage (mean peak blood alcohol concentration (BAC): 51.43 ± 10.27 mg/dL). Each participant was examined before, over 93.71 ± 11.17 mins immediately after and 726.36 ± 94.96 mins (12.11 ± 1.58 h) past
Introduction
Ethanol (Eth) consumption may result in a broad variety of cerebral alterations. In particular, Eth is known to affect brain metabolism.
In humans, various 1H-MRS studies have explored chronic effects of Eth on cerebral metabolism by comparing alcoholic versus healthy subjects, light versus heavy drinkers or alcoholic subjects under certain conditions, for example, abstinence (Bartsch et al, 2007; Bendszus et al, 2001; Bloomer et al, 2004; Ende et al, 2005; Meyerhoff et al, 2004; Parks et al, 2002; Schweinsburg et al, 2003, 2001; Seitz et al, 1999). Presently, there are no data on acute Eth effects on cerebral metabolism of healthy subjects available.
Regarding the effects of chronic alcohol consumption on human brain metabolism, most investigations report reduced levels of NAA (Bartsch et al, 2007; Bendszus et al, 2001; Bloomer et al, 2004; Meyerhoff et al, 2004; Schweinsburg et al, 2003) and Cho (Bartsch et al, 2007; Bendszus et al, 2001; Bloomer et al, 2004; Ende et al, 2005; Parks et al, 2002) in alcoholics compared with those in healthy subjects and alcoholics before and after abstinence, respectively. Findings of Eth effects on cerebral Ins levels are highly ambiguous ranging from reduction to elevation (Meyerhoff et al, 2004; Parks et al, 2002; Schweinsburg et al, 2001; Seitz et al, 1999). Most studies have revealed no effects of Eth on cerebral Cr levels (Parks et al, 2002; Seitz et al, 1999).
In rat brain, MR spectroscopic findings of acute metabolite changes after intravenous, intragastrical and intraperitoneal Eth application revealed stable (Adalsteinsson et al, 2006) as well as elevated NAA levels (Hirakawa et al, 1994), reduced Cho and stable Cr concentrations (Adalsteinsson et al, 2006). For chronic Eth effects, NAA is referred to as stable (Braunova et al, 2000), Cho as stable (Braunova et al, 2000) or varying over time (Lee et al, 2003), Ins as decreased and Cr as decreased (Braunova et al, 2000) or stable (Lee et al, 2003).
The purpose of this study was to longitudinally delineate the acute impact of Eth on cerebral metabolites in human brain. Emphasis was placed on the assessment of water integrals to ensure that alterations of metabolite levels upon Eth consumption were not feigned by shifts in brain water content. For further reduction of false-positive findings, a specific cascade of statistical analyses was applied for every metabolite concentration time series.
On the basis of the findings of the Eth experiment, we performed a separate Glc infusion experiment to validate the capability of the applied MRS analysis method (LCModel) to extract even those metabolites from the spectral data set, which are challenging to detect at 1.5 T like Glc.
Materials and methods
The study was approved by the Medical Ethics Committee (Faculty of Clinical Medicine, University of Wuerzburg, Germany), and all participants gave written informed consent before enrollment. Volunteers were granted allowance for participating in the study.
Participants
Localized 1H-MRS
Localized 1H-MRS consisted of single voxel spectroscopy measurements by a point-resolved spectroscopy SE sequence at echo time (TE) of 30msecs (repetition time (TR) = 2.500 msecs, vector size of 1,024, scan time of 2 mins 15 secs). All MR measurements were performed on a 1.5-T Magnetom Vision system (Siemens Medical, Erlangen, Germany) running on Numaris/4 (VA25A) with Quantum gradients using an eight-channel head coil.
For every voxel, two spectra with and without chemical-shift selective water suppression (Haase et al, 1985) were obtained (50 versus 10 acquisitions) to allow for eddy current correction and water scaling. Fixed scanner calibration was confirmed by external
In the Eth experiment, voxels were placed supratentorially (voxel size = 25 × 25 × 25 mm3) in the left fronto-mesial lobe and infratentorially (voxel size = 22 × 22 × 25 mm3) in the left cerebellar hemisphere to capture putative spatial differences in susceptibility of the brain parenchyma to Eth. In the Glc experiment, voxels were placed only supratentorially. As described earlier (Bendszus et al, 2001), reproducible positioning was achieved by setting the infratentorial voxel with its medial edge close to the fourth ventricle, and with its superior edge below the tentorium, and by placing the supratentorial voxel with its inferior edge at the callosomarginal sulci and with its posterior edge at the central sulci (Figure 1A).
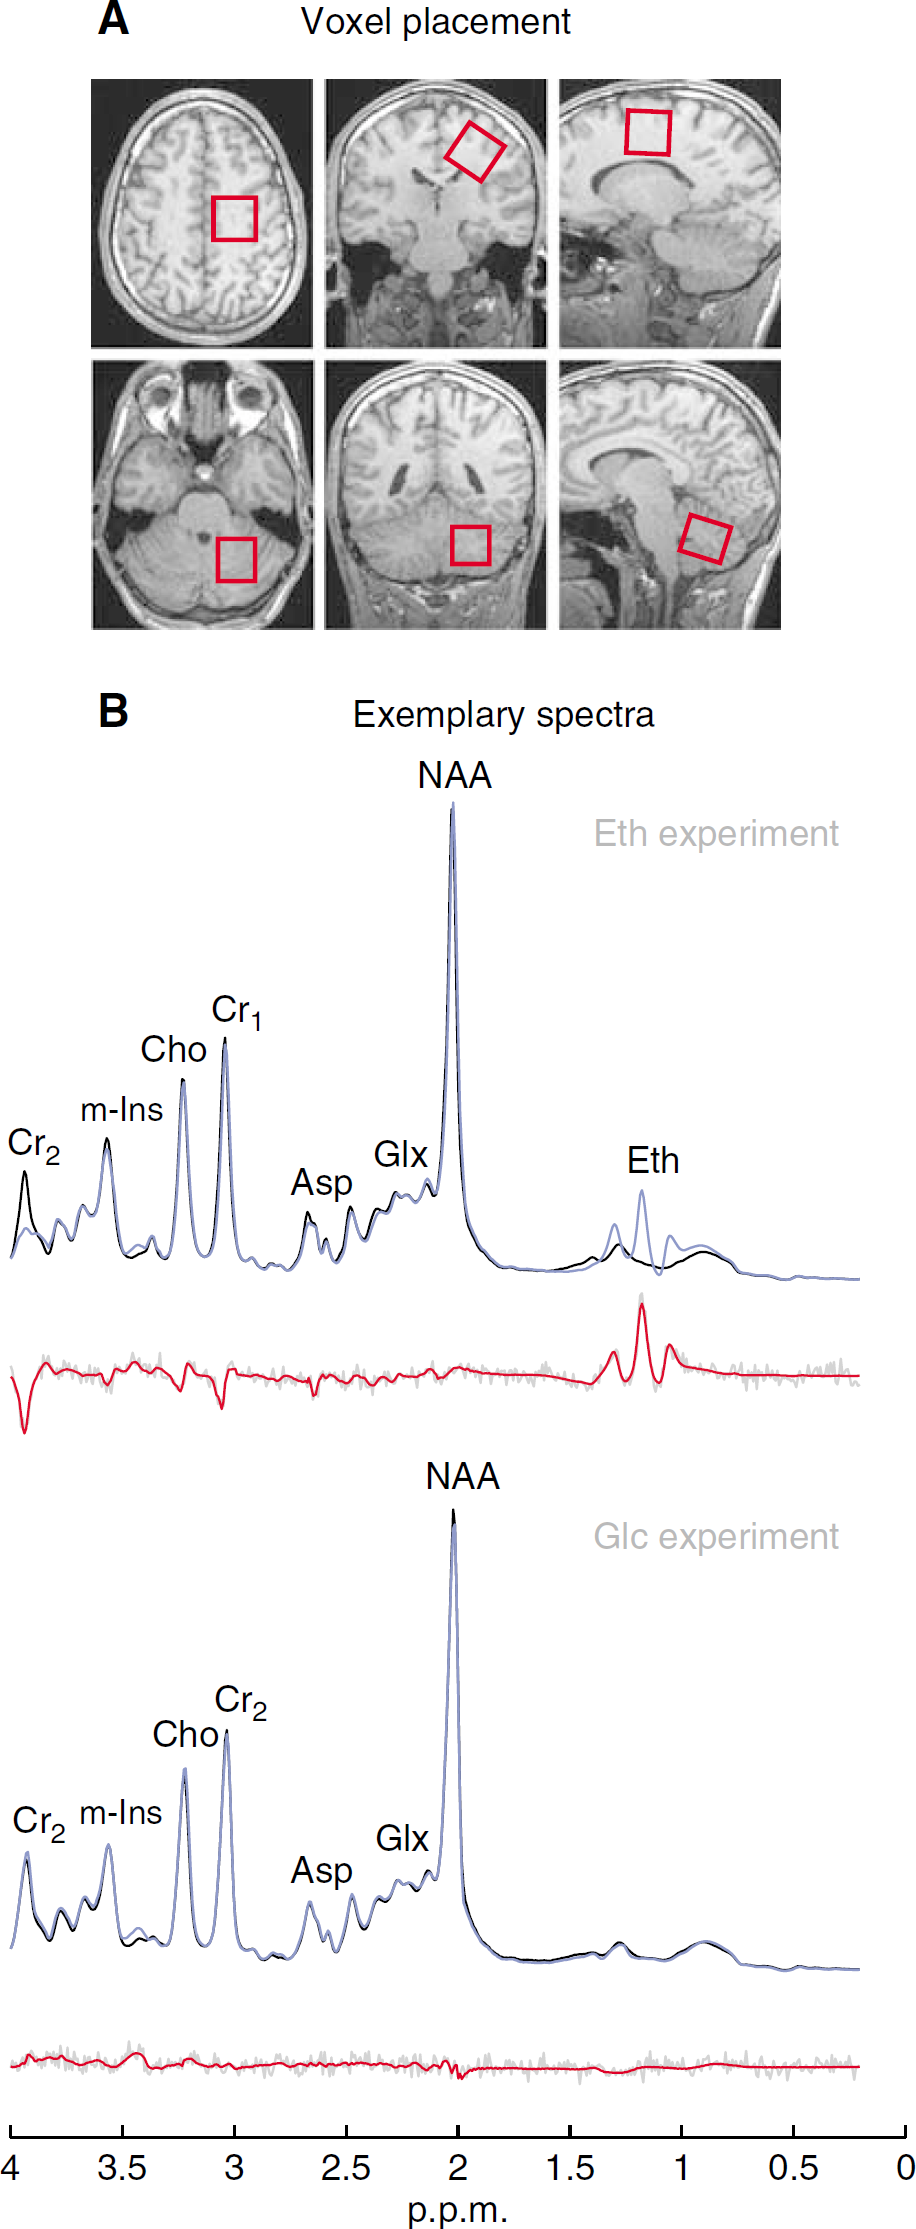
Voxel placement (
Protocol
For both experiments, detailed temporal information of infratentorial and supratentorial data acquisition is available (Supplementary Offset Table).
Spectral Analysis
For 1H-MR spectral analysis, the user-independent frequency-domain fitting routine by LCModel (version 6.1–4/LCMgui version 2.1–4) (Provencher 1993) was used. LCModel analyses
For fitting macromolecular resonances, the LCModel method uses
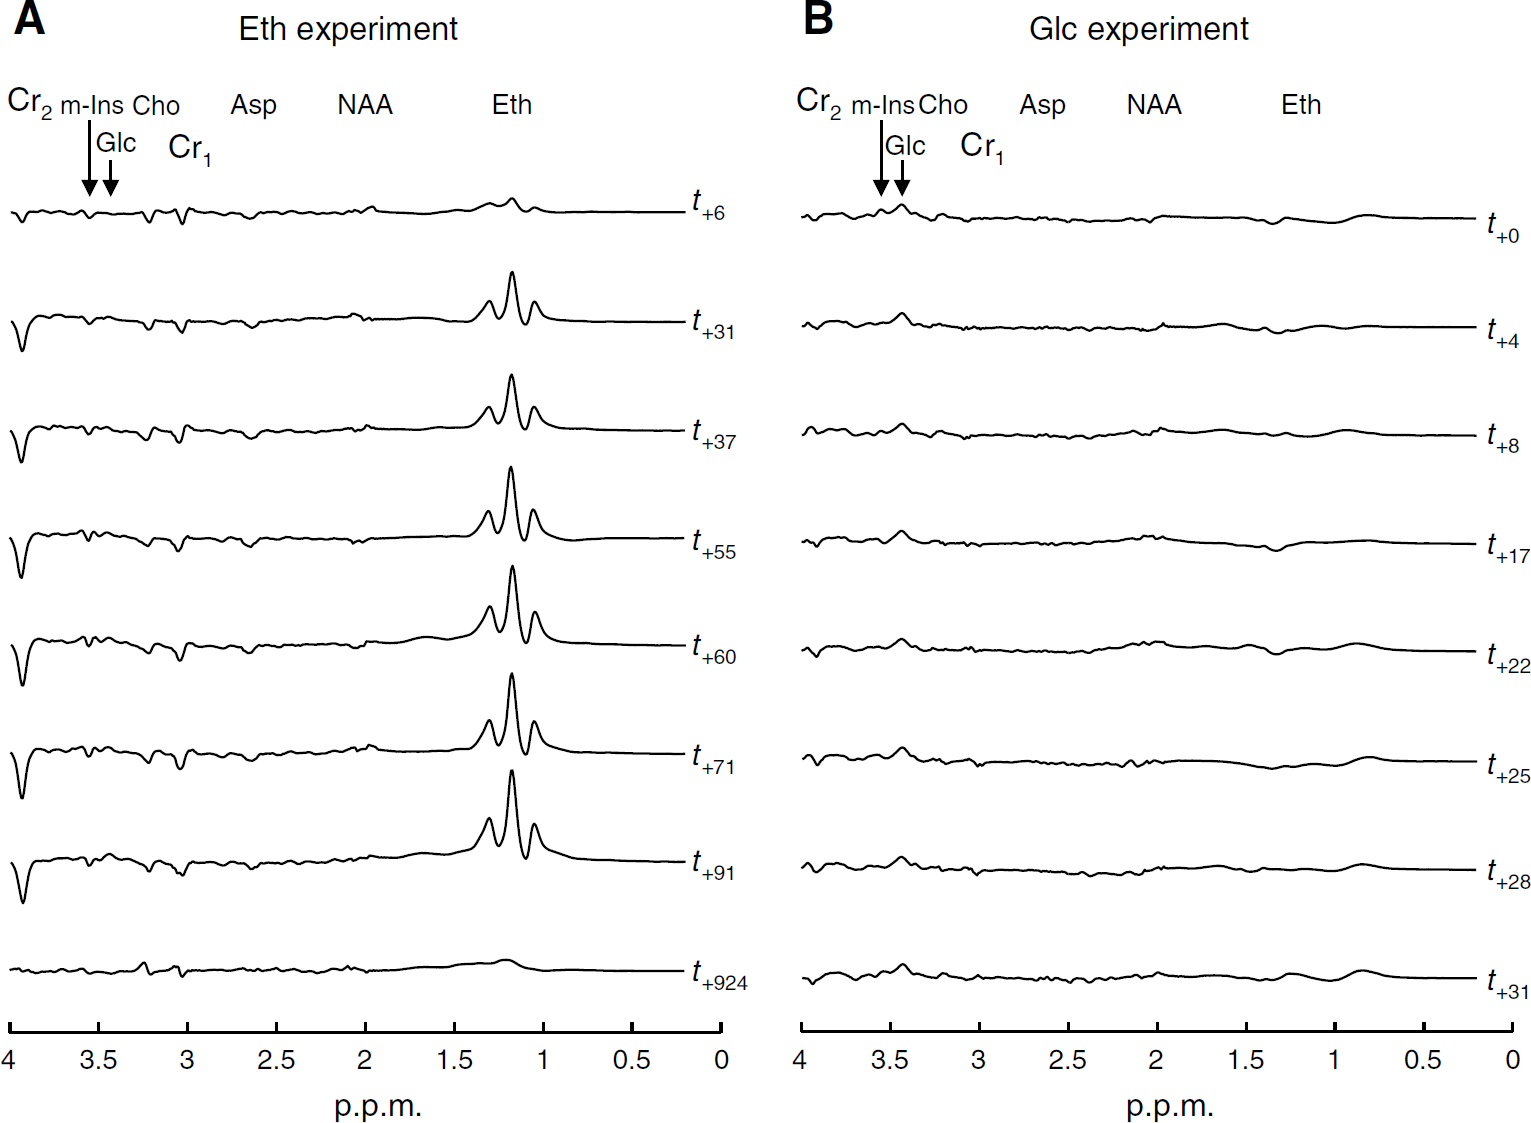
Difference spectra of the Eth (
Using complete spectra, rather than just single peaks, two metabolites with overlapping peaks at one chemical shift can still be resolved by the LCModel method if they have different structures at other chemical shifts. In LCModel, eddy current correction is performed in the time domain, dividing the water-suppressed signal by the phase factor of the water signal for each data point. To estimate metabolite concentrations, LCModel adjusts spectral measurements using the unsuppressed water reference signal (water scaling).
Spectral quality was assessed applying the following criteria as provided by LCModel output parameters: (i) the signal-to-noise ratio (S/N) (defined by the ratio of the maximum in the spectrum-minus-baseline over the analysis window to twice the root-mean-square residuals); (ii) the line width (roughly estimated through full width at half-maximum (FWHM, p.p.m. value); (iii) the distribution of residuals (characterizing the data fit); and (iv) standard deviations (s.d.) (representing the estimation errors in metabolite quantification). In LCModel, the s.d. estimates are Cramer-Rao lower bounds. Standard deviation > 50% indicate that the metabolite concentration may range from zero to twice the estimated concentration. Thus, for the Eth experiment, only spectra featuring (i) S/N > 4, (ii) FWHM ≤ 0.07p.p.m., (iii) randomly distributed residuals ~0 and (iv) s.d. < 25% were selected for further analysis. As parameter of interest in the Glc experiment, the quality criterion (iv) was not applied to the spectral data. Exemplary supratentorial 1H-MRS single-subject spectral data of the Eth and Glc experiments are shown in Figure 1B.
Statistical Analysis
Statistical data postprocessing encompassed the following subsequent analysis steps: (i) For each metabolite, concentration changes over time were tested for significance, using repeated measurements analyses of variance (rmANOVA). Thereafter, (ii) metabolite (met)-specific concentration time series (TSmet) were extracted over time and across subjects. Metabolites significantly changing in concentration after
1H-MRS data were explored for gender differences in metabolite concentrations by unbalanced two-way ANOVAs, with replications and gender as factors. For spatial analysis of 1H-MRS signal, fronto-mesial and cerebellar S/N data were corrected for different voxel volume and analyzed by two-tailed Student's
The results of ANOVAs and regression analyses were conservatively adjusted for multiple comparisons by Bonferroni correction. For statistical inferences as performed in this study,
Results
Signal-to-Noise Ratio
Corrected for different voxel sizes, supratentorial S/N data (21.44 ± 3.58) were higher than infratentorial S/N ratios (12.52 ± 2.98) (
Gender Difference
There were no differences in infratentorial and supratentorial metabolite concentrations between female and male subjects, that is, no gender difference of Eth effects in the brain parenchyma.
Ethanol
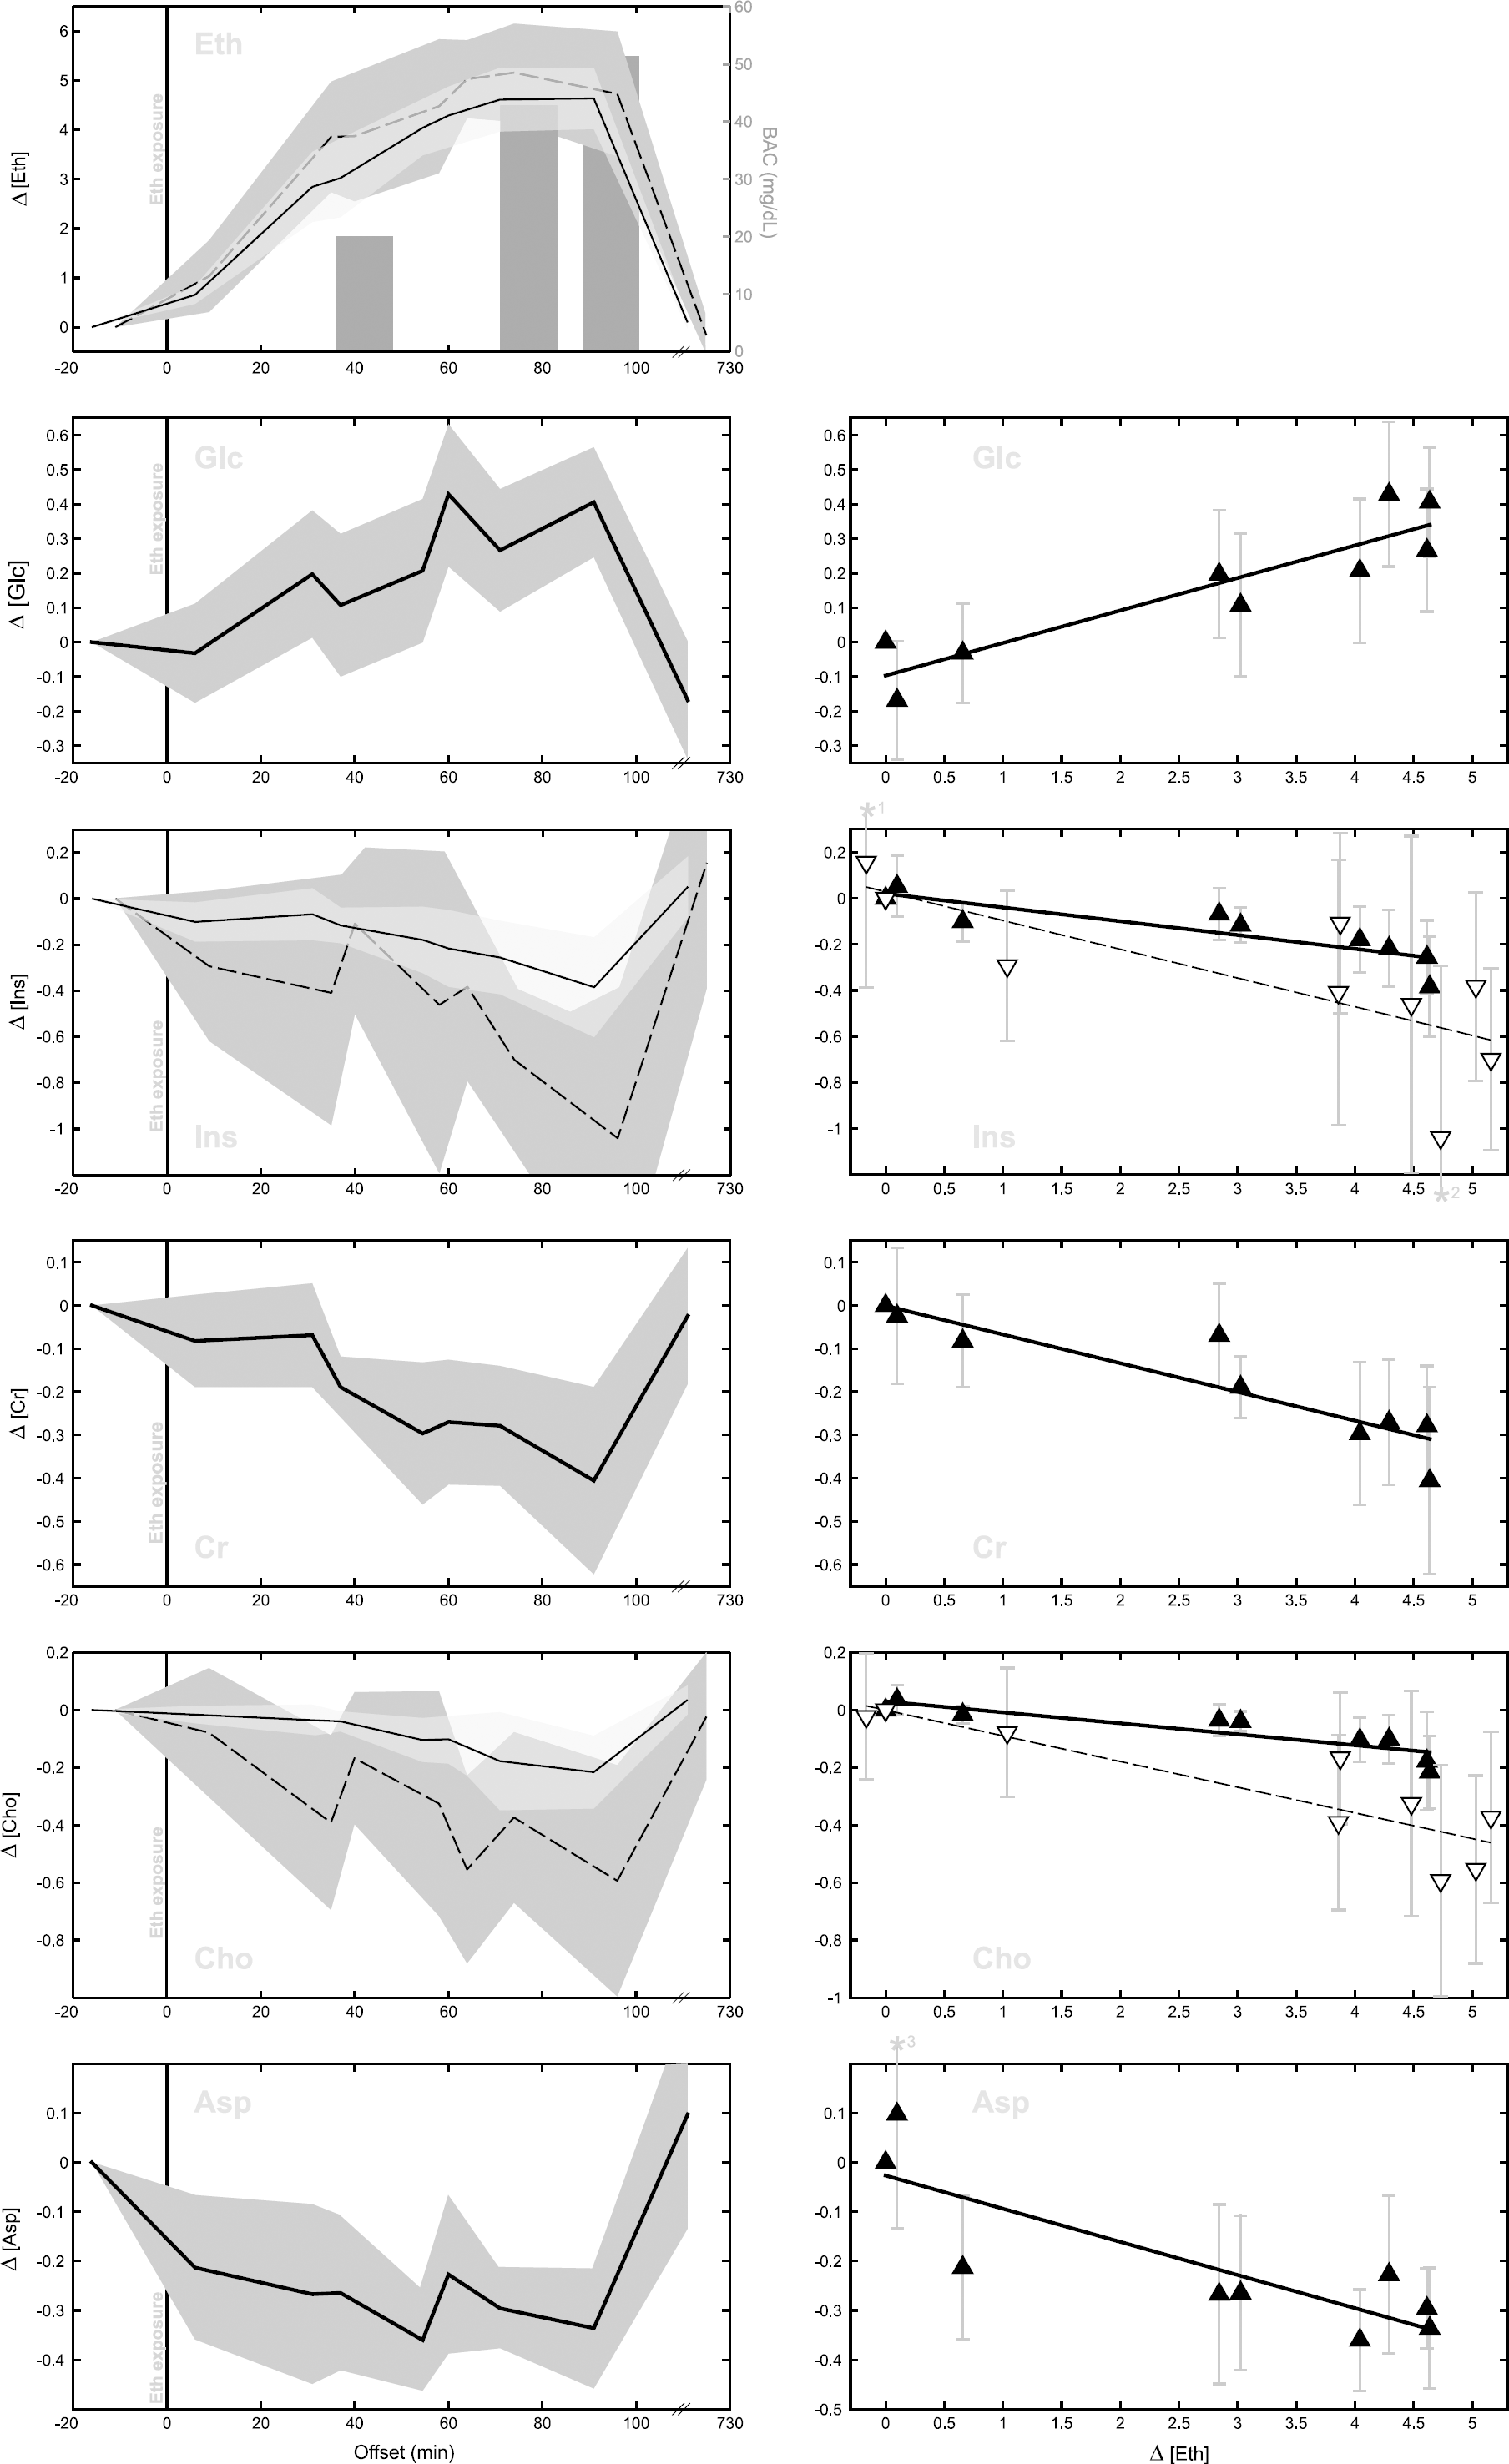
At 1.19 p.p.m., the main resonance of the Eth triplet was detectable at 5.79 ± 2.94 and 8.64 ± 2.98 mins after alcohol exposure for supratentorial and infratentorial data, respectively (Figure 3). Ethanol concentrations culminated in 91.14 ± 11.69 mins (fronto-mesial parenchyma) and 74.43 ± 5.58 mins (cerebellar parenchyma) after alcohol exposure. Blood alcohol concentration measurements (mean peak BAC: 51.43 ± 10.27 mg/dL at 93.71 ± 11.27 mins after Eth exposure) correlated well with supratentorial TSEth (
Eth and cerebral metabolites.
Repeated measurements ANOVA of supratentorial and infratentorial metabolite concentrations
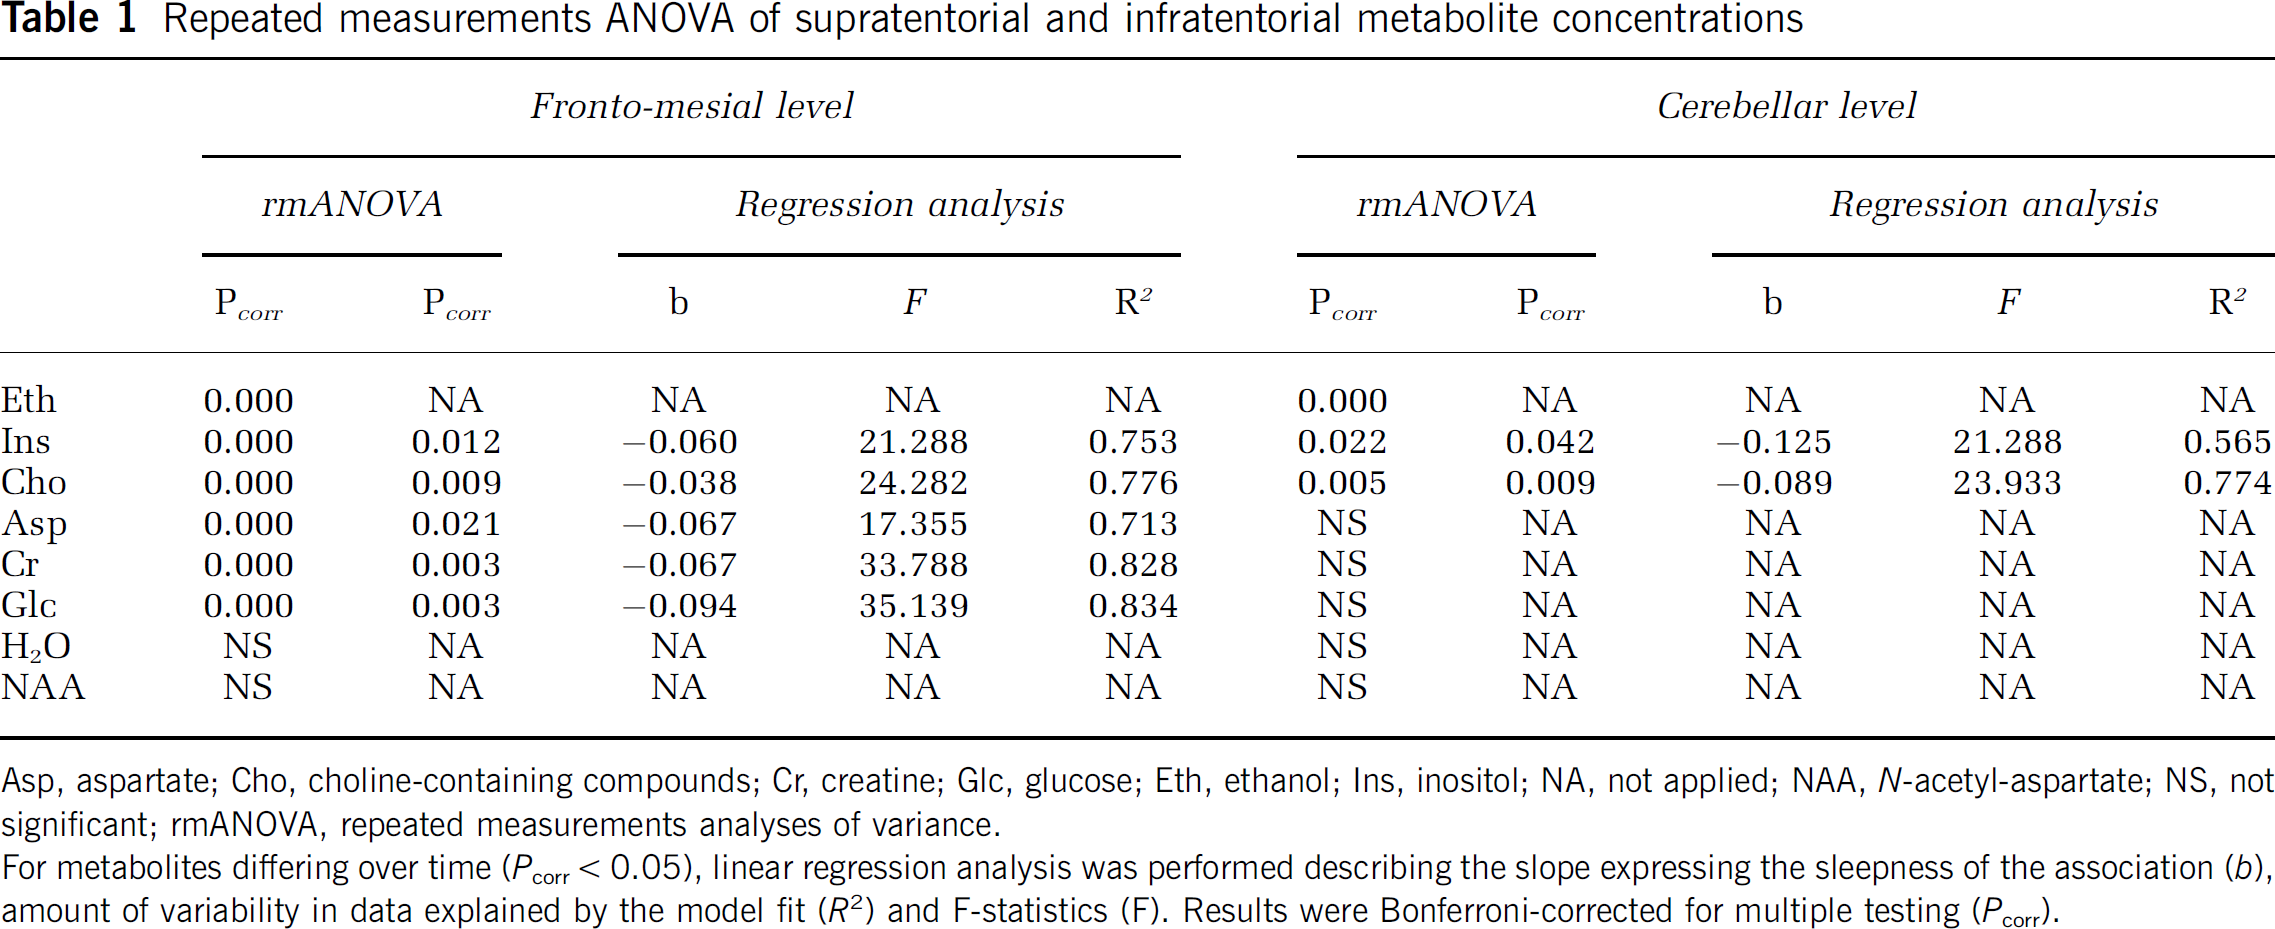
Asp, aspartate; Cho, choline-containing compounds; Cr, creatine; Glc, glucose; Eth, ethanol; Ins, inositol; NA, not applied; NAA,
For metabolites differing over time (
Glucose
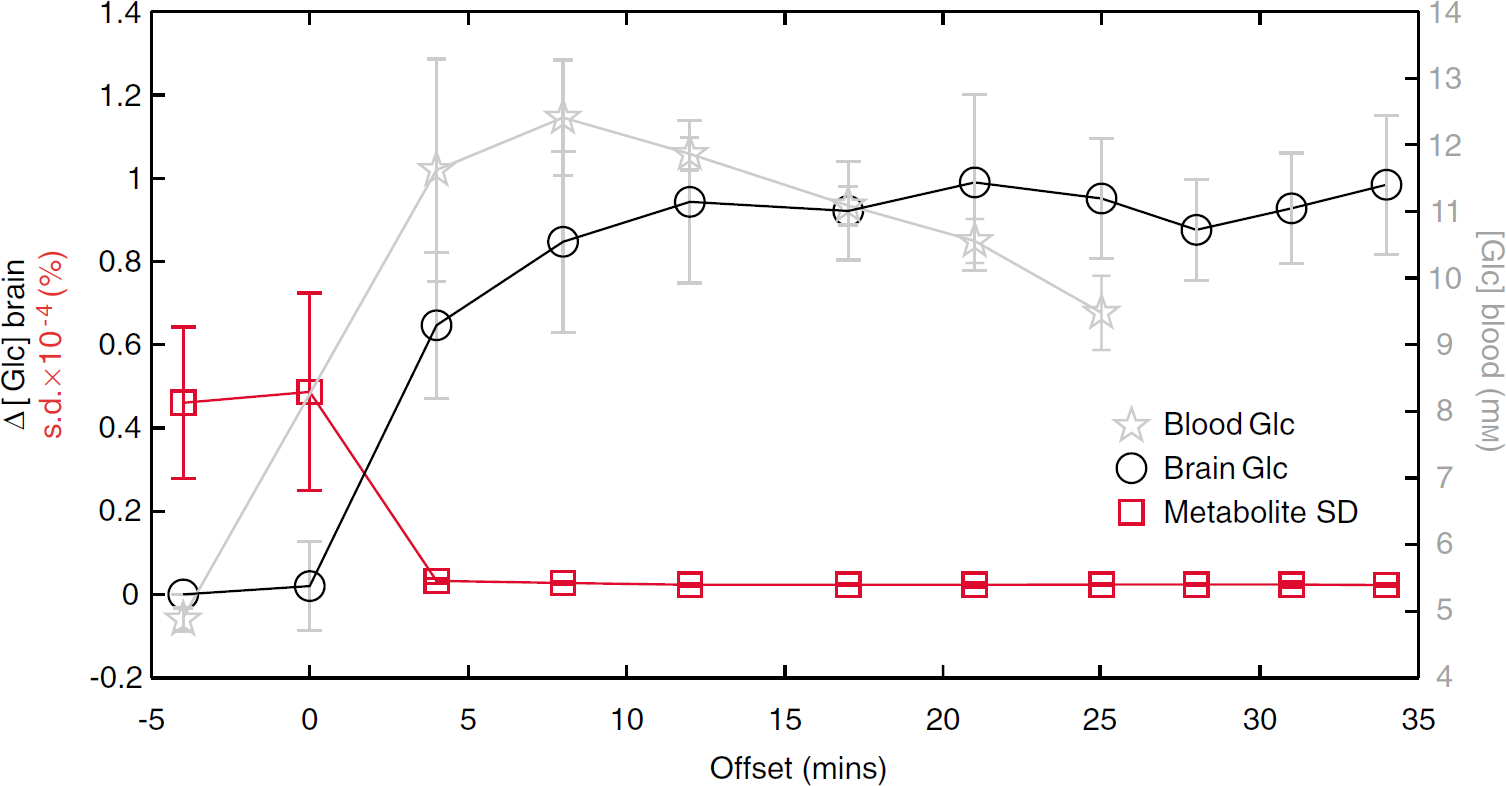
Glucose (Glc experiment). Fronto-mesial Glc levels (○) differed over time after glucose infusion (
Importantly, cerebral pGlc and Glc resonances peaked at 3.43 p.p.m. and could be resolved in both experiments even at a single subject level (Figure 1B). Figure 2 shows the mean data fits of difference spectra, as assessed in the Eth (Figure 2A) and Glc (Figure 2B) experiments.
Thus, the Glc experiment provides strong evidence for Glc to having originated the resonance peaks at 3.43 p.p.m., as detected in the Eth experiment. Most probably, Glc and pGlc are identical.
Aspartate
After the Eth application, rmANOVA yielded significant changes in supratentorial Asp concentration (
Inositol
For Ins, metabolite concentration of the fronto-mesial as well as the cerebellar parenchyma changed over time after Eth ingestion (rmANOVA, supratentorial
Choline-Containing Compounds
After Eth exposure, Cho concentrations changed in the supratentorial (rmANOVA,
Creatine
Upon Eth application, supratentorial Cr levels changed over time (rmANOVA,
N-Acetyl-Aspartate
For NAA, rmANOVA revealed no changes in concentrations of the fronto-mesial and cerebellar parenchyma over time after standardized Eth exposure (Table 1).
Water
There were no changes of mean supratentorial or infratentorial parenchymal water content over time, as determined by the integral of unsuppressed water within the corresponding voxel of interest after Eth ingestion (Table 1, Figure 5).
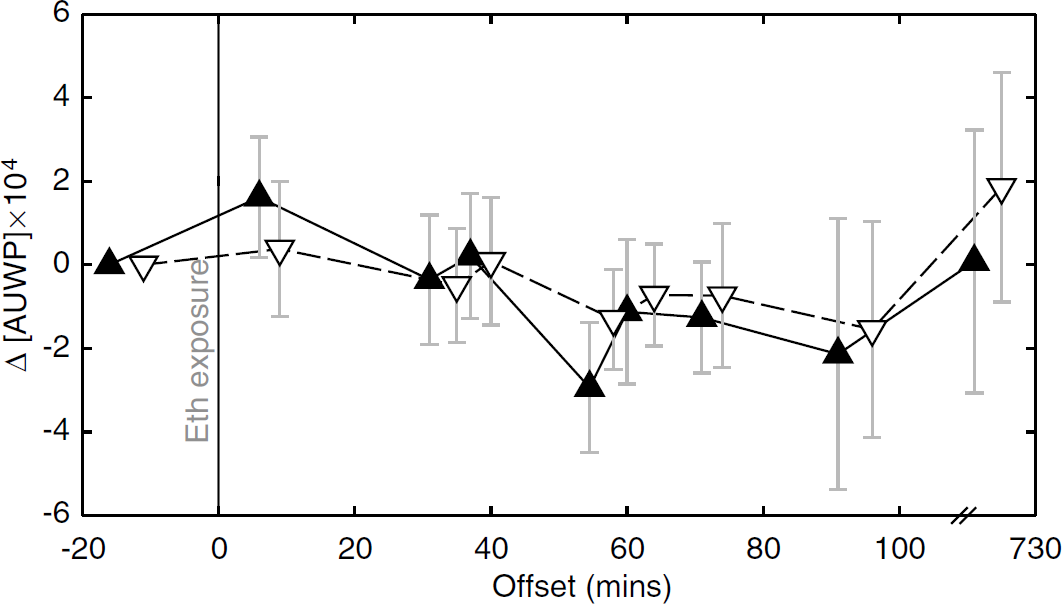
Water integrals. Upon Eth ingestion, changes in the supratentorial (solid line) and infratentorial (dashed line) areas under unsupressed water peaks (Δ[AUWP]) were not significant; s.d. are depicted as error bars.
Discussion
Not addressed by longitudinal 1H-MRS experiments yet, the principal goal of this study was to characterize human brain metabolites
Characterizing metabolite signal changes in the setting of our study, it is important to note that T1 relaxation effects cannot be ruled out. Subsequently, spectral data fits of the CH2 Eth group might be distorted due to an imperfect estimation of the CH3 moiety. As a consequence, the fit of adjacent metabolite resonances might be affected and a systematic error may be introduced. However, all metabolite concentration time series are based on difference spectra, that is, on changes relative to metabolite baseline values. Therefore, inference on the qualitative nature of metabolite changes ought to be valid, but interpretation in terms of absolute concentrations may not and are avoided.
Shortly after ingestion, Eth impact on brain physiology resulted in significant metabolite concentration changes of supratentorial Cr, Ins, Cho, Glc and Asp. Moreover, TSmet of these metabolites correlated with supratentorial TSEth. Infratentorially, Eth significantly affected cerebellar Ins and Cho levels. Here, their concentration time series correlated with Eth levels over time as well. All Eth-induced changes of brain metabolites were fully reversible.
On average, Eth was detected first at 5.79 and 8.64 mins upon
In agreement with earlier studies (Fein and Meyerhoff 2000; Mendelson et al, 1990), supratentorial and infratentorial TSEth significantly paralleled BAC levels, underlining the high sensitivity and specificity of our 1H-MRS measurements.
Considerable differences in supratentorial and infratentorial S/N values (corrected for different voxel sizes) cast doubt on the comparability of fronto-mesial and cerebellar absolute metabolite values. However, statistic analyses revealed no difference in fronto-mesial and cerebellar metabolite levels. This finding indicates similar supratentorial and infratentorial metabolite kinetics after
Ethanol and Alternative Energy Substrate Utilization
In principle, cerebral Eth can be enzymatically metabolized to acetaldehyde by catalase (Zimatkin and Buben 2007) or cytochrome P4502E1 (Upadhya et al, 2000). However, contribution of alcohol dehydrogenase to Eth metabolism in the brain is still unclear (Deitrich et al, 2006). Acetaldehyde is metabolized to acetate (Act) by aldehyde dehydrogenase (Erwin and Deitrich, 1966) in the brain. Outside the brain, Act is converted into acetyl-CoA by liver enzymes. Producing Act, Eth decomposition presents an alternative cerebral energy substrate to Glc. For energy utilization, brain cells are able to quickly adapt to Act (Waniewski and Martin, 1998). A modified monocarboxylate (MCT; ketone bodies, lactate, pyruvate) compartmentation model of neurons and astrocytes may explain the physiologic underpinnings of an alternative energy substrate utilization upon Eth exposure. The
Although challenging, 1H-MRS detection of Glc at 1.5 T is possible, in particular if the physiologic metabolite equilibrium is altered, for example, by an exogenic substance such as Eth. However, working on difference spectra, this study characterizes relative metabolite changes rather than absolute values upon alcohol consumption.
At low field strength, the complex multiplet Glc spectrum collapses into two multiplets centered at 3.43 and 3.8 p.p.m. (Govindaraju et al, 2000). In contrast to the Glc multiplet peaking at 3.43 p.p.m., the moiety resonating at 3.8 p.p.m. is not amenable to visual inspection of spectral data because of strong overlapping with other metabolite signals
Consistent with the idea of a
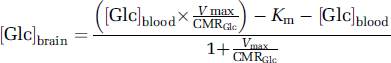
physiologic underpinnings of our findings, assuming stable transport kinetics for cerebral Glc and constant global energy demands of the brain in the presence of Eth. Corresponding to Equation (1), an increase of, for example, 50% in brain Glc ([Glc]brain) is associated with a decrease of ~25% in brain Glc consumption (Michaelis-Menten constant
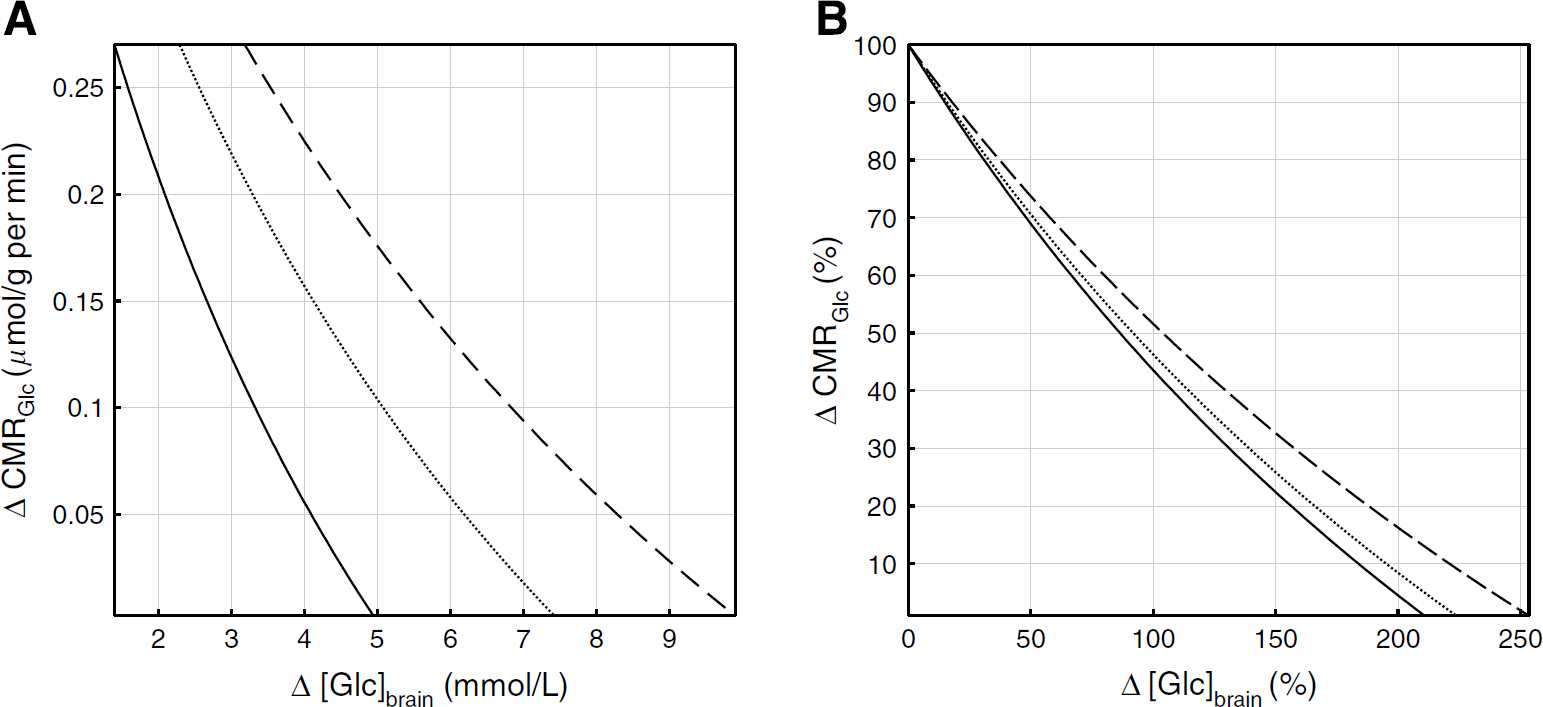
Relation between cerebral metabolic utilization rate of Glc (CMRGlc) and brain Glc concentration [Glc]brain. Absolute (
Thus, in accordance with the reversible Michaelis-Menten transport model, accumulation of cerebral Glc subsequent to Eth ingestion seems to correspond to a decrease in cerebral Glc consumption, for example, explained by the
Please note that as Eth ingestion is known to lower blood Glc levels (Huang and Sjoholm, 2008), increased
Ethanol and Oxidative Stress
In the brain, decomposition of Eth to Act results in NADH+ accumulation. Presented to mitochondrial metabolism, NADH+ can be metabolized to NAD+ for cytosolic replenishment and thus stable redox potentials. The essential NAD+ transport system into the mitochondrion is the malate-aspartate shuttle (MAS). As a critical part of the MAS (McKenna et al, 2006), transaminase reactions between Asp and glutamate, which result in reduced Asp levels, characterize an increased flux through the MAS (Mangia et al, 2007), that is, activation. Spectroscopic assessment of Asp at 1.5 T, as performed in our study, is sophisticated and quantitative statements in absolute terms are not possible. Therefore, the description of Asp signal changes is only qualitative, in that TSAsp and TSEth are negatively associated. Consistent with the metabolite interactions described by the MAS model, negatively correlated TSEth and TSAsp would indirectly reflect Eth-induced accumulation of NADH+ and the subsequent need for mitochondrial reoxidation of NADH+ to NAD+ to grant stable redox potentials.
Thus, in line with other reports (Chen et al, 2008), the
Ethanol and Cerebral Vulnerability
As part of the high-energy metabolism in the cytosol of neurons and glia, Cr is reversibly phosphorylated to phosphocreatine (PCr) in the equilibrium reaction, Cr + ATP ↔ PCr + ADP + H, which is enzymatically catalyzed by Cr kinase (Wyss and Kaddurah-Daouk, 2000). This reaction is considered essential for temporal buffering of high-energy phosphates and pH, which is necessary for proper cell functioning. Using 1H-MRS, Cr and PCr resonance peaks cannot be sufficiently resolved. Creatine as referred to here means total Cr comprising both Cr and PCr. Therefore, results of this study grant no detailed insight into the Cr/PCr equilibrium reaction. However, in contrast to recent animal studies on acute Eth effects (Adalsteinsson et al, 2006; Braunova et al, 2000; Hirakawa et al, 1994; Lee et al, 2003), results of our study provide important evidence for Eth to affect Cr. As reviewed in detail (Wyss and Kaddurah-Daouk, 2000), there is ample evidence for neuroprotective effects of Cr. For example, there is evidence for Cr to protect against free radical generation and to regulate a mitochondrial protein complex, which is implicated in cell death (O'Gorman et al, 1997). Vice versa, the absence of Cr implies greater possibility of neuronal damage in case of hypoxia, oxidative stress conditions (Carter et al, 1995) or neurodegenerative diseases (Smith et al, 1995). In this context, a negative correlation of TSEth and TSCr, that is reduced Cr levels after
Ethanol and Water Shift
As an organic osmolyte, neuroglial Ins serves as a regulatory component for the maintenance of constant cell volume (Wolfson et al, 2000). As phosphorylated derivative, Ins is additionally involved in neuronal receptor messenger systems (Downes and Macphee, 1990). However, Ins moieties contributing to the second messenger system are most probably far too small for spectroscopic
Prevention of Eth-induced cell swelling by transmembrane Ins flux mediated through volume-sensitive organic osmolyte channels (Fisher et al, 2002) might result in excessive substrate consumption and consequently lead to decreased Ins levels (Braunova et al, 2000). In agreement with this rationale, a negative correlation of TSEth and TSIns suggests successful osmotic regulation, because there was no difference in brain water content before and upon Eth ingestion. Vice versa, maintenance of equilibrated cerebral water indicates that metabolite level changes after
Ethanol and Membrane Modifications
Using 1H-MRS, Cho resonance peaking at 3.2 p.p.m. is mainly composed of PC and GPC with minor contributions from free choline (Boulanger et al, 2000). Phosphocholine and GPC resonance peaks cannot be resolved by 1H-MRS. Therefore, PC, GPC and free choline are referred to as Cho, which is substrate for the synthesis of cell membranes and neurotransmitters (Cousins, 1995) and highly concentrated in glial cells (Urenjak et al, 1993). Thus, Eth-induced negative correlation of TSEth and TSCho can theoretically reflect changes in membrane turnover. Supporting our findings, decreasing Cho levels have been shown in the rat brain after Eth application (Adalsteinsson et al, 2006). Vice versa, longitudinal studies on detoxified alcohol-dependent subjects revealed increasing Cho levels (Bartsch et al, 2007; Bendszus et al, 2001; Ende et al, 2005) after initially reduced concentrations (Bendszus et al, 2001; Ende et al, 2005). Our findings suggest a parallel between acute Eth effects on Cho and Cho changes in alcohol-dependent subjects upon detoxification: In both cases, Cho concentrations initially declined and gradually recovered. Thus, Eth seems to trigger reversible membrane modifications even in healthy subjects shortly upon alcohol exposure, whereas cell membrane alterations in alcohol-dependent subjects prevail and persist until detoxification.
Ethanol and Neuronal Integrity
NAA is present in neurons, neuroglial precursors and immature oligodendrocytes, and absent in mature glial cells (Urenjak et al, 1993). There is a positive correlation between cerebral NAA concentration and neuronal density and viability (Miller, 1991). Thus, NAA is regarded as a neuronal marker, and decreased NAA concentrations are considered indicative of neuronal loss or dysfunction. In line with longitudinal animal studies (Adalsteinsson et al, 2006; Braunova et al, 2000), our study provides no evidence for Eth to affect NAA shortly after
Creatine and Metabolite Ratios
Considering it a stable metabolite, many studies apply Cr as reference for relative metabolite quantification. Noteworthy, this method is adopted by many 1H-MRS studies on Eth effects. Importantly, using metabolite ratios for quantification without definite
In summary, this study longitudinally characterized the acute effects of a single Eth exposure on human brain metabolism by 1H-MRS. Findings indicate adaptation to alternative energy substrate usage, elevation of oxidative stress level and cerebral vulnerability and alterations of cell membranes shortly after alcohol ingestion. There was no evidence for changes in neuronal integrity and brain water content after Eth consumption.
Future longitudinal MR studies are needed to further unravel the biochemical underpinnings of how Eth affects the human brain metabolism. For example, characterization of the Cr/PCr equilibrium reaction by phosphorous MRS might yield crucial information about the impact of Eth on cerebral high-energy metabolism and the neurotoxic effects of Eth on the brain. Besides contributing to the MAS transaminase reaction, description of glutamate by 1H-MRS using field strengths higher than 1.5 T might grant a more detailed insight into the concept of Eth as oxidative stressor.
Our findings suggest that longitudinal MRS experiments offer an interface between metabolic mechanisms of the human brain and neuroimaging and thus might broaden our understanding of cellular processes
Footnotes
Acknowledgements
We are extremely grateful to Stephen Provencher (Ontario, Canada) and Thomas Neuberger (Pennsylvania, USA) for advice on calibration measurements and implementation of Eth into the basis set. Sabine Heiland (Heidelberg, Germany) and Dieter J Meyerhoff (San Francisco, USA) deserve our special thanks for very helpful discussions on quality assurance of spectral data and the MRS detection of glucose at low field strengths.
The authors declare no conflict of interest.