361. Determination of Bmax and Kd in Non-human primates using [11C]GR103545, an agonist pet tracer for the kappa opioid receptors
G. Tomasi1, N. Nabulsi1, D. Weinzimmer1, M.-Q. Zeng1, L. Blumberg2, C. Brown-Proctor2, Y.-S. Ding1, R.E. Carson1 and Y. Huang1
1Yale University PET Center, New Haven; 2Pfizer, Inc., Groton, Connecticut, USA
Objectives: The k-opioid receptors are involved in depression and other mood disorders, as well as in dependency conditions such as obesity, alcoholism, heroin and cocaine abuse, but, despite their importance, they have not been systematically analyzed with PET. We employed a recently developed selective k agonist tracer ([11C]GR103545,1), and performed a Scatchard study in rhesus monkeys with multiple tracer infusions to estimate the in vivo receptor concentration Bmax and the dissociation constant Kd.
Methods: Three rhesus monkeys were employed in the study, performed with the Focus 220: 2 of them underwent 2 scans (baseline+self-block), the third was scanned 4 times (2 baseline and 2 self-block scans at different occupancy levels). The injected mass was 0.042±0.014 μg/kg for baseline and ranged from 0.17 to 0.3 μg/kg for the self-block studies. A Bolus+Infusion (B+I) protocol was employed with Kbol ranging from 100 to 200 mins, and the cerebellum was used as reference region. Scan duration was 120 mins. BPND of all ROIs was computed as [(CROI/CCEREB)−1], CROI and CCEREB being the mean of the measured radioactivity concentrations from 90 to 120 mins in a given ROI and in the cerebellum, respectively. In 4 of the 8 scans, plasma input functions were measured and a 2-tissue model was used to compute the volume of distribution in the cerebellum VT,CEREB, which was used to estimate the free to non-displaceable concentration ratio at equilibrium fND as fP/VT,CEREB. A standard Scatchard plot was used to estimate Bmax and Kd,ND = Kd/fND. When Kd,ND was allowed to vary among ROIs, results were very variable; therefore Kd,ND was constrained to be constant across ROIs.
Results: In all cases, a reasonable equilibrium was achieved from 90 to 120 mins. Table 1 reports Bmax estimates; the global Kd,ND was estimated to be 5.83 nmol/L. Kd,ND was alternatively computed for each ROI as (Bmax/BPND BASEL) (fourth row of Table 1), BPND BASEL being the mean across the 4 baseline scans. The mean and median of these estimates were 6.12 and 5.78 nmol/L, respectively, in very good agreement with the common global estimate of 5.83 nmol/L. In addition, Kd, computed as Kd,NDfND, was 0.16 nmol/L, in good agreement with the in vitro Ki value of 0.33 nmol/L. Percentage standard errors (%s.e.) were high (>100%), partly due to large intersubject variability.
ROI
Brain-stem
Cingulate
Frontal cortex
Globus pallidus
Insula
Occipital cortex
Putamen
Temporal cortex
Thalamus
Bmax (nmol/L)
2.7
7.4
3.8
8.2
7.5
2.7
15.1
3.9
2.8
BPND,BASEL ±s.d.
0.3±0.2
1.3±0.3
0.7±0.2
1.3±0.4
1.3±0.2
0.5±0.2
2.2±0.8
0.5±0.1
0.7±0.1
Kd,ND (nmol/L) = Bmax/BPND
7.6
5.6
5.5
6.4
5.6
5.8
6.9
5.8
5.9
Conclusions: Use of a B+I protocol with the k-opioid receptor agonist tracer [11C]GR103545 permitted the successful estimation of Bmax and Kd,NDin vivo. The estimated value of 5.83 nmol/L for Kd,ND was in good agreement with the in vitro measurement.
438. Adaptive optimal design in pet occupancy studies
S. Zamuner1, V.L. Di Iorio1, J. Nyberg2, R.N. Gunn3,4, V.J. Cunningham3, R. Gomeni1 and A.C. Hooker2
1Clinical Pharmacology Modelling & Simulation, Glaxosmithkline, Verona, Italy; 2Division of Pharmacokinetics and Drug Therapy, Department of Pharmaceutical Biosciences, Uppsala University, Uppsala, Sweden; 3GlaxoSmithKline Clinical Imaging Centre, Imperial College—London, London; 4Department of Engineering Science, University of Oxford, Oxford, UK
Objectives: The integration of positron emission tomography (PET) occupancy studies into clinical drug development plans provides a valuable tool for dose selection and optimization in man by accurately characterising the relationship between the time-course of plasma drug (PK) concentration and target receptor occupancy (RO).1
PET studies are typically conducted using a sequential adaptive design. An initial cohort of subjects is treated with an initial dose with scan times usually targeting the maximal plasma concentration and/or a lower concentration. The decision on sample size, dose and scan times for subsequent cohorts is derived from the analysis of previous data. The selection of informative doses and scan times remain critical issues for a precise and accurate characterization of the PK-RO relationship.
The purpose of this work is to define and evaluate the benefit of an adaptive-optimal PET experiment strategy for the selection of PET scan times and doses, over and above traditional PET study designs using simulated experimental data.
Methods: A population kon-koff model relating the plasma concentration of the drug and the PET binding potential (BP) was applied to generate the simulated data. Twelve subjects were considered and designs with 3, 4, and 6 adaptive steps were investigated. BP time-course data were simulated from the following designs: fixed designs (sampling schedule fixed at baseline, tmax and 24 h post-dose), educated designs where sampling schedule was selected from an independent expert, and optimal designs. One hundred studies per design were simulated to test the performance of the adaptive/optimal algorithm.
In the proposed adaptive/optimal algorithm, dose and PET sampling times for the first cohort were fixed. This information was used to estimate the model parameter values. These values were used to select doses and PET scan times in the next cohort. For each subsequent cohort data from all previous cohorts were used as prior information to select doses and PET scan times.
Optimization was performed for two scenarios; scanning time only and scanning time and dose using a D-optimality criterion as implemented in the PopED software.2
Results: A clear improvement in terms of bias (SME), precision (CV) and accuracy (RMSE) of the population estimates (kon and koff) was found when comparing fixed versus educated versus optimal designs. Unbiased mean estimates were found for the optimal designs; a great improvement in accuracy was found when comparing optimal versus fixed designs (25 to 30 fold) and still a significant improvement was found when comparing optimal versus educated designs (2 to 3 fold). Optimisation over both sampling times and doses compared with optimisation over only sample times provided slight improvements in accuracy and precision when the initial dose selection was not informative about the receptor binding time course.
Conclusions: These results indicate that adaptive optimal design of PET occupancy studies provides a reliable strategy for study design by optimally selecting doses and scan times which then allow for a more accurate assessment of the pk-occupancy relationship.
37. Modeling of brain NK1 receptor binding-plasma concentration relationship with a novel NK1 antagonist
S. Zamuner1, E.A. Rabiner2, S.A. Fernandes3, R.N. Gunn2,4, R. Gomeni1 and V.J. Cunningham2
1Clinical Pharmacology Modelling & Simulation, GlaxoSmithKline, Verona, Italy; 2GlaxoSmithKline Clinical Imaging Centre, Imperial College, London, UK; 3Discovery Medicine, Neurosciences Centre for Excellence in Drug Discovery, GlaxoSmithKline, Verona, Italy; 4Department of Engineering Science, University of Oxford, Oxford, UK
Objectives: There is growing evidence of the importance of integrating drug receptor-occupancy (RO) data acquired by Positron Emission Tomography (PET) with the plasma pharmacokinetics (PK) of the drug, in order to establish optimal dose selection in subsequent clinical trials. The object of the present work was to develop such a PK-RO model in human subjects for Casopitant, a selective NK1 antagonist currently in development for prevention of chemotherapy-induced and postoperative nausea and vomiting. The relationship between individual plasma concentrations of Casopitant and its binding to receptors was investigated using a population approach applied to RO data from PET occupancy studies carried out with the radioligand and selective NK1 receptor antagonist, [11C]GR205171.
Methods: Eight adult healthy male volunteers entered and completed an [11C]GR205171 brain PET study to estimate the PK-RO relationship following oral doses of Casopitant. All subjects underwent a baseline scan and subsequently received a single dose of 2.5, 5, 20, 50, or 120 mg Casopitant, 24 h before a second PET scan. Compartmental models (described elsewhere) were applied to the PET data to obtain regional estimates of binding potential (BPND). RO in the presence of Casopitant was estimated from changes in BPND relative to the baseline scans. In order to estimate inter-subject variability on the baseline measurements, a population approach analysis using untransformed data (BPND) was performed.1 Moreover, all data were simultaneously fitted and potential differences in model parameters from different regions were considered including a within subject variability term. The population PK/PD analysis was performed using the non-linear mixed effect modelling approach as implemented in the NONMEM (version V) software.
Results: A population approach leading to a PK-RO model of the relationship between the plasma concentration of Casopitant and receptor binding parameters was successfully carried out. All data were fitted simultaneously and potential differences in model parameters from different regions were considered including a within subject variability term. The population estimate Casopitant plasma concentration leading to 50% of the maximal decrease of binding potential is approximately 0.6 ng/mL (median EC50 equal to 0.5 ng/mL in frontal and occipital cortex, 0.7 ng/mL in parietal and lateral temporal cortex, and 1 ng/mL in striatum). Casopitant plasma concentrations above 10 ng/mL produced RO above 90% and plasma concentrations above 20 ng/mL produced RO above 95%. Finally, considering that Casopitant has an accumulation ratio of approximately 2 to 3 folds at steady state, concentrations above 10 ng/mL at trough and RO above 90% in all brain regions can be achieved by doses of 5 to 10 mg, while RO above 95% can be achieved by doses of 15 to 30 mg.
Conclusions: A suitable integration of plasma and receptor occupancy data was successfully developed using a mixed effect approach. PK-RO model was also used to predict NK1 occupancy levels after Casopitant chronic treatment and for dose selection in subsequent clinical trials.
347. Parametric methods for quantification of [18F]FP-β-CIT studies
R. Kloet1, R. Boellaard1, M. Ponsen2, M. Yaqub1, B. van Berckel1, M. Lubberink1, B. Windhorst1, H. Berendse2 and A. Lammertsma1
1Nuclear Medicine & PET Research; 2Deparment of Neurology, VU University Medical Center, Amsterdam, The Netherlands
Purpose: [18F]FP-β-CIT is a high affinity dopamine transporter (DAT) radioligand, which is of interest for studying the pathophysiology of Parkinson's Disease (PD). Recently it was shown that the simplified reference tissue model (SRTM) is the optimal method for quantifying [18F]FP-β-CIT data.1 In this study performance of various SRTM based parametric methods and the impact of these methods on outcome of statistical parametric mapping (SPM) analysis were evaluated.
Methods: Dynamic 90 mins [18F]FP-β-CIT scans were performed in 7 healthy (HC) and 6 PD subjects. Parametric binding potential (BPND) images were generated using various methods, such as reference Logan (Rlogan),2 several multi-linear reference tissue methods without (MRTM0–2) and with (MRTM3,4)3 fixing reference region washout constant (k2′), receptor parametric mapping (RPM),4 and SUVr (60 to 90 mins) using cerebellum as reference region. Parametric methods were applied using different starting parameters, i.e. analysis starting time (t* = 2, 5, 20, 40, 50, 60 mins) for Rlogan and MRTM variations or starting exponential for RPM (0.01, 0.005, 0.0025 mins−1), in order to first optimize performance of each method. Next, average striatum BPND derived from parametric data were compared with those obtained using SRTM applied to striatum time activity curves. Finally, parametric images with the best correlation, both before and after additional 5 mm FWHM Gaussian (G5) smoothing were used within SPM to determine the optimal method for detecting differences in [18F]FP-β-CIT binding between HC and PD.
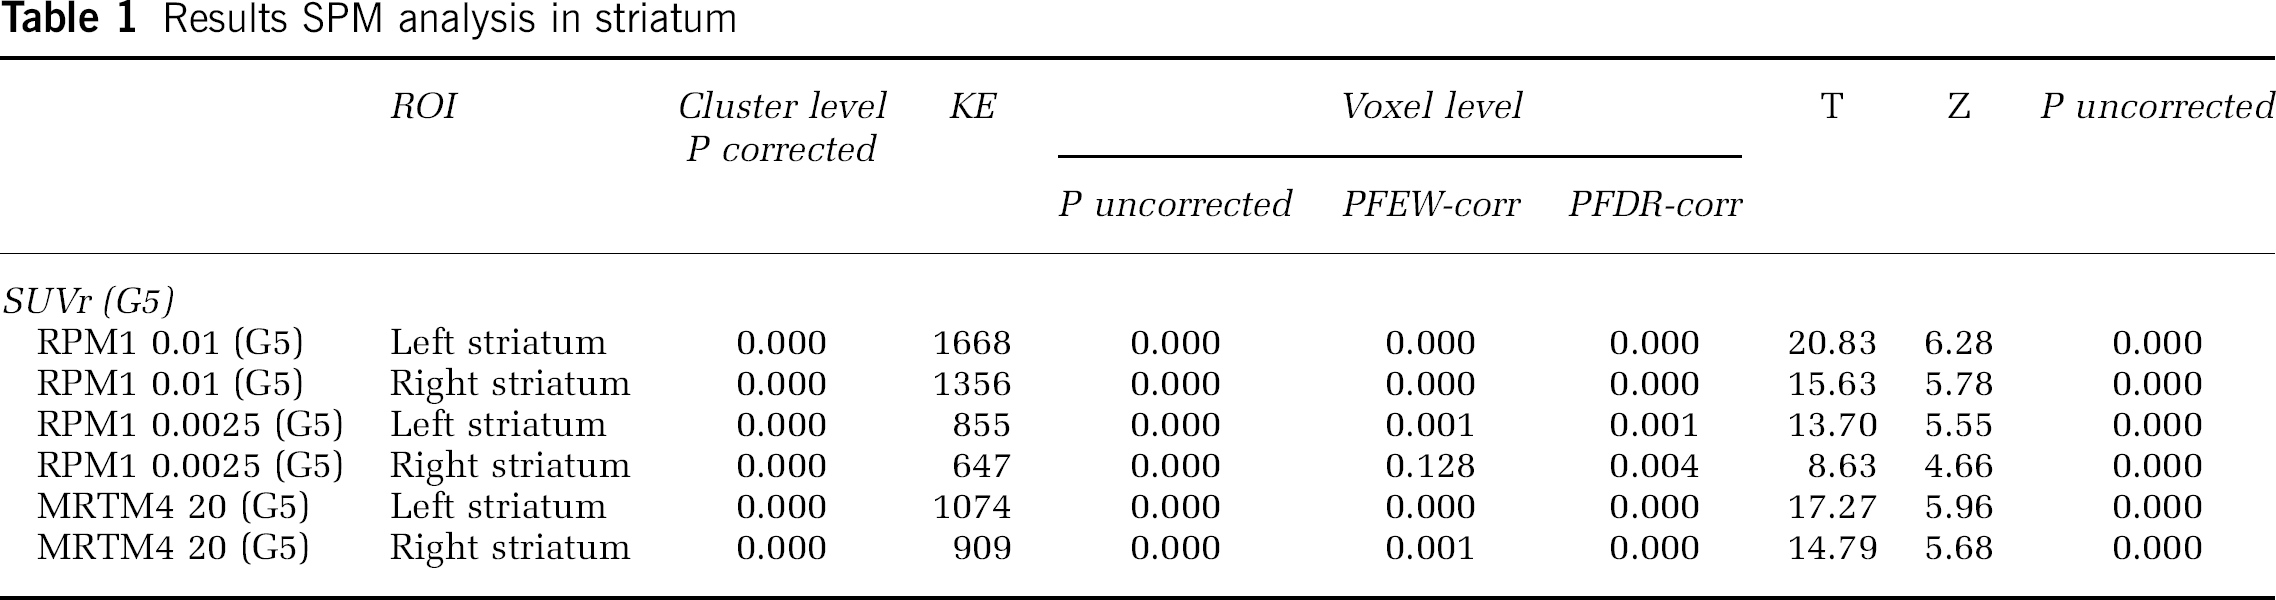
Results: MRTM4 (t* = 20 mins) and RPM (starting exponential = 0.0025 mins−1) showed best correlation (R2 = 0.92, slope = 0.87 and R2 = 0.92, slope = 0.90, respectively) of striatal BPND values with those obtained using SRTM. RPM (starting exponential = 0.01 mins−1) showed best image quality and good correlation with SRTM, but showed bias (R2 = 0.88, slope = 0.40). Poor performance was seen for all other linearized methods (R2<0.6) and they were discarded for further analysis. SPM using G5 smoothed RPM BPND images, especially for starting exponential = 0.01 mins−1, provided best differentiation between PD and HC. Surprisingly, it was hardly possible to detect any differences in binding between these subject groups when SUVr images were used in the SPM analysis (see Table 1).
Results SPM analysis in striatum
ROI
Cluster level P corrected
KE
Voxel level
T
Z
P uncorrected
P uncorrected
PFEW-corr
PFDR-corr
SUVr (G5)
RPM1 0.01 (G5)
Left striatum
0.000
1668
0.000
0.000
0.000
20.83
6.28
0.000
RPM1 0.01 (G5)
Right striatum
0.000
1356
0.000
0.000
0.000
15.63
5.78
0.000
RPM1 0.0025 (G5)
Left striatum
0.000
855
0.000
0.001
0.001
13.70
5.55
0.000
RPM1 0.0025 (G5)
Right striatum
0.000
647
0.000
0.128
0.004
8.63
4.66
0.000
MRTM4 20 (G5)
Left striatum
0.000
1074
0.000
0.000
0.000
17.27
5.96
0.000
MRTM4 20 (G5)
Right striatum
0.000
909
0.000
0.001
0.000
14.79
5.68
0.000
Conclusion: RPM outperformed all linearized methods investigated and is recommended for quantitative assessment of [18F]FP-β-CIT binding.
734. Maximum likelihood estimation of receptor occupancy in pet studies
G. Tomasi and RE Carson
Department of Diagnostic Radiology, Yale University, New Haven, Connecticut, USA
Objectives: In Positron Emission Tomography (PET), receptor occupancy r (0<r<1) is the fraction of the receptors occupied by an administered drug or by the tracer itself. Theoretically r should be uniform across region-of-interest (ROI), but in measured data, there is always variability. We compare here different methods for r estimation based on simulated data.
Methods: Let N be the number of ROIs and let BPi be any measure of the binding potential (BPND, BPP, BPF) at the ith ROI, either at baseline (BPBASEL,i) or in blocked condition (BPBLOCK,i). Let xi = BPBASEL,i, yi = BPBLOCK,I, and ri = (xi−yi)/xi, To compute the global r, 5 equations were considered:
[(Σxi)/N−(Σyi)/N]/[(Σxi)/N].
Σri/N.
The weighted version of (A) [(Σwixi)/Σwi−(Σwjyj)/Σwj]/[(Σwixi)/Σwi] with weights equal to the inverse of the variance (σ2) of the corresponding BPi.
The weighted version of (B) Σwiri/Σwi with weights equal to the inverse of the variance of ri.
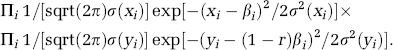
A Maximum Likelihood (ML) estimator of βML = [β1, β2, … βN+1] = [BPBASEL,1, …. BPBASEL,N, r] as the point of maximum of the likelihood function
Simulations were performed with N = 5 to 10 ROIs with a uniform distribution for their baseline BPs between 0.5 and 2.5. Occupancies of 25%, 50% and 75% and 3 different models for σ2 ([1] a = constant; [2] aBP+b; [3] aBP2+b) were considered. For each value of N, occupancy, and variance model, 5 noise levels for σ2were tested by increasing the value of a. M = 1000 simulated datasets were created by adding Gaussian noise to the baseline and block BPs, to obtain, in the end, 1000 occupancy estimates for each combination of parameters. In the application of (B) and (D) the exact σ2 were employed for wi. In (E) the correct model for σ2 was used but with the parameters a and b randomly distributed between 75% and 125% of their true values as in real applications a and b are not known.
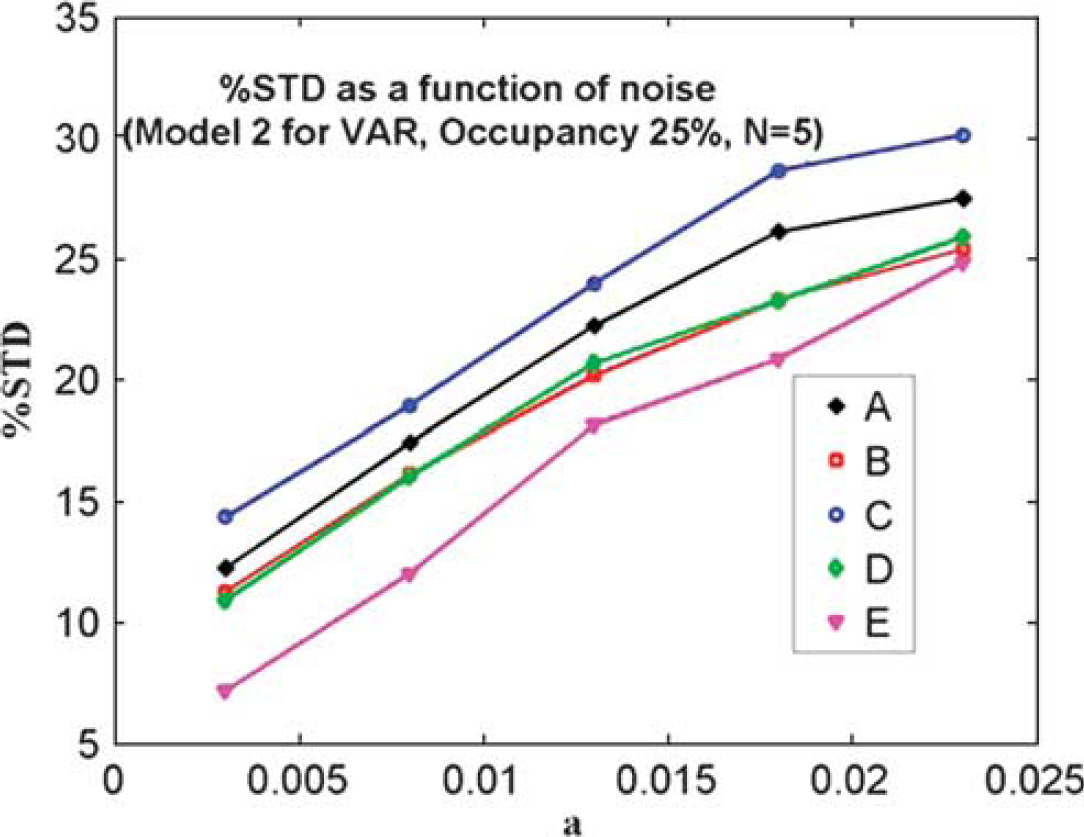
Performances were assessed using the indices %BIAS = 100*[Σi (ri−rTRUE)/rTRUE]/M and %STD = 100*sqrt [(Σi (ri−rMEAN)2/M]/rMEAN, with rMEAN being the mean r of the method examined.
Results: Equation (B) and (D) gave sometimes biased results (range ±[5%–10%]) whereas the other approaches yielded substantially unbiased estimates. The figure shows typical results for %STD. Except for the case of equal constant variance, where all methods gave very similar performances, the ML approach (E) provided the lowest %STD.
Conclusion: The ML approach provided the lowest noise estimates in the case of non-uniform variance. Additional work is required to test this method on real datasets. In this case, the selection of the best variance model must be addressed carefully.
References
1.
TalbotPS. 11C-GR103545, a radiotracer for imaging kappa-opioid receptors in vivo with PET: Synthesis and evaluation in baboons. J Nucl Med2005;46:484–94.