
Abstract
Inflammation and ischemia have a synergistic damaging effect in the immature brain. The role of tumor necrosis factor (TNF) receptors 1 and 2 in lipopolysaccharide (LPS)-induced sensitization and tolerance to oxygen—glucose deprivation (OGD) was evaluated in neonatal murine hippocampal organotypic slices. Hippocampal slices from balb/c, C57BL/6 TNFR1−/-, TNFR2−/-, and wild-type (WT) mice obtained at P6 were grown
Keywords
Introduction
Inflammation and ischemia are commonly induced in fetal circulation in pregnancies complicated by infection or placental dysfunction and are implicated in the pathogenesis of perinatal brain damage (Anslow, 1998). These insults target distinct cell populations and may result in damage of the developing brain with subsequent functional impairment.
It is now established that infants exposed to infection
Perinatal inflammation typically results in white matter damage (Cai et al, 2003), with relatively little or no damage reported to the neuronal population. Animal studies have shown that systemic inflammation in the fetal circulation (Mallard et al, 2003) or locally induced inflammation within the central nervous system in 5–7-day old rats (Cai et al, 2003) results in white matter damage with histopathologic similarities to the white matter disease observed in preterm human infants. Conversely, inflammation induced by the endotoxin lipopolysaccharide (LPS) immediately before ischemia aggravates and extends brain injury to also include neuronal cells, including those in the hippocampus (Wang et al, 2006). Animal studies show that the temporal separation between induced inflammation and subsequent cerebral ischemia will determine whether sensitization or tolerance occurs (Eklind et al, 2005).
Lipopolysaccharide activates the innate immune system, primarily by binding to the Toll-like receptor-4, which leads to the induction of proinflammatory genes, among which is tumor necrosis factor α(TNFα), by the activation of several transcriptional pathways such as nuclear factor kappa B (NF-κB). Tumor necrosis factor α is a key proinflammatory cytokine that is rapidly upregulated during infection and exerts its biologic effects by signaling through two receptors, TNF receptor (TNFR) 1 and TNFR2. Hypothetically, TNFα signaling may be implicated in the mechanisms of both LPS-induced sensitization and tolerance to ischemia. Sensitization in response to TNFα stimulation has been shown to occur through a posttranslational increase in α-amino-3-hydroxy-5-methyl-4-isoxazolepropionic acid (AMPA) receptor density at synaptic terminals (Stellwagen et al, 2005), through the activation of TNFR1, and a concomitant endocytosis of γ-aminobutyric acid (GABA)A receptors from inhibitory receptor terminals (Stellwagen et al, 2005). Ischemic tolerance in response to LPS exposure is induced as a result of an attenuation of the cytotoxic effects of TNFα in ischemia (Rosenzweig et al, 2007).
Materials and methods
Preparation and Maintenance of Organotypic Hippocampal Tissue Cultures
All animal experiments were approved by the Malmo/Lund ethical committee on animal experiments (approval number M 73-04). Offspring from date-mated balb/c mice (Harlan, Scandinavia, Denmark) and C57BL/6 wild-type (WT), C57BL/6 TNFR1−/-, and C57BL/6 TNFR2−/- were used for experiments. In-house breeding generated TNFR1−/- and TNFR2−/- mice by crossing TNFR1/R2−/- mice (Peschon et al, 1998; obtained from Jackson Laboratory, Bar Harbor, ME, USA) with WT C57BL/6 mice (B&K Universal, Stockholm, Sweden) and interbreeding heterozygous offspring followed by selection of appropriate genotypes as determined by polymerase chain reaction. Wild-type C57BL/6 mice were used as controls for TNFR1−/- and TNFR2−/- mice, respectively.
In brief, hippocampal organotypic tissue cultures were prepared essentially according to the method of Stoppini, as described earlier (Cronberg et al, 2004; Stoppini et al, 1991), from 6-day-old mice. In short, hippocampi were dissected in ice-cold Hank's balanced salt solution, with 20 mmol/L HEPES (4-(2-hydroxyethyl)-1-piperazine-ethanesulfonic acid), 100 units penicillin—streptomycin per milliliter, and 3 mg/mL D-glucose and cut into 250-μm-thick slices using a McIllwain Tissue Chopper. Sections were plated onto Millicell culture inserts, one per insert (0.4 μm Millicell-CM, 12 mm in diameter, Millipore Corp, Bedford, MA, USA). Slices were cultured in 35°C and 90% to 95% humidity in a CO2 incubator for 9 days before experiment. The culture medium consisted of 50% modified Eagle's medium with Earle's balanced salt solution (MEM), 25% horse serum, and a 18% Hank's balanced salt solution and was supplemented with 4 mmol/L L-glutamine, 50 units penicillin—streptomycin per milliliter, and 20 mmol/L D-glucose. The pH was adjusted to 7.2 using NaHCO3. During the first week of culture, 2% of the supplement B27 was included in the medium and thereafter omitted and replaced with the same volume of water. On DIV9, when the experiment was initiated, horse serum was omitted and the volume was replaced with MEM. This medium was used throughout the experimental protocol. Before experimental start, the culture medium was changed the day after the preparation and thereafter three times a week. All substances were obtained from Invitrogen (Carlsbad, CA, USA) with the exception of D-glucose, which was from Sigma-Aldrich (St Louis, MO, USA).
Experimental Protocol
All cultures used in one experiment were prepared from mice pups from one to two females with litters born on the same day. Experiments were started on DIV9, and slices were assorted into four groups with one slice from each individual mouse per experimental group and six slices per group. Slices were incubated with propidium iodide (PI, Sigma-Aldrich) for 1 h to assess the background levels of cell death. Photomicrographs were taken using fluorescent light microscopy and slices were again sorted to include only undamaged slices displaying no PI uptake. Light microscopy was used to include only slices with an organotypic anatomy. Propidium iodide was present in all groups throughout the experimental protocol and all experiments were carried out in serum-free medium. The protocol was performed in four groups: Control = cultures exposed to medium changes at corresponding time points as experimental groups, preincubation period of 24 h followed by transfer to fresh medium for 48 h; LPS = incubation with LPS (1 μg/mL; Sigma-Aldrich) for 24 h followed by transfer to fresh medium for 48 h; Oxygen—glucose deprivation (OGD) = preincubation without LPS for 24 h, followed by OGD and thereafter transfer to fresh medium for 48 h; LPS + OGD = incubation with LPS for 24 h followed by OGD and thereafter transfer to fresh medium for 48 h. To study the influence of time between LPS incubation and OGD, sets of two groups, one control group and one LPS group, were transferred to fresh medium after the initial 24 h of incubation with or without LPS and incubated for 24, 48, or 72 h, with no additional changes of medium, before OGD. An overview of the experimental protocol is given in Figure 1.
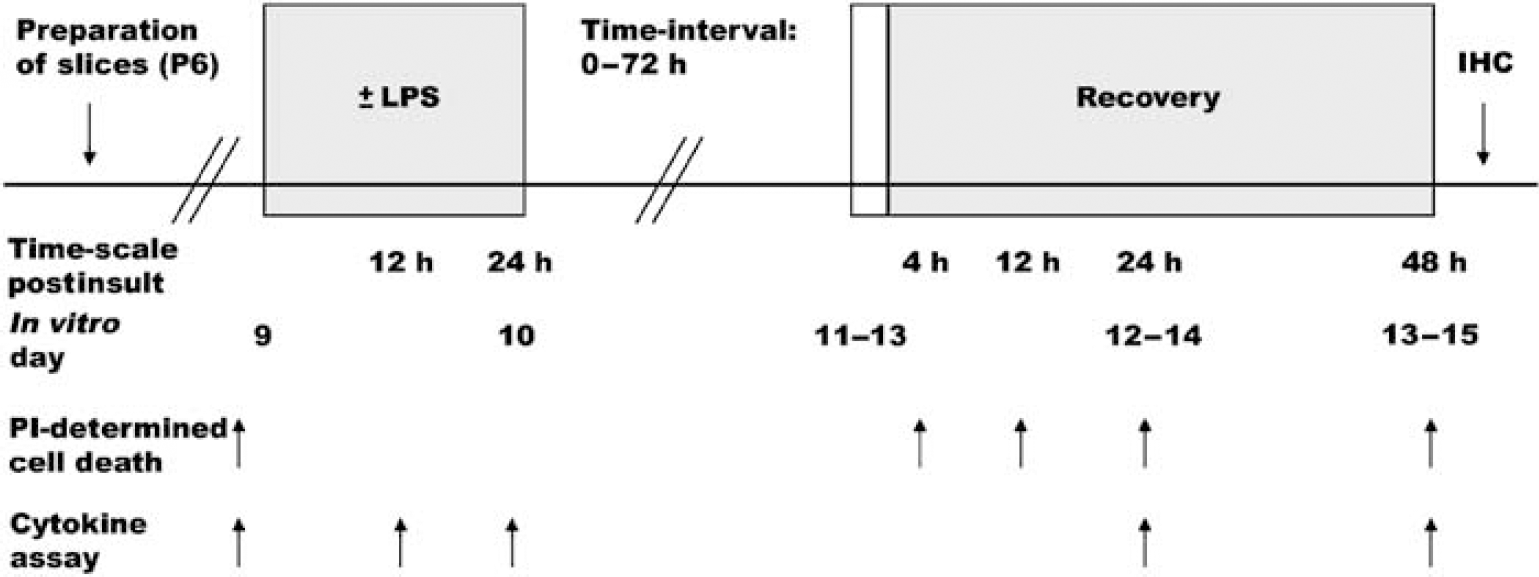
Schematic illustration of experimental design. LPS, lipopolysaccharide; PI, propidium iodide; OGD, oxygen—glucose deprivation; IHC, immunohistochemistry. Cytokine release in medium was determined only in experiments with a time interval of 0 h between insults.
Before OGD, cultures were washed once in prewarmed phosphate-buffered saline (PBS) and transferred to the anaerobic incubator (Elektrotek Ltd, Keighley, UK) in an empty prewarmed plate according to previously described protocols for OGD (Cronberg et al, 2004). The anaerobic incubator had an atmosphere comprising 10% H2, 5% CO2, and 85% N2, and the temperature was maintained at 35.0°C ± 0.3°C. Inside the incubator, the slices were transferred to wells containing preequilibrated OGD medium. The OGD medium consisted of, in mmol/L concentrations, 2 CaCl2, 125 NaCl, 25 NaHCO3, 2.5 KCl, 1.25 NaH2PO4, 2 MgSO4, and 10 sucrose and had a pH of 7.4. After 15 mins of OGD, the slices were transferred to fresh oxygenated culture medium and placed in the CO2 incubator. In all groups, slices were cultured for 48 h after the time point of OGD, and photomicrographs were taken in parallel at 4, 12, 24, and 48 h after OGD.
Quantification of Cell Damage
Propidium iodide was used as a marker for cell death and was included in the medium in all groups throughout the experimental protocol (Cronberg et al, 2004). Photomicrographs of PI-stained slices were obtained before experimental start and at time points of 4, 12, 24, and 48 h after OGD in all groups. Densitometric analysis was performed on photomicrographs to obtain quantitative values of cell death. Propidium iodide intensity was measured using standardized prototypes that were applied over corresponding neuronal regions of interest: the CA1, CA3, and the dentate gyrus. Background uptake was measured in an undamaged area outside the CA2 region in each individual slice, and values of cell death in regions of interest were obtained by subtracting the levels of mean fluorescent intensity in the background region in each slice from mean fluorescent intensity values in the three regions of interest. For image processing, the commercial software Image-Pro Plus 4.0 (Media Cybernetics, MD, USA) was used.
Evaluation of Tumor Necrosis Factor Receptors 1 and 2
To evaluate the roles of TNFR1 and TNFR2 in LPS-induced sensitization and in pure OGD, antagonistic antibodies specific against TNFR1 (50 μg/mL; BioLegend, San Diego, CA, USA) and TNFR2 (50 μg/mL; BioLegend, San Diego, CA, USA), respectively, were included in the medium during 24 h of LPS stimulation or in the control medium before OGD. The experiment was performed as described above, using slices from balb/c mice, by adding the respective blocking antibodies to the medium during 24 h of LPS stimulation. To exclude nonspecific interactions of the respective antibodies with the slice culture other than specific antigen binding and blocking of receptor function, we performed the same experiment using heat-inactivated antibodies at the same final concentration.
The roles of TNFR1 and TNFR2 in LPS-induced sensitization and in LPS-induced tolerance were further investigated using TNFR1−/- and TNFR2−/- C57BL/6 mice, using the same experimental protocol as was applied to WT slices as indicated and described above.
To evaluate the involvement of AMPA and
Immunohistochemistry
Slices were fixed for immunohistochemistry 48 h after OGD. Unsectioned slices were immunostained for the microglial marker F4/80 and for the neuronal nuclear marker NeuN. Slices were fixed with 4% paraformaldehyde in PBS for 10 mins and then stored at 4°C in PBS until used.
Endogenous peroxidase activity was quenched with 3% hydrogen peroxide in 10% methanol for 30 mins . After rinsing, slices were blocked with 5% normal horse serum for a NeuN stain and normal swine serum for an F4/80 stain, and diluted in PBS with 1% Triton X-100 for 1 h before overnight incubation with the primary antibody monoclonal mouse anti-NeuN (Chemicon, Temecula, CA, USA, diluted 1:1,000 in PBS containing 5% normal horse serum and 1% Triton X-100) and monoclonal rat anti-F4/80 (Serotec, Kidlington, Oxford, UK, diluted 1:1,000 in PBS containing 5% normal rabbit serum and 1% Triton X-100). After rinsing, slices were incubated with a biotinylated secondary antibody, horse anti-mouse IgG antibody for a NeuN stain, and rabbit anti-rat IgG antibody for an F4/80 stain. Both antibodies were diluted 1:1,000 in PBS containing 1% Triton X-100 and 2% normal horse serum and swine serum for the respective stains (as indicated above) for 90 mins . After rinsing, slices were incubated with the avidin—biotin—peroxidase complex (Vectastain Elite, Vector Laboratories Inc., Burlingame, CA, USA) for 1 h before reaction with the chromogen 3,3 diaminobenzidine supplemented with 0.06% nickel (DAB-Safe; 0.5 μg/mL; Saveen-Werner AB, Malmo, Sweden). Both sera, both secondary antibodies, and the avidin—biotin—peroxidase complex (Vectastain Elite) were from Vector Laboratories.
Micrographs of immunostained slices were prepared using a microscope (Olympus BX51) equipped for bright-field microscopy with a digital camera (Olympus U-PMTVC). Figures show original, unmodified photomicrographs.
Cytokine Measurements
Levels of secreted cytokines in culture medium were determined at 12 and 24 h after the start of LPS preincubation and at 12, 24, and 48 h after OGD in slices from WT balb/c, WT C57BL/6 mice and in C57BL/6 TNFR1−/- and TNFR2−/- strains, respectively. Samples of medium (50 μL) were immediately frozen on dry ice and were thereafter stored at −80°C until analyzed in one batch. Levels of TNFα, interferon-γ, monocyte chemoattractant protein-1 (MCP-1), interleukin (IL)-6, IL-10, and IL-12
Statistics
Statistical analysis was performed using SPSS v14.0 for Windows. Data are expressed as mean± s.e.m. All compared groups were run in parallel inside the anaerobic incubator. Experiments on the effects of genetic knockouts for TNFR1 and TNFR2 were run and analyzed separately. Differences between groups were assessed using ANOVA for repeated measures with
Results
Sensitizing Effect of Lipopolysaccharide to Oxygen—Glucose Deprivation
Cell damage induced by pure OGD was present from 4h, reached its maximum by 12 h, and was mainly localized to the CA1 region with some damage in the CA3 region and the dentate gyrus. Pre-incubation with LPS during 24 h before OGD severely aggravated PI-determined cell damage in all studied neuronal sub-regions as compared with sole exposure to OGD (
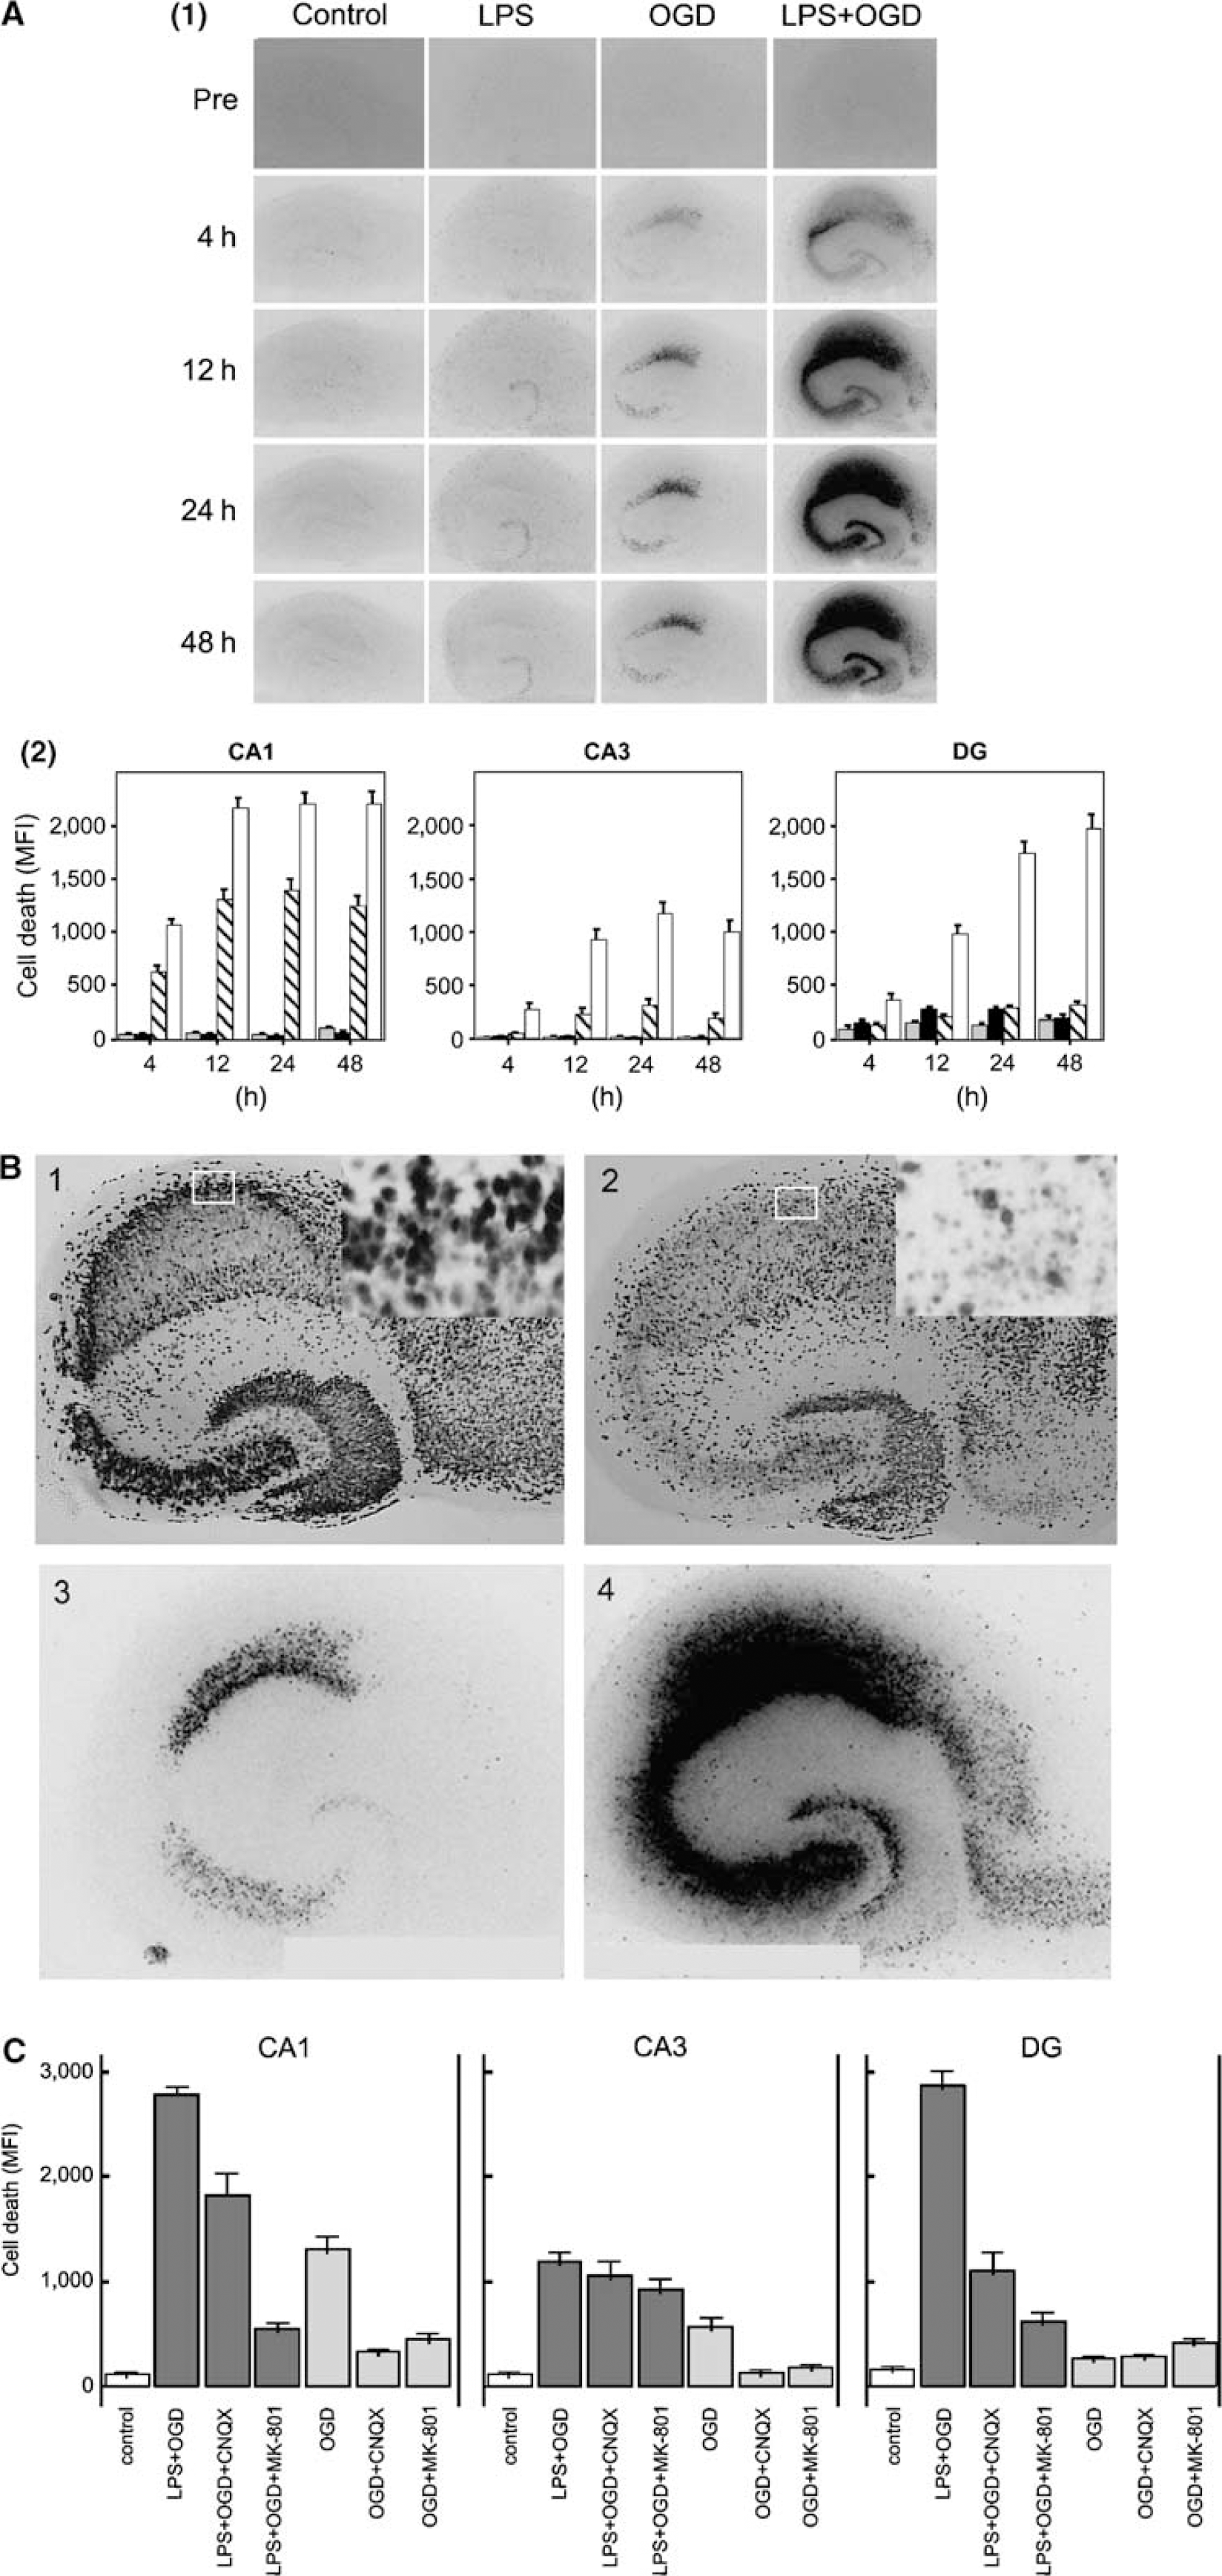
Lipopolysaccharide-induced sensitization to OGD in murine hippocampal slice cultures. Temporal development of cell damage after LPS exposure (1 μg/mL) for 24 h, 15 mins oxygen—glucose deprivation (OGD), or 24h LPS + 15 mins OGD and in control slices. (
Results from staining with NeuN at 48 h correlated well with distribution and degree of PI-determined cell death in neuronal subregions. Control cultures exhibited an intact organotypic distribution of NeuN-positive cells, and sole exposure to LPS did not affect the density and distribution of NeuN-positive neurons as compared with controls. Pure OGD revealed a loss of viable neurons largely restricted to the CA1 region. Cultures exposed to LPS followed by OGD showed a substantial loss of neuronal cell layers in CA1, CA3 and the dentate gyrus and exhibited condensed nuclei indicative of cell death. Representative illustrations of immunostaining with NeuN and PI-determined cell death are given in Figure 2B.
Excitotoxicity as a cause of neuronal death after exposure to LPS followed by OGD was investigated by blocking AMPA and NMDA receptor functions using the receptor antagonists CNQX and MK-801, respectively, as described above. Both receptor antagonists prevented cell death after pure OGD in the CA1 and CA3 regions (all
Microglial Activation during Lipopolysaccharide Exposure and after Oxygen—Glucose Deprivation
Hippocampal cultures from the respective groups were stained with the microglial marker F4/80 at 12 h after the start of LPS exposure and at 24 and 48 h after subsequent OGD. Changes in staining intensity for F4/80 and morphology have been described as early sensitive indicators of microglial activation (Andersson et al, 1991). Control cultures displayed characteristically quiescent microglia with ramified cell bodies at all time points. LPS-exposed cultures exhibited microglia with a swollen ameboid morphology at 24 h after LPS preexposure and OGD that was more pronounced at 48 h, with microglia presenting a rough, densely stained plasma membrane. Microglial morphology did not differ between slices exposed to LPS only and those exposed to LPS + OGD, although after LPS + OGD the slices exhibited increased numbers of activated microglia. Pure OGD resulted in a characteristic distribution of activated microglia that were localized to the CA1-CA3 cell band. Representative illustrations of immunostaining with F4/80 in slices at a time point corresponding to 48 h after OGD are given in Figure 3A.
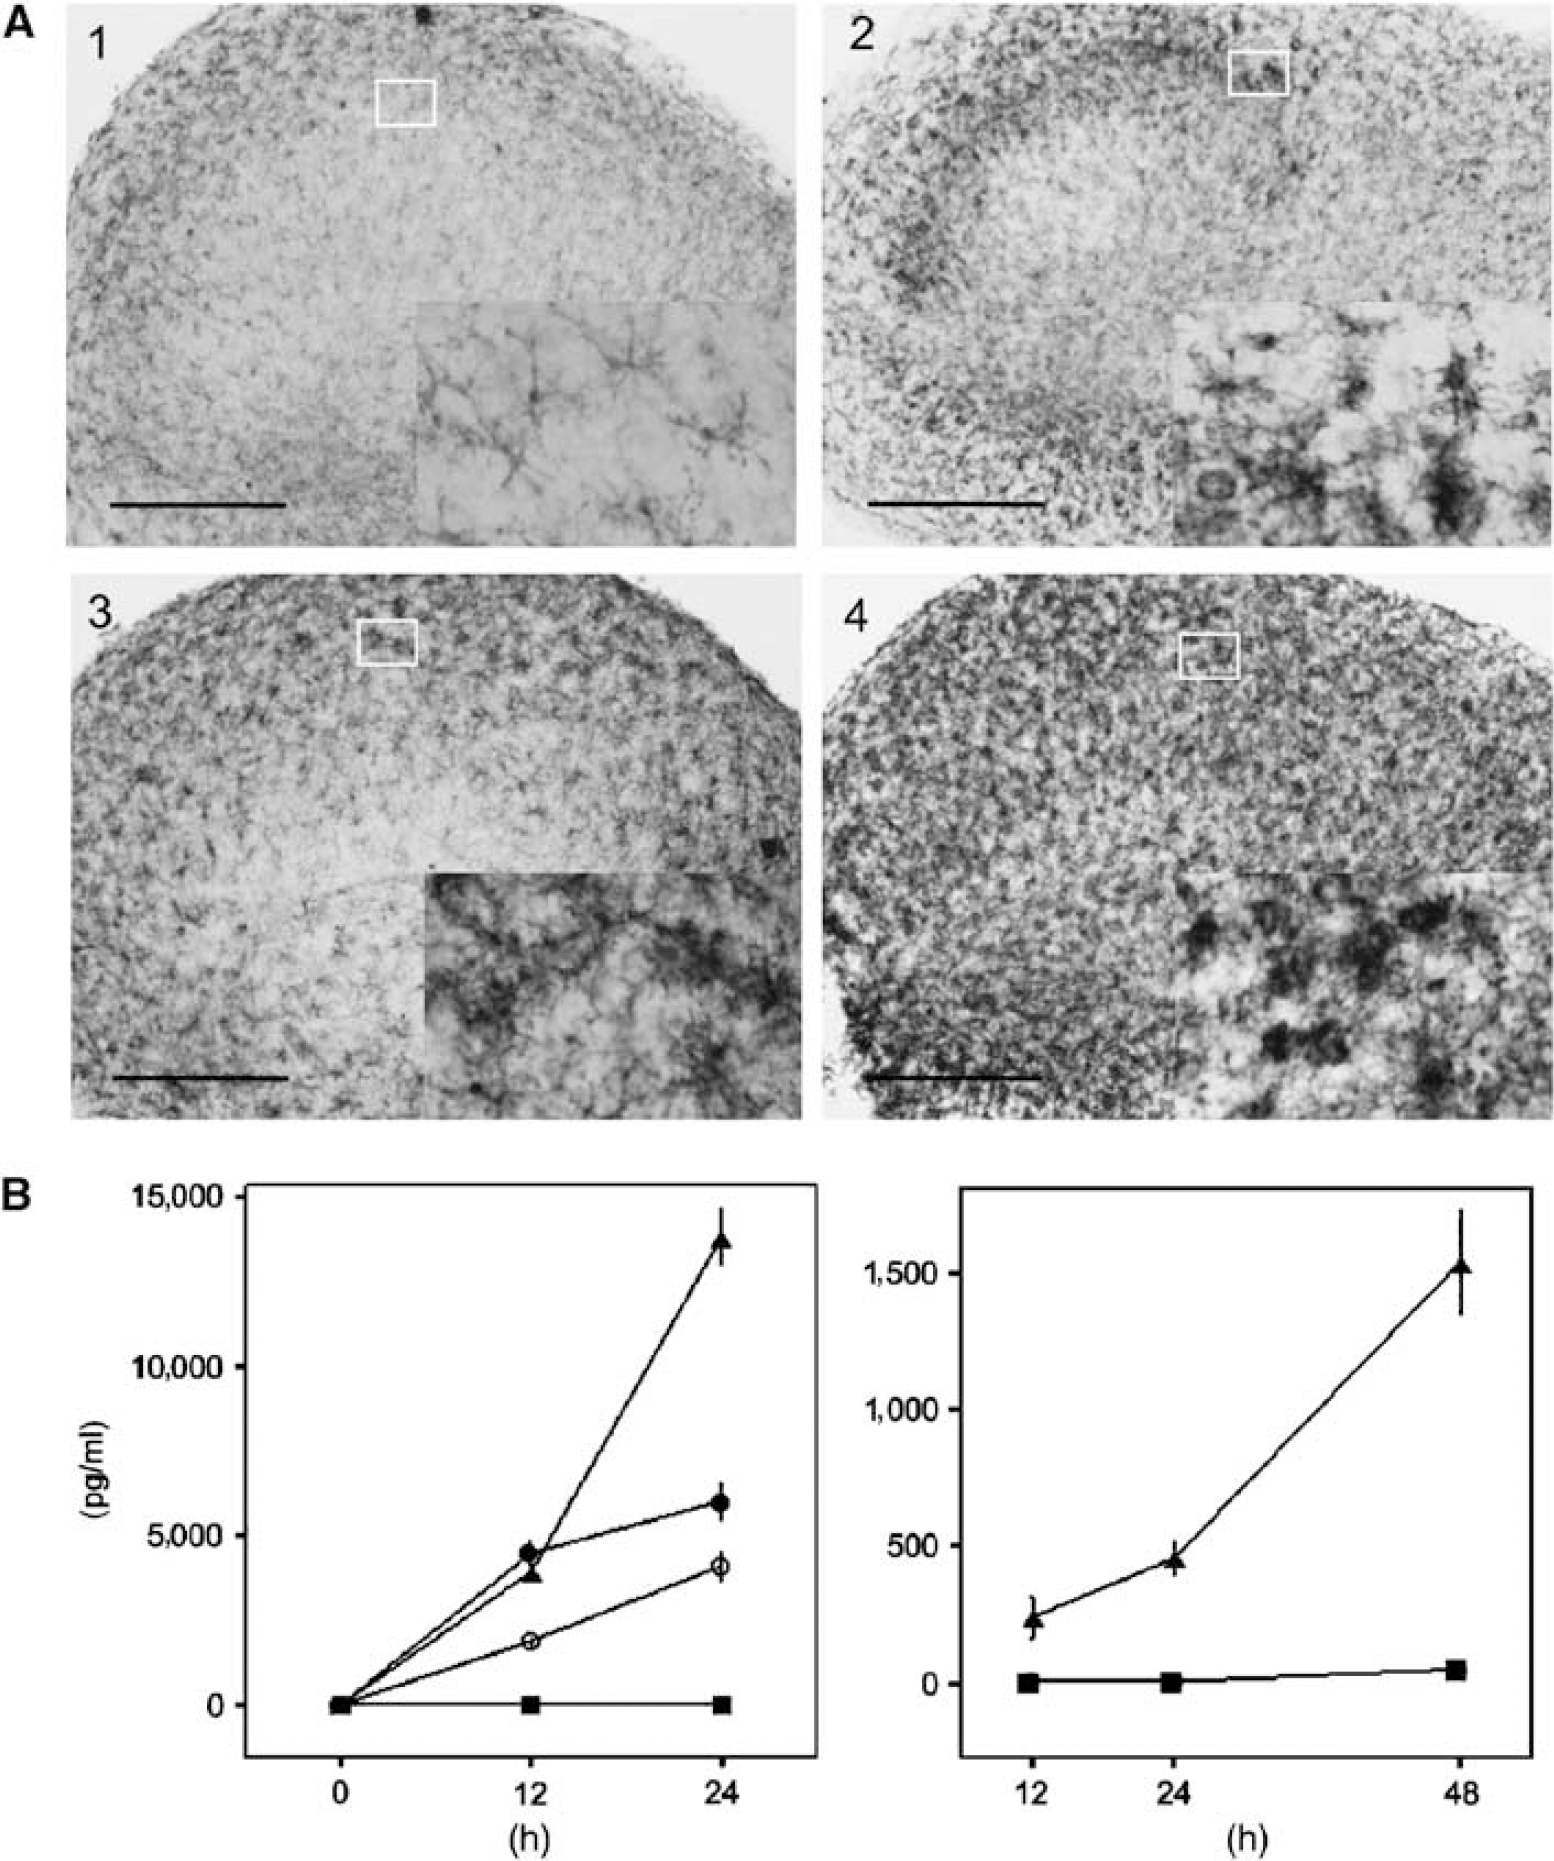
Lipopolysaccharide induces immune activation in murine hippocampal slice cultures. (
Secreted levels of the cytokines TNFα, IL-6, and MCP-1 were increased at 12 h and further increased at 24 h in cultures exposed to LPS as compared with control cultures (
Secreted levels of MCP-1 were significantly increased at 24 and 48 h after LPS exposure followed by OGD as compared with pure OGD and controls (
Role of Tumor Necrosis Factor Receptors in Sensitizing Effect of Lipopolysaccharide on Oxygen—Glucose Deprivation
To investigate the roles of TNFR1 and TNFR2, respectively, blocking antibodies against the two receptors were added during the 24 h of LPS exposure and in control medium before pure OGD. Blockade of TNFR1 or TNFR2 had no modifying effect on cell death after pure OGD (data not shown). The addition of antibodies against TNFR1 resulted in an almost complete reversal of the sensitizing effect of LPS to OGD as determined by PI uptake, whereas the addition of blocking antibodies against TNFR2 resulted in augmentation of cell death after LPS exposure and OGD (
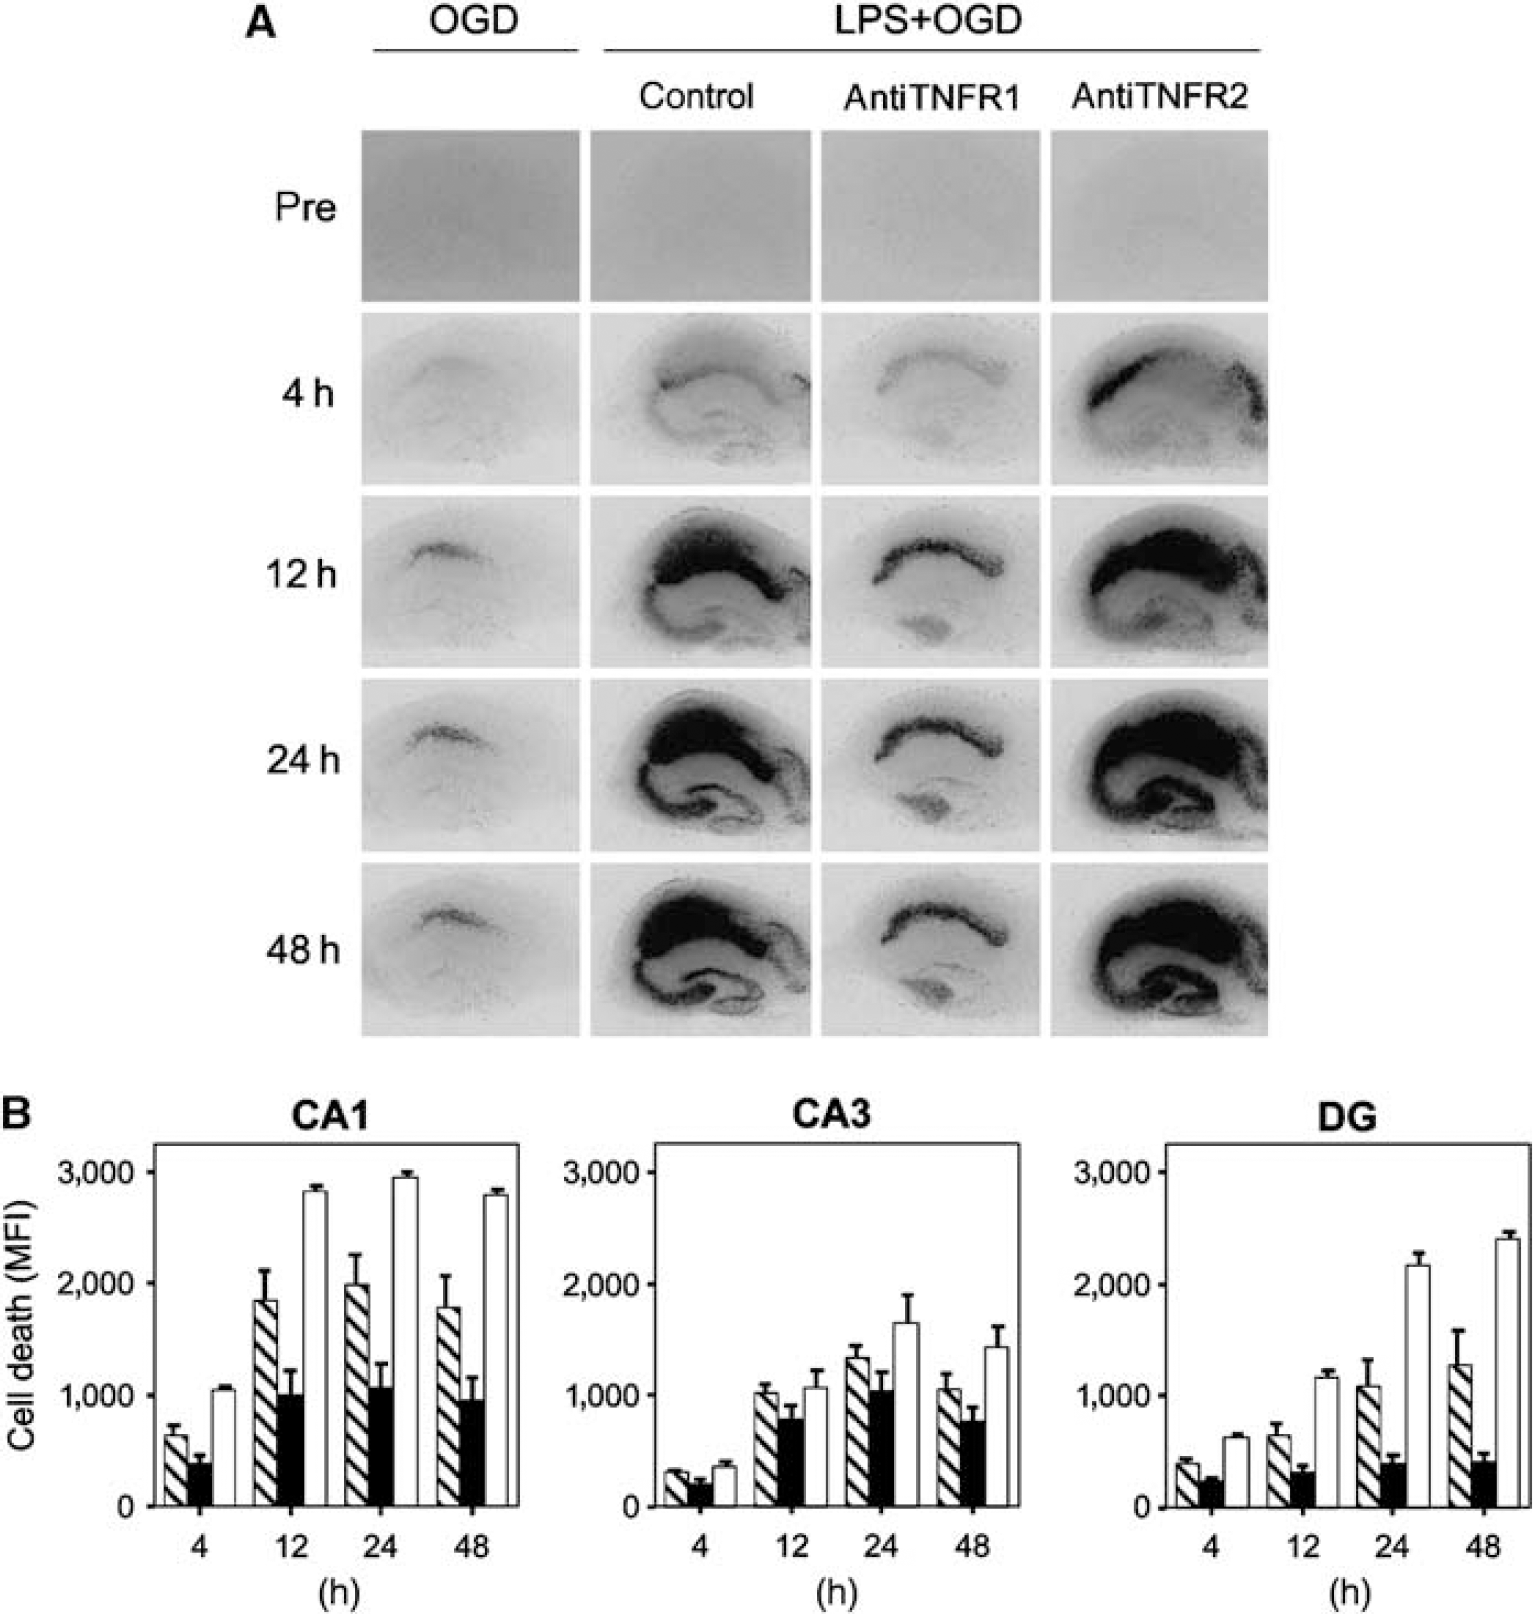
Evaluation of the role of TNFR1 and TNFR2 in LPS-induced sensitization to OGD using antagonistic antibodies. Temporal development of cell damage after LPS exposure (1 μg/mL) for 24 h before 15 mins oxygen—glucose deprivation (OGD) after adding antibodies to either TNFR1 or TNFR2 (50 μg/mL, respectively) during LPS exposure. (
To further investigate the role of TNFRs 1 and 2, we examined the effect of LPS exposure before OGD on PI-determined cell death in hippocampal slices from TNFR1−/-, TNFR2−/-, and C57BL/6 WT mice, respectively. The sensitizing effect of LPS on subsequent OGD was successfully replicated using WT C57BL/6 mice. The respective knockout strains were tested in separate experiments. In experiments using slices from TNFR1−/- mice, the sensitizing effect of LPS exposure before OGD was absent in all evaluated subregions, whereas slices from TNFR2−/- and C57BL/6 WT mice exhibited a similar and pronounced sensitizing effect of LPS exposure on OGD in the CA1, CA3, and the dentate gyrus. These results thus correlated well with the experiments using antagonistic antibodies to TNFR1 and TNFR2, respectively. Representative photomicrographs and mean values of PI-determined cell death are given in Figure 5.
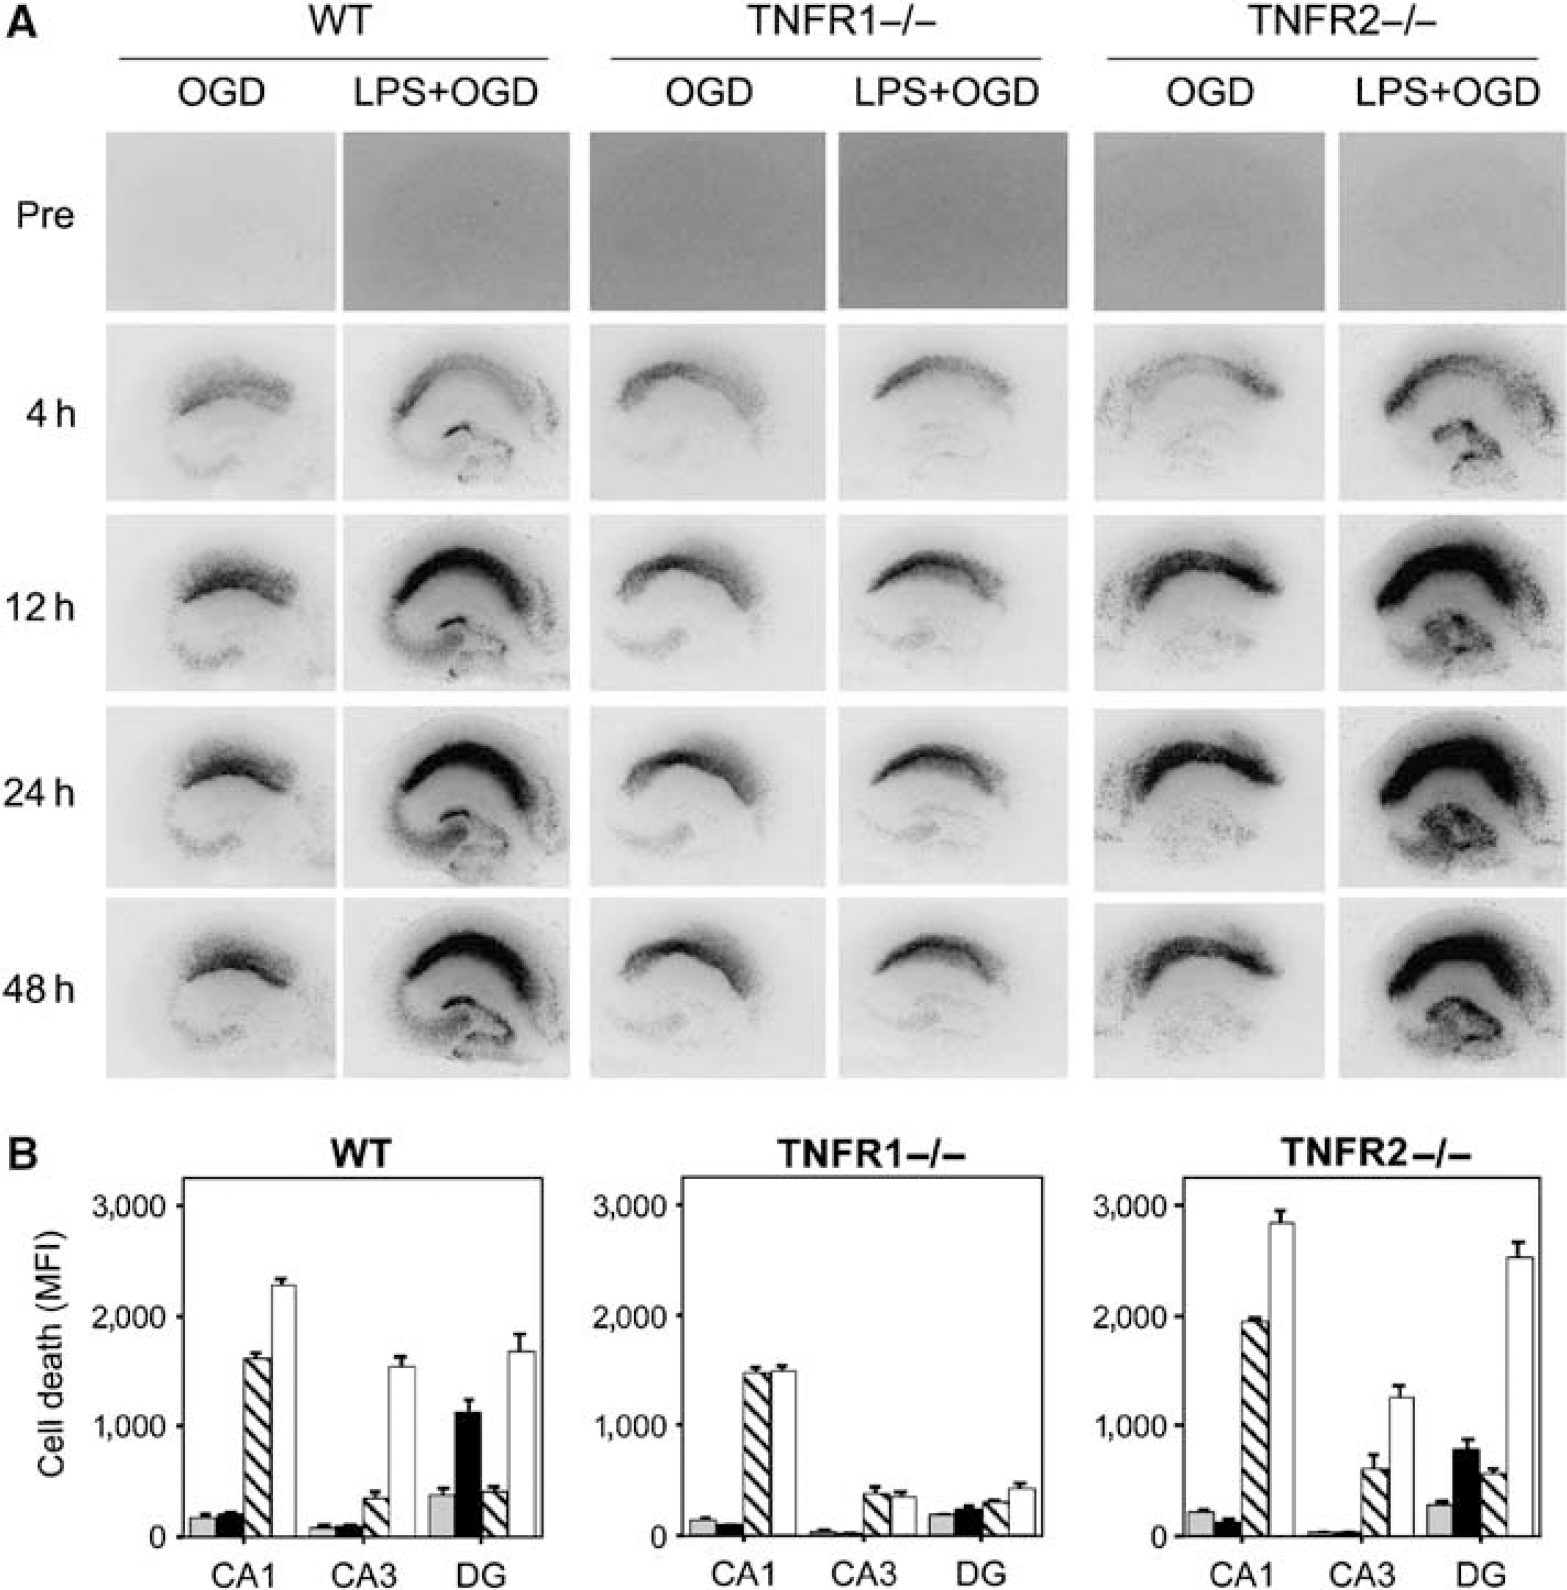
Roles of TNFR1 and TNFR2 in LPS-induced sensitization to OGD evaluated in TNFR1−/- and TNFR2−/- hippocampal slice cultures. Cell damage after LPS exposure (1 μg/mL) for 24 h before 15 mins oxygen—glucose deprivation (OGD) in hippocampal slice cultures from C57BL/6 WT, TNFR1−/-, and TnFR2−/- mice. (
Cytokines secreted from slices from TNFR1−/-, TNFR2−/-, and C57BL/6 WT mice, respectively, were determined during LPS exposure as described earlier. The levels of TNFα, IL-6, and MCP-1 were considerably decreased during LPS exposure from TNFR1−/- slices as compared with the corresponding levels from TNFR2−/- and C57BL/6 WT mice (
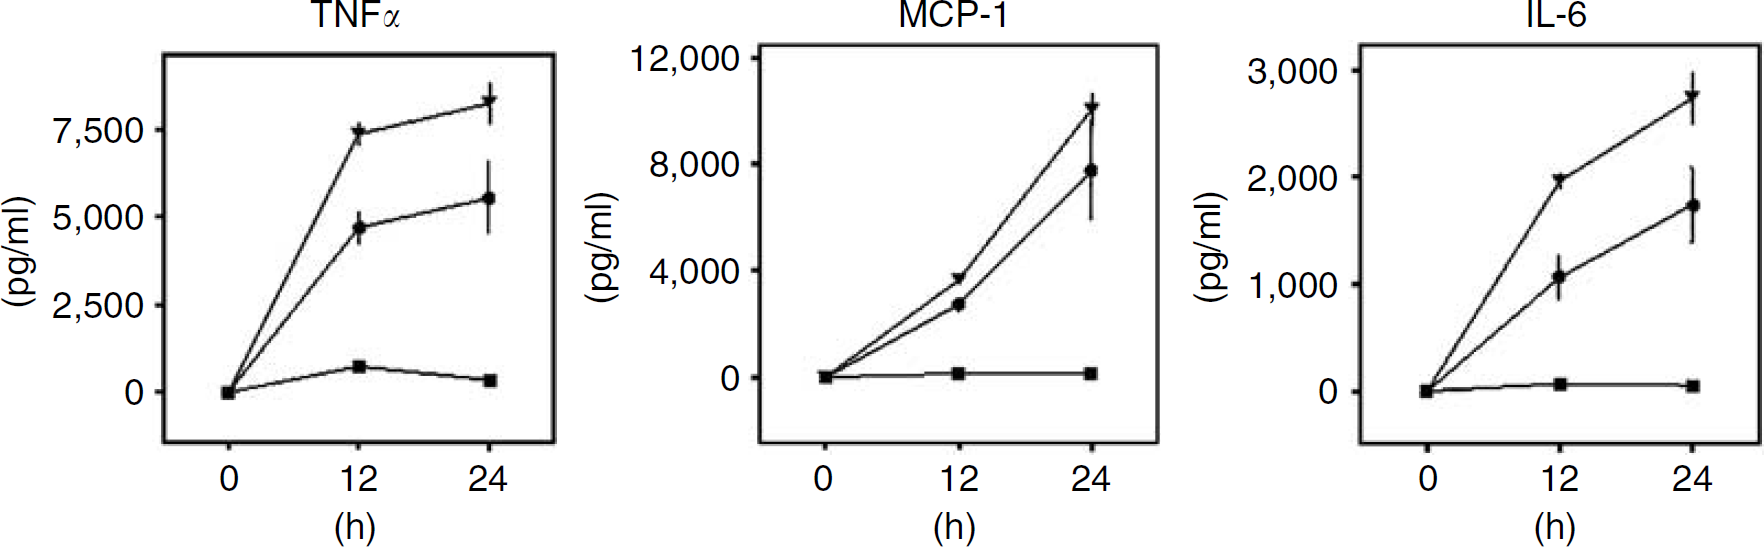
Roles of TNFR1 and TNFR2 in LPS-induced cytokine release. Mean levels of TNFα, MCP-1, and IL-6 at 0, 12, and 24 h during LPS exposure secreted from hippocampal slices from C57BL/6 WT (dots), TNFR1−/- (squares), and TNFR2−/- (triangles) mice, respectively. Data are shown as means ± s.e.m. with
Effect of Varied Time Interval between Insults on the Sensitizing Effect of Lipopolysaccharide on Oxygen—Glucose Deprivation
The effect of increasing the time interval between LPS exposure and OGD from 0 to 24, 48, and 72 h was evaluated on PI-determined cell damage. The sensitizing effect of LPS on OGD was no longer significant with a 24-h interval between insults in any of the studied neuronal subregions. Extending the interval between LPS exposure and OGD to 72 h resulted in a significant decrease in PI-determined cell damage after LPS preexposure to OGD as compared with only OGD (
The same protocol was applied to hippocampal slice cultures from TNFR1−/-, TNFR2−/-, and C57BL/6 WT mice. In experiments using cultures from TNFR1−/- mice, exposure to LPS at 24, 48, and 72 h before OGD did not result in significant differences in PI-determined cell damage in neuronal subregions as compared with slices subjected only to OGD at any of the studied time intervals. Cultures from both TNFR2−/- and C57BL/6 WT mice exhibited a sensitizing effect of LPS exposure on OGD with a time interval of 0 h but not at 24 and 48 h, whereas a significant decrease in PI-determined cell damage was observed at a time interval of 72 h between LPS exposure and subsequent OGD in the CA1 region and the dentate gyrus (
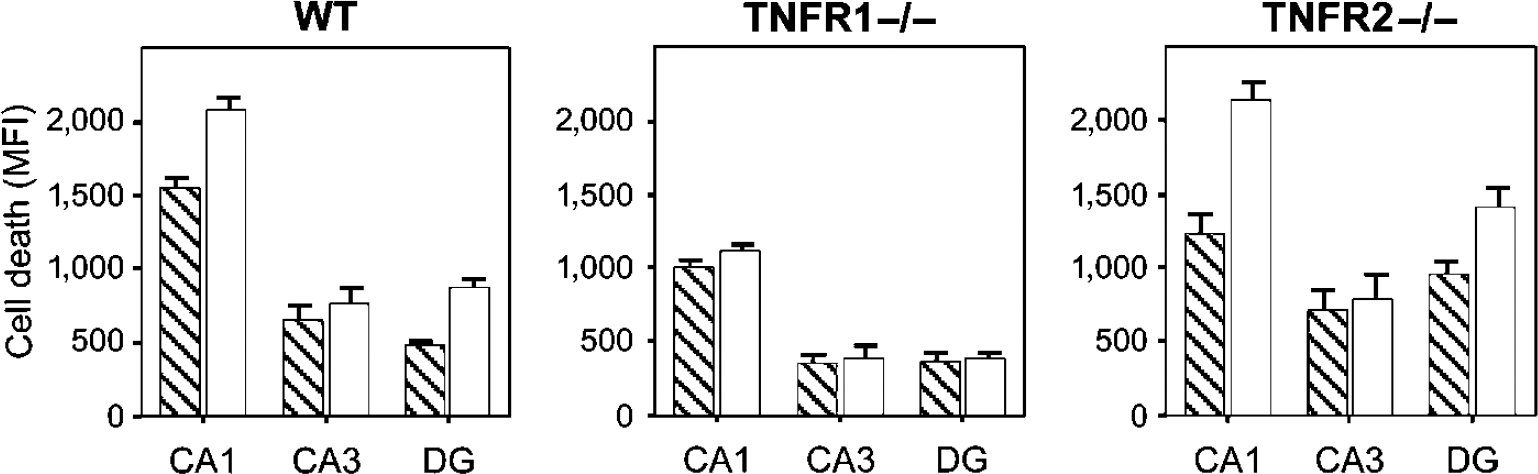
Roles of TNFR1 and TNFR2 in LPS-induced tolerance to OGD. Cell damage after LPS exposure (1 μg/mL) for 24 h with a 72-h time interval before 15 mins oxygen—glucose deprivation (OGD) in hippocampal slice cultures from C57BL/6 WT, TNFR1−/-, and TNFR2−/- mice. Mean PI intensity in the standardized neuronal areas CA1, CA3, and dentate gyrus (DG) in cultures exposed to 24 h LPS + 15 mins OGD (hatched bars) and in cultures only exposed to 15 mins OGD (white bars). Preexposure to LPS 72 h before OGD decreased cell death in the CA1 area and the DG in cultures from WT (
Discussion
Together, our results provide evidence for the role of both receptors for TNFα, TNFR1 and TNFR2, in LPS-induced sensitization and tolerance to subsequent OGD in immature organotypic hippocampal slice cultures. We show that LPS induces sensitization and tolerance to subsequently induced OGD as a consequence of varied time intervals between the insults. Our results indicate that TNFα plays a central role in LPS-induced sensitization and tolerance to OGD by activating TNFR1, as both effects were absent in slices lacking the gene for TNFR1 or in an experimental set-up where the activation of TNFR1 was blocked by specific antagonistic antibodies. TNFR2 appears to have a modulatory role in LPS-induced sensitization to OGD, as blocking this receptor increased neuronal cell death.
Inflammation and ischemia are important causes of disturbed brain development in the newborn. To study the interaction between these insults, we developed an
Lipopolysaccharide-Induced Cytokine Release and Activation of Microglia
Lipopolysaccharide exposure in hippocampal slices activated the innate immune response in slices, as evidenced by increased levels of secreted proinflammatory cytokines, and an activated microglial morphology, as assessed by immunohistochemistry for F4/80. The inflammatory response to LPS in rat hippocampal cultures has been described (Huuskonen et al, 2005), and we here replicate some of these findings in murine hippocampal slices. During LPS exposure, increased levels of secreted cytokines were found for TNFα, IL-6, and MCP-1. The levels of secreted TNFα during LPS exposure reached 5 ng/mL corresponding to concentrations used by others for administration of exogenous TNFα in both
Neither TNFα nor IL-6 was increased after pure OGD, which differs from previous studies, showing a prominent release of these cytokines after ischemia
Lipopolysaccharide-Induced Sensitization and Tolerance to Oxygen—Glucose Deprivation
Depending on the applied time interval between the insults in organotypic hippocampal slice cultures, LPS induced both sensitization and tolerance to subsequent OGD. At 0h time interval between insults, LPS sensitized all neuronal regions of the hippocampus to subsequent OGD, whereas a time interval of 72 h resulted in ischemic tolerance. Our results correlate well with
The mechanisms involved in LPS-induced tolerance are not well understood. There is emerging evidence indicating a role for cytokines not only in LPS-induced sensitization but also in LPS-induced ischemic tolerance. Sole exposure to proinflammatory cytokines, for example TNFα (Nawashiro et al, 1997), is sufficient to induce a state of ischemic tolerance. Interestingly, proinflammation, including Toll-like receptor and cytokine signaling initially, promotes a period of inflammation and later suppresses innate immunity. This is mediated by the activation of counter-regulatory mechanisms that result in an immune suppressed state, characterized by lower levels of released cytokines upon a second challenge with LPS or during subsequent ischemia (for a review see Kariko et al, 2004). The development of tolerance, unlike sensitization, requires
Excitotoxicity in Lipopolysaccharide-Induced Sensitization
Glutamate release and glutamate toxicity is a main component of ischemic neuronal damage and is mediated by binding of glutamate to the ionotropic glutamate receptors, the NMDA, AMPA, and kainate receptors, and to the metabotropic glutamate receptors. The NMDA receptor antagonist MK-801 and the AMPA receptor antagonist CNQX were used to show the level of glutamate involvement in the ensuing neuronal cell death after OGD with or without LPS preexposure. In agreement with previous reports (Newell et al, 1995), we observed that cell death induced by pure OGD was inhibited by NMDA and AMPA receptor blockers. Blocking NMDA receptor function in cultures preexposed to LPS provided almost full protection to subsequent OGD in the CA1 region and in the dentate gyrus, whereas AMPA receptor blockers reduced cell death to levels that were still significantly higher than those induced by pure OGD. Thus, the severe increase in neuronal death in the CA1 region and in the dentate gyrus after LPS exposure before OGD was mediated by glutamate toxicity. In analogy with our results, Zou and Crews (2005) showed that TNFα, in combination with a submaximal dose of glutamate, resulted in accelerated and increased glutamate neurotoxicity in hippocampal slices. The ensuing excitotoxic neuronal cell death was blocked by NMDA receptor antagonists but not by AMPA receptor antagonists. Recent evidence shows that exposure to TNFα increases glutamate toxicity by increasing AMPA receptor density but not NMDA receptor density at synaptic terminals (Stellwagen et al, 2005). This suggests that higher relative concentrations of AMPA than NMDA receptor antagonists are needed to block AMPA receptor function after LPS and OGD. Blocking NMDA or AMPA receptor function had no effect on neuronal death in the CA3 region, suggesting that mechanisms other than excitotoxicity are involved in neuronal death in the CA3 region after LPS and OGD. Differential NMDA receptor density in hippocampal neuronal subregions might explain the finding that the response in neurons of the CA3 region to MK-801 was lower than in neurons of the CA1 region and the dentate gyrus.
The Roles of Tumor Necrosis Factor Receptors 1 and 2 in Lipopolysaccharide-Induced Sensitization and Tolerance
Tumor necrosis factor α is a potent proinflammatory cytokine, capable of inducing severe tissue damage and cell death, but might also induce antiapoptotic and trophic responses. Tumor necrosis factor α exerts its effect by binding to its receptors, TNF receptor 1 and 2, which are present on both neuronal cells and microglial cells. Both receptors activate, among others, the transcription factor NF-κB, which activates transcription of target genes that regulate cell survival and apoptosis. Nuclear factor-κB may induce apoptosis by signaling through Fas-associated death domain and caspase 8 (Muppidi et al, 2004), and may activate mechanisms mediating cell survival by increasing the expression of cell survival factors that provide protection against cerebral ischemia (Wilde et al, 2000). The protective and deleterious effects of TNFα stimulation have been speculated to be mediated by its two receptors (Marchetti et al, 2004).
We investigated the role of the receptors for TNFα, TNFR1, and TNFR2 by using genetically modified mice lacking either receptor subtype, or by the addition of antagonistic antibodies specific for either receptor subtype. We show that signaling through TNFR1 mediates the neurodestructive effects of TNFα in LPS-induced sensitization and the protective effects in LPS-induced ischemic tolerance. Mechanisms activated downstream of TNFR1 are thus essential for both LPS-induced sensitization and tolerance.
Secretion of TNFα, IL-6, and MCP-1 was severely inhibited during LPS exposure in slices devoid of TNFR1. A previous study has shown that signaling through TNFR1 promotes an autocrine loop, thereby amplifying TNFα secretion during LPS exposure or exposure to TNFα. (Kuno et al, 2005) This mechanism appears to be present in our model of hippocampal cultures and, importantly, is associated with subsequent sensitivity to
The role of TNFR2 is less clear in LPS-induced sensitization and tolerance. We show that blocking TNFR2 by antagonistic antibodies resulted in increased neuronal damage after LPS and OGD, implying a protective role for TNFR2 in acute excitotoxicity. Indeed, Bernardino et al (2005) reported that TNFα exposure dose-dependently induced either neuroprotection or enhanced neurotoxicity when combined with AMPA in murine hippocampal slices through selective activation of either TNFR1 or TNFR2 (Bernardino et al, 2005). This indicated opposing roles for TNFR1 and TNFR2 in acute excitotoxicity, and a protective role for signaling through TNFR2. We showed that slices from TNFR2−/- mice secreted significantly higher levels of TNFα and IL-6 during LPS exposure as compared with slices from WT mice. Similar findings have been observed in cultured microglia by blocking TNFR2 during LPS exposure (Kuno et al, 2005). Thus, signaling through TNFR2 appears to reduce LPS-induced proinflammatory cytokine response resulting in reduced neuronal cell death after LPS and OGD. However, the role of TNFR2 in central nervous system inflammation warrants further studies, and it cannot be excluded that protection mediated by the activation of TNFR2 involves the activation of signaling pathways involved in other aspects of neuroprotection.
Conclusions
Signaling through TNFR1 amplifies proinflammatory cytokine response during LPS exposure, whereas signaling through TNFR2 is associated with a decreased proinflammatory cytokine response. Signaling by TNFα through TNFR1 is essential for LPS-induced sensitization and protection to OGD. The organotypic hippocampal slice culture appears well suited for studies addressing the interaction between inflammation and ischemia, with results correlating well to those of existing
Footnotes
Acknowledgements
We thank Blanka Boberg for excellent technical support.
The authors state no conflict of interest.