
Abstract
The purpose of this study was to investigate astrocytic oxidative metabolism using 1-11C-acetate. 1-11C-acetate kinetics were evaluated in the rat somatosensory cortex using a β(−scintillator during different manipulations (test-retest, infraorbital nerve stimulation, and administration of acetazolamide or dichloroacetate). In humans a visual activation paradigm was used and kinetics were measured with positron emission tomography. Data were analyzed using a one-tissue compartment model. The following features supported the hypothesis that washout of radiolabel (k2) is because of 11C-CO2 and therefore related to oxygen consumption (CMRO2): (1) the onset of 11C washout was delayed; (2) k2 was not affected by acetazolamide-induced blood flow increase; (3) k2 demonstrated a significant increase during stimulation in rats (from 0.014 ± 0.007 to 0.027 ± 0.006 per minute) and humans (from 0.016 ±0.010 to 0.026 ± 0.006 per minute); and (4) dichloroacetate led to a substantial decrease of k2. In the test-retest experiments K1 and k2 were very stable. In summary, 1-11C-acetate seems a promising tracer to investigate astrocytic oxidative metabolism in vivo. If the washout rate indeed represents the production of 11C-CO2, then its increase during stimulation would point to a substantially higher astrocytic oxidative metabolism during brain activation. However, the quantitative relationship between k2 and CMRO2 needs to be determined in future experiments.
Introduction
There is increasing evidence that astrocytes and neurons constitute a tightly coupled metabolic unit. Already early studies of brain metabolism using 14C-labeled precursors such as glucose or acetate led to the concept of two distinct tricarboxylic acid (TCA) cycle compartments, that is, two separate pools for glutamate and glutamine (Berl and Frigyesi, 1969; Cremer, 1970; Minchin and Beart, 1975; Van den Berg et al, 1969). Later histochemical work on the restricted localization of glutamine synthetase to glial cells (Martinez-Hernandez et al, 1977; Norenberg and Martinez-Hernandez, 1979) further supported the idea on the glial and neuronal site of these distinct pools. Simplification of these data has sometimes led to the wrong assumption that the oxidative activity of astrocytes is negligible. However, studies using mainly nuclear magnetic resonance spectroscopy have suggested that astrocytic energy metabolism indeed contains a substantial oxidative component which may account for up to 30% of total oxidative metabolism in brain under resting conditions (for review see Hertz and Kala, 2007; Hertz et al, 2007; Hyder et al, 2006). Recent transcriptome analysis has revealed a pattern of gene expression in astrocytes consistent with a significant oxidative activity (Lovatt et al, 2007).
Another question is how astrocytic metabolism behaves during activation. A recent study using ex vivo autoradiography with 14C-labeled acetate at the carbon 2 position suggested that astrocytic oxidative metabolism increases with brain activity (Cruz et al, 2005). Labeled acetate is a promising candidate to investigate astrocytic oxidative metabolism in vivo because it is selectively taken up and metabolized by astrocytes (Hassel et al, 1992; Muir et al, 1986; Waniewski and Martin, 1998). Earlier studies in the heart muscle have further revealed that quantitative measures for oxygen consumption can be derived from the washout rate of label after injection of radiolabeled acetate (Buck et al, 1991). Acetate can be labeled in the 1- or 2-carbon position. Whole-body studies using 13C-labeled acetate demonstrated that labeled CO2 is produced during the second or third turn in the TCA cycle, depending on whether 1-13C-acetate or 2-13C-acetate was used (Wolfe and Jahoor, 1990). However, these results reflect whole-body metabolism, brain-specific reactions cannot be directly derived from them. In brain, with 1- and 2-labeled acetate there was substantial labeling of amino acids, such as glutamate, glutamine, and aspartate and further TCA cycle intermediates as shown in older and more recent literature (Badar-Goffer et al, 1990; Berl and Frigyesi, 1969; Lebon et al, 2002; Tyce et al, 1981; Tyson et al, 2003; Van den Berg et al, 1969; Van den Berg and Ronda, 1976). However, the static measurement of metabolites at single time points yields only limited information on astrocytic oxidative metabolism.
In this study we applied 1-11C-acetate and dynamic measurements to investigate astrocytic oxidative metabolism. Specific questions were (1) what is the extraction fraction (EF) of the tracer, (2) what is the kinetic behavior at baseline and during stimulation, (3) how does dichloroacetate, an agent that increases the production of acetyl-coenzyme A (CoA) from pyruvate in the cell, change the kinetics of 1-11C-acetate, and (4) is the loss of radiolabel dependent on blood flow. Studies were performed in rats and humans. In rats data were acquired using a β-scintillator, in humans we applied positron emission tomography (PET).
Materials and methods
Automated Radiosynthesis of Sodium 1-11C-Acetate
11C-CO2 was produced by the 14N(p,α)11C nuclear reaction using a nitrogen gas (N2/0.5% O2) target. 11C-CO2 was bubbled at room temperature in a mixture of methylmagnesium bromide (3 mol/L solution in diethyl ether; Fluka, 70 μL, 0.21 mmol) and dry diethyl ether (3 mL) placed in the reactor, where the chemical trapping of the 11C-CO2 by C-carboxylation of the Grignard reagent takes place instantly. After delivery (10 mins) the reaction was quenched by automated addition of nearly equimolar amount of acid (1 mL 0.2 mol/L aqueous HCl, 0.2 mmol HCl) and the diethyl ether from the bilayer mixture was removed by evaporation in a stream of nitrogen (100 mL/ min) for approximately 10 mins. The residual water solution of 1-11C-acetic acid was automatically drawn into the loop of the preparative chromatograph (Merck-Hitachi chromatograph equipped with L-4000A UV detector at 254 nm, isocratic pump L-6000A, 5 mL loop, and radiation detector Radiation Monitor; Eberline Instrument Corporation, Santa Fe, NM, USA), injected into a semipreparative reversed phase column (Polymerx, 10 mm, 250× 10 mm, Phenomenex) and eluted with a mixture of sterile salt physiologic solution as the mobile phase. The fraction corresponding to the 1-11C-acetic acid (tR = 7 mins) was collected to give up to 10 GBq activity of no-carrier-added sodium 1-11C-acetate with over 99% radiochemical purity and specific activity of approximately 400 GBq/μmol at the end of the synthesis in 10 mL sterile isotonic, buffered at physiological pH solution. The radiolabeling was performed in a lead shielded cell using a computer-assisted homemade automatic apparatus controlled by LabVIEW software (National Instruments) via Modulink and RS232 interfaces.
Radiotracer Experiments
Experiments were performed in animals using the β-scintillator and in humans using PET. All animal experiments were approved by the local veterinary authorities and were performed in accordance with their guidelines. The experiments were performed by licensed investigators. The animals were kept in cages in a ventilated cabinet with standardized conditions of light (night/day cycle 12/12 h) and temperature and free access to food and water. Before the experiment the animals were fasted overnight. A total of 29 Sprague-Dawley rats (5 for the EF determination, 24 for the different experimental paradigms (for details see below)) weighing 310 ± 41 g (mean ± s.d.) were included in the study.
The human study population was composed of 6 healthy male volunteers aged between 24 and 36 years without any known neurological impairments. All subjects were studied at the University Hospital Zurich. Informed written consent was obtained from all subjects before the beginning of the experiment. The protocol was approved by the Local Ethics Committee.
Magnetic resonance scanning was performed on each subject (Twin Speed; GE Medical Systems, Milwaukee, WI, USA) to rule out any cerebral pathologies and for anatomical coregistration of the PET scan.
Animal Preparation
Surgery was performed under isoflurane anesthesia and involved the placement of an arteriovenous shunt from the right femoral artery to the right femoral vein, tracheotomy for mechanical ventilation, and exposition of the skull with subsequent thinning of the bone above the primary somatosensory cortex using a dental drill. The actual experiment was then performed under urethane anesthesia (1400 mg/kg, i.p.). The arteriovenous shunt was used for the injection of the tracer, collection of blood samples for metabolite analysis, the monitoring of arterial blood pressure, and the continuous measurement of total arterial 11C activity. For the latter purpose, the shunt was run through a coincidence counter (GE Medical Systems) that stored the whole blood radioactivity concentration at 1-sec intervals. The online arterial sampling procedure is described in detail elsewhere (Weber et al, 2002).
ᵝ-Scintillator
The ᵝ-scintillator (Swisstrace, Zurich, Switzerland) has been described in detail earlier (Weber et al, 2003; Wyss et al, 2007). In short, it consists of a scintillation tip (Bicron, BF12, Newbury, OH, USA) with a length of 1 mm and a diameter of 0.25 mm attached to a high numerical aperture glass fiber. The scintillator was made light tight by applying a uniform coating of silver particles. The scintillations were measured using a photomultiplier tube and counting electronics (Perkin Elmer, MA, USA). The limited range of ᵝ-particles within biological tissues leads to a limited detection volume centered around the scintillating tip of the probe. Monte Carlo simulations demonstrated that for C-11 the distance required to detect 90% of the ᵝ-particles around the probe is 2.0 mm (Pain et al, 2002). The sensitivity of the used ᵝ-scintillator was in the range of 0.036 to 0.047 cps/kBq/cc.
The scintillator was inserted into the cortex using a stereotactic frame (David Kopf Instruments, Tujunga, CA, USA). At the insertion point, which was approximately (according to Bregma) 1 mm posterior and 5 mm lateral, the thinned bone was removed and the dura was carefully incised. The scintillator tip was decreased 1.4 mm below the dura. In the stimulation experiments, the correct position was verified by Laser Doppler flowmetry (Periflux System 5000; Perimed AB, Järfälla, Sweden). This position was adjusted to avoid large superficial blood vessels. Only one scintillator penetration was performed per animal. The count rate was stored on a personal computer using a bin width of 1 sec yielding tissue time-activity curves.
Positron Emission Tomography
All subjects were scanned on a whole-body PET/computer tomography-scanner (Discovery ST-RX; GE Medical Systems, Waukesha, WI, USA). This is a scanner with an axial field of view of 14.6 cm and a reconstructed in-plane resolution of approximately 7 mm. Before the positioning of the subjects in the scanner, a radial artery was cannulated for timed arterial blood sampling. An additional catheter for administration of the radiotracers was placed in the contralateral antecubital vein. At the beginning of each study, a low-dose computer tomogram for attenuation correction was performed.
Experimental Protocols
Cerebral blood flow measurements using H215O: First Pass Extraction Fraction: The first pass EF of 1-11C-acetate at baseline was determined according to the relationship EF = K1/CBF, where K1 is the transport parameter of the one-tissue compartment model and CBF is cerebral blood flow. Cerebral blood flow was determined in five animals using 15O-labeled water injected before measurement of 1-11C-acetate kinetics. In the human study CBF was measured in all subjects 10 mins before the 1-11C-acetate injections. The visual stimulation was interrupted between CBF and acetate measurements. Approximately 300 MBq H215O was injected intravenously using an automatic injection device. After the arrival of the bolus in the brain, the acquisition of a series of 18 frames (10 secs each frame) was started.
Measurements of 1-11C-Acetate Kinetics During Different Conditions
In the animal experiments, two injections spaced 30 mins apart were administered. Data were acquired for 20 mins after the injection (slow injection over a period of 30 secs) of 230 to 260 MBq (diluted in 0.5 mL) of radiotracer. This part of the study included 24 animals, which were distributed among the following experimental subgroups: (1) in this group the baseline was followed by electrostimulation (bas—stim); (2) the order was reversed (stim—bas). Groups (1) and (2) were examined with respect to a potential order effect. (3) To evaluate the reproducibility two consecutive baseline measurements were performed (bas—bas). (4) In four animals the effect of acetazolamide (Diamox, 66 mg/kg), a carbonic anhydrase inhibitor increasing CBF but not oxygen consumption (CMRO2; Okazawa et al, 2001), on the kinetics of 1-11C-acetate was examined. After 20 mins of baseline acquisition, acetazolamide was intravenously injected over 1 min. Ten minutes later the same amount of 1-11C-acetate was injected for the second time. In a last group (5) the effect of dichloroacetate was investigated. Four hours after the injection of dichloroacetate (50 mg/kg, Sigma-Aldrich Product No. 347795, Buchs, Switzerland) a baseline study was followed by electrostimulation (dichloroacetate challenge). Dichloroacetate was dissolved in physiological saline and was adjusted to pH 7.4.
To activate the whisker-to-barrel pathway the infraorbital branch of the trigeminal nerve was electrically stimulated with two stainless steel electrodes. The cathode was inserted through the infraorbital hiatus and the anode was positioned in the masticatory muscle on the ipsilateral side. The current was adjusted to 2 mA, and 2 Hz stimulation frequency was chosen because previous measurements using 18F-fluorodeoxyglucose-autoradiographies demonstrated this frequency to be optimal eliciting a maximal increase in glucose consumption of 70% to 80% (unpublished data). The stimulation started 30 secs before the tracer injections. To check the effectivity of the applied stimulation and the effect of acetazolamide in group (4) animals, a Laser Doppler flowmetry probe was fixed just above the primary somatosensory cortex to follow regional CBF changes.
In humans, PET was performed under baseline conditions with eyes closed and during visual stimulation using different video clips presented on a screen (Charlie's Angels and Rolling Stones). In three subjects the baseline examinations preceded the stimulation studies and in the other three subjects the order was reversed to rule out any order effect. The visual stimulation was started 20 secs before scan start and continued during complete PET acquisition. After the intravenous injection of 250 MBq 1-11C-acetate, administered as a slow bolus over approximately 60 s, data were recorded for 20 mins (25 frames: 6× 20, 3× 40, and 16× 60secs).
Time-activity curves were derived from volumes of interest defined on three consecutive slices on the anatomical magnetic resonance scans and subsequently transferred to the PET data. Volumes of interest were drawn in the visual cortex as the target region and in the frontal cortex and cerebellum as references.
Statistics
The Wilcoxon signed rank test for dependent samples was used to evaluate differences between within-subject conditions and the Mann—Whitney U-test was used for group differences. The criterion for significance was set at P < 0.05. Values are expressed as mean ± s.d.
Data Acquisition and Analysis
The details are described in the appendix.
Results
Animal Studies
Metabolites of 1-11C-acetate in the blood: High-pressure liquid chromatography identified 11C-CO2 as the only metabolite in blood. The time course of the fraction of authentic 11C-acetate in arterial plasma is demonstrated in Figure 1. The pH and arterial blood gases were all in the physiological range (pH = 7.35 to 7.45; pCO2 = 35 to 45 mmHg; pO2 = 70 to 100 mmHg). Plasma lactate levels were also determined as lactate competes with acetate for the uptake into brain. They ranged between 1.4 and 2.1 mmol/L. However, no relationship between plasma lactate levels and changes in the kinetics of 1-11C-acetate could be found. Only in group 5 (dichloroacetate challenge) there was a statistically significant difference in plasma levels between the two different modalities (see below).
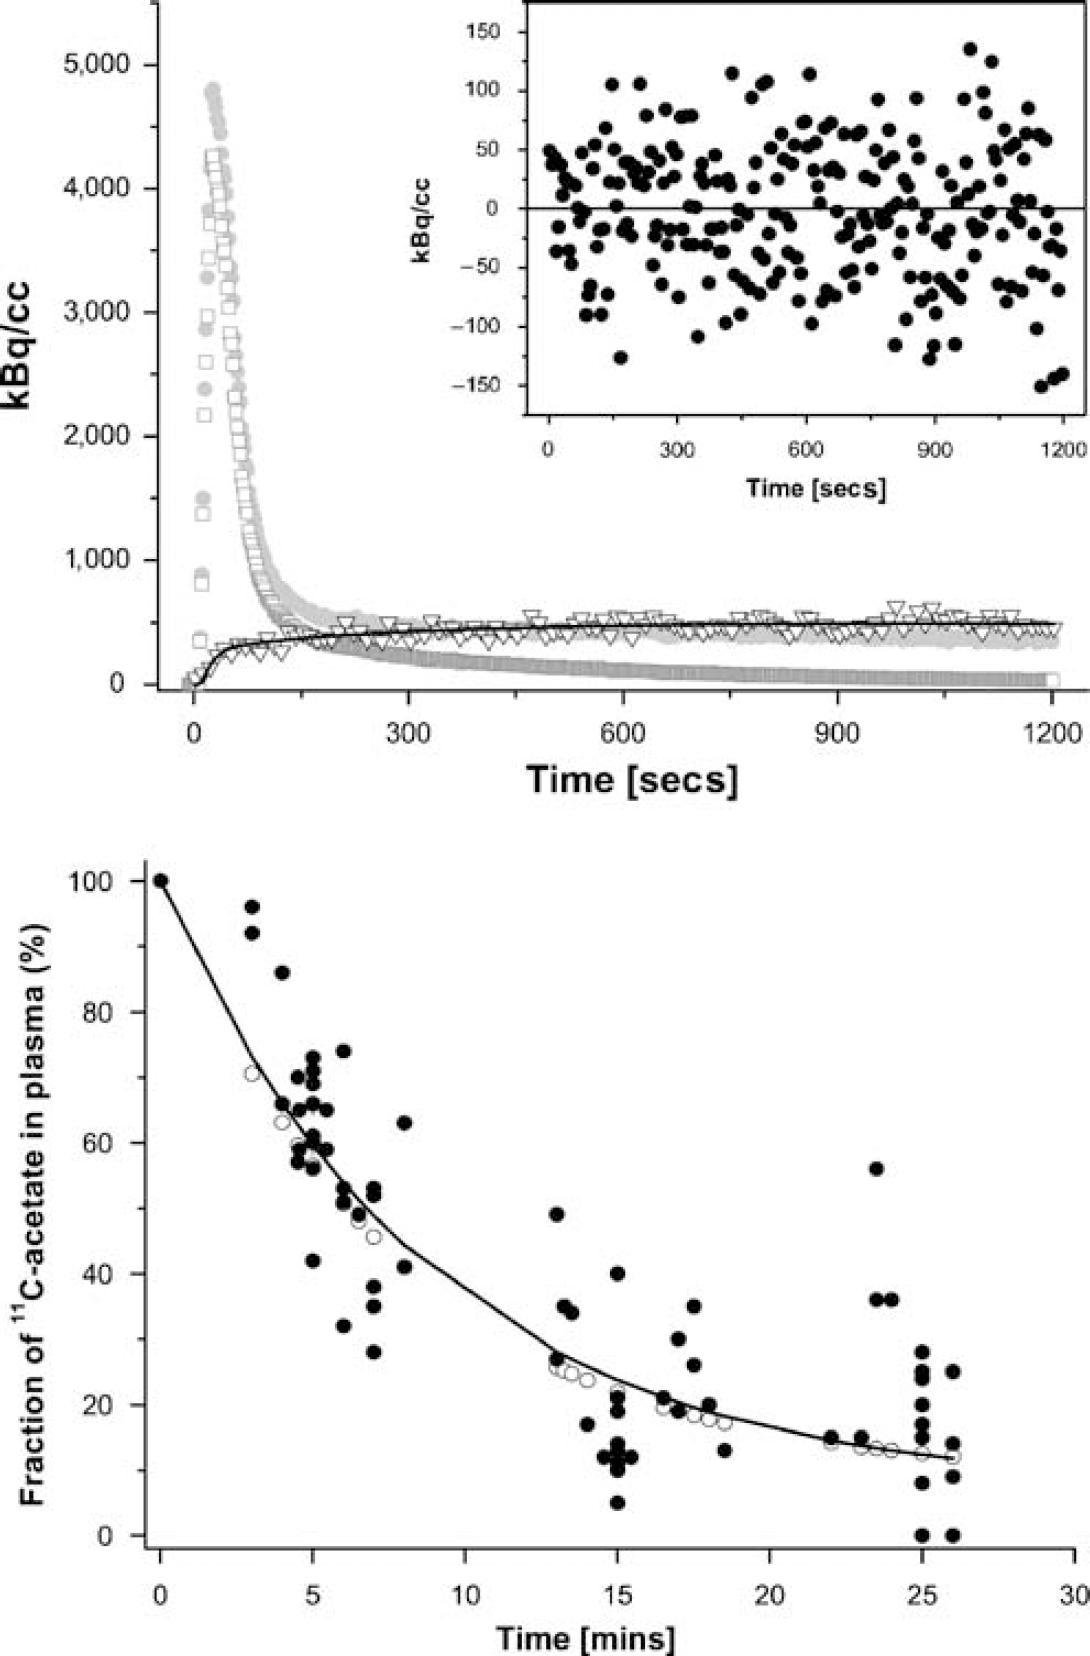
In the upper panel the time course of 11C radioactivity in whole blood (●), plasma (□), and brain tissue (▼) acquired over 20 mins is shown. In addition the model fit is demonstrated (straight line, K1 = 0.085 mL/min/mL tissue, k2 = 0.015 per minute). The goodness-of-fit is demonstrated by the random distribution of the residuals, demonstrated in the insert. In the lower panel the fraction f of true 1-11C-acetate in plasma in animal and human studies is plotted. The filled circles represent data points from animal studies (anesthetized rats) and the solid line is the corresponding fit of the function f =100-α(1-exp(−μt)). Least squares fitting yielded α = 93% and μ = 0.11 per minute. In the human study (open circles; conscious humans), α and μ were taken from previous experiments which had yielded very similar values (α= 91%, μ = 0.13 per minute) (Buck et al, 1991).
First pass extraction fraction: CBF was measured in 5 baseline experiments and was 56 ± 16 mL/min/ 100 g. The first pass EF of 1-11C-acetate calculated in these experiments was 18%± 5%.
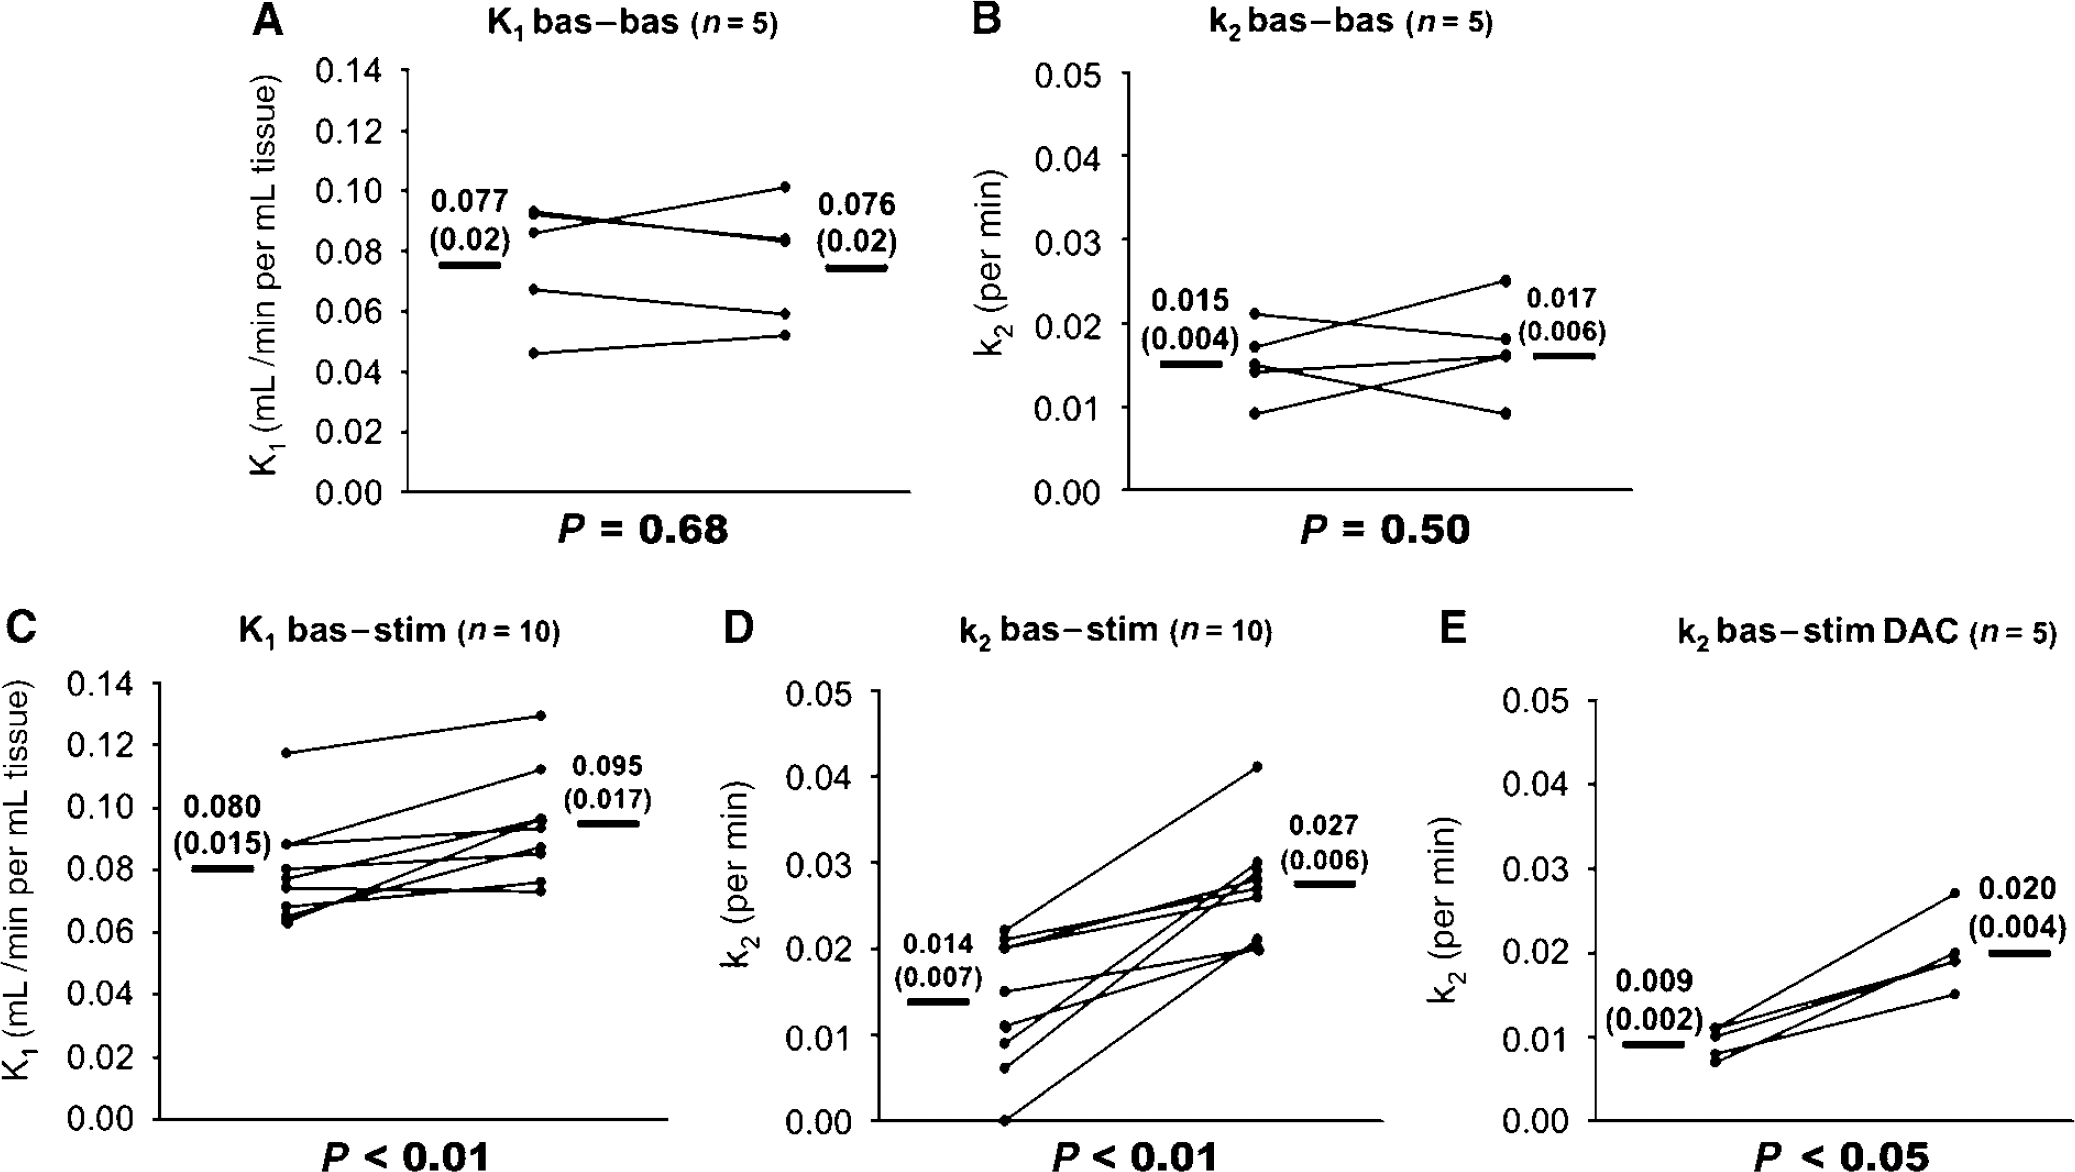
Reproducibility of the 1-11C-acetate measurements: The reproducibility of the time—activity curves and of the parameters K1 and k2 is demonstrated in the top graphs of Figures 2 and 3. In contrast to trigeminal nerve stimulation, the tissue time—activity curves in the two sequential baseline experiments look identical. The difference of the mean K1 (K1 experiment 2—K1 experiment 1) was —0.001, and for k2 the difference was 0.002 per minute.
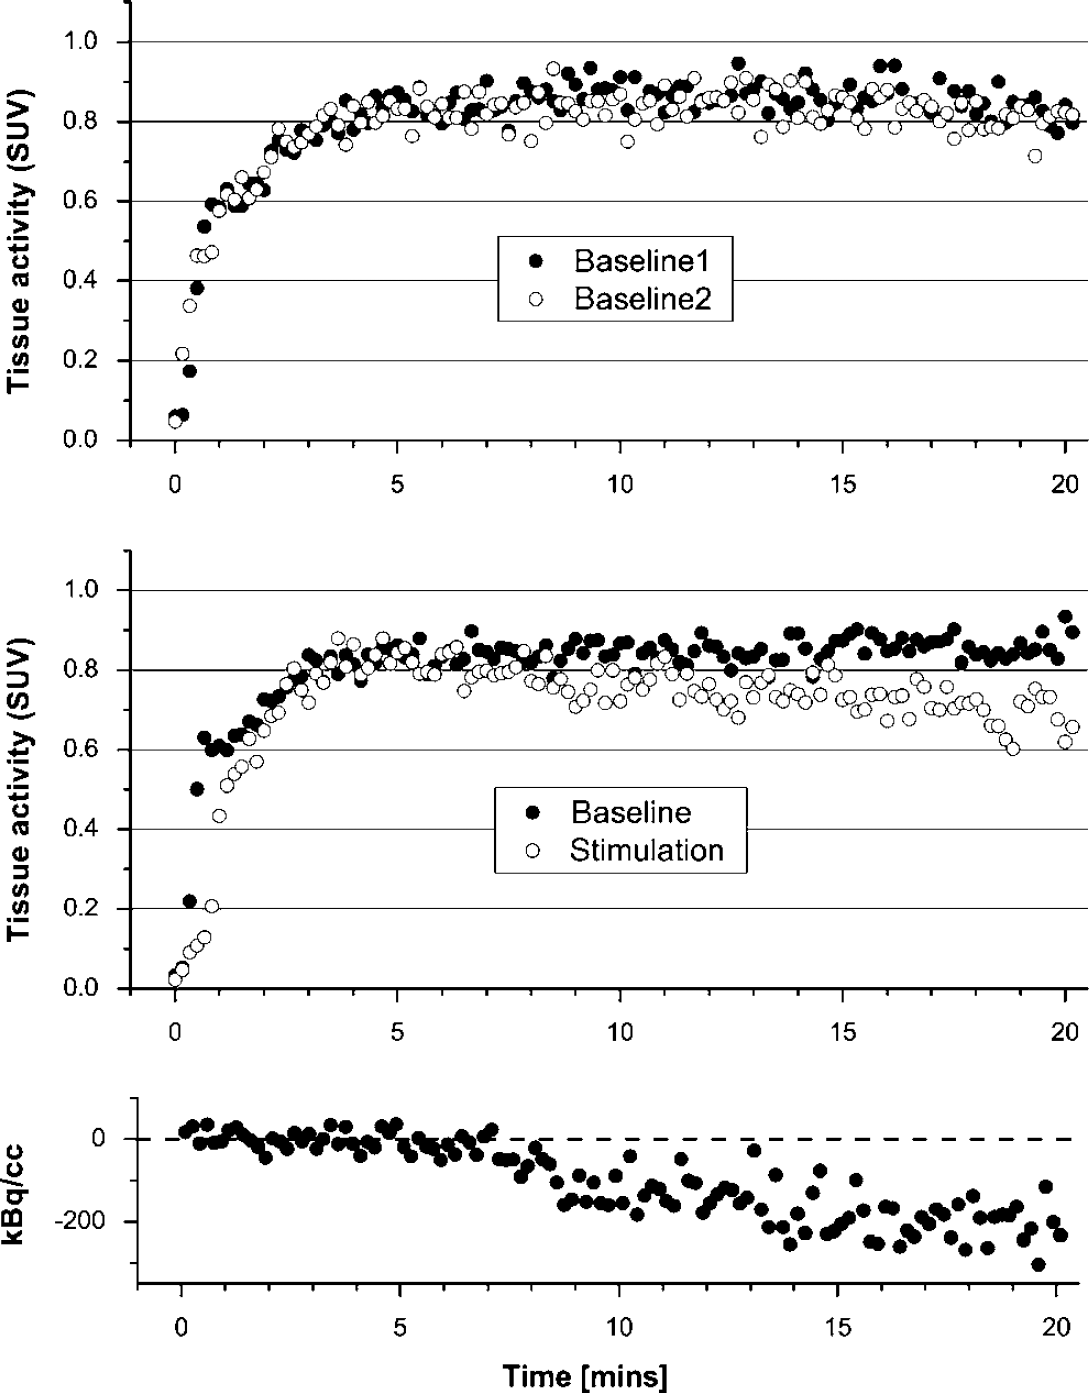
The top and middle graph demonstrate time—activity curves of 11C activity in rat brain tissue normalized to injected activity per g bodyweight yielding standardized uptake values (SUV). The curves represent mean data from five experiments. In the baseline—baseline experiments (top panel) the curves appear identical. In contrast, the washout of 11C activity is remarkably larger during stimulation (middle panel). The bottom panel illustrates the residuals between fit and data if only the first 5 mins of data are fitted. Such a short fit yields substantially lower initial washout rates than a 20 mins fit, demonstrating that the onset of the washout of radiolabel from tissue is delayed.
Summary of animal data. Panels (
1-11C-Acetate kinetics during infraorbital nerve stimulation: The electrical infraorbital nerve stimulation increased the washout of 1-11C-acetate as shown in the middle graph of Figure 2. The order of the experiments (baseline-stimulation or stimulation-baseline) had no significant effect on the changes of the kinetic parameters (Figures 3C and 3D). Therefore the two groups (1) and (2) (bas—stim and stim—bas) were pooled. During stimulation, k2 increased by 93% from 0.014 ± 0.007 to 0.027 ± 0.006 per minute (P < 0.01) in the primary somatosensory cortex. In parallel, K1 increased from 0.080 ± 0.015 at baseline to 0.095 ± 0.017 (P < 0.01). The efficacy of the stimulation was confirmed by the increase of the laser Doppler flowmetry signal by 20 to 25% (data not shown).
To check for a delayed onset of the radioactivity washout, the first 5 mins of data were refitted with only k2 as a free parameter. In this dataset, k2 decreased from 0.014 ± 0.007 to 0.001 ± 0.002 in the baseline experiments and from 0.027 ± 0.006 to 0.003 ± 0.004 in the stimulation experiments. An example of a 5 mins fit is illustrated at the bottom of Figure 2. The low k2 of 0.001 fits the initial data well, then the washout is clearly increased.
Effect of acetazolamide on k2: In the 4 experiments k2 was 0.016 ± 0.002 at baseline and 0.016 ± 0.002 per minute 10 mins after acetazolamide injection. Laser Doppler flowmetry showed a signal increase of 61.1% ± 8.1%.
Effect of dichloroacetate on k2 during baseline and stimulation: Dichloroacetate pretreatment decreased arterial plasma lactate from 1.5 ± 0.1 to 1.25 ± 0.2 mmol/L (mean ± s.d.; P < 0.05) but exerted no change of arterial blood gases which stayed in the physiological range. Four hours after intravenous dichloroacetate administration, k2 was less at baseline and during stimulation, compared with the experiments without dichloroacetate. At baseline the values were on average 36% less (0.009 ± 0.002 compared with 0.014 ± 0.007), however, this difference failed to reach significance (n = 5; P = 0.15). During stimulation k2 was 26% less (n = 5; P < 0.05) than that in the experiments without administration of dichloroacetate (0.020 ± 0.004 compared with 0.027 ± 0.006). There was still a significant 122% increase of k2 from baseline to electrostimulation (from 0.009 ± 0.002 to 0.020 ± 0.004; n=5; P < 0.05; Figure 3E).
Relationship of the tissue activity and changes of the washout rate k2: This relationship is a measure of the parameter identifiability. A larger change of the tissue activity with a unit change of k2 is associated with a better parameter identifiability. The sensitivity analysis demonstrated that at 20 mins, a 10% change in k2 led to a 2.1% change in tissue activity at baseline (k2 = 0.014 per minute) and to a 3.8% change during stimulation (k2 = 0.027 per minute). Furthermore, the activity change in tissue was linear in the investigated range 0 to 30% k2 change.
Human Studies
1-11C-Acetate kinetics present the same characteristics as in animal studies: In all subjects the blood gas parameters were always in the physiological range (pH = 7.35 to 7.45; pCO2 = 35 to 45 mm Hg; pO2 = 70 to 100 mm Hg). An illustration of the effect of the visual activation on the kinetic of 1-11C-acetate is demonstrated in Figure 4 and the quantitative values are shown in Figure 5. The calculated EF of 1-11C-acetate in visual cortex was 19 ± 4% at baseline and 13±3% during stimulation. The visual stimulation increased mean CBF in visual cortex by 64% (P < 0.05). In the control regions, ‘cerebellum’ and ‘frontal cortex,’ no significant change of the CBF was noticed. In visual cortex mean K1 and k2 values of 1-11C-acetate were 11% and 62% (P < 0.05 for both) higher during stimulation as shown in Figures 5F and 5I. No significant changes of K1 or k2 were noted in frontal cortex and cerebellum. However, in frontal cortex K1 and k2 data are somewhat distorted by a single subject, which showed a decrease of the values in this region in response to visual stimulation.
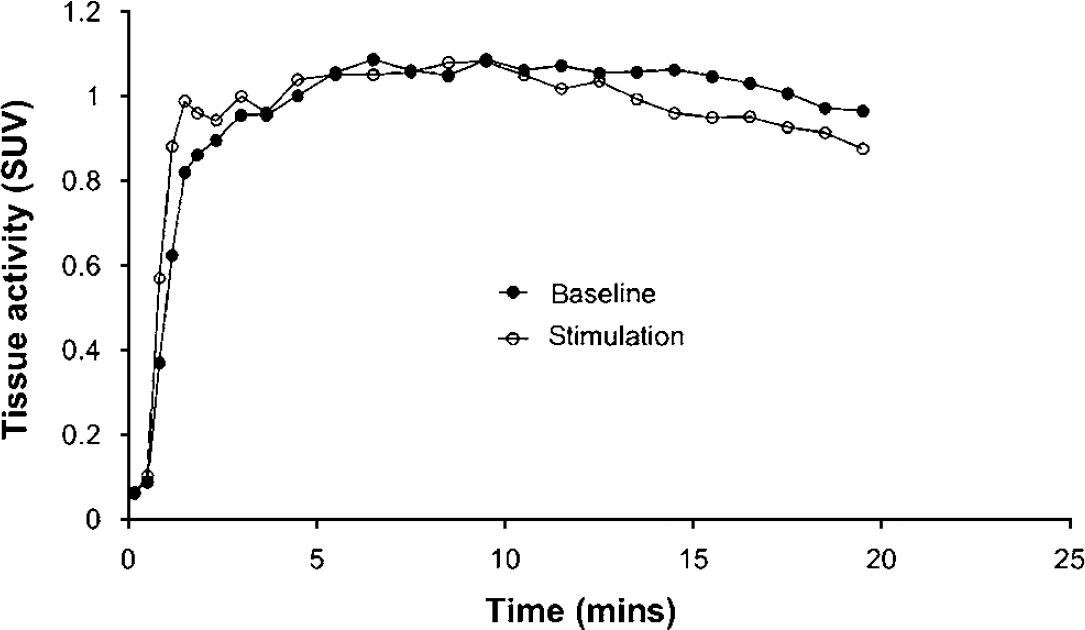
Time—activity curves of 1-11C-acetate uptake in the human visual cortex normalized to injected activity per kg bodyweight yielding standardized uptake values (SUV). The curves represent mean data from all six human experiments. During visual stimulation the clearance of 11C activity is larger compared with baseline. Note also the modestly faster wash-in of radioactivity during stimulation.
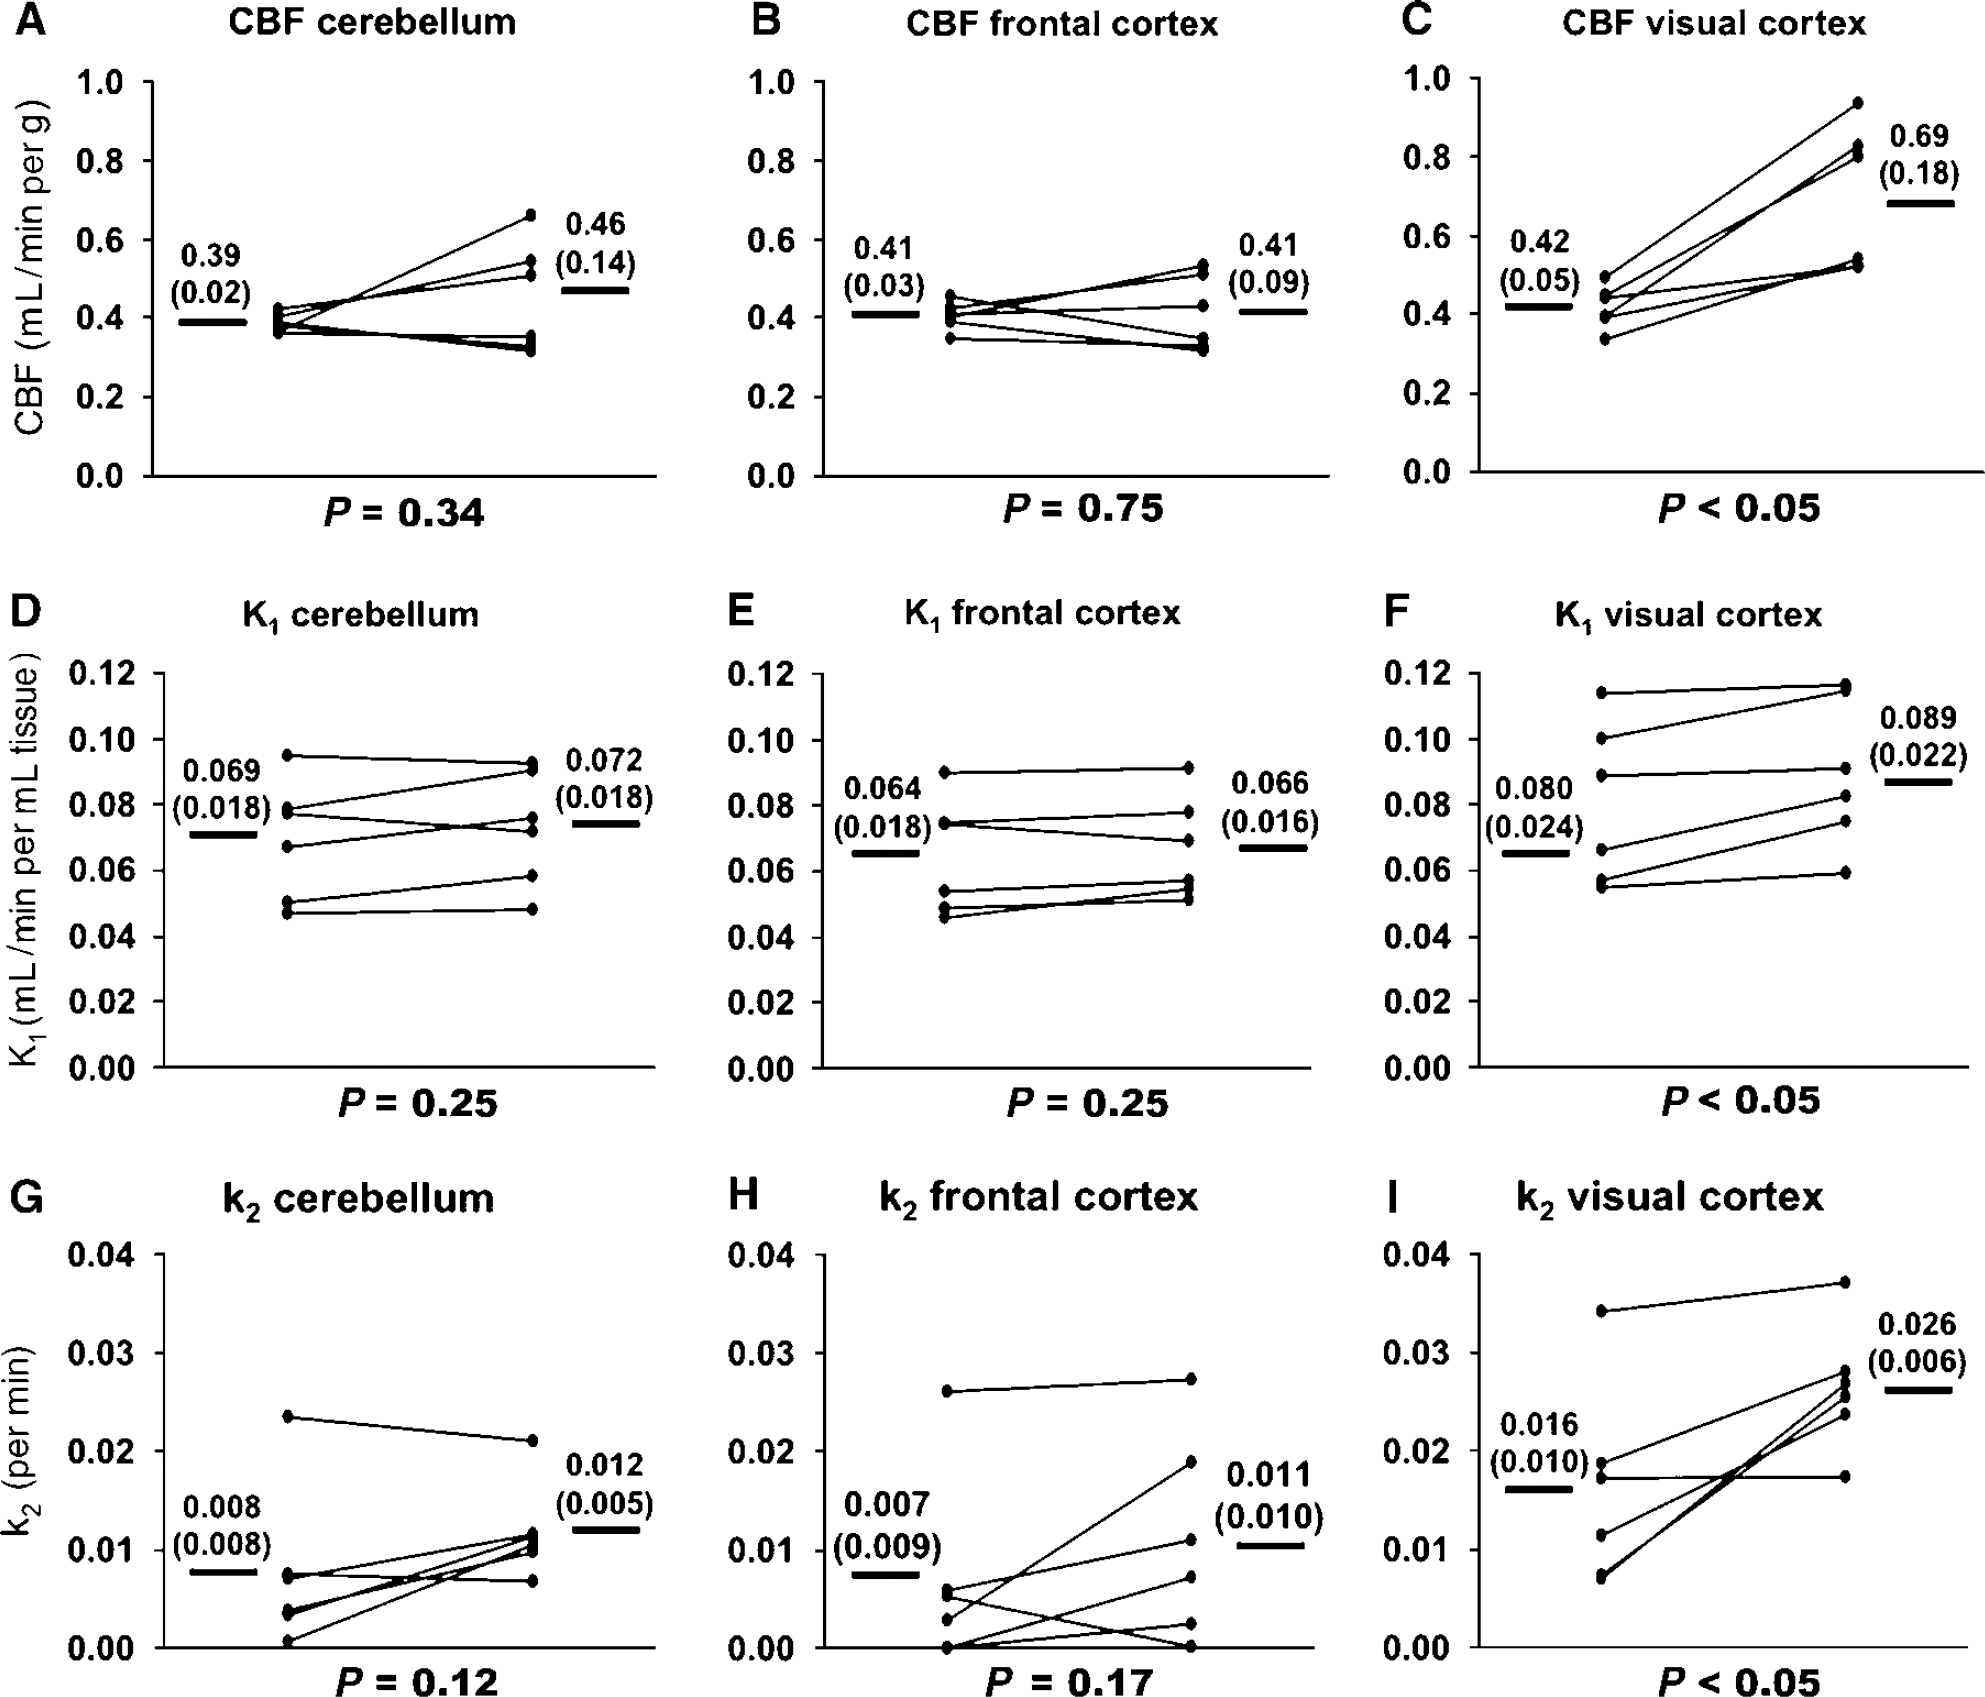
Summary of human data. The change of CBF from baseline to visual stimulation in the three examined brain areas is demonstrated in the top panels (
Discussion
It was previously suggested that the astrocyte-specific substrate acetate allows to measure metabolism in human brains in vivo (Hosoi et al, 2004; Muir et al, 1986). However, to our knowledge this is the first study using label clearance from brain after 1-11C-acetate administration for the investigation of astrocytic oxidative metabolism in vivo. Labeled acetate was already used in various studies to illuminate certain aspects of astrocytic metabolism. Some groups used autoradiographical determination of 14C-acetate uptake (Cruz et al, 2005; Muir et al, 1986), other groups measured the metabolic fate of acetate by measuring the appearance of labeled compounds as the label traveled through the TCA cycle (e.g., Badar-Goffer et al, 1990; Berl and Frigyesi, 1969; Lebon et al, 2002; Van den Berg and Ronda, 1976).
Our study demonstrates for the first time the changes of 1-11C-acetate kinetics during stimulation in vivo, which are thought to be correlated with the changes of astrocytic oxidative metabolism. Although total cerebral CMRO2 can be successfully measured in vivo using PET and inhaled 15O2 (Mintun et al, 1984; Yee et al, 2006), a direct in vivo measurement of CMRO2 in astrocytes alone is not available.
K1 and Extraction Fraction
Compared with the heart where 1-11C-acetate is almost 100% extracted, the cerebral EF is approximately 5-fold less. Nevertheless, brain uptake is large enough to allow quantification. One consequence of the lower EF is the blunted increase of K1 compared with CBF during stimulation. In the human study K1 increased 11% compared with a 64% increase in CBF (visual cortex).
Quantitative Relationship Between k2 and Astrocytic CMRO2
In the following discussion about the meaning of the rate constant k2 we provide arguments that k2 may be strongly related to CMRO2. However, it is clear that a direct proof is not given and would be difficult to establish, as there is actually no data available to prove this conclusion directly. One major reason is that a direct measurement of astrocytic CMRO2 is yet impossible in vivo.
We hypothesize that k2 is directly related to CMRO2 in the astrocytes as has been demonstrated in the heart for the myocytes (Buck et al, 1991). Prerequisites for this hypothesis are (1) the washout of radioactivity from the volume of interest is indeed because of the loss of 11C-CO2 and (2) the ratelimiting step determining k2 is the production of 11C-C02 and not its removal.
Prerequisite (1): There seems to be no doubt that at least part of the radioactivity loss is because of 11C-C02, because the production of labeled C02 from exogenous 1-14C-acetate has been proven in astrocyte cultures (Waniewski and Martin, 1998). However, a quantitative proof of prerequisite (1) would be difficult. One theoretical possibility would be the measurement of the arteriovenous difference of 11C-CO2. However, a first order estimation of this difference demonstrates that it would be in the order of 4% of the total blood counts. The conclusive demonstration of such a small difference would require a prohibitively large amount of animals.
Prerequisite (2): It is well known that C02 diffuses practically freely across the bloodbrain barrier (Paulson, 2002). It could therefore theoretically be possible that the removal of CO2 by the blood is a limiting factor for the washout of CO2. However, the lack of a change of k2 after the acetazolamide-induced blood flow increases demonstrates that the removal of the radioactivity from the volume of interest is not a limiting factor.
Other arguments which point at a strong relationship between k2 and astrocytic CMRO2 are (1) the increase of k2 during stimulation, (2) the delay of the onset of the label washout and the decrease of the K1/k2 ratio during stimulation, (3) the behavior of k2 under dichloroacetate, and (4) reasonable values of astrocytic CMRO2 can be obtained by applying the calibration established in the dog heart.
Changes of k2 During Increased Brain Activity
Parameter k2 significantly increased during stimulation. In the animal study, k2 almost doubled from baseline to infraorbital nerve stimulation, indicating a substantial increase in oxygen consumption. In the human study, the increase in the visual cortex was 63%. Although not significant, there also seemed to be a trend toward higher values in cerebellum and frontal cortex. In fact, omitting the subject with a decreased value during stimulation, the increase became significant, not surprising considering the connectivity in the brain.
Delay of the Washout Onset and the Decrease of the K1/k2 Ratio During Stimulation
Another result pointing at 11C-CO2 as the washout agent is the delay of the washout onset (bottom graph of Figure 2). Such a delay for the appearance of labeled CO2 was demonstrated by Waniewski and Martin (1998) in cultured astrocytes and is explained by the fact that labeled CO2 is only produced in the second turn of the label in the TCA cycle. If the loss of label was substantially because backdiffusion of labeled acetate, one would not expect a delay. Furthermore, if backdiffusion of labeled acetate was the main factor determining k2, one would expect the same effect of stimulation on K1 and k2, that is, the ratio K1/k2 would remain constant. However, the data demonstrate a markedly lower ratio during stimulation. In the anesthetized rat studies, the mean ratio dropped 44% (P = 0.08), in the studies with dichloroacetate the decrease was 53% (P = 0.001) and in the human visual cortex the ratio dropped 44% (P = 0.048). This behavior suggests that the labeled compounds entering and leaving the brain tissue are different. The mentioned points are all consistent with the hypothesis that the washed out compound is indeed 11C-CO2. However, we cannot completely exclude that some label loss is because of release of other labeled substrates, particularly because of efflux of glutamine, which is quickly labeled after injection of radiolabeled acetate (Cremer, 1970). Despite the fact that the blood-brain barrier is closed for the passage of glutamate and glutamine from blood to brain, the reverse direction seems possible. Glutamine is taken up by endothelial cells and intracellularly converted by the enzyme glutaminase to glutamate. When the glutamate concentration within endothelial exceeds the one in plasma net transport of glutamate takes place through facilitative transporters (Hawkins et al, 2006). The high number of steps involved in this process and the fact that normal plasma concentration of glutamate is approximately 10 times higher than glutamate concentration in the extracellular fluid of the brain (Hawkins et al, 2006) indicate that this process is slow and probably not of relevance during our acquisition period of 20 mins.
Pharmacological Interventions Using Dichloroacetate and Acetazolamide
The dichloroacetate experiments are also consistent with the hypothesis that k2 is related to CMRO2. This compound activates pyruvate dehydrogenase (Abemayor et al, 1984) by inhibiting its phosphorylation by the PDH kinase (Whitehouse et al, 1974). As a consequence more pyruvate is converted to acetyl-CoA and less to lactate and the concentration of acetyl-CoA is expected to increase. If the rate constants in the following chain of acetyl-CoA oxidation, which are expected to be related to k2, remained the same, the rate of the acetyl-CoA metabolism would increase and with it most likely CMRO2. However, as the energetic demand is unchanged there is no reason why CMRO2 should increase. Consequently one would expect a decrease in k2 and this is exactly what was observed, at baseline as well as during stimulation. A good candidate for regulation at this stage is citrate synthase, which condenses acetyl-CoA and oxaloacetate into citrate. It has been documented that this enzyme is inhibited by increased concentrations of acetyl-CoA (Bayer et al, 1981). This inhibition could be a major reason for the observed decrease of k2 after dichloroacetate. Furthermore, the suggested increase of the cold acetyl-CoA concentration under dichloroacetate is itself indirect evidence for the ability of astrocytes to completely oxidize glucose, as is the work by Lovatt et al (2007), which confirmed significantly higher relative expression of almost all TCA-cycle enzymes in freshly isolated astrocytes than neurons and showed that the oxidative pathways were active in astrocytes.
Analogy with Previous Heart Studies
The idea to use the washout rate k2 of 1-11C-acetate as a marker of CMRO2 was inspired by earlier studies performed in the heart (Armbrecht et al, 1990; Buck et al, 1991; Lindner et al, 2006). In those studies it was clearly established that k2 reflects myocardial oxygen consumption in a linear fashion. One rough indication that this approach may also be valid in the brain is derived from the following estimation. In the dog heart, the relationship between CMRO2 and k2 was CMRO2 (mL/min/ 100 g) = 48.8 mL/100 g × k2, (per minute). Application of this relationship to this study yields an astrocytic CMRO2 of 0.7 mL/min per 100 g in rats and humans at baseline. This amounts to approximately 20% of whole brain oxygen consumption (3.4 ± 0.28 mL/min per 100 g in humans (Kety and Schmidt, 1948)). This value compares favorably to the published values for the fraction of astrocytic ATP generation by oxidative processes (Hertz and Kala, 2007; Hertz et al, 2007; Oz et al, 2004) which are in the range of 14% to 30%.
Is k2 Specific for Astrocytic Metabolism?
One important observation in this regard is that labeled acetate is taken up only by astrocytes and not neurons (Waniewski and Martin, 1998). However, a fraction of the label will eventually end up in neurons as labeled glutamine/glutamate (via the glutamate/glutamine cycle), which was produced via the α-ketoglutarate-glutamate step in the astrocytes. Nevertheless, the transfer of labeled glutamine to neurons is slow relative to the 20 mins acquisition time of this study. Lebon et al (2002) investigated astrocytic energy metabolism using nuclear magnetic resonance spectroscopy and 2-13C-acetate in humans. They concluded that the labeled glutamine/glutamate observed during the first 20 mins after the start of the 2-13C-acetate infusion reflected astrocytic glutamate only. It therefore seems reasonable to assume that most of the 11C activity measured in our study was originating from astrocytes. Even if a small fraction of labeled glutamine/glutamate had reached the neurons, the contribution of neuronal 11C-CO2 production could be expected to have been small. Hertz et al (1988) demonstrated in cell cultures, that glutamate oxidation of neurons was at most 25% of the one in astrocytes. In addition, a recent work found a 4.3-fold higher expression of the enzyme glutamate dehydrogenase Glud1 in astrocytes, also suggesting a substantially higher capacity for astrocytes to metabolize glutamate (Lovatt et al, 2007).
Comparison of the k2 Method with Autoradiography
Cruz et al (2005) investigated the accumulation of 2-14C-acetate during acoustic stimulation in rats using autoradiography performed 5 mins after tracer injection. They reported a 15 to 18% increase of 2-14C-acetate uptake in the stimulated compared with the contralateral structures. These results are in line with our experiments. At 5 mins, the uptake of 1-11C-acetate was 14% higher in the stimulation compared with the baseline experiments (Supplementary Figure S1). This value was calculated by simulating tissue time—activity curves with a mean input curve and the mean K1 and k2 values of the stimulation and baseline experiments. Here, it is crucial to point to an important difference in the methodology. By evaluating just one time point as in autoradiographic studies, it is not easy to determine to what degree the differential uptake is influenced by increased blood flow, although this influence seems to be low for acetate (Dienel et al, 2007), but probably not negligible as our demonstration of a small K1 increase during stimulation suggests. To separate delivery and washout, a kinetic approach as chosen in this study seems advantageous. However, autoradiographic studies deliver images and, when using the long-lived 14C, allow an easier determination of metabolites.
Using the short-lived isotope 11C we simply concentrated on two aspects of the label kinetics, delivery, and washout. We cannot deliver any data concerning the fate of the label between these steps, which may be very complex. An indication of this complexity is demonstrated in the model of Figure 6. Previous work by Berl and Frigyesi (1969) demonstrated (1) that 5 mins after injection of 1-14C-acetate most label is found in amino acids and (2) that there is a decline of their concentration afterwards. This may indicate that most acetate oxidation happens indirect via amino acids. More extended information on the fate of the label are found elsewhere (Dienel et al, 2007; Berl and Frigyesi, 1969). Nevertheless, still more studies are needed to identify the contribution of acetate and TCA cycle metabolites as direct substrates for oxidative metabolism.
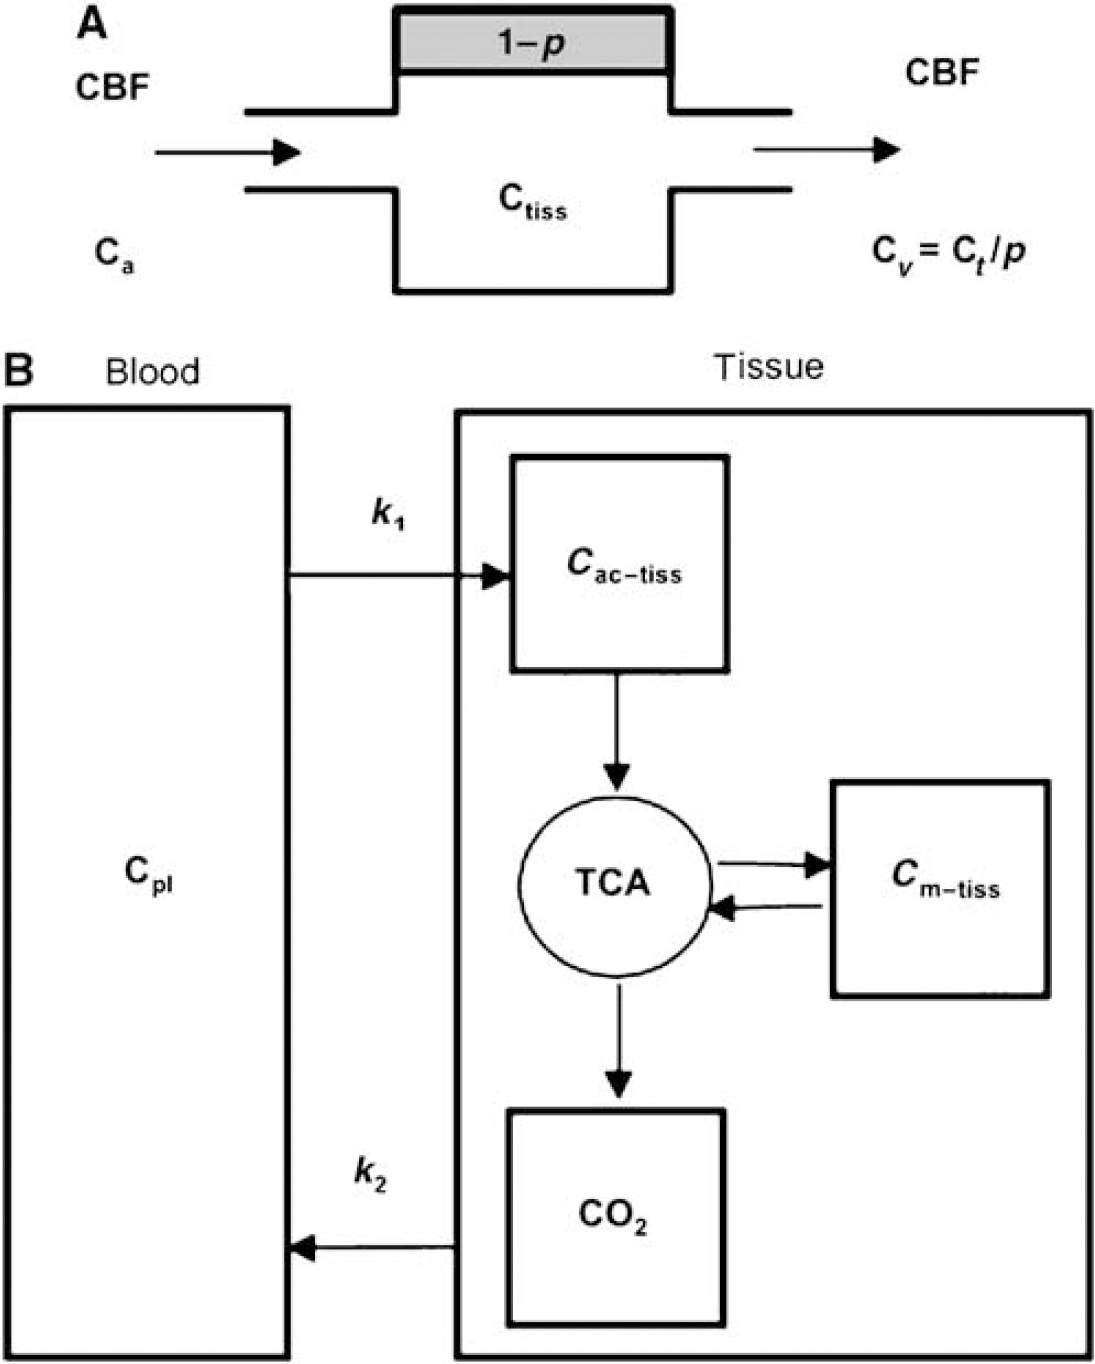
One-tissue compartment models used in animal and human studies to analyze CBF using H215O(
General Remarks
Because of the delay of the onset of the label washout, k2 is smaller during the first few minutes after injection. This effect was not taken into account in the tracer kinetic modeling, for example, k2 was assumed constant. To estimate the resulting error we calculated simulated tissue time—activity curves with k2 = 0 (during the first 5 mins) and 0.027 per minute thereafter. The refit of these curves using a constant k2 demonstrated only a 1.5% change ofk2.
Another point concerns parameter identifiability. The sensitivity analysis demonstrated that the dependence of tissue activity on k2 is more pronounced at the higher values, implying that the k2 values during baseline are less reliable than during stimulation. This aspect and the fact that k2 at baseline is relatively small may lead to a relatively large error margin the ratio k2 simulation/k2 baseline. We also did not consider the effect of blood-borne 11C-CO2 on K1 and k2. Most of the CO2 in blood is converted to HCO−3, which does not cross the blood-brain barrier. Approximately 5% of total HCO−/CO2 is present as dissolved 11C-CO2 (Brooks et al, 1984) which freely penetrates the brain. We constructed simulated tissue time—activity curves using the one-tissue compartment model and the blood-borne 11C-CO2 as a second input curve. K1 and k2 values for this fraction of CO2 were taken from Brooks et al (1984). These tissue time—activity curves were then refitted using the standard one-tissue compartment model not considering blood borne 11C-CO2. The deviation of the K1 and k2 values was less than 1.5%, demonstrating that the effect of blood-borne 11C-CO2 on K1 and k2 is negligible.
Summary
1-11C-acetate seems a promising tracer to investigate astrocytic oxidative metabolism in animals and humans. If the washout rate indeed represents the production of 11C-CO2, then its increase during stimulation would point to a substantially higher astrocytic oxidative metabolism during brain activation. However, the quantitative relationship between k2 and CMRO2 needs to be determined in future experiments.
Footnotes
Acknowledgements
The authors acknowledge the important laboratory and editorial help by Prateep Beed and John Mc Clacken, respectively, and thank Tibor Cservenyak and Konstantin Drandarov for radiosynthesis of the tracer. The authors also thank Rolf Grutter for valuable discussions.
Appendix
References
Supplementary Material
Please find the following supplemental material available below.
For Open Access articles published under a Creative Commons License, all supplemental material carries the same license as the article it is associated with.
For non-Open Access articles published, all supplemental material carries a non-exclusive license, and permission requests for re-use of supplemental material or any part of supplemental material shall be sent directly to the copyright owner as specified in the copyright notice associated with the article.