
Abstract
Reactive oxygen species (ROS) and compromised antioxidant defense may contribute to brain disorders such as stroke, amyotrophic lateral sclerosis, etc. Nitroxides are redox-sensitive paramagnetic contrast agents and antioxidants. The ability of a blood—brain barrier (BBB)-permeable nitroxide, methoxycarbonyl-2,2,5,5-tetramethylpyrrolidine-1-oxyl (MC-P), as a magnetic resonance-imaging (MRI) contrast agent for brain tissue redox imaging was tested. MC-P relaxation in rodent brain was quantified by MRI using a fast Look-Locker T1-mapping sequence. In the cerebral cortex and thalamus, the MRI signal intensity increased up to 50% after MC-P injection, but increased only by 2.7% when a BBB-impermeable nitroxide, 3CxP (3-carboxy-2,2,5,5,5-tetramethylpyrrolidine-1-oxyl) was used. The maximum concentrations in the thalamus and cerebral cortex after MC-P injection were calculated to be 1.9±0.35 and 3.0±0.50 mmol/L, respectively. These values were consistent with the ex vivo data of brain tissue and blood concentration obtained by electron paramagnetic resonance (EPR) spectroscopy. Also, reduction rates of MC-P were significantly decreased after reperfusion following transient MCAO (middle cerebral artery occlusion), a condition associated with changes in redox status resulting from oxidative damage. These results show the use of BBB-permeable nitroxides as MRI contrast agents and antioxidants to evaluate the role of ROS in neurologic diseases.
Introduction
Increased reactive oxygen species (ROS) and decreased antioxidant defense may contribute to numerous brain disorders such as stroke, amyotrophic lateral sclerosis, Parkinson's disease, and Alzheimer's disease (Halliwell, 2006; Huang et al, 2001; Mariani et al, 2005; Muir et al, 2006; Raichle and Mintun 2006; Zimmermann et al, 2004). Noninvasive assessment of oxidative stress is therefore useful to monitor the role of ROS in brain disorders. For image studies of ROS in vivo, nitroxide compounds have been used as redox-sensitive contrast agents by electron paramagnetic resonance (EPR) imaging (He et al, 2002; Kuppusamy et al, 2002; Yamada et al, 2002).
Nitroxides are nontoxic, stable, organic free radicals having a single unpaired electron and therefore capable of providing MRI contrast by shortening the longitudinal relaxation time (T1). Although nitroxides have a lower relaxivity compared with conventional T1 contrast agents such as Gd3+ complexes, the volume distribution of nitroxides is significantly greater because of better cell permeability (Hahn et al, 1992; Samuni et al, 2001). The rapid bioreduction from paramagnetic nitroxides to the corresponding diamagnetic hydroxylamines has compromised their utility as contrast agents (Keana and Pou, 1985). The combination of relatively low relaxivity and short life spans precluded the use of nitroxides as MRI contrast agents. However, with improved sensitivity of MRI and shift to higher magnetic fields, recent work has begun to investigate whether the reduction of nitroxides might be useful in obtaining information pertaining to the redox status of tissue. (Hyodo et al, 2006; Matsumoto et al, 2006). Nitroxides can be reduced to the corresponding hydroxylamines by reductants such as ascorbate (Figure 1). Nitroxides were investigated to be used as antioxidants and radioprotectors in preclinical cancer research (Erker et al, 2005; Hahn et al, 1997; Krishna et al, 1996a; Liaw et al, 2005; Metz et al, 2004). In in vivo studies, the ratio of nitroxide/hydroxylamine has been shown to be dependent on the redox status of the tissue (Hahn et al, 2000; Kuppusamy et al, 1996, 2002). These observations suggest that nitroxides participate in cellular redox reactions, and that their relative levels may be indicative of the cellular redox status.
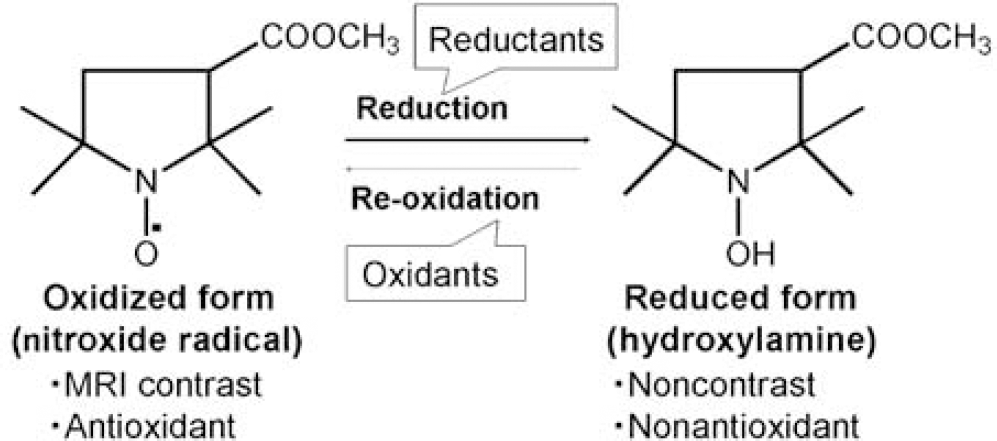
Reversible one-electron reduction/oxidation showing the interconversion and the molecular structure of MC-P. The structure on the left is the radical form of MC-P. The structure on the right is the reduced form (hydroxylamine) of MC-P.
One of the nitroxides, methoxycarbonyl-2,2,5,5-tetramethylpyrrolidine-1-oxyl (MC-P; Figure 1), has been used as a contrast agent for brain imaging in EPR-imaging experiments (Anzai et al, 2006; Lee et al, 2004; Sano et al, 1997; Yokoyama et al, 2002). Anzai et al (2003) confirmed that the nitroxide, MC-P, after intravenous injection, accumulated in the brain tissue as evidenced by autoradiography. These findings suggest that MC-P can pass through the blood—brain barrier (BBB) and give T1 contrast in brain tissue. Previously, we showed that nitroxides are useful contrast agents for monitoring the redox status of tissue using MRI with improved spatial and temporal resolutions compared to EPR imaging (Hyodo et al, 2006; Matsumoto et al, 2006). Therefore, MC-P can be used as a BBB-permeable MRI contrast agent that can participate in redox reactions. Middle cerebral artery occlusion (MCAO) in rats is generally accepted as a standard model of focal cerebral ischemia (Koizumi et al, 1986; Longa et al, 1989; Nagasawa and Kogure, 1989). After periods of ischemia, on reperfusion with oxygenated buffer solutions, a burst of ROS has been shown to be generated with a propensity to inflict oxidative damage, alter the redox status of the tissue, and shift the equilibrium shown in Figure 1 toward left. To show the possibility of using MC-P in brain redox imaging in neurologic disease model, rat transient MCAO model was employed. Furthermore, T1 mapping has the potential to quantify the tissue concentration of the contrast agent with the knowledge of the relaxivity of the agent used. Chuang and Koretsky (2006) reported fast T1 mapping based on the Look-Locker (LL) sequence that can significantly reduce scanning time without compromising on accuracy. This has been shown to have almost the same efficiency as the spin echo inversion recovery method in terms of the signal-to-noise ratio per unit time (Crawley and Henkelman, 1988). Using the LL sequence, we used MRI to study the pharmacokinetics of MC-P concentration in the brain by monitoring T1 changes before and after MC-P injection. T1 changes were readily detected throughout the brain at a well-tolerated dose of MC-P. Maximum T1 reduction occurred at about 3 mins after injection and returned to control by 15 mins. A BBB-impermeable nitroxide, 3CxP, did not change T1 in the brain. Estimation of the concentration of MC-P using in vitro relaxivities agreed with EPR results from extracted tissue. The results indicate that MC-P goes into the brain and causes reduction of T1. In addition, the reduction rate of MC-P was significantly decreased in the infarct region of brain after ischemia followed by reperfusion compared with the same region of the sham group. This unfolds the possibility of using this agent for MRI study of the redox status of brain and the changes in it under pathologic conditions.
Materials and methods
Chemicals
MC-P was purchased from Columbia Advanced Science, LC (Baltimore, MD, USA). 3CxP was purchased from Sigma-Aldrich Chemical Co. (St Louis, MO, USA). Deionized water was used for all experiments. Potassium chloride (KCl) was purchased from Hospira Inc. (Lake Forest, IL, USA). Other materials used were of analytical grade.
Animals
Male Wistar rats were supplied by the Frederick Cancer Research Center, Animal Production (Frederick, MD, USA). The rats were 6 to 7 weeks of age at the time of experimentation and were housed three per cage in climate-controlled, circadian rhythm-adjusted rooms and were allowed food and water ad libitum. All in vivo experiments were carried out in compliance with the Guide for the Care and Use of Laboratory Animal Resources (1996), National Research Council, and approved by the National Cancer Institute Animal Care and Use Committee.
Magnetic Resonance Imaging and Pulse Sequence
Magnetic resonance-imaging measurements were performed at a 4.7 T scanner controlled with ParaVision 3.0.1 (Bruker BioSpin MRI GmbH, Rheinstetten, Germany). A series of T1-weighted spoiled gradient-echo (SPGR; repetition time (TR)=75 ms, echo time (TE)=3 ms, flip-angle (FA)=45°, and NEX=2) was employed to observe T1 effects. The scan time for an image set (which included six slices) by the SPGR sequence was 20 s. Other imaging parameters were as follows: image resolution was 256 × 128 zero-filled to 256 × 256 (0.125 mm resolution), field of view (FOV)=3.2 × 3.2 cm, slice thickness=2.0 mm and 0.2 mm gap. The number of slices was six.
For quantification of the dynamic change of T1 and to estimate the concentration of the contrast agent, three MC-P-injected rats were scanned by a fast LL T1-mapping sequence (Chuang and Koretsky, 2006). After adjusting higher order shimming, echo spacing, echo symmetry, and B0 compensation, multislice LL data were acquired by segmented gradient-echo EPI (echo planar imaging) with TR=10 secs, TE 6.7 ms, FA=20°, acquisition interval=400 ms, and number of LL time points=20. To avoid resolution blurring because of the T2∗ (an intrinsic MRI parameter) of brain, a bandwidth of 250 kHz and 32 echoes in one segment was used to keep the echo train length short. With a matrix size of 64 × 64 (0.4 mm in-plane resolution), a set of 13 1.5-mm slices could be obtained in 20 secs.
Phantoms
Phantoms comprising five or seven tubes, with each tube (4.7 mm inner diameter) containing 0 to 50 mmol/L MC-P in phosphate-buffered saline (PBS) as shown in Figure 2A, were used for measuring the in vitro T1 relaxivity. The experimental conditions of SPGR and LL sequence were SPGR: TR=75 ms, TE=3 ms, FA=45°, NEX=8, scan time=160 secs, FOV=3.2 × 3.2 cm, reconstructed image resolution=256 × 256, slice thickness=2.0 mm, and number of slices=6. The LL T1-mapping data were acquired by conventional gradient-echo MRI with TR=10 secs, TE=2.4 ms, FA=20°, acquisition interval=400 ms, number of time points=20, and matrix size=96 × 96.
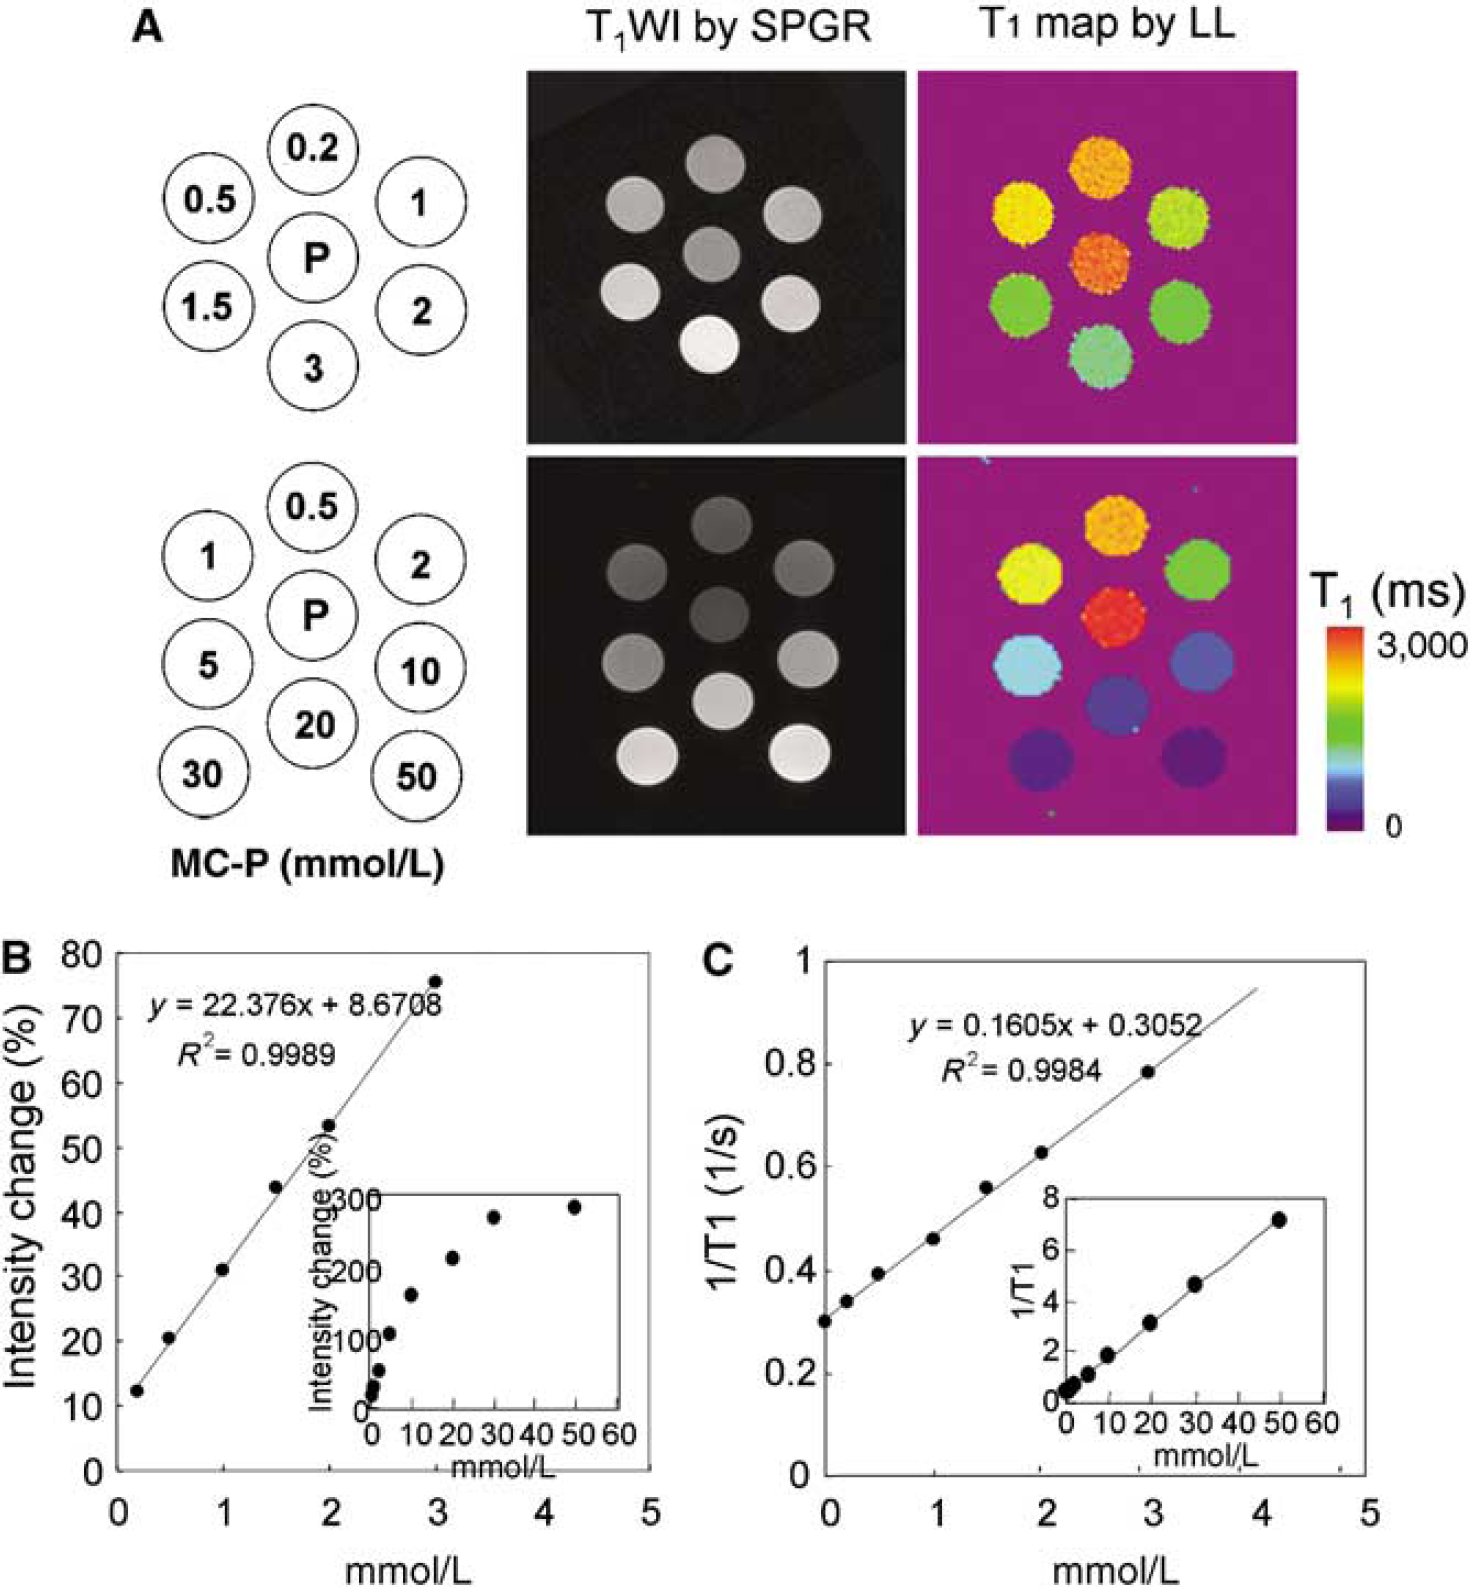
MR images of MC-P phantom by SPGR and LL sequences. (
Animal Experimental Design
Rats were anesthetized by isoflurane (2.0%) in medical air (700 mL/min) and secured on a special holder by an adhesive skin tape. A breathing sensor (SA Instruments Inc., NY, USA) was placed on the dorsal side of the rat. A nonmagnetic temperature probe (FISO, QC, Canada) was used to monitor the rectal temperature of the rats. The tail vein was cannulated for the injection of MC-P or 3CxP. The rat was then placed in the resonator, which was previously warmed up using a hot-water-cycling pad. The resonator unit including the rat was placed in the magnet bore. The MR measurements were started after the rat's core body temperature stabilized at 37°C. The rat's body temperature was maintained at 37±1°C during experiments. Before making the measurements with MC-P or 3CxP, images of the rat were taken with the parameters mentioned above. T1-weighted images or T1 maps were acquired continuously for 13 mins, using SPGR or LL sequence. A solution of MC-P or CxP (1.5 μmol/g body weight) was injected by tail vein cannulation, 2.0 mins after starting the scan. To stop the blood flow immediately, 2 mL of KCl solution (2 mequiv/mL) was injected 40 secs after the administration of MC-P and then continuously measured by SPGR till 13 mins.
Surgical Procedure of Ischemia and Reperfusion in Rat
The intraluminal suture model was used for induction of focal cerebral ischemia, as formerly described by published procedure (Nagasawa and Kogure, 1989). Briefly, rats were anesthetized with isoflurane using a nose cone. Anesthesia induction started with 4% isoflurane carried by medical air and maintained by 2% isoflurane with medical air. Animal core body temperature was maintained at approximately 37°C using a water blanket. A 2 cm midline incision was made on the anterior neck. The right CCA (common carotid artery), ECA (extra carotid artery), and ICA (internal carotid artery) were exposed with careful conservation of the vagus nerve. The CCA and ECA were ligated and a suture was placed at the ICA. To block the origin of the middle cerebral artery, a 4-0 nylon surgical thread was advanced into the ICA via a small incision. The left CCA was ligated with a suture to complete the MCAO. After 1 h of MCAO, normal blood flow was restored in the middle cerebral artery by withdrawing the suture tip and the suture of the left CCA region. The rats were moved to the MR magnet 3 h after reperfusion. Then MRI procedure was performed as described above.
Image Analysis
The MRI data were analyzed using the ImageJ software package (http://rsb.info.nih.gov/ij/). The T1 of each pixel was calculated in two steps using a custom-written program running in Matlab (The MathWorks Inc., Natick, MA, USA). First, the signal recovery of each pixel was fitted by the Levenburg—Marquardt nonlinear three-parameter curve-fitting algorithm. Then, the obtained parameters were used to resolve the dependency of the fitted T1 on the FA and acquisition interval to derive the actual T1 (Chuang and Koretsky, 2006). Semi-logarithmic plots of the time course of MRI signal change in the ROI (region of interest) were used for reduction rate calculation. Region-of-interest analysis was performed on multislice LL data using ImageJ. The concentration of MC-P was estimated by the LL T1 maps using the relaxivity measured in the phantom study using the following equation:
[MC-P]=(R1−R10)/Relaxivity.
Statistical analysis was performed using the StatView software Stat View 5.0 (SAS Institute Inc., Cary, NC, USA). All data are presented as mean±s.d.
Quantification of MC-P in Brain and Blood by EPR Spectroscopy
MC-P dissolved in saline was injected in the tail vein of rats at a dose of 0.75 μmol/g body weight (5 μL/g). The concentration in the bolus solution was 150 mmol/L. Blood was collected from the retro-orbital sinus using heparinized tubes. Brain tissue was extracted 2, 5, and 8 mins after injection of MC-P and wet weight was determined. Blood or tissue samples were diluted or homogenized with fourfold volume PBS for blood or threefold volume PBS for brain. The homogenate solution was mixed with ferricyanide solution (2 mmol/L). Ferricyanide quantitatively oxidizes the hydroxylamine produced as a result of in vivo reduction back to the oxidized form (Krishna et al, 1992, 1996a, 1996b). The signal intensities of the 100 μL samples were immediately measured using a Varian E-9 X-band EPR spectrometer. The operating conditions for the EPR spectrometer were as follows: modulation frequency, 100 kHz; microwave power, 1 mW. Because there is linearity up to 2 mmol/L between concentration and EPR signal height of MC-P (data not shown), EPR signal heights of homogenate mixtures were converted to the concentration using previously obtained standard curves with or without ferricyanide solution (100 μmol/L to 2 mmol/L). Finally, MC-P concentrations in the brain tissue and blood were calculated based on the dilution factor.
Results
Figure 2A (middle column) shows T1-weighted images of phantom with various concentrations of MC-P acquired using the SPGR sequence. The MR signal intensity increased with concentration of MC-P up to 50 mmol/L (Figure 2B), with a linear response up to 5 mmol/L. The intensity change (%) in the 5 mmol/L MC-P tube was about 100% compared with PBS (center tube). The T1 maps of the phantom by the LL sequence are shown in Figure 2A (right column). The T1 values decreased depending on the MC-P concentration from 2,246 ms (0.5 mmol/L) to 122 ms (50 mmol/L), and the relaxation rates (1/T1) increased linearly up to 50 mmol/L (Figure 2). The relaxivity of MC-P in PBS solution was measured to be 0.16 sec−1 mmol/L−1 by the LL sequence.
To study the dynamics of nitroxides in brain, a T1-weighted SPGR sequence was used. Using this technique, six slices (2 mm slice thickness) were obtained every 20 secs with an image resolution of 125 μm. After the injection of MC-P solution, the intensity in the rat head region immediately increased (green color). The increased signal intensity in the brain tissue was large compared with the facial muscle (Figure 3A). The maximum change in the signal intensity in the brain tissue after injection of MC-P was about 50% compared with the pre-injection image (Figure 3C). The signal intensity derived from MC-P (oxidized form, MRI visible) reached a maximum at 30 secs after injection, and the signal intensity decreased during the subsequent 6 mins. On the other hand, 3CxP (cell-impermeable) didn't cause significant signal changes in the brain region although it has a similar in vitro relaxivity (0.17 sec−1 mmol/L−1) as MC-P (Figure 3B). The signal intensity in the cerebral cortex and thalamus increased by only 2.7% during the measurement time, and the increased signal intensity plateaued for up to 10 mins after injection of 3CxP (Figure 3D). To check if blood flow affected MC-P reduction, blood flow was stopped by KCl injection 40 secs after administration of MC-P. Respiration stopped (rats died) 15 to 20 secs after KCl injection. The MR signal intensity in brain decreased after enhancement by MC-P in a manner similar to that found for brain but slower than in animals with normal cerebral perfusion (Figure 3E). The MC-P reduction rate (k=0.30±0.066 min−1) in brain without flow was slower than in living rat brain (k=0.50±0.039 min−1), indicating that a fraction of the reduction of intensity enhancement might have been because of washout from the brain. Alternatively, a change in the redox state of the tissue on death could explain these differences.
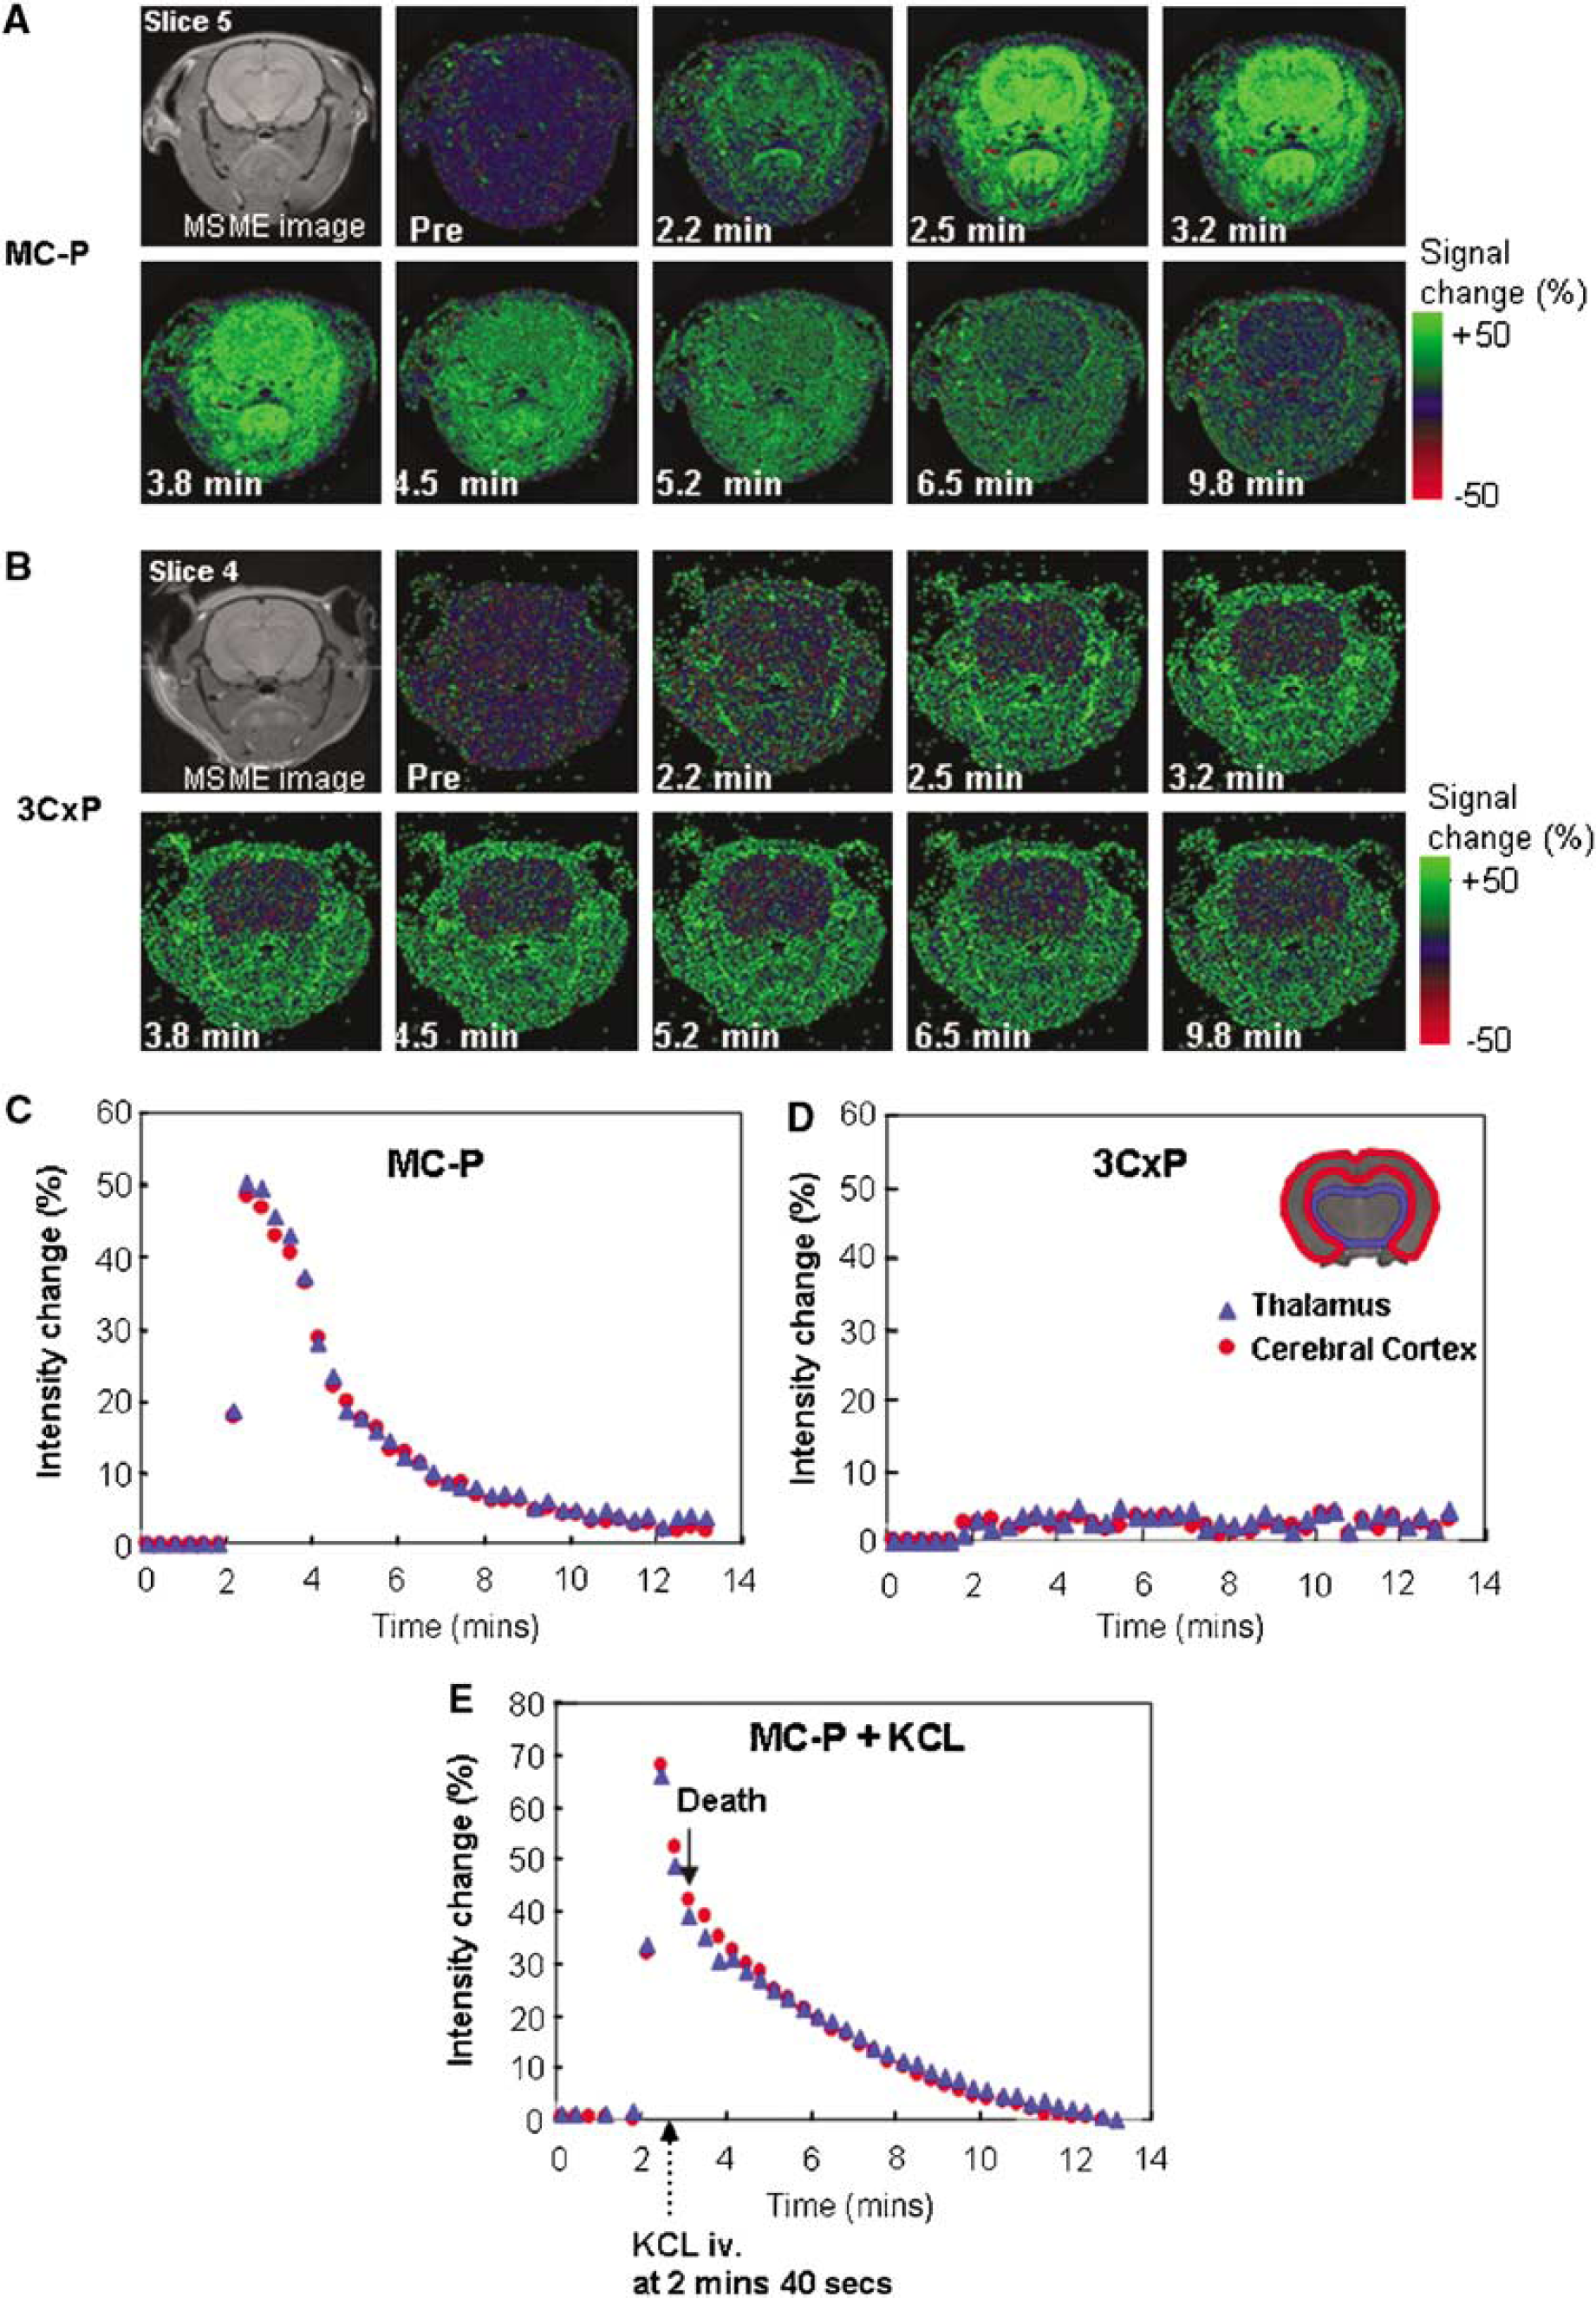
Time-course SPGR MR images of rat head region after injection of (
In the ischemia—reperfusion (IR)-treated group, all rats showed typical symptoms during ischemia, and all rats were alive after IR. The T2-weighted MR images in the IR group did not show any differences at this time (Figure 4A). However, significantly high intensity regions were observed 24 h after IR (data not shown). The reduction rate of MC-P in the right hemisphere was significantly decreased compared with the same region of sham rat brain (Figure 4C).
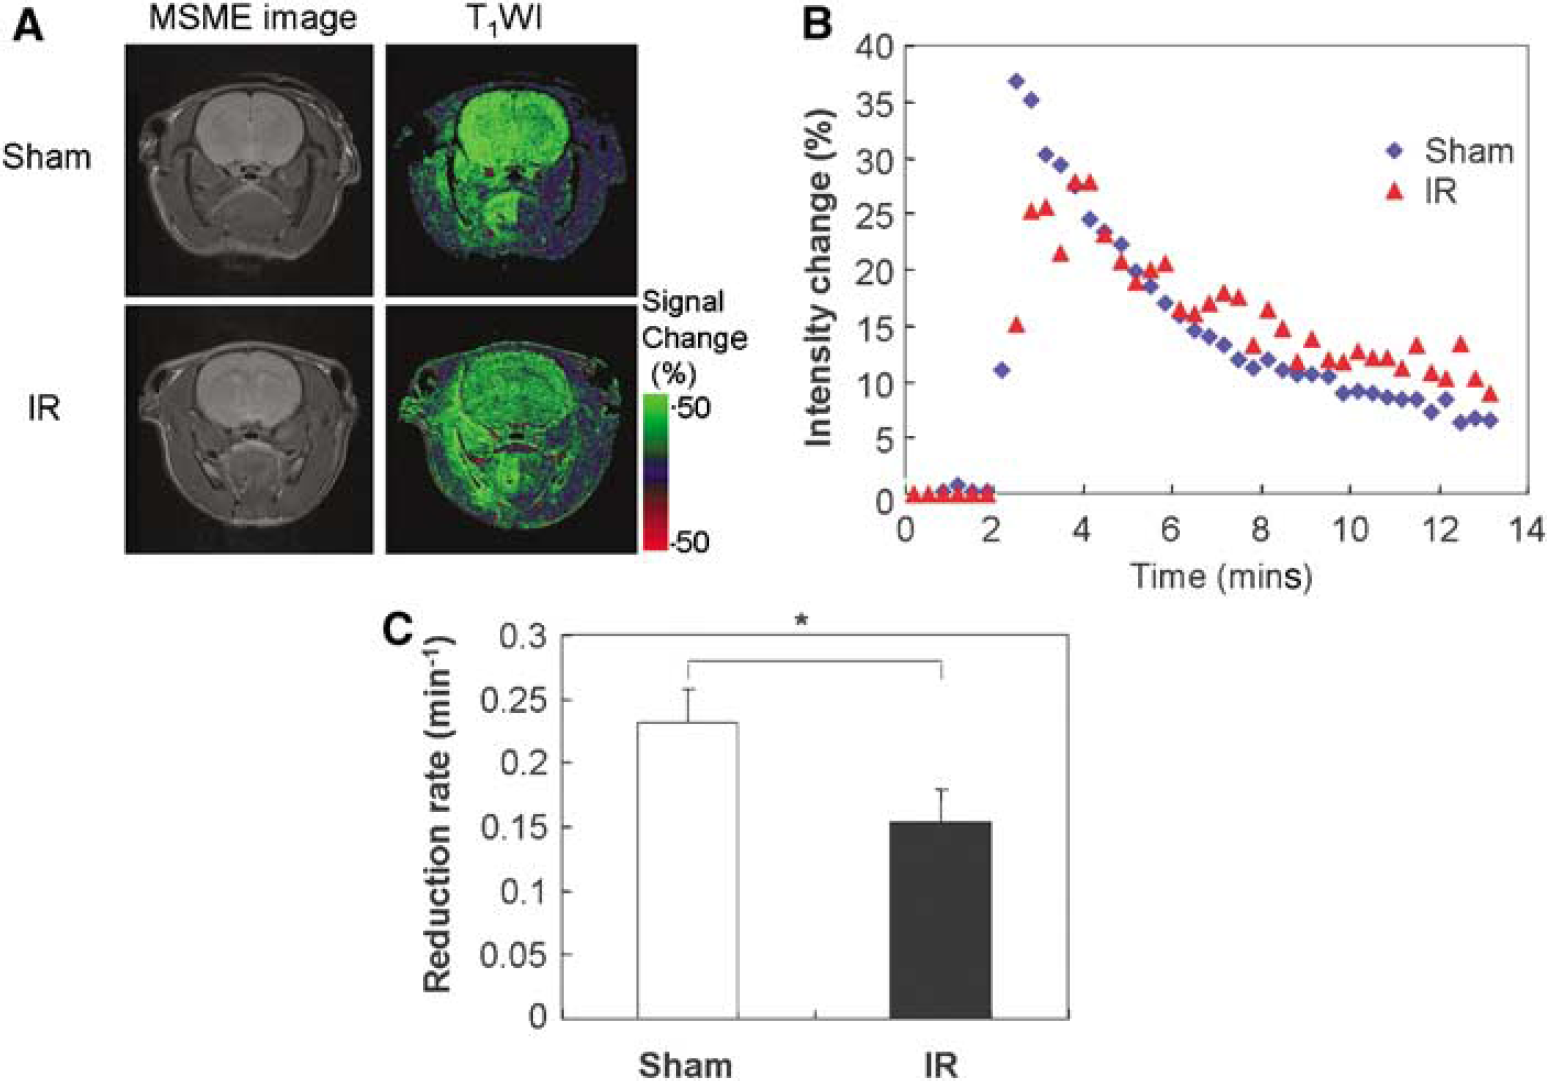
Redox MR imaging of rat brain after IR. (
Figure 5A shows the time course of quantitative T1 maps before and after injection of MC-P. T1 map data were obtained every 20 secs with 13 slices (1.5 mm slice thickness) by the EPI—LL sequence. The T1 maps clearly showed the difference of relaxation time T1 between the cerebral cortex and thalamus. The relaxation times in cerebral cortex and thalamus before injection were 1,577±19.9 and 1,315±11.9 ms, respectively (Figure 5B). The T1 of these regions rapidly decreased after injection of MC-P, and the minimum T1 (secs) of the cerebral cortex and thalamus region were 1,034±70.4 and 779±70.2 ms, respectively. The recovery of T1 in the cerebral cortex and thalamus showed similar trends. From T1 and in vitro relaxivity of MC-P (0.16 mmol/L−1s−1), the concentration of MC-P at all time points in the ROI was calculated (Figure 5C). The maximum concentration in the cerebral cortex and thalamus 30 secs after injection was 1.9±0.35 and 3.0±0.50 mmol/L, respectively. The concentration was significantly higher in the thalamus compared with the cerebral cortex. This difference in concentration was observed up to 2 mins after injection, after which the concentration in those regions converged.
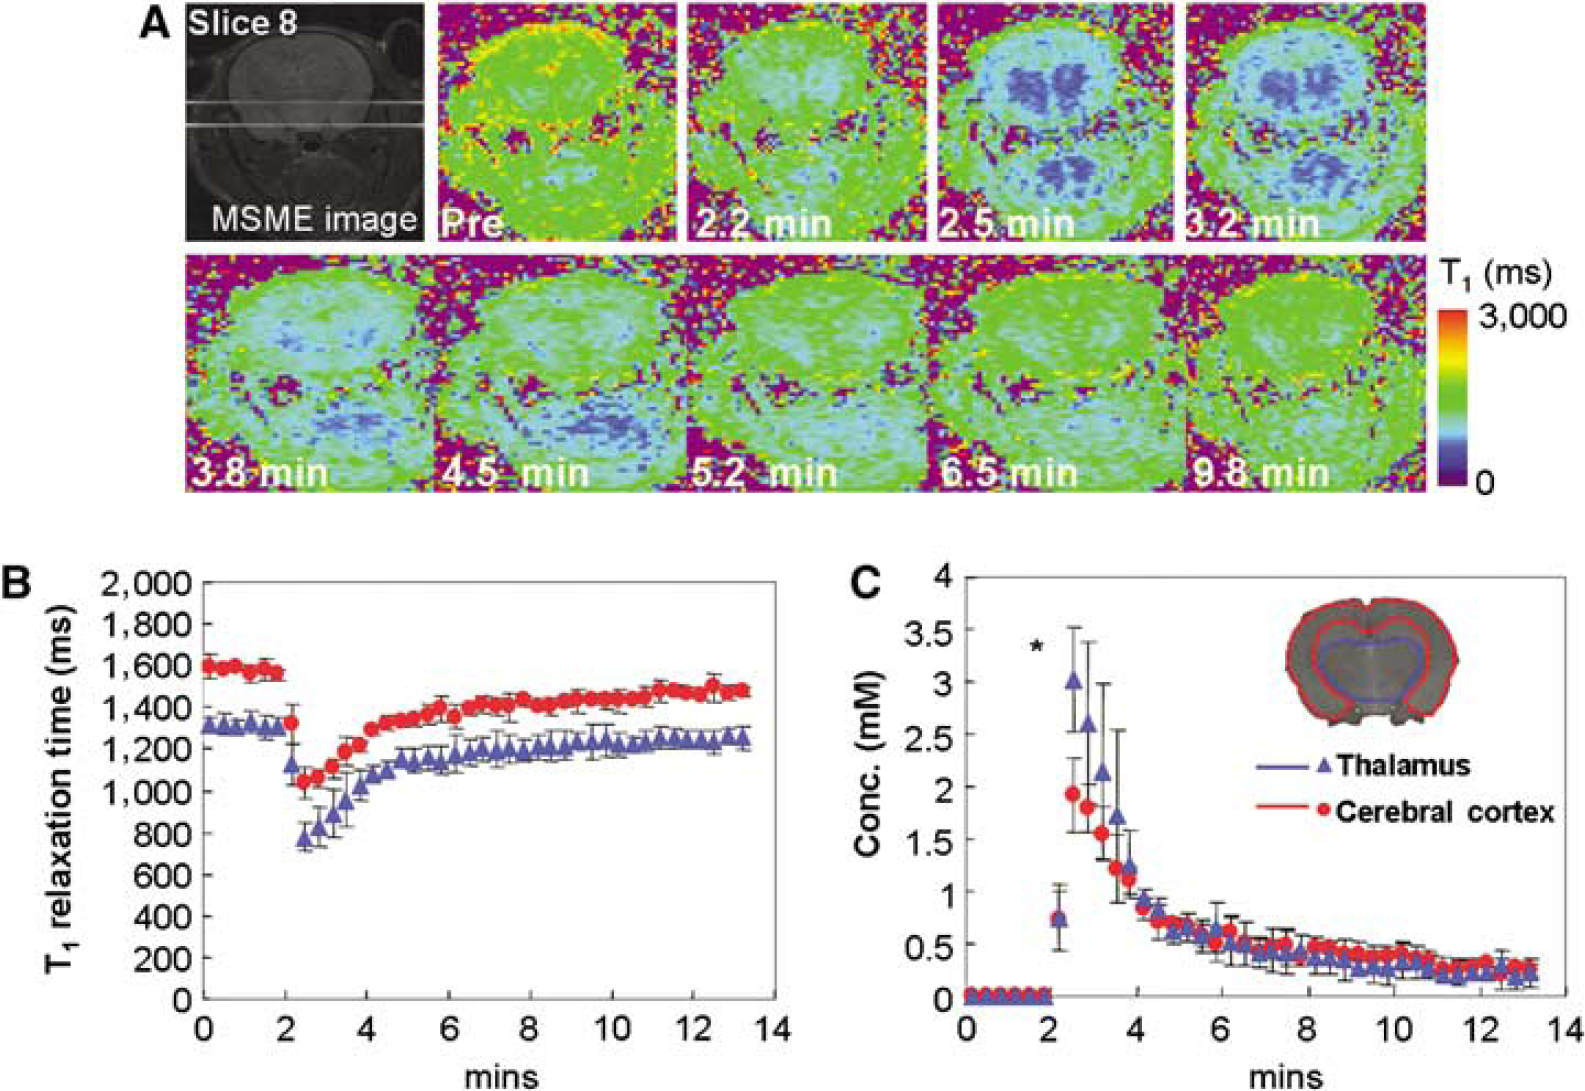
Dynamic T1 maps of rat head region after MC-P injection acquired by LL sequence. (
To confirm whether the concentration of MC-P determined by the MRI technique is reliable, an ex vivo study using X-band EPR was carried out on the brain tissue for MC-P levels (Figure 6). The oxidized and total MC-P (oxidized+reduced form) levels were determined with and without ferricyanide solution, respectively. The brain tissue MC-P level was 0.84±0.035 mmol/L at 2 mins after MC-P injection (Figure 6A). This was in agreement with the MRI data in the cerebral cortex (0.83±0.107 mmol/L) and in the thalamus (0.94±0.086 mmol/L). On the other hand, total MC-P level (oxidized+reduced form) was 1.57±0.199 mmol/L, suggesting that approximately half of MC-P was in the reduced form in the brain at this time point. At 8 mins, most of MC-P was reduced (0.24±0.107 mmol/L); however, total MC-P (reduced+oxidized) still remained (0.92±0.092 mmol/L).
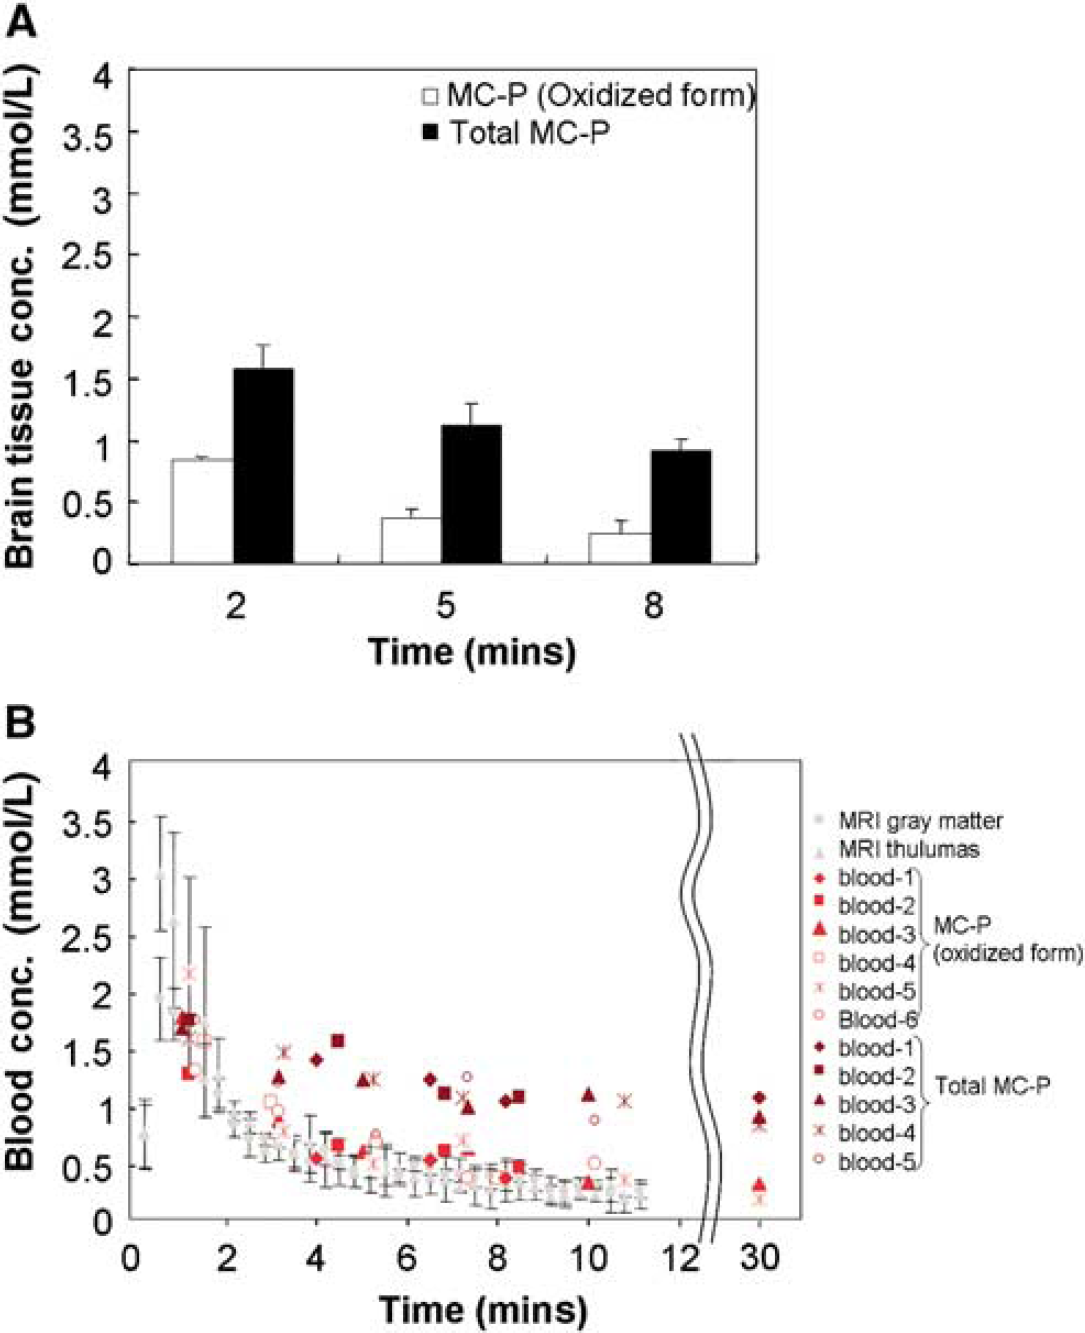
The quantification of oxidized and total (oxidized+reduced) MC-P in brain tissue and blood using X-band EPR. (
The blood concentrations of MC-P at different time points in six rats are shown in Figure 6B. The oxidized form of MC-P followed similar kinetics as the brain, peaking at similar concentration and falling off at a similar rate. Total MC-P levels slowly decreased, but MC-P was still present at 30 mins (level of oxidized MC-P: 0.33±0.084 mmol/L, level of total MC-P: 1.04±0.07 mmol/L), suggesting that the clearance of MC-P from the blood was much slower than the reduction detected in the brain.
Discussion
The results of this study show that the cell-permeable and low-molecular-weight BBB-permeable MRI contrast agent, MC-P, is useful for enhancing MRI intensity in the brain. Furthermore, dynamic contrast-enhancement study with LL sequence allowed us to get rapid T1 maps from the brain region before and after MC-P injection. This enabled determination of the MC-P concentration in brain regions assuming the in vivo relaxivity of MC-P as the same in vivo.
Previously, we reported that nitroxide radicals are useful in monitoring the redox status of tumor (Hyodo et al, 2006; Matsumoto et al, 2006). In this study, the cell-permeable and highly lipophilic nitroxide, MC-P, was tested in the brain as an imaging probe. The T1-weighted MR signal intensity of MC-P showed linearity up to 5 mmol/L (Figure 2B), although it increased up to 50 mmol/L. The relaxation rate (1/T1) was linear up to 50 mmol/L (Figure 2C). Because the MC-P concentration in the thalamus region went up to approximately 3 mmol/L, EPR spectral line broadening effect might have compromised the accuracy of quantification as probes in EPR and Overhauser MRI, the two commonly used techniques to monitor nitroxides. However, MRI is not affected by the EPR spectral line broadening; therefore, it can provide more accurate information on the concentration.
In the animal studies, MRI signal intensities in brain regions clearly increased up to 50% after injection of MC-P, although there was no enhancement (∼3%) in the case of the cell- and BBB-impermeable nitroxide, 3CxP. Both agents have one unpaired electron, their molecular structures are very similar, and their relaxivities are also similar (0.16 mmol/L−1 sec−1 for MC-P; 0.17 mmol/L−1 sec−1 for 3CxP). Thus, the difference detected is most likely because of the distribution of MC-P in the brain. MC-P is a highly lipophilic substance with an octanol—water partition coefficient (Po/w) of 14.4 (Miura et al, 1997). In addition to lipophilicity, its low molecular weight (200) allows it to pass through the BBB. Therefore, SPGR signal intensity in the brain region increased after MC-P injection (Figure 3A). Conversely, Po/w of 3CxP is 0.002, and it is not cell-permeable except by active anion transport (Ichikawa et al, 2006). As a result, the MR signal intensity in the brain increased by only 2.7%. The ratio of maximum intensity change between MC-P and 3CxP was 18.5. This ratio was very similar to the blood volume in the brain. The brain blood value was about 5 to 10% in the whole brain and its ratio to tissue was about 10 to 20 (Ladurner et al, 1976; Mathew et al, 1972; Rostrup et al, 2005). These data suggest that MC-P got distributed in the whole-brain tissue region after passing through the BBB.
The levels of 3CxP were stable in the blood for up to 13 mins. Our previous paper showed that 3CxP displays slow pharmacokinetics compared with cell-permeable contrast agents and its reduction rate was attributed to its membrane permeability (Hyodo et al, 2006). In addition, blood flow may contribute to nitroxide reduction in vivo. Therefore, MC-P reduction rate without blood flow was tested (Figure 3E). Even though blood flow was stopped after injecting KCl solution, MC-P reduced in the brain. The reduction rate of MC-P without blood flow was 60% compared with blood flow, suggesting that MC-P reduction represents reaction with intracellular reductants such as GSH (glutathione), AsA (ascorbic acid), and possibly free radicals in the intracellular compartment. It is also possible that, when an animal died, the redox status of the brain changed in a manner that showed the reduction of MC-P.
Monitoring of T1 (secs) before and after injection of MC-P using LL sequence allowed the calculation of MC-P concentration in the brain (Figure 5). Thirteen slices of brain T1 maps with 1.5 mm slice thickness were obtained every 20 secs and monitored continuously up to 13 mins (a representative slice is shown in Figure 5A). The T1 values in the ROI were converted to MC-P concentration (Figure 5C). The concentration determined by MRI was in agreement with the results measured from brain tissues and the blood concentration of the oxidized form of MC-P as determined ex vivo from EPR (Figure 6). Although there was about 0.5 mmol/L of the oxidized form of MC-P at 10 mins after injection, the total MC-P levels (nitroxide+hydroxylamine) were still around 1.2 mmol/L, suggesting that the reduction from MC-P (oxidized, paramagnetic) to hydroxylamine (reduced, diamagnetic) was predominant compared with clearance and elimination from the brain tissue or blood.
Lowered reduction rate in the infarction area after ischemia and reperfusion were readily seen in the right hemisphere (Figure 4) suggesting that the postischemic reperfusion damage course induced elevated oxidative conditions in infarct region resulting in oxidative damage. Major antioxidants, such as AsA and GSH, are efficient reducing substances in the brain and are found in millimolar concentrations (Rice and Russo-Menna, 1998; Rice et al, 2002). Low levels of these antioxidants have been implicated in neurologic damage and stroke. Under normal physiologic conditions, neurologic damages mediated by ROS can be prevented by the cellular antioxidant network. However, AsA levels decrease in the brain and rise sharply in extracellular fluid of the brain after severe ischemic hypoxia (Hillered et al, 1988; Landolt et al, 1992). The nitroxide radical by itself is also an antioxidant and can be used as a superoxide dismutase mimic (Krishna et al, 1996a). Tempol, which is another cell-permeable nitroxide, has been used in a phase I clinical trial for the prevention of alopecia induced by whole-brain radiotherapy (Metz et al, 2004). Interestingly, in a tumor model, Kuppusamy et al (2002) showed an increased rate of EPR signal decay of 3CxP compared with normal tissue. This decay was decreased by pre-injection of a glutathione synthesis inhibitor,
Conclusion
The BBB-permeable MC-P is a potent redox-sensitive MRI contrast agent in brain. The MRI intensity in brain was clearly enhanced after injection of MC-P. Furthermore, the real-time T1 mapping by LL sequence allowed accurate monitoring of pharmacokinetic MC-P concentration changes with whole-brain coverage. Such studies should be useful to evaluate the redox status of brain in oxidative diseases of the brain, such as stroke, Alzheimer's disease, and other neurologic disorders.