
Abstract
Arterial spin labelling (ASL) has proved to be a promising magnetic resonance imaging (MRI) technique to measure brain perfusion. In this study, volumetric three-dimensional (3D) gradient and spin echo (GRASE) ASL was used to produce cerebral blood flow (CBF) and arterial arrival time (AAT) maps during rest and during an infusion of remifentanil. Gradient and spin echo ASL perfusion-weighted images were collected at multiple inflow times (500 to 2,500 ms in increments of 250 ms) to accurately fit an ASL perfusion model. Fit estimates were assessed using z-statistics, allowing voxels with a poor fit to be excluded from subsequent analyses. Nonparametric permutation testing showed voxels with a significant difference in CBF and AAT between conditions across a group of healthy participants (N = 10). Administration of remifentanil produced an increase in end-tidal CO2, an increase in CBF from 57 ± 12.0 to 77 ± 18.4 mL/100 g tissue per min and a reduction in AAT from 0.73 ± 0.073 to 0.64 ± 0.076 secs. Within grey matter, remifentanil produced a cerebrovascular response of 5.7 ± 1.60 %CBF per mm Hg. Significant differences between physiologic conditions were observed in both CBF and AAT maps, indicating that 3D GRASE-ASL has the sensitivity to study changes in physiology at a voxel level.
Introduction
An adequate level of cerebral blood flow (CBF) is a fundamental requirement to maintain the health of brain tissue. Within the penumbral region after a stroke, for instance, the degree of hypoperfusion is the principal factor that dictates the fate of neurons (Warach et al, 1996). There are several techniques that can be used for perfusion imaging to investigate human cerebral physiology, such as positron emission tomography (Kanno et al, 1988), dynamic susceptibility contrast magnetic resonance imaging (MRI) (Ostergaard et al, 1996), and contrast-enhanced computed tomography (Eastwood et al, 2002). Another promising technique is arterial spin labelling (ASL) MRI (Williams et al, 1992), relying on magnetically labelled blood as an endogenous contrast agent.
Arterial spin labelling is a promising technique because it is entirely noninvasive. Historically, the major disadvantage of ASL is the fact that flow-sensitive information is obtained from the difference between control images and images in which blood has been magnetically tagged. This yields difference images with low signal-to-noise ratio (SNR), and consequently requires multiple averages to obtain adequate perfusion data. Improved acquisition schemes have emerged, however, prompting the use of ASL in clinical settings (Detre et al, 1998; Hendrikse et al, 2004). One promising volumetric ASL implementation is a single-shot three dimensional (3D) gradient and spin echo ASL (GRASE-ASL), with a number of advantages, including (1) significantly higher SNR (2.8 times) when compared with conventional two-dimensional echo planar imaging (EPI)-based ASL techniques and (2) a reduction in the imaging time by as much as eightfold (Gunther et al, 2005). The 3D GRASE-ASL can be used to achieve CBF quantitation with whole brain coverage, whereas two-dimensional echo planar imaging imaging techniques are currently limited to a few slices.
A further compelling advantage of ASL is its ability for repeated measurements and/or longitudinal study. Previous ASL implementations with a single inversion time (TI) have demonstrated reasonable CBF reproducibility (Yen et al, 2002). However, quantitative measurements can be improved with the use of multiple TIs, thereby enabling the fitting of an inflow kinetic curve to the data (Buxton et al, 1998). An advantage of multiple TI ASL acquisition is that it allows parametric estimation not only for CBF but also for the arterial arrival time (AAT). In much the same way as positron emission tomography and dynamic susceptibility contrast techniques have been used to measure cerebral physiology in healthy adults (Ito et al, 2000; Rempp et al, 1994; Wirestam et al, 2000), there are now a few examples where ASL has been used to measure changes in CBF due to a physiologic challenge, such as hypercapnia and/or infusion of a drug (Kofke et al, 2007; Noth et al, 2006). None of these examples in the literature, however, have attempted to quantify the associated changes in AAT, nor have perfusion changes been examined across the whole brain.
Here, we investigated the changes in CBF and AAT across the whole brain in healthy human subjects. We modulated cerebral perfusion by applying a well-controlled pharmacologically induced challenge using remifentanil. Remifentanil depresses breathing and causes an increase in PaCO2 (i.e., hypercapnia) (Pattinson et al, 2007; Wagner et al, 2001), and according to a recent dynamic susceptibility contrast MRI study, remifentanil produces an increase in CBF and cerebral blood volume and a decrease in the mean transit time (Lorenz et al, 2002). Results from this study show significant changes in both CBF and AAT at a voxel-wise level owing to remifentanil, indicating that it is feasible to compare cerebral perfusion states in much the same way that blood oxygenation level-dependent contrast functional MRI maps are used for voxel-wise group statistics. Arterial spin labelling may therefore be well suited for noninvasive longitudinal perfusion studies.
Materials and methods
Ten normal, healthy volunteers participated in this study (one woman, mean age 31 ± 6 years). Appropriate ethical approval was obtained from the Oxfordshire Research Ethics Committee. A medical history was performed by an anaesthetist to ensure that participants did not have any contraindications to remifentanil. An initial ‘bench-side’ examination was conducted as a medical screen to ensure that participants tolerated remifentanil, determined by monitoring blood pressure and oxygen saturation. The second examination was the MRI experiment described below, which was also performed under the supervision of an anaesthetist.
Physiology and Remifentanil Infusion
Pulsed ASL acquisitions were performed twice, once at the baseline and once after stabilized physiology during an intravenous infusion of remifentanil. The drug was delivered using a target-controlled infusion (Graseby 3500 TCI incorporating Diprisor, SIMS Graseby Ltd, Watford, UK) programmed to deliver an effect site concentration of 1.0 ng/mL via a vein in the left forearm. Participants fasted before the study (6 h for solids and 2 h for clear fluids) and were supervised for 1 h after termination of the infusion. They were instructed to remain awake with their eyes open during two ASL scans, each lasting 6 mins 30 secs. The time interval between the baseline and remifentanil ASL scan varied from 10 to 30 mins, during which the time additional functional MRI scanning was performed but not reported here. This time interval was counterbalanced across participants.
The participants wore a tight fitting facemask (Hans Rudolph, KA, USA), which was attached to the breathing system. Oxygen saturations and heart rate were monitored continuously and noninvasive blood pressure was recorded at the beginning of both scans (In Vivo Research, Orlando, FL, USA). Inspired and expired CO2 and O2 traces were determined using rapidly responding gas analyzers (Models CD-3A and S-3A; AEI Technologies, Pittsburgh, PA, USA) and displayed and recorded with a data acquisition device sampling at 100 Hz (PowerLab 8, AD Instruments, Colorado Springs, CO, USA) and using a dedicated laptop to collect physiologic measurements (Chart 5, AD Instruments). End-tidal partial pressure expired O2 (PETO2) levels were maintained constant at 225 mm Hg by manual control of the gas mixture by one of the experimenters. End-tidal partial pressure CO2 (PETCO2) values were calculated retrospectively using custom software in Matlab to find breath-by-breath end-tidal values in the CO2 trace for each participant. The fractional change in CBF was divided by the difference in PETCO2 to produce a cerebral vascular response (CVR) in units of percentage of CBF change per mm Hg (Kanno et al, 1988).
Magnetic Resonance Imaging
Arterial spin labelling images were acquired on a 3 T scanner (TIM Trio, Siemens, Erlangen, Germany) with a body transmit coil and 12 channel head receive coil. Using a flow-sensitive alternating inversion recovery (FAIR) labelling scheme (Kim, 1995), a series of whole-brain volumes were acquired using a 3D GRASE imaging readout. Compared with a conventional echo planar imaging readout, GRASE has recently been shown to produce two to three times the SNR in ASL images. The pulse sequence diagram for the GRASE-ASL is described elsewhere (Gunther et al, 2005). With this volumetric readout, the imaging volume was 200 mm × 200 mm × 96 mm (half k-space coverage; 64 × 64 × 24 matrix size; voxel dimensions: 3.1 mm × 3.1 mm × 5.0 mm). The repetition time (TR) and echo time (TE) were 3,100 and 39.9 ms, respectively. Background suppression of static tissue was achieved using two nonselective inversion pulses, which are prescribed at times that will null the signal from background grey matter and white matter. This ASL implementation has been shown to improve the temporal stability of the difference images and therefore decreases the noise in the CBF measurement (Ye et al, 2000), but does not affect the absolute value. Optimal inversion null times were calculated for signals with approximate T1 values 0.7 and 1.4 secs, which is consistent for white matter and grey matter, respectively, at 3.0 T (Lu et al, 2005), using the following expression (Gunther et al, 2005):
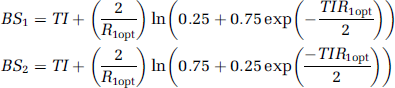
As an example, for a TI = 1.5 secs and R1opt = (0.7s)−1, the background suppression times (BS1 and BS2) are 0.54 and 1.24 secs. In addition, posttagging saturation of the imaging plane and a modulated Q2TIPS (quantitative imaging of perfusion with a single subtraction with thin-slice TI1 periodic saturation) scheme above and below the imaging slab (creating a tagged bolus duration of τ ≤ 2,000 ms) were incorporated into the acquisition. Values for TI were chosen to span the ASL kinetic curve (TI range: 500 to 2,500 ms in increments of 250 ms) and represent the time delay between the tagging and imaging excitation pulse. Seven control and seven tag volumes were acquired at each of the nine TI values, resulting in a total acquisition time of 6 mins 30 secs. For those TI values long enough to allow it, a fixed tag bolus duration of 2,000 ms was imposed, after which the Q2TIPS saturation commenced.
A 6-mm full-width-half-maximum spatial smoothing kernel filter was applied to the ASL images before sinc-interpolated subtraction between tag and control volumes (Mumford et al, 2006). The top and bottom three slices in each ASL imaging volume were excluded due to wrap around in the z-direction in some participants. Gradient and spin echo ASL voxels in the brain were extracted using a brain extraction tool, supplied as part of FSL (FMRIB's Software Library; http://www.fmrib.ox.ac.uk/fsl) (Smith, 2002). Next, the 14 control-tag difference images were averaged at each TI, producing an ASL kinetic curve to which a two-parameter model was fit for each voxel (Buxton et al, 1998). Fitting was performed using a least-squares routine in Matlab (Mathworks, Natick, MA, USA), producing estimates of CBF (in relative units) and AAT (in seconds) (see Supplementary figure). Confidence intervals were calculated from the results of the fitting routine for the CBF and AAT estimates. A z-statistics (i.e., μCBF/σCBF) was calculated and maps were thresholded at z > 2.3 (P < 0.01), ensuring that only significant voxels were used in the group statistics.
A calibration GRASE scan, required for CBF quantification, was performed with a long TR (6,000 ms), long TI (5,000 ms) and in the absence of background suppression, but otherwise identical imaging parameters. From the calibration scan, a mask of cerebrospinal fluid (CSF) voxels was generated by manual segmentation. Relative CBF estimates were then converted to absolute values using a known proton density ratio between CSF and blood (Wu and Wong, 2006), and following correction for the TR and TI values used in the calibration scans, and the RF profile of the 12 channel receive coil (see Appendix). Registration to anatomic and standard space images was performed using a linear image registration tool in a two-step process (Jenkinson et al, 2002) as follows: (1) the ASL scans were registered to the subject's high-resolution T1-weighted anatomic scan that was acquired during the experiment; (2) a second high-resolution T1-weighted anatomic image was performed and registered to the average Montreal Neurological Institute (MNI) brain in standard space. Anatomic T1-weighted inversion-prepared images were acquired in a coronal orientation using an imaging matrix of 256 × 192 × 224. Parameters were TR = 2,500, TI =1,100, TE = 4.47 ms, and flip angle = 8°, with spatial resolution of 1 mm × 1 mm × 1 mm. The T1-weighted images were used to segment the brain using FSL to calculate the effects of CO2 increase on grey matter perfusion.
Group Analysis
A nonparametric permutation-based statistical analysis was used to test for voxel-wise differences between baseline and remifentanil conditions (Nichols and Holmes, 2002). This iterative procedure amounted to performing a pairwise t-test across participants with the permutation occurring by reversing the sign of the condition for a participant at random (remifentanil versus baseline: [1, −1] to [-1, 1]). Although computationally intensive, a permutation test provides the means to account for family-wise error. A total of 5,000 permutations were performed using a tool within the FSL environment and resultant voxels are reported with a corrected P-value (P < 0.0500 ± 0.0062).
Results
The physiologic effects of remifentanil were consistent across participants (Table 1), although physiology and MRI data were not properly synchronized for one participant, so physiology data were therefore excluded for this participant. The drug significantly decreased breathing rate (P < 0.05) and increased PETCO2 (P < 0.001), whereas heart rate, blood pressure, and PETO2 were unchanged. During infusion of remifentanil, GRASE-ASL difference images tended to have higher signal compared with baseline (Figures 1B and 1D), and the respiratory trace shows a reduced frequency and irregular pattern (Figures 1A and 1C).
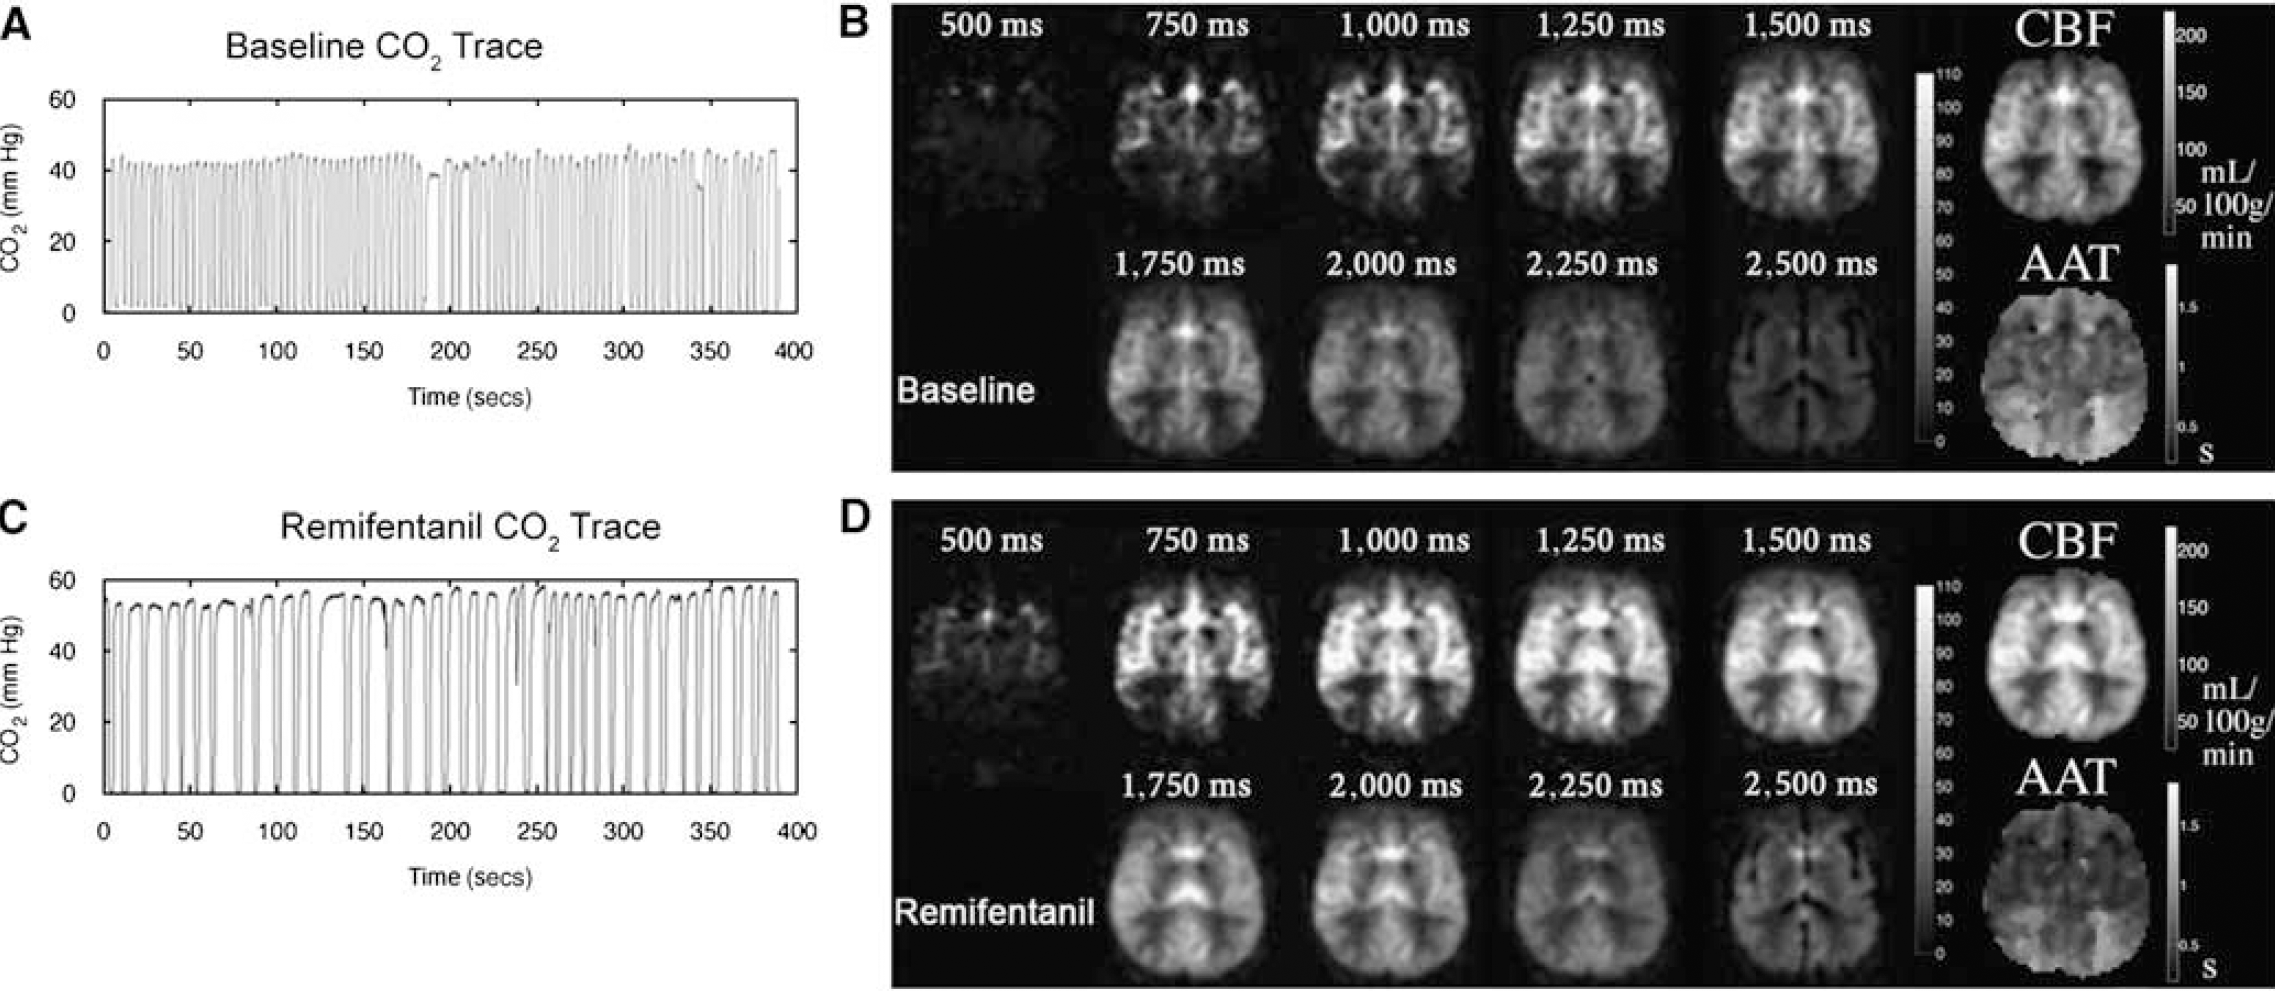
Measured CO2 traces are shown at baseline (
Summary of the mean physiologic effects of remifentanil across participants (N = 9, s.d. in parentheses)
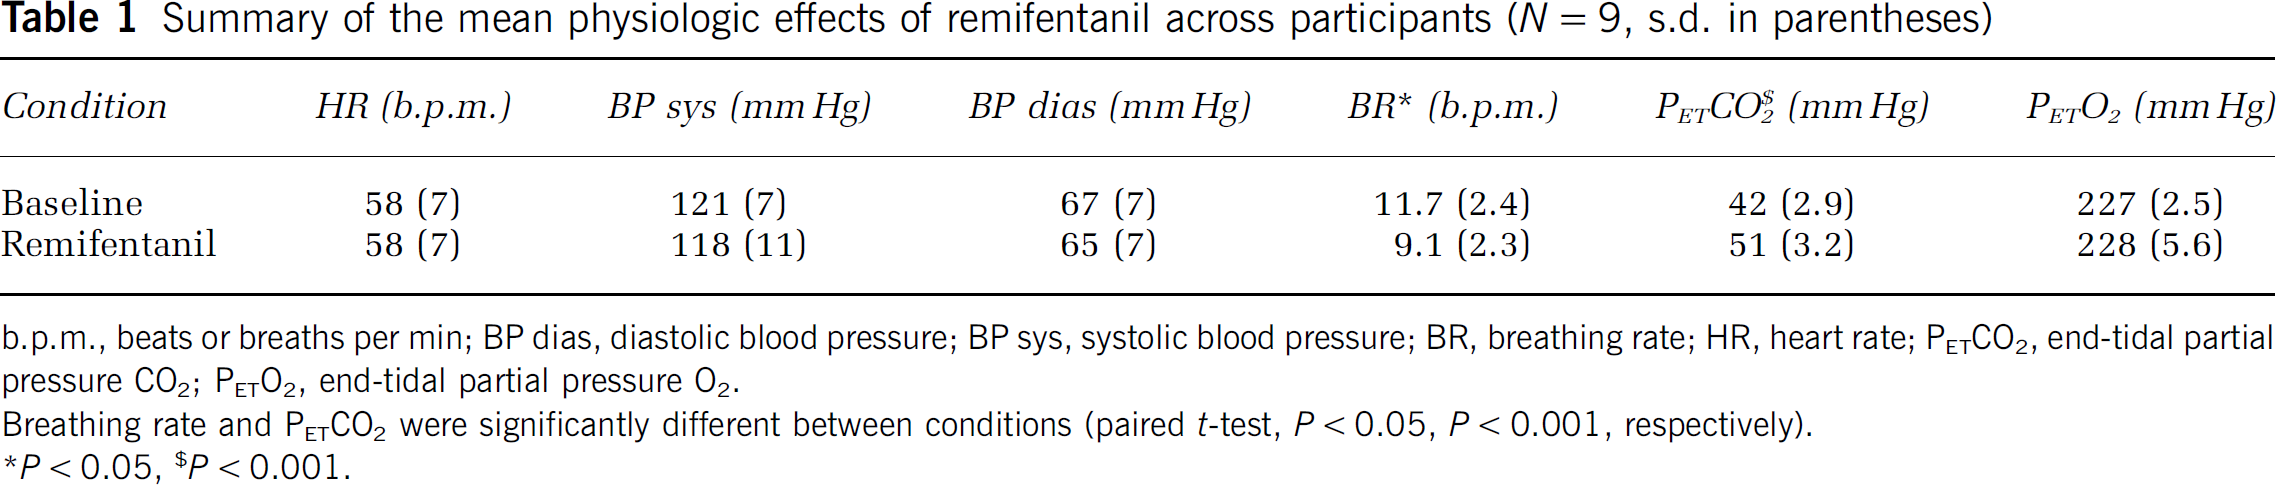
b.p.m., beats or breaths permin; BP dias, diastolic blood pressure; BP sys, systolic blood pressure; BR, breathing rate; HR, heart rate; PETCO2, end-tidal partial pressure CO2, PETO2, end-tidal partial pressure O2.
Breathing rate and PETCO2 were significantly different between conditions (paired t-test, P < 0.05, P < 0.001, respectively).
P < 0.05,
P < 0.001.
Cerebral blood flow estimates from the GRASE-ASL data showed a whole brain increase in perfusion from 57 ± 12.0 to 77 ± 18.4 mL/100 g tissue per min. In grey matter, the increase was 62 ± 12.0 to 84 ± 19.8 mL/100 g tissue per min between baseline and remifentanil conditions, respectively (Figure 2A). Table 2 shows baseline CBF and AAT values calculated by region-of-interest (ROI) analysis, as well as changes in CBF and AAT calculated by ROI. This showed that the largest changes in CBF were observed in the thalamus, anterior cingulate, and insular cortices.
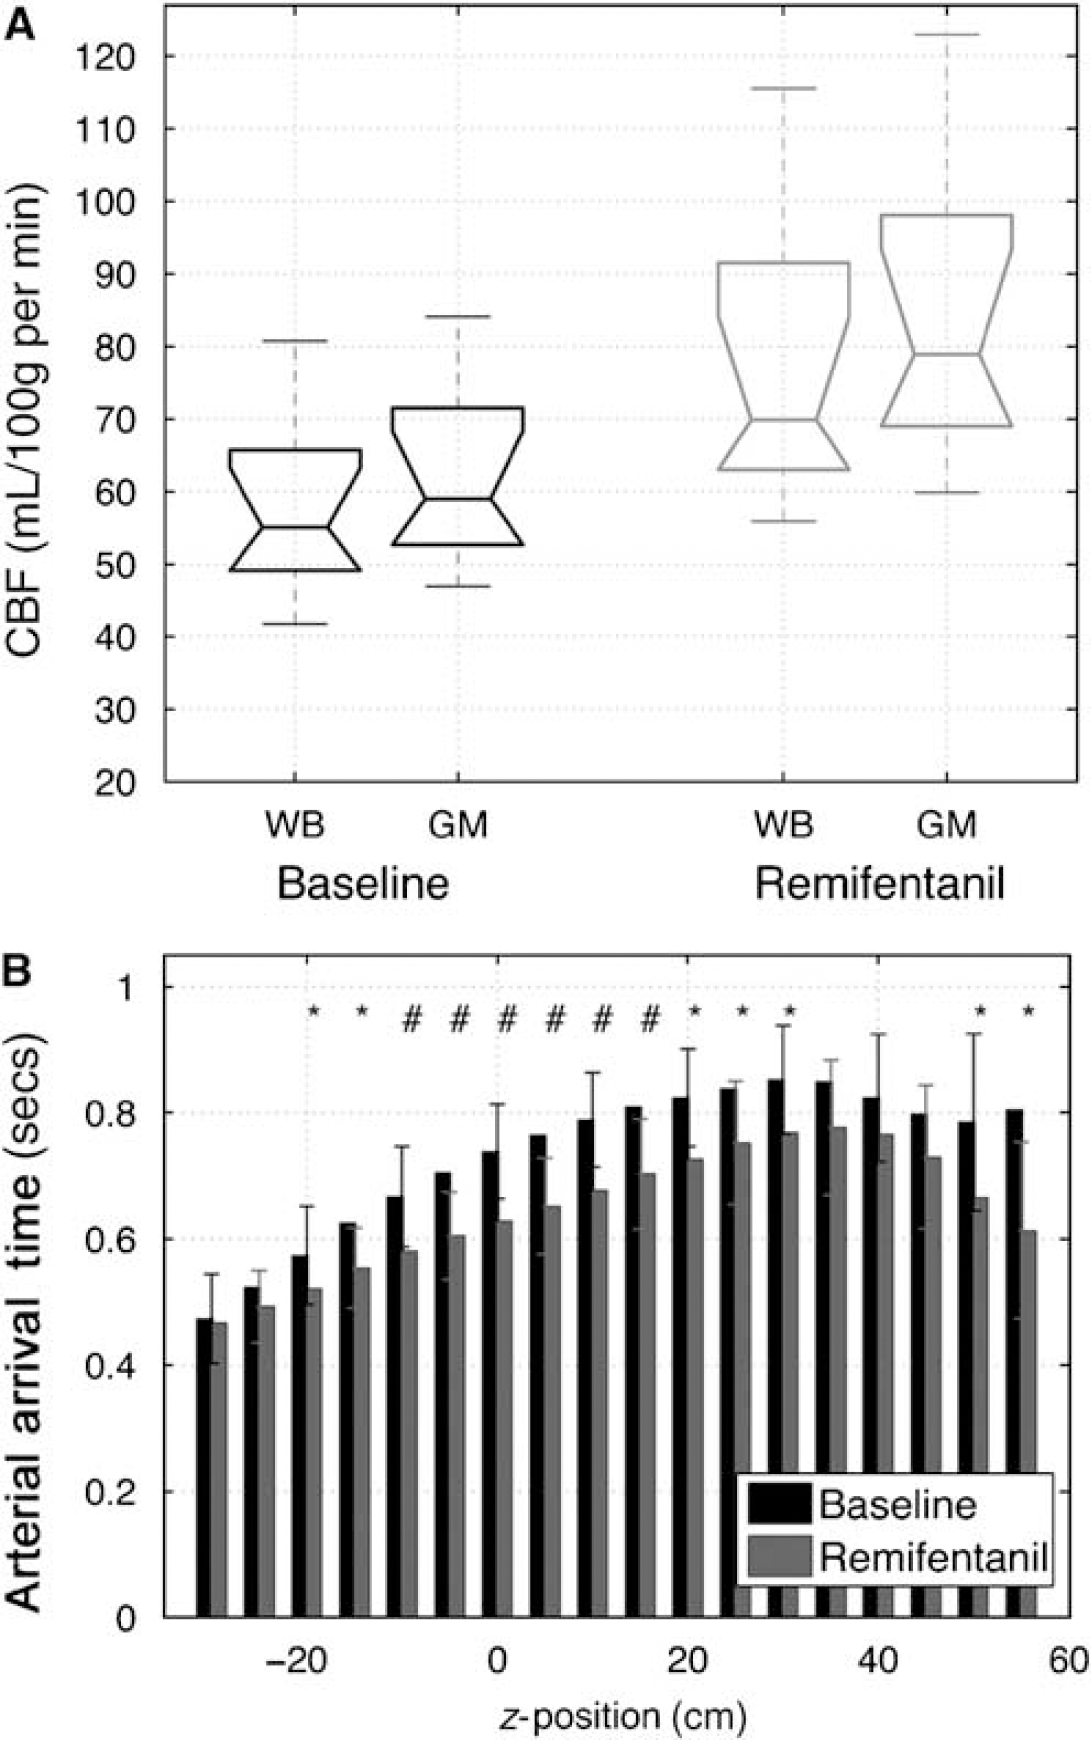
Cerebral blood flow and AAT values across participants (N = 10). (
Region-of-interest analysis: quantifying CBF and the AAT at baseline (Base) and the absolute changes as a consequence of the remifentanil (i.e., ΔCBF = CBFRemi-CBFBsse; ΔAAT = AATRemi-AATBsse) across participants (N = 10)
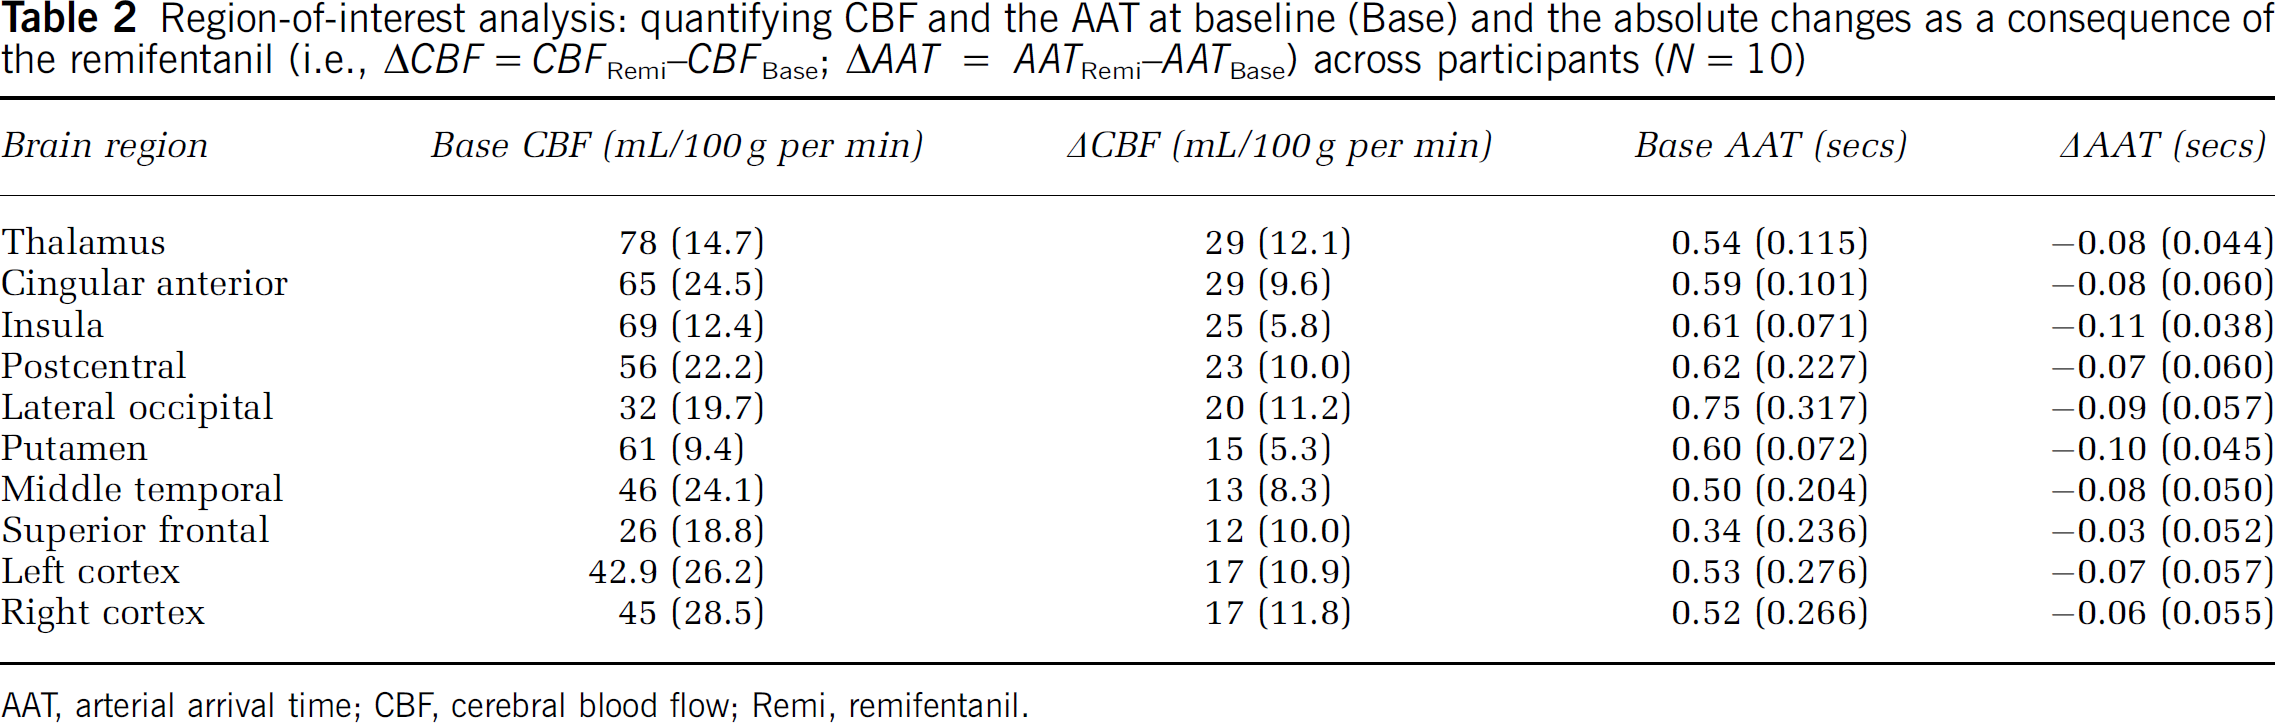
AAT, arterial arrival time; CBF, cerebral blood flow; Remi, remifentanil.
Estimates for CBF and AAT were thresholded to ensure that only voxels with a significant fit were then passed for group comparison. This translated to 85.1 ± 6.55% of the total voxels that were found to have a significant z-statistics of >2.3 (P < 0.01) for the CBF estimates during the baseline condition (90.3 ± 5.97% during the remifentanil condition). From the AAT maps at baseline, 84 ± 6.0% of the voxels produced a significant z-statistics (i.e., z > 2.3; 83 ± 6.0% during the remifentanil condition). A one-tailed t-test showed that the CBF estimates produced more statistically significant voxels compared with the AAT estimates (P < 0.021).
Within grey matter voxels, the fractional change in CBF across participants was found to be 36 ± 14.1% whereas the fractional change in AAT was smaller but with less variation (−12 ± 2%). In addition, our ability to measure AAT depends on the number of TIs and the increment value, and it would be prudent to further optimize the sampling strategy in relation to the total scan duration to improve estimation of AAT. In Figure 2B, an increase in the AAT is observed as a function of increasing slice position in the superior direction, which is to be expected for brain regions that are increasingly distal. The voxel-wise AAT, however, is reduced in the remifentanil condition relative to the rest condition, resulting in a significant difference in the AAT for 14 of the 18 slices in the analysis. The s.d. for the mean AAT was found to increase in the upper axial slices, which is likely a reflection of greater uncertainty at longer AAT values and also to the effects of the wrap-around artefact that compromised the image quality in higher slices.
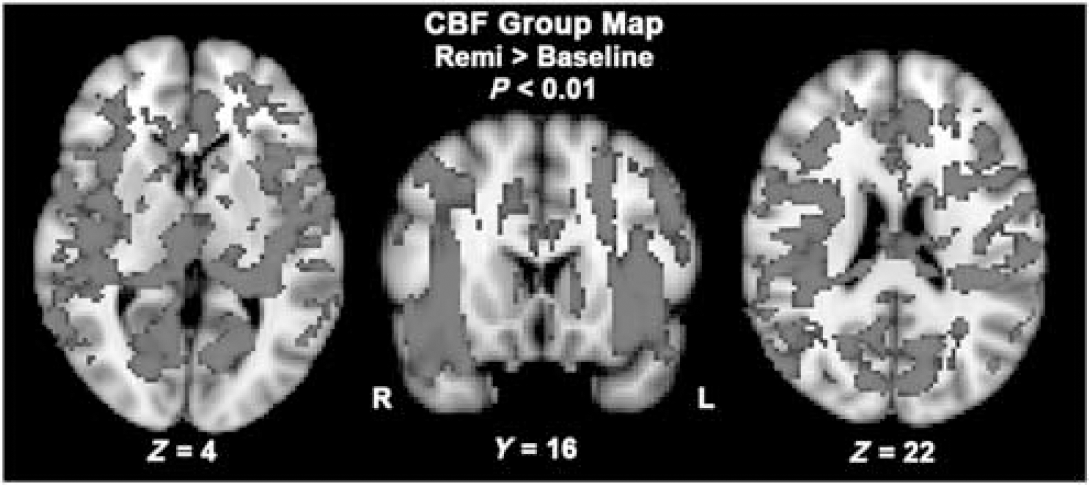
Voxel-wise comparison of CBF between baseline and during remifentanil infusion (ΔCBF = CBFRemi-CBFBsse; significant increases in red). Significant voxels across the group (N = 10) were determined by permutation testing (P < 0.01, voxel-wise corrected for multiple comparison).
The results of the voxel-wise group comparison (remi—baseline) are shown in Figures 3 and 4 for CBF and AAT, respectively (P < 0.01, corrected; increases in red, decreases in yellow). Of note, only positive changes were detected for the CBF group comparison, whereas the converse was observed for the AAT group comparison, that is only significant decreases in AAT were found. Cerebral blood flow increases were found uniformly across the brain, mainly concentrated in cortical grey matter, as well as in sub-cortical structures such as the thalamus and putamen. Lower SNR was observed in anterior parts of the frontal lobes and in the posterior occipital lobes, and hence these regions were not identified in the CBF group map. Compared with the CBF group contrast map, fewer voxels were significant in the AAT group map. A large proportion of reduced AAT voxels were found in middle cerebral artery and anterior cerebral artery vascular territories. However, a number of parietal and frontal lobe regions were also found to have a significantly reduced AAT, namely the bilateral insula, cingulate gyrus, and the left putamen (Figure 4).
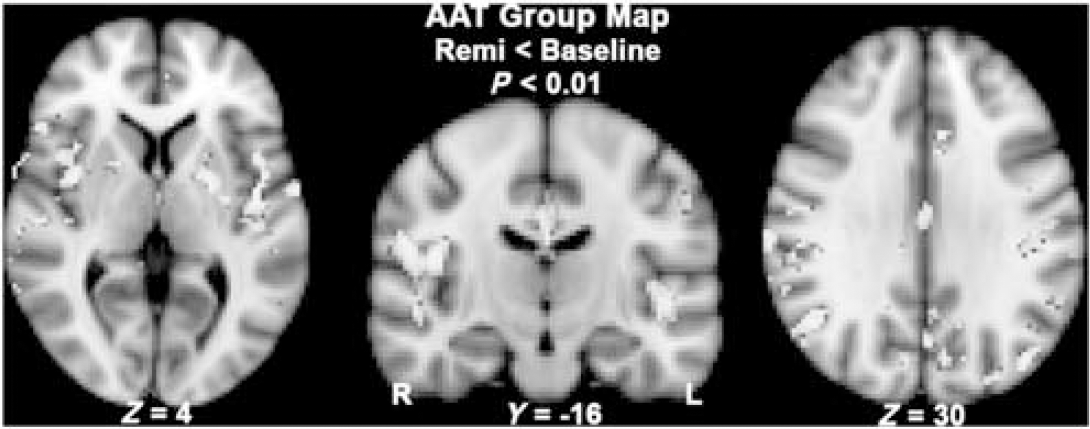
Voxel-wise comparison of the arterial arrival time (AAT) at baseline and during remifentanil infusion (ΔAAT = AATRemi−AATBase; significant decreases in yellow). Only significant decreases in AAT were found, such that AATRemi < AATBase (P < 0.01, corrected).
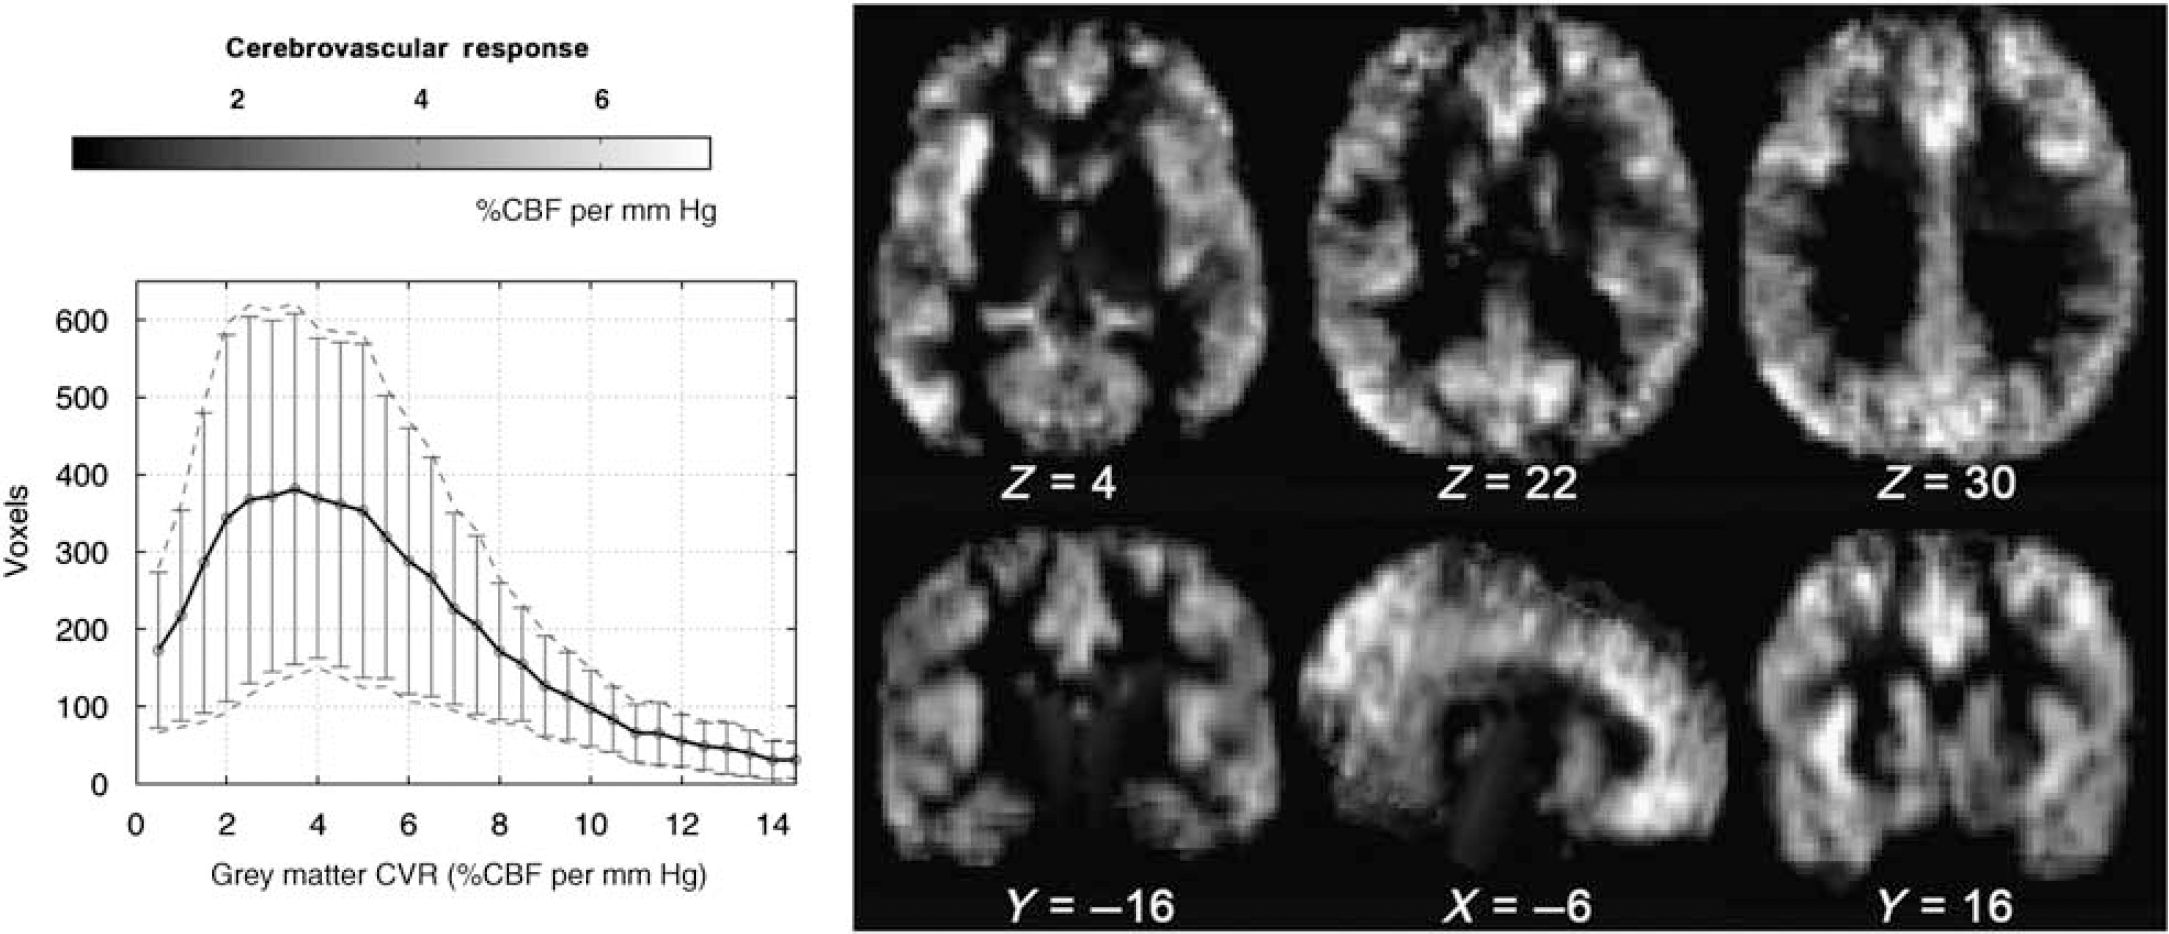
Mean cerebrovascular response (CVR) map from 9 of 10 participants, calculated using the following expression: 100 × (CBFRemiCBFBase)/CBFBase/ΔP ET CO 2 (%CBF change per mm Hg). One participant was excluded due to a timing error between physiologic monitoring and MRI acquisition. The histogram shows the distribution of CVR values for grey matter voxels (error bars denote s.d. across participants).
The average CVR was calculated across nine participants and shown in Figure 5 (as above, one participant was excluded in the average CVR map owing to a timing error between physiologic monitoring and MRI acquisition). The histogram of CVR values shows that the average reactivity was 5.7 ± 1.60 %CBF per mm Hg change in PETCO2, which is consistent with the results of a conventional mild hypercapnia challenge (Noth et al, 2006).
Discussion
In this study, we have shown that it is possible to use 3D GRASE-ASL to detect changes in CBF and AAT with 3D coverage, at an individual as well as group level, associated with the administration of remifentanil. There are three main findings from this study that are important for the perfusion imaging literature. First, comparison of the two physiologic conditions showed significant voxels across the brain using a GRASE-ASL acquisition that is both time efficient and yields robust perfusion values. Second, our multiple TI acquisition strategy produced accurate measurement of the AAT, a parametric map that is analogous to the mean transit time, but a physiologic metric that has yet to be characterized in the context of physiology or functional experiments. Third, remifentanil-induced hypercapnia was found to consistently increase CBF and reduce AAT, because no significant voxels were found with the converse contrast (i.e., reduce CBF and increase AAT).
Physiologic Effects of Remifentanil
Administration of remifentanil at an effect site concentration of 1.0 ng/mL produced a significant increase in the PaCO2 during which time O2 levels were maintained through manual control of the inspiratory gas mixture. This paradigm was developed to minimize confounding effects of changes in PaO2 (Pattinson et al, 2007) (Wise et al, 2007). Opioid drugs, such as remifentanil, do not have a uniform specific effect on the brain because their effect depends on the opioid receptor density. Studies have shown that the thalamus, putamen, amygdala, and the anterior cingulate have the highest opiate receptor-binding potential (Baumgartner et al, 2006), which means opioid binding in these regions is likely to affect metabolic activity and by extension perfusion. The results of this study show a significant hyperperfusion effect, most likely because the hypercapnia-induced vasodilation effects are much larger than the physiologic consequences of opiate binding. In practice, however, separation of the physiology into its constituent components is not possible with the current data. The combined and potentially competing perfusion effects of remifentanil and hypercapnia may help to explain why a lower CVR (5.7 ± 1.60 %CBF per mm Hg change in PETCO2) was observed in this study when compared with a study involving a pure 7% CO2 hypercapnia challenge in young adults (7.4 ± 3.9 % CBF per mm Hg) (Ito et al, 2002).
Arterial Spin Labelling
The improved ASL image quality using GRASE-ASL enabled group comparisons to be performed on a voxel-by-voxel level, analogous to a blood oxygenation level-dependent functional MRI group analysis, and thereby showing perfusion changes at a higher spatial resolution. Previously it has been reported that there is an accuracy benefit to modelling the ASL kinetic curve on a voxel-wise level rather than on an ROI level (Figueiredo et al, 2005). The voxel dimensions in this study were 3.1 × 3.1 × 5 mm3, which are relatively high spatial resolution when compared with ASL and positron emission tomography perfusion studies in the literature. Therefore, the partial volume effects are expected to be reduced and this may help to explain why the grey matter perfusion estimates in this study are higher compared with published positron emission tomography values in young adults (Ito et al, 2002).
Acquisition of ASL data at multiple inflow times permits estimation of not only the CBF value but also the AAT (also known as the bolus arrival time or arterial transit time in the ASL literature). During remifentanil infusion, AAT values were found to decrease systematically while CBF increased. The minimum achievable AAT is governed by how fast the tagged blood reaches the ROI and our ability to detect this change depends on the temporal sampling, which in this study was inflow increments of 250 ms. The dynamic range of the CBF, by comparison, is inherently larger. Figure 4 demonstrates that the ΔAAT group map provides additional and complementary information to the ΔCBF group maps in Figure 3. The spatial differences between the ΔAAT and ΔCBF maps are more a reflection of the conservative permutation testing that was performed since reducing the statistical threshold in the ΔAAT group map increases the overlay between the two group maps.
The current GRASE-ASL implementation is not without its limitations. First, the relatively long imaging readout (i.e., switched gradient-refocused echo trains) increased the susceptibility effects and produced signal roll off in the anterior-posterior direction. Second, the signal amplitude decay in the Carr-Purcell-Meiboom-Gill (CPMG) echo train and the small number of phase encode steps in the slice dimension produced blurring in the z-direction. Therefore, attempting to improve the image uniformity is an important area of necessary further development.
Areas of increased CBF owing to remifentanil were found uniformly across the brain, whereas a large proportion of reduced AAT voxels (Figure 4) were found to be concentrated in middle cerebral artery and anterior cerebral artery vascular territories. There are at least two possible explanations for this observation. First, increased PaCO2 causes vasodilation of the arterioles, which means that areas of reduced AAT may be more concentrated in regions of the brain with higher arteriole density. Second, the lack of arterial suppression (bipolar gradient for velocity-dependent signal dephasing) in the current implementation of the GRASE-ASL may have caused an accentuated visibility of large arteries. There is a precedence to address the arterial contribution (1) through the use of large artery suppression during ASL acquisitions (Petersen et al, 2006; Ye et al, 1997) or (2) by incorporating a two-compartment exchange model (Donahue et al, 2006; Parkes and Tofts, 2002). Such strategies, however, are not without their issues, such as the reduction in SNR or the potential to over fit the ASL data, respectively.
The primary advantages of the 3D GRASE-ASL are (1) large brain coverage and (2) the increase in SNR compared with two-dimensional ASL imaging (Feinberg et al, 1995; Gunther et al, 2005). Consequently, kinetic curve modelling of the ASL data can be performed with only seven difference pairs at each TI, resulting in a relatively short acquisition of 6 mins 30 secs. This sequence is therefore amenable to longitudinal studies.
Conclusion
This study shows that 3D GRASE-ASL has the ability to detect significant changes in cerebral perfusion and the time that the magnetically labelled blood arrives at the brain ROI, that is the AAT. The fractional changes in CBF due to remifentanil were found to be approximately 36 ± 14% (ΔCBF/CBF), which is lower than one might measure in response to a neuronal activation finger tapping paradigm (Chiarelli et al, 2007), for example, indicating that low fractional CBF changes can be investigated with 3D GRASE-ASL. The results suggest that 3D GRASE-ASL has the sensitivity for clinical or further pharmacological studies. An additional potentially attractive application is to use whole brain ASL perfusion and AAT maps in conjunction with activation blood oxygenation level-dependent functional MRI studies to improve haemodynamic modelling or group statistics.