In vivo13C magnetic resonance spectroscopy has been applied to studying brain metabolic processes by measuring 13C label incorporation into cytosolic pools such as glutamate and aspartate. However, the rate of exchange between mitochondrial α-ketoglutarate/oxaloacetate and cytosolic glutamate/aspartate (Vx) extracted from metabolic modeling has been controversial. Because brain fumarase is exclusively located in the mitochondria, and mitochondrial fumarate is connected to cytosolic aspartate through a chain of fast exchange reactions, it is possible to directly measure Vx from the four-carbon side of the tricarboxylic acid cycle by magnetization transfer. In isoflurane-anesthetized adult rat brain, a relayed 13C magnetization transfer effect on cytosolic aspartate C2 at 53.2ppm was detected after extensive signal averaging with fumarate C2 at 136.1ppm irradiated using selective radiofrequency pulses. Quantitative analysis using Bloch–McConnell equations and a four-site exchange model found that VxE13–19 µmol per g per min (≫VTCA, the tricarboxylic acid cycle rate) when the longitudinal relaxation time of malate C2 was assumed to be within ±33% of that of aspartate C2. If VxEVTCA, the isotopic exchange between mitochondria and cytosol would be too slow on the time scale of 13C longitudinal relaxation to cause a detectable magnetization transfer effect.
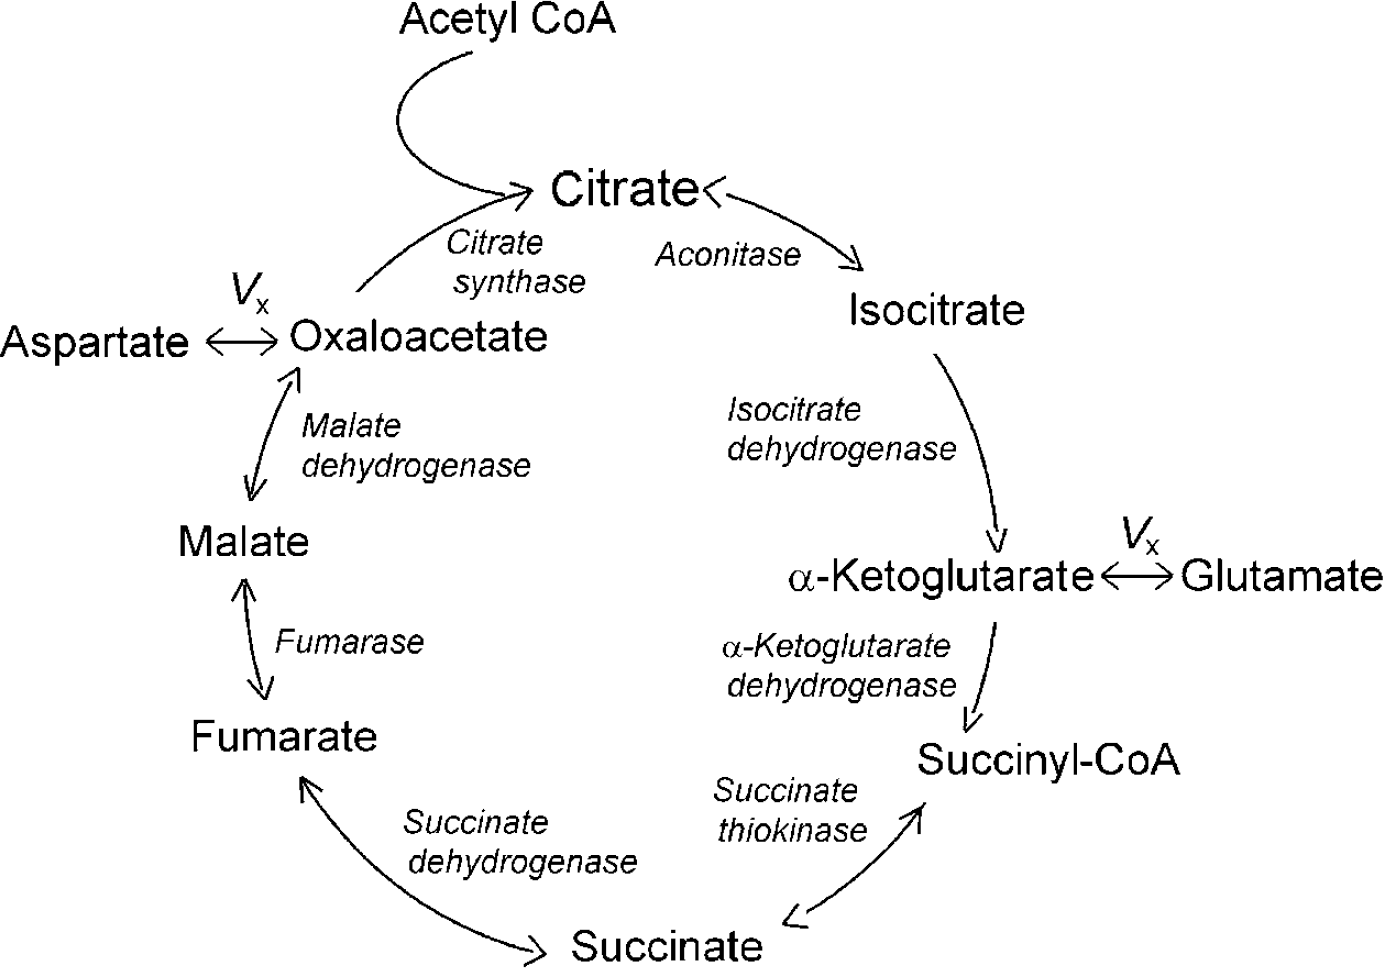
The complete TCA cycle is known to occur exclusively in mitochondria. In brain, several enzymes from the TCA cycle machinery (pyruvate dehydrogenase, citrate synthase, fumarase, and succinate thiokinase) are exclusively located in the mitochondria (e.g., Siesjo, 1978; Akiba et al, 1984; Lai and Clark, 1989; Rodrigues and Cerdan, 2006), although many other enzymes involved in the TCA cycle (e.g., malate dehydrogenase, aconitase, and isocitrate dehydrogenase) are found in the cytosol of neurons and astroglia as well (Koen and Goodman, 1969; Siesjo, 1978; Rodrigues and Cerdan, 2006). It was noted in the use of in vivo13C MRS to measure the brain TCA cycle rate that glutamate C4 turnover time-course data alone were not sufficient to separate the TCA cycle flux rate (VTCA) from the rate of exchange between mitochondrial α-ketoglutarate/oxaloacetate and cytosolic glutamate/aspartate (Vx, Figure 1) (Mason et al, 1992, 1995). This is because MRS detects the total, and therefore predominantly cytosolic, glutamate signal while the mitochondrial glutamate pool is negligibly small in size. Time-course data of glutamate C2 and C3 labeled during the second turn of the TCA cycle also depend on VTCA and Vx. Using metabolic models to fit the combined time-course data of glutamate C4 and other position(s) can, in principle, extract both VTCA and Vx. Whether Vx is slow (VxEVTCA) or fast (Vx≫VTCA) in brain is a matter of considerable debate in the field of 13C MRS (e.g., Chance et al, 1983; Mason et al, 1992, 1995; Gruetter et al, 2001; Patel et al, 2004; de Graaf et al, 2004; Berkich et al, 2005; Shen, 2006). The main focus of this debate has been on metabolic modeling of 13C label incorporation into glutamate and aspartate for extraction of Vx.
The relationship between the TCA cycle and Vx used in brain metabolic models to describe the kinetics of 13C label incorporation from mitochondrial TCA cycle intermediates into predominantly cytosolic glutamate and aspartate pools (adapted from Figure 43 in Siesjo (1978)). Vx represents the lumped exchange between mitochondrial α-ketoglutarate/oxaloacetate and cytosolic glutamate/aspartate.
In vivo magnetization transfer spectroscopy allows detection of the rapid exchange of phosphate groups, which occurs between phosphocreatine and adenosine triphosphate catalyzed by creatine kinase using 31P MRS (Alger and Shulman, 1984; Leibfritz and Dreher, 2001). We hypothesized that the 13C label exchange between mitochondria and cytosol may be directly detectable using in vivo magnetization transfer spectroscopy if Vx≫VTCA.
The α-ketoglutarate↔glutamate and oxaloacetate↔ aspartate exchange reactions catalyzed by aspartate aminotransferase have been found to be very fast and cause a marked magnetization transfer effect on glutamate and aspartate in rat brain when α-ketoglutarate and oxaloacetate were irradiated using radiofrequency pulses (Shen, 2005). When malate is irradiated, a relayed magnetization transfer effect can be detected on aspartate because of the rapid malate ↔ oxaloacetate ↔ aspartate exchange reactions (Yang and Shen, 2007). Aspartate aminotransferase, malate dehydrogenase, and their substrates reside in both cytosolic and mitochondrial compartments (Siesjo, 1978). Because of the extremely small fraction of contributions from mitochondrial pools (e.g. Sols and Marco, 1970; Wu et al, 2007), the earlier detected magnetization transfer effects catalyzed by aspartate aminotransferase and malate dehydrogenase are predominantly cytosolic and, therefore, cannot be used to extract Vx. In contrast, brain fumarase is localized to mitochondria. Fumarase, malate dehydrogenase, and aspartate aminotransferase catalyze a linear chain of rapid exchange reactions in mitochondria, none of which are involved in the control of VTCA (Leong and Clark, 1984). Vx connects the mitochondrial and cytosolic exchange systems. Thus, we hypothesized that a fast Vx (Vx≫VTCA) between mitochondrial matrix and cytosol should cause a detectable relayed 13C magnetization transfer effect on cytosolic aspartate when fumarate is irradiated using radiofrequency pulses. However, if Vx is slow (VxEVTCA), no detectable relayed 13C magnetization transfer effect between mitochondrial fumarate and cytosolic aspartate would be expected.
Materials and methods
Theory
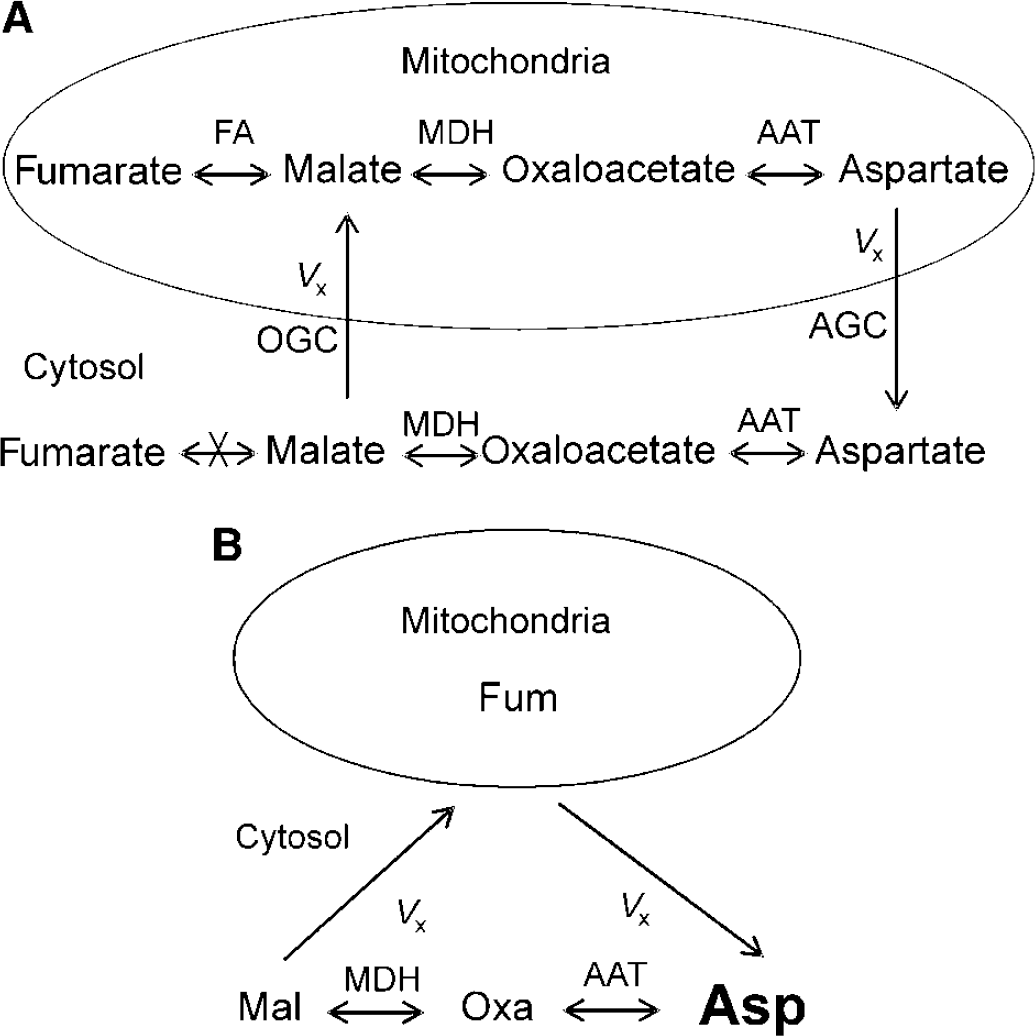
Figure 2A shows the diagram for the exchange between cytosol and mitochondria on the four-carbon side of the TCA cycle (Siesjo, 1978). Cytosolic malate enters mitochondria through the oxoglutarate carrier (also known as the malate/α-ketoglutarate exchanger). Aspartate then leaves mitochondria through the aspartate/glutamate carrier. The rapid exchange reactions between malate and oxaloacetate and between oxaloacetate and aspartate are catalyzed by malate dehydrogenase and aspartate aminotransferase, respectively. In mitochondria, malate also rapidly exchanges with fumarate catalyzed by fumarase. In Figure 2, only cytosolic aspartate has a significant pool size (e.g. Siesjo, 1978; Wu et al, 2007) and is detectable by MRS. To estimate Vx using 13C magnetization transfer, a four-site exchange model is depicted in Figure 2B. The small mitochondrial fumarate, malate, oxaloacetate, and aspartate pools are lumped into a single-mitochondrial site denoted by Fum, which is saturated by radiofrequency irradiation of fumarate C2 at 136.1 ppm. The cytosolic malate, oxoloacetate, and aspartate C2 carbons are denoted by Mal, Oxa, and Asp, respectively. This simplified procedure attributes the loss of saturation inside the mitochondrial matrix to Vx. The Vx value calculated from this model, therefore, represents its lower limit.
(A) The exchange of four-carbon molecules between cytosol and mitochondria (adapted from Figure 46 in Siesjo (1978)). Cytosolic malate enters mitochondria through the oxoglutarate carrier (OGC). Mitochondrial aspartate enters cytosol through the aspartate/glutamate carrier (AGC). The rapid exchange reactions between malate and oxaloacetate and between oxaloacetate and aspartate are catalyzed by malate dehydrogenase (MDH) and aspartate aminotransferase (AAT), respectively. In mitochondria, malate is also in rapid exchange with fumarate catalyzed by fumarase (FA). (B) Simplified four-site exchange model for estimating Vx using relayed 13C magnetization transfer spectroscopy and the Bloch–McConnell equations. The small mitochondrial fumarate, malate, oxaloacetate, and aspartate pools are lumped into one site denoted by Fum. This simplification attributes loss of saturation inside mitochondrial matrix to Vx. The Vx value calculated through this model, therefore, represents its lower limit. The large font size for cytosolic aspartate is to indicate that its pool size is overwhelmingly larger than all other pools in the diagram. Mal, cytosolic malate; Oxa, cytosolic oxoloacetate; Asp, cytosolic aspartate.
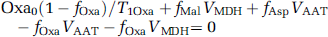
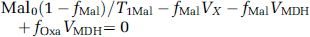
The steady state Bloch–McConnell equations for the four-site exchange model depicted in Figure 2B are
where Asp0, Mal0, and Oxa0 are the equilibrium magnetization of cytosolic aspartate, malate, and oxaloacetate C2 carbons, respectively; fAspfAspsteadystate/Asp0, fMalfMalsteadystate/Mal0, and fOxafOxasteadystate/Oxa0; T1Asp, T1Mal, and T1Oxa are the longitudinal relaxation times of cytosolic aspartate, malate, and oxaloacetate C2 carbons, respectively, in the absence of any chemical exchange. VAAT and VMDH are the exchange flux rates catalyzed by cytosolic aspartate aminotransferase and malate dehydrogenase, respectively; Vx is the rate of isotopic exchange between cytosol and mitochondria.
In Equation (2), Oxa0(1–fOxa/)/T1Oxa can be omitted because Oxa0/T10xa < < VAAT, VMDH, as noted previously (Yang and Shen, 2007). Equations (1–3) can be used to estimate Vx from experimentally measured fAsp on saturation of fumarate C2:
where fOxa/ = (fAspVAATfAsp0(1–fAsp)/T1Asp)/VAAT and fMal = (fOxa/(VAAT +VMDH)–fAspVAAT)/VMDH. Asp0=2.8µmol/g (Siesjo, 1978; Yang and Shen, 2005). Mal0=0.3µmol/g (Siesjo, 1978). Our previous work (Shen, 2005; Yang and Shen, 2007) found that VAAT (oxaloaceate ↔ aspartate) = 29 µmol per g per min, VMDH=9µmol per g per min, and T1Asp=2.2 secs. In Equation (4), only T1Mal is unavailable because malate is below the detection threshold of in vivo MRS. Instead, Vx will be estimated by assuming T1Mal=0.67–1.33 × T1Asp, because both malate and aspartate C2 carbons are singly protonated, and because the two molecules are small and similar in size (Wehrli, 1976).
Animal Preparation and Physiology
All animal experiments were approved by the National Institute of Mental Health Animal Care and Use Committee. Male Sprague–Dawley rats (176 to 213 g, n = 8) that fasted for 24 h with free access to drinking water were studied to measure Vx in the rat brain. The rats were orally intubated and mechanically ventilated using a mixture of 70% N2O/30% O2 and 1.5% isoflurane. The left femoral artery was cannulated for sampling blood and monitoring arterial blood pressure. Arterial blood gases (pO2, pCO2), pH, and blood glucose concentrations were measured using a blood analyzer (Bayer Rapidlab 860, East Walpole, MA, USA). The left femoral vein was also cannulated for infusion of [1,6-13C2]glucose (1-13C, fractional enrichment: 0.99; 6-13C, fractional enrichment: 0.97, Cambridge Isotope Labs, Andover, MA, USA). The scalp underneath the 13C transceiver coil was removed to eliminate any contamination of in vivo13C data from extracranial tissues. For each rat, intravenous infusion of [1,6-13C2]glucose was initiated approximately 1 h before in vivo13C magnetization transfer data acquisition. The infusion protocol consisted of an initial bolus of 110mg per kg per min of 0.75 mol/L [1,6-13C2]glucose followed by an approximately constantrate infusion of the same glucose solution at 42.8mg per kg per min. Arterial blood was sampled every 60 mins. Plasma glucose levels were maintained at 23±8 mmol/L. Other system physiologic parameters were maintained within the normal range throughout the 13C data acquisition period with few exceptions (pH = 7.35±0.04, pCO2=42±3mmHg, pO2 = 125±16mmHg, mean arterial blood pressure= 122±13mmHg, heart rate =404±29 bpm). End-tidal CO2 and tidal pressure of ventilation were also monitored. Body temperature was maintained at approximately 37.5°C using an external pump for water circulation (BayVoltex, Modesto, CA, USA).
In Vivo Nuclear Magnetic Resonance Spectroscopy
All experiments were performed on a Bruker 11.7 Tesla spectrometer interfaced to an 89-mm bore vertical magnet running on ParaVision 3.0.1 (Bruker Biospin, Billerica, MA, USA). An in-house transmit/receive concentric surface 13C (circular, diameter: 10 mm)/1H (octagonal, diagonal: 25mm) radiofrequency coil system was used. The radiofrequency coils were integrated to an animal handling system. Three-slice (coronal, horizontal, and sagittal) scout RARE images (FOV = 2.5 cm, slice thickness = 1mm, TR/TE = 200/15 ms, rare factor = 8, 128 × 128 data matrix) were acquired to position the integrated radiofrequency probe/animal handling system inside the Mini 0.5 gradient insert (Bruker Biospin, Billerica, MA, USA) so that the gradient isocenter was approximately 0 to 1mm posterior to bregma. B0 inhomogeneity in the rat brain was corrected using the FASTMAP/FLATNESS methods as described previously (Chen et al, 2004 and references therein). The 90° excitation, surface-coil-localized, interleaved acquisition method was used to measure the relayed 13C magnetization transfer effect between mitochondrial fumarate and cytosolic aspartate (Shen, 2005). A 1-ms adiabatic half-passage pulse was used for nonselective 90° 13C excitation, TR = 7.4 secs. The 13C carrier frequency was centered near aspartate C2 at 53.2 ppm. The WALTZ-4 sequence, based on a 400-µs nominal 90° rectangular pulse, was employed for proton decoupling. The decoupling pulse train was executed for a total of 106 ms. Broadband 1H-13C Nuclear Overhauser Enhancement was generated using a train of nonselective hard pulses with a nominal flip angle of 180° spaced 100 ms apart.
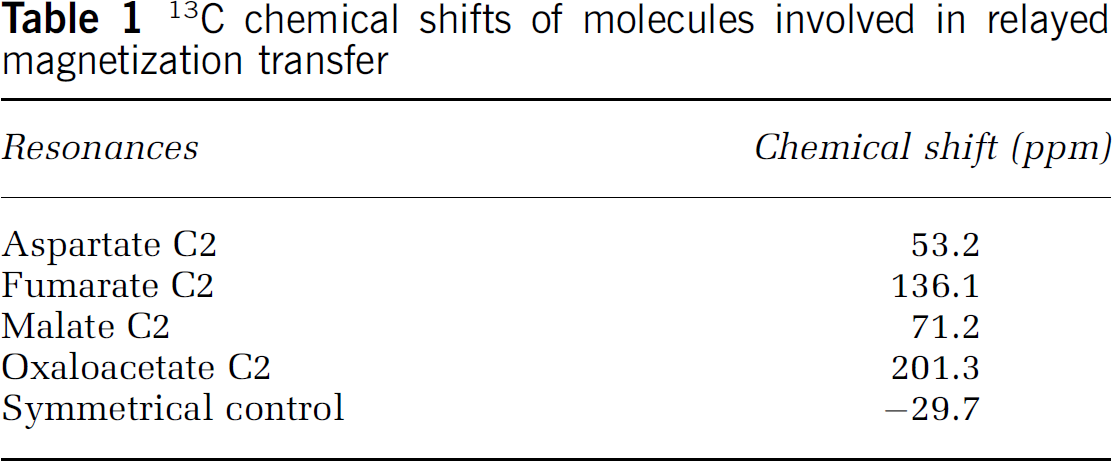
When the relayed 13C magnetization transfer spectra were acquired, fumarate C2 at 136.1ppm was saturated using a train of spectrally selective 2-ms Gaussian pulses with a nominal flip angle of 180° spaced 12 ms apart. The bandwidth of the Gaussian pulses is approximately 500 Hz (approximately 4 ppm). The duration of the Gaussian pulse train was 7.3 secs. When the control spectra were acquired, the saturating pulse train was placed at an equal spectral distance from aspartate C2 at 53.2ppm but on the opposite side of fumarate C2 (–29.7 ppm). The large separation of chemical shifts among fumarate, malate, oxaloacetate, and aspartate C2 carbons allowed radiofrequency saturation of the source molecule fumarate without affecting either the relay molecules malate and oxaloacetate or the target molecule aspartate (Table 1). The saturated and control spectra were interleaved every free induction decay. The rat brain was re-shimmed after every block of 256 pairs of fumarate-saturated and control spectra were acquired to maintain optimal B0 homogeneity. Data were zerofilled to 16K and apodized using a matched filter for maximum sensitivity (lb = 30 Hz) before Fourier transformation. The 13C signals in the 51 to 58ppm region were analyzed in the frequency domain using Gaussian–Lorentzian basis functions and the MATLAB curve-fitting toolbox (The Math-Works, Inc., Natick, MA, USA).
13C chemical shifts of molecules involved in relayed magnetization transfer
Resonances
Chemical shift (ppm)
Aspartate C2
53.2
Fumarate C2
136.1
Malate C2
71.2
Oxaloacetate C2
201.3
Symmetrical control
−29.7
Results
Detection of Relayed 13C Magnetization Transfer
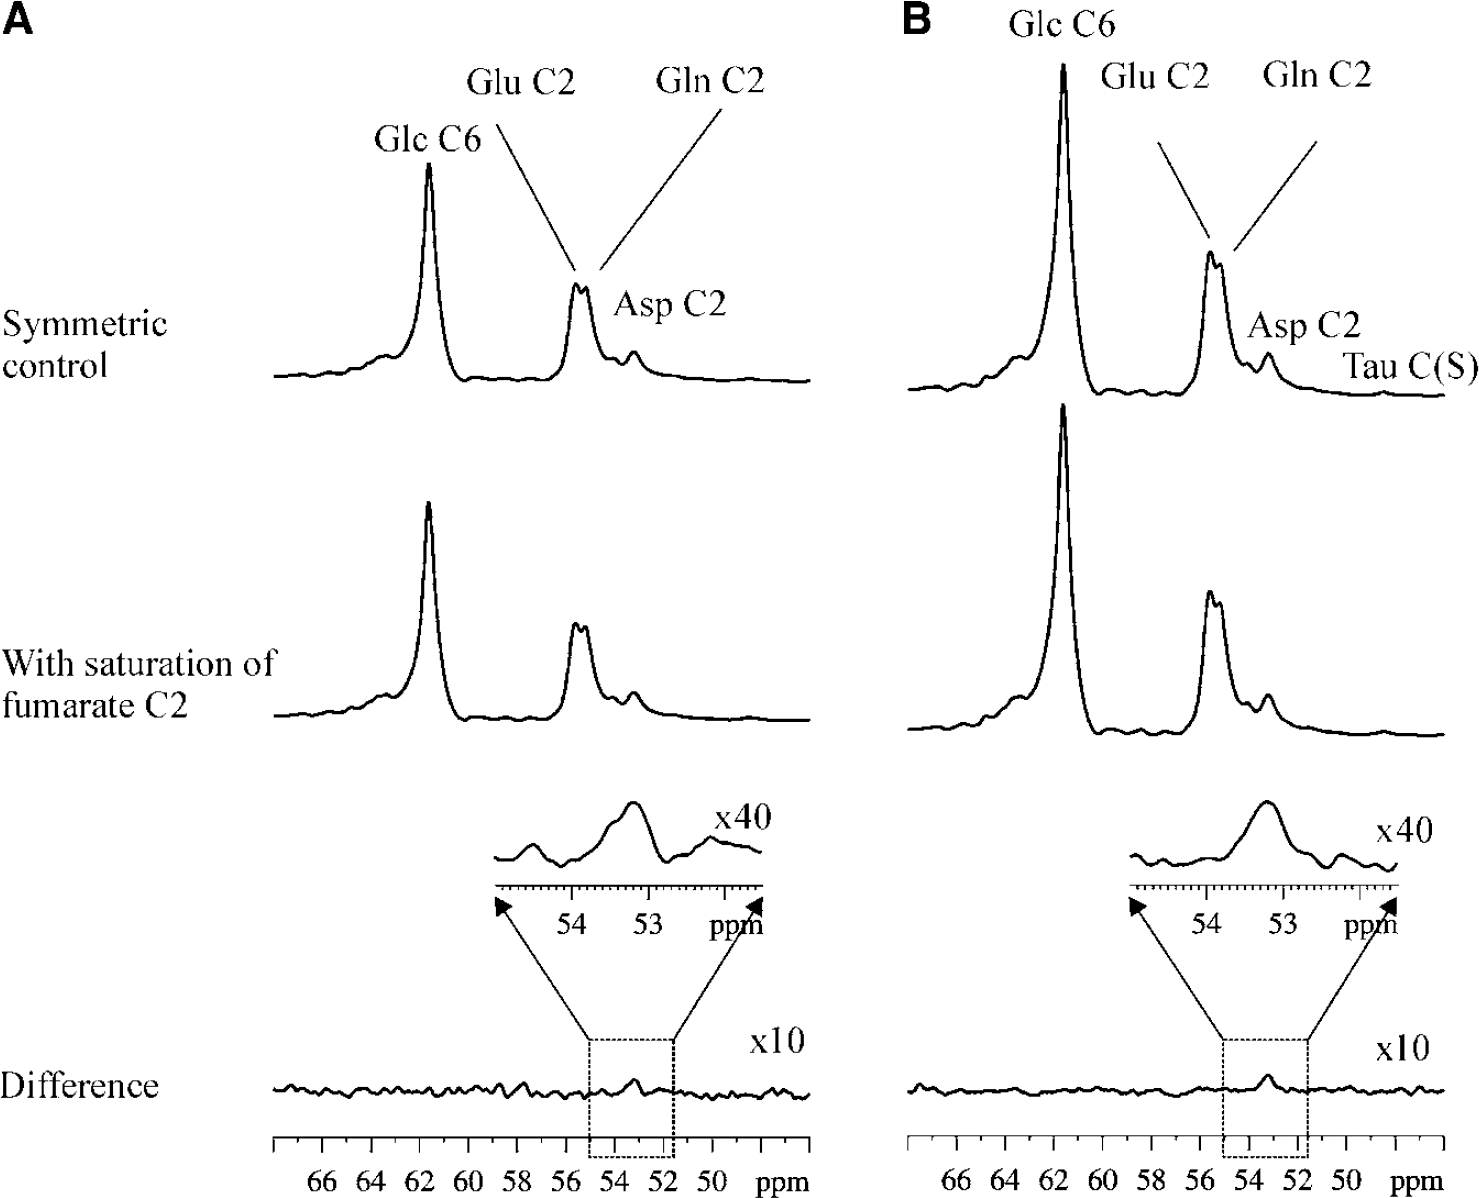
Figure 3A depicts in vivo relayed 13C magnetization transfer results from one rat. In the control spectrum, the Gaussian saturation pulse train was placed at −29.7ppm (NS = 256 × 5). In the displayed 46 to 68ppm region, the following peaks were observed as expected: α-glucose C6 at 61.7ppm, β-glucose C6 at 61.8 ppm, glutamate C2 at 55.2ppm, glutamine C2 at 55.1 ppm, N-acetylaspartate C2 at 54.0 ppm, and aspartate C2 at 53.2ppm. In the fumarate-saturated spectrum, the Gaussian saturation pulse train was placed at 136.1 ppm. In the difference spectrum, the relayed 13C magnetization effect on aspartate C2 at 53.2ppm was detected with low SNR. Figure 3B shows in vivo relayed 13C magnetization transfer results summed from eight rats. In the control spectrum and fumarate-saturated spectrum, each summed from eight rats, a small signal at 48.7ppm was observed after magnification of the 47 to 50ppm region and assigned to taurine (S-CH2) based on its known chemical shift position. In the difference spectrum summed from eight rats, a small but well-defined peak at the resonance frequency of aspartate C2 was clearly detected (Figure 3B). In comparison, the nearby and much more intense α-glucose C6, β-glucose C6, glutamate C2, glutamine C2, and N-acetylaspartate C2 resonances were completely cancelled in the difference spectrum. The small taurine S-CH2 signal at 48.7ppm was also cancelled in the difference spectrum. Because of the low signal-to-noise ratio in the individual rat results, only the spectra summed from eight rats (Figure 3B) were quantitatively analyzed. Using the MATLAB curve-fitting routine and the relayed magnetization transfer spectra summed from eight rats, ΔAsp/Asp0 was determined to be 4.2%, with a relative standard deviation of 15%. The relative standard deviation of ΔAsp/Asp0 was estimated by integrating the aspartate C2 signal and its neighboring spectral regions in the difference spectrum using the same interval length.
(A) In vivo relayed 13C magnetization transfer results from one rat. Top trace: control spectrum with the Gaussian saturation pulse train placed at −29.7 ppm (NS=256 × 5); middle trace: fumarate-saturated spectrum with the Gaussian saturation pulse train placed at 136.1 ppm (NS=256 × 5); bottom trace and inset: difference spectrum (NS=256 × 2 × 5=2,560, with a total data acquisition time of 5.3 h). (B) In vivo relayed 13C magnetization transfer results summed from eight rats. Top trace: control spectrum summed from eight rats (NS=256 × 5 × 8=10,240); middle trace: fumarate-saturated spectrum summed from eight rats (NS=10,240); bottom trace and inset: difference spectrum summed from eight rats (NS=10,240 × 2=20,480). Glc C6, α- and β-glucose C6; Glu C2, glutamate C2; Gln C2, glutamine C2; Asp C2, aspartate C2.
Calculation of Vx Using the Four-Site Exchange Model
Using fAsp=1–ΔAsp/Asp0 and fOxa/ = (fAspVAAT–Asp0 (1–fAsp)/T1Asp)/VAAT, fOxa/ = 84.7% was calculated. From fMal = (fOxa/(VAAT +VMDH)–fAspVAAT)/VMDH, fMal = 49.1%. Note that fAsp (95.8%) > fOxa/ (84.7%) > fMal (49.1%) > fFum (0%) because, contrary to intuition, in saturation transfer, the unidirectional flux from the observed spin to the saturated spin is measured. That is, because of the nature of the Bloch–McConnell equations, it is the transfer of unsaturated magnetization that is actually measured. In the case of the four-site exchange model depicted in Figure 2B, the unidirectional cytosolic aspartate → cytosolic oxaloacetate ↔ cytosolic malate → mitochondrial fumarate relay transfers unsaturated spins from cytosolic aspartate to mitochondrial fumarate. Thus, we have fAsp > fOxa/ > fMal > fFum. Also notably from Equation (1), the steady state aspartate magnetization (fAsp) is directly balanced by VAAT and fOxa/. The direct flux from Fum to Asp in the four-site exchange model does not appear in Equation (1), because it contributes fFumVx (= 0) to fAsp.
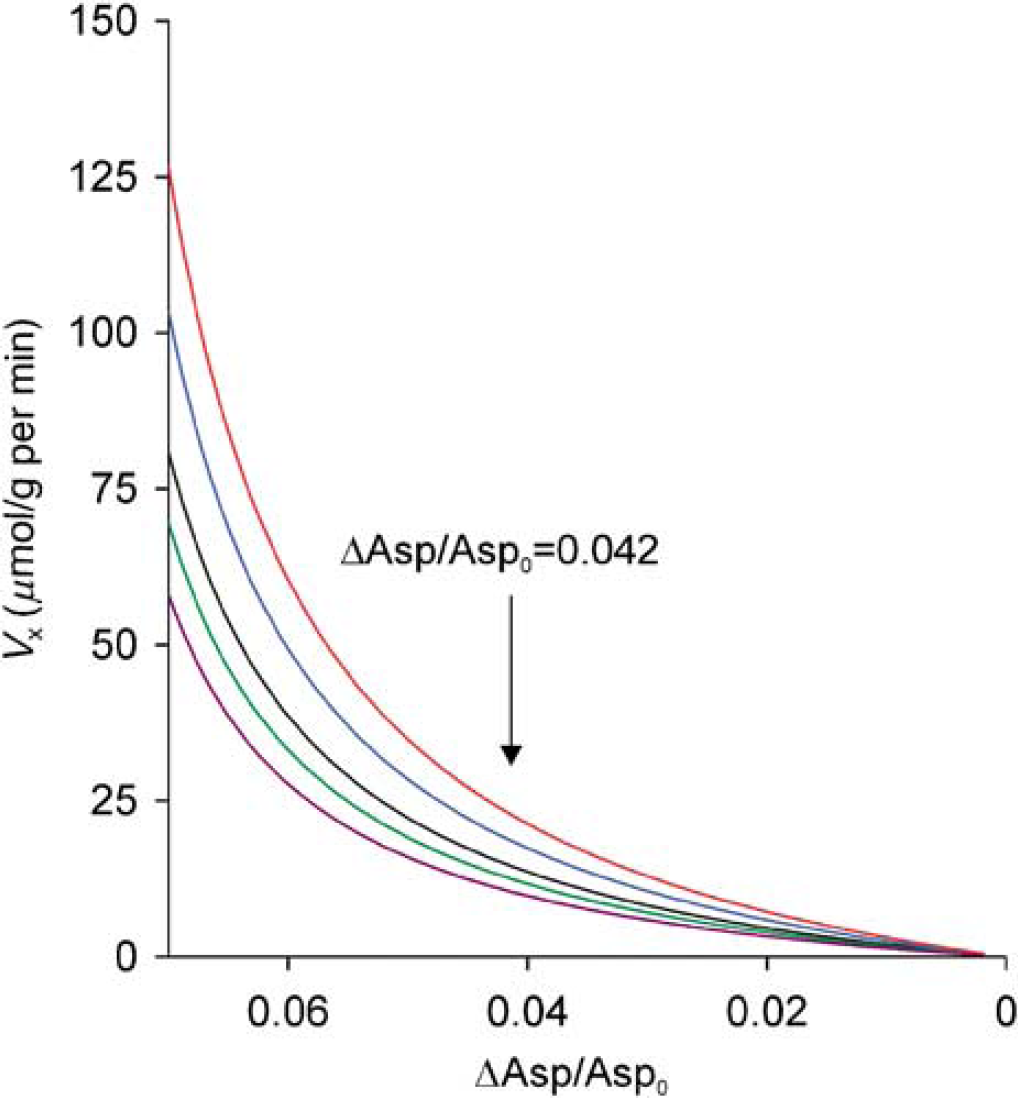
From Equation (4), Vx was estimated to be 13–19µmol per g per min for T1Mal=1.33–0.67 × T1Asp. For T1Mal=2.0–0.5 × T1Asp, Vx=11–23µmol per g per min. The sensitivity of Vx to changes in experimentally detected ΔAsp/Asp0 was plotted in Figure 4 for T1Mal=1.33–0.67 × T1Asp and T1Mal=2.0–0.5 × T1Asp. From Figure 4, if ΔAsp/Asp0 were half of the measured value (2.1%), then Vx=3.5–7.7µmol per g per min for T1Mal=2.0–0.5 × T1Asp.
Vx as a function of ΔAsp/Asp0 for T1Mal=0.5 × (red), 0.67 × (blue), 1.0 × (black), 1.33 × (green), and 2.0 × (purple) T1Asp calculated using Equation (4). The vertical arrow points to the experimentally determined ΔAsp/Asp0.
Discussion
The present study used recently discovered in vivo13C magnetization transfer effects to investigate Vx. Because of the exclusive localization of brain fumarase in mitochondria, it was possible to directly measure Vx from the four-carbon side of the TCA cycle. The results showed that Vx is much more rapid than VTCA.
Mechanisms of Isotopic Exchange Between Mitochondria and Cytosol
Nearly all TCA intermediates are transported out of and into mitochondria through a host of exchangers and co-transporters (Siesjo, 1978; Palmieri, 2004). Carriers such as aspartate/glutamate carrier and oxoglutarate carrier couple the exchange of glutamate between mitochondria and cytosol on the five/six carbon side of the TCA cycle to that of aspartate on the four-carbon side. In addition to the unidirectional aspartate/glutamate carrier depicted in Figure 2A, the reversible glutamate/hydroxyl carrier is also highly functional in brain mitochondria (Berkich et al, 2005). Likewise, other mitochondria–cytosol transport mechanisms involving four-carbon dicarboxylates exist in brain (Beck et al, 1977; Passarella et al, 1984; Palmieri, 2004). For example, the dicarboxylate carrier mediates an exchange between malate and phosphate ions across the mitochondrial inner membrane (Palmieri, 2004). In addition, the TCA cycle reactions occurring in the cytosol (i.e., reactions catalyzed by cytosolic TCA cycle enzymes) undoubtedly also contribute to the overall isotopic exchange between cytosol and mitochondria during infusion of 13C-labeled substrates. In metabolic models, the single-flux term denoted by Vx accounts for these exchange processes.
Previous Approaches to Investigating Vx
As noted earlier, attempts to assess the rate of 13C label exchange between mitochondria and cytosol extracted from metabolic modeling of 13C MRS measurement in human and animal brains have caused considerable controversy. If Vx is comparable to VTCA, VTCA will depend on Vx (Mason et al, 1992, 1995). The validity of regarding Vx as slow (VxEVTCA) or fast (Vx≫VTCA) has thus been vigorously debated, and the focus of this debate has been on metabolic modeling of 13C label incorporation into glutamate and aspartate for extraction of Vx.
Using metabolic modeling approaches to extract Vx is sensitive to small errors in the measurement of 13C labeling of glutamate C3 (Shen, 2006 and references therein). Furthermore, several factors in addition to Vx are known to affect the 13C labeling of glutamate C2 and C3, and therefore the accuracy of extracted Vx. For example, the exchange of other TCA intermediates between mitochondrial matrix and cytosol causes additional label dilution at glutamate C2 and C3 (Siesjo, 1978; Lapidot and Gopher, 1994; Shen, 2006). When the additional label dilution of glutamate C2 and C3 is not included in the model, slower than expected 13C label incorporation into glutamate C2 and C3 could be compensated by the metabolic model with an artificially slower Vx. Residual incomplete label scrambling at succinate and fumarate (Sherry et al, 1994), if significant in brain, would change the 13C label distribution between glutamate C2 and C3. Partial asymmetry generated by 13C entry through neuronal pyruvate carboxylase (Merle et al, 1996) also affects the labeling of glutamate C2 and C3.
Because of the controversies surrounding metabolic modeling of Vx, a fundamentally different approach is needed to shed light on this issue. Recently, the α-ketoglutarate–glutamate exchange across the mitochondrial inner membrane was measured in vitro using suspension of isolated rat brain mitochondria (Berkich et al, 2005). It was found that the efflux of combined α-ketoglutarate and glutamate from mitochondria is slower than the rate of synthesis of mitochondrial α-ketoglutarate. Unfortunately, many brain TCA cycle intermediates (e.g., oxaloacetate and α-ketoglutarate, both of which are crucial components of the malate-aspartate shuttle), are known to be rapidly depleted on death (Siesjo, 1978). Furthermore, using in vivo13C magnetization transfer spectroscopy, it was found that the exchange between glutamate and α-ketoglutarate in rat brain completely ceases on cardiac arrest (Shen, 2005). Therefore, caution is needed when extrapolating the results by Berkich et al (2005), which were obtained from isolated mitochondria, to in vivo conditions.
Conditions for Detecting Relayed 13C Magnetization Transfer Between Mitochondria and Cytosol
Aconitase, isocitrate dehydrogenase, citrate, and isocitrate reside both inside and outside mitochondria. As a result, separating the magnetization transfer between mitochondrial α-ketoglutarate/glutamate and cytosolic glutamate from that within the cytosol compartment becomes impossible. In addition, mitochondrial isocitrate dehydrogenase is one of the three control sites of the TCA cycle. The irreversible mitochondrial isocitrate → α-ketoglutarate flux rate is comparable to VTCA and is expected to cause considerable loss of saturation due to longitudinal relaxation if one attempts to relay magnetization saturation between mitochondrial isocitrate and cytosolic glutamate. Therefore, the relayed 13C magnetization transfer strategy is not suitable for measuring Vx from the five/six-carbon side of the TCA cycle.
The T1s of unprotonated carboxylic carbons of aspartate C1 at 175.0ppm and C4 at 178.3ppm are much longer than that of the protonated aspartate C2. In principle, they could be used to significantly increase the observed relayed 13C magnetization transfer effect. However, unlike the wide chemical shift separation that occurs among the C2 carbons of fumarate (136.1ppm), malate (71.2ppm), oxaloacetate (201.3 ppm), and aspartate (53.2ppm), the chemical shift separation among the carboxylic carbons is too small (oxaloacetate C1: 169.3ppm, C4: 175.4 ppm, malate C1 and C4: 181.8ppm, fumarate C1 and C4: 175.3ppm, aspartate C1: 175.0 ppm, C4: 178.3ppm) to avoid a radiofrequency spillover effect (Shen and Xu, 2006) and to generate the clean subtraction necessary for reliable detection of a small difference signal (Figure 3). Unlike the C3 carbons of malate, oxaloacetate, and aspartate, which are bonded with two protons, the C2 carbons are either nonprotonated or have only a single-bonded proton. The C3 carbons, therefore, have much shorter T1 (Wehrli, 1976). The cumulative effect of short C3 T1s can significantly reduce the efficiency of the 13C magnetization transfer relay and significantly weaken our assumption of negligible T1 relaxation inside mitochondria. Experimentally, the relay of magnetization transfer to aspartate C3 was found to be much smaller than to aspartate C2, and it was therefore not used to determine Vx. In addition, the relayed 13C magnetization transfer method cannot be used to trace the TCA cycle further upstream to succinate C2 at 35.0 ppm; the symmetrical control frequency would need to be placed at 71.7 ppm, very close to the resonant frequency of malate C2 at 71.2ppm, therefore interfering with the relay of magnetization saturation from the more remote succinate.
Fortunately, there exists a rare combination of favorable conditions that allowed for measuring Vx from the four-carbon side of the TCA cycle: (1) the control of the TCA cycle only involves citrate synthase, isocitrate dehydrogenase, and α-ketoglutarate dehydrogenase, whereas fumarase, malate dehydrogenase, and aspartate aminotransferase catalyze near equilibrium reactions. The forward and reverse rates of fumarase-, malate dehydrogenase-, and aspartate aminotransferase-catalyzed near equilibrium reactions are much greater than the TCA cycle flux through the reactions (Hawkins and Mans, 1983); (2) Fumarase is exclusively localized to mitochondria in brain. This allows isolation of the magnetization transfer relay pathway through Vx; and (3) the chemical shift separation among C2 carbons of fumarate, malate, oxaloacetate, and aspartate is unusually wide (Table 1). This large separation, attributed to the distinctly different chemical environments among the C2 carbons, allowed for the relay of 13C magnetization saturation between fumarate and aspartate without any radiofrequency interference. The completely lack of any radiofrequency spillover effect is necessary to reliably detect the small magnetization transfer effect on aspartate C2 at 53.2ppm in the presence of immense nearby signals such as glutamate C2 at 55.2ppm and glutamine C2 at 55.1 ppm.
Four-Site Versus Two-Site Exchange Models for Determining Vx
The mitochondrial pools of malate, oxaloacetate, and aspartate are very small (e.g., Mason et al, 1992; Gruetter et al, 2001; Wu et al, 2007). The linear exchange from fumarate to aspartate and back—catalyzed by fumarase, malate dehydrogenase, and aspartate aminotransferase in mitochondria—is therefore very rapid. Previous brain metabolic models considered these fast-exchanging mitochondrial pools as a single pool (e.g., Mason et al, 1992, 1995; Gruetter et al, 2001). When the turnover time constant due to exchange is much shorter than T1, loss of saturation of magnetization is negligible (Yang and Shen, 2007). In the present study, this allowed us to directly measure Vx using relayed magnetization transfer and to simplify the analysis of the relayed 13C magnetization transfer results by lumping the mitochondrial fumarate, malate, oxaloacetate, and aspartate pools into a single pool as shown in Figure 2B. Any loss of saturation inside mitochondria would underestimate Vx. Thus, using the simplified four-site exchange model in Figure 2B, the lower limit of Vx is obtained.
Quantitatively, if we also ignore T1 relaxation of the fast-exchanging malate and oxaloacetate extant in the cytosolic compartment, the four-site exchange model described in Figure 2B is reduced to the simpler two-site exchange model commonly used in metabolic modeling of 13C turnover kinetics for glutamate and aspartate (Figure 1). In this further simplified two-site exchange model, cytosolic aspartate is in exchange with TCA cycle intermediates with a flux rate of Vx'. Neither the pool size of cytosolic malate is negligibly small nor cytosolic VAAT and VMDH fluxes are infinitely fast. As a result, Vx' is smaller than that given by Equation (4) because loss of magnetization saturation through longitudinal relaxation in the cytosol is lumped into Vx'. Using this further simplified two-site exchange model as well as Equation (13) from Alger and Shulman (1984), we find that Vx' = ΔAsp/Asp0 × [Asp0]/T1Asp = 0.042 × 2.8 µmol/g/(2.2/60 min) = 3.2 µmol/g/min, while the actual Vx is greater than Vx'.
Comparison To VTCA
Under 1.5% (minimum alveolar concentration) isoflurane anesthesia, the VTCA of rat cerebral cortex is approximately 0.40 to 0.48 µmol per g per min (Maekawa et al, 1986). The results from this relayed 13C magnetization transfer experiment clearly demonstrate that Vx≫VTCA regardless of our assumptions of T1Mal. If Vx/VTCAE1, as argued by Gruetter et al (2001), the observed ΔAsp/Asp0 will have to be approximately 0.002 for T1Mal = 0.5 × T1Asp, and approximately 0.003 for T1Mal=2 × T1Asp (Figure 4). In either case, no relayed 13C magnetization transfer effect on aspartate is detectable when mitochondrial fumarate is saturated because of slow Vx.
Our fundamental conclusion that the isotopic exchange between mitochondrial TCA cycle intermediates and cytosolic metabolites is rapid is also independent of specific exchange models used for analyzing the relayed 13C magnetization transfer data; this is because Vx has to be fast enough on the time scale of 13C T1 relaxation to be detectable using magnetization transfer spectroscopy. That is, for an exchange process to be detectable using magnetization transfer, the exchange rate multiplied by T1 of the observed signal has to be a significant fraction of the pool size of the observed signal. If Vx'EVTCA, Vx' × T1Asp≈0.44 µmol per g per min × 2.2/60 min = 0.016 µmol/g, or less than 0.6% of the pool size of aspartate.
Conclusion
The absence of fumarase in brain cytosol, the rapid near equilibrium reactions catalyzed by fumarase, malate dehydrogenase, and aspartate aminotransferase, and the wide chemical shift separation among C2 carbons of fumarate, malate, oxaloacetate, and aspartate allowed for the relay of 13C magnetization saturation between mitochondria fumarate and cytosolic aspartate through Vx. We found that this relay was significant and detectable using in vivo13C magnetization transfer spectroscopy after extensive signal averaging. Quantitative analysis of the in vivo13C magnetization transfer data showed that Vx is fast (i.e., Vx≫VTCA).
Footnotes
Acknowledgements
The authors thank Mr Christopher S Johnson for technical assistance, and Ms Ioline Henter for help with preparation of the manuscript. This work is supported by the Intramural Research Program of the NIH, NIMH.
The authors have no duality of interest.
References
1.
AkibaTHiragaKTuboiS (1984) Intracellular distribution of fumarase in various animals. J Biochem96:189–95
2.
AlgerJRShulmanRG (1984) NMR studies of enzymatic rates in vitro and in vivo by magnetization transfer. Q Rev Biophys17:83–124
3.
BeckDPBroylesJLVon KorffRW (1977) Role of malate transport in regulating metabolism in mitochondria isolated from rabbit brain. J Neurochem29:487–93
4.
BerkichDAXuYLaNoueKFGruetterRHutsonSM (2005) Evaluation of brain mitochondrial glutamate and alpha-ketoglutarate transport under physiologic conditions. J Neurosci Res79:106–13
5.
BlümlSMorenoAHwangJHRossBD (2001) 1-13C glucose magnetic resonance spectroscopy of pediatric and adult brain disorders. NMR Biomed14:19–32
6.
ChanceEMSeeholzerSHKobayashiKWilliamsonJR (1983) Mathematical analysis of isotope labeling in the citric acid cycle with applications to 13C NMR studies in perfused rat hearts. J Biol Chem258:13785–94
7.
ChenZLiSSYangJLetiziaDShenJ (2004) Measurement and automatic correction of high-order B0 inhomogeneity in the rat brain at 11.7 Tesla. Magn Reson Imaging22:835–42
8.
ChhinaNKuestermannEHallidayJSimpsonLJMacdonaldIABachelardHSMorrisPG (2001) Measurement of human tricarboxylic acid cycle rates during visual activation by 13C magnetic resonance spectroscopy. J Neurosci Res66:737–46
9.
de GraafRABrownPBMasonGFRothmanDLBeharKL (2003) Detection of [1,6-13C2]-glucose metabolism in rat brain by in vivo1H-[13C]-NMR spectroscopy. Magn Reson Med49:37–46
10.
de GraafRAMasonGFPatelABRothmanDLBeharKL (2004) Regional glucose metabolism and glutamatergic neurotransmission in rat brain in vivo. Proc Natl Acad Sci USA101:12700–5
11.
GruetterRSeaquistERUgurbilK (2001) A mathematical model of compartmentalized neurotransmitter metabolism in the human brain. Am J Physiol Endocrinol Metab281:E100–12. Erratum in: Am J Physiol Endocrinol Metab286: E320
12.
HawkinsRAMansAM (1983) Intermediary metabolism of carbohydrates and other fuels. In: Handbook of neurochemistry (LajthaA, ed), 2nd ed.New York: Plemun Press, 259–94
13.
KoenALGoodmanM (1969) Aconitate hydratase isozymes: subcellular location, tissue distribution and possible subunit structure. Biochim Biophys Acta191:698–701
14.
LaiCKClarkJB (1989) Isolation and characterization of synaptic and nonsynaptic mitochondria from mammalian brain. In: Carbohydrates and energy metabolism (BoultonAABakerGBButterworthRF, eds), Clifton, NJ: Humana Press, 43–98
15.
LapidotAGopherA (1994) Cerebral metabolic compartmentation. Estimation of glucose flux via pyruvate carboxylase/pyruvate dehydrogenase by 13C NMR isotopomer analysis of D-[U-13C]glucose metabolites. J Biol Chem269:27198–208
16.
LeibfritzDDreherW (2001) Magnetization transfer MRS. NMR Biomed14:65–76
17.
LeongSFClarkJB (1984) Regional enzyme development in rat brain. Enzymes of energy metabolism. Biochem J218:139–45
18.
MaekawaTTommasinoCShapiroHMKeifer-GoodmanJKohlenbergerRW (1986) Local cerebral blood flow and glucose utilization during isoflurane anesthesia in the rat. Anesthesiology65:144–51
19.
MasonGFRothmanDLBeharKLShulmanRG (1992) NMR determination of the TCA cycle rate and alpha-ketoglutarate/glutamate exchange rate in rat brain. J Cereb Blood Flow Metab12:434–47
20.
MasonGFGruetterRRothmanDLBeharKLShulmanRGNovotnyEJ (1995) Simultaneous determination of the rates of the TCA cycle, glucose utilization, alpha-ketoglutarate/glutamate exchange, and glutamine synthesis in human brain by NMR. J Cereb Blood Flow Metab15:12–25
21.
MerleMMartinMVillégierACanioniP (1996) Mathematical modelling of the citric acid cycle for the analysis of glutamine isotopomers from cerebellar astrocytes incubated with [1–13C]glucose. Eur J Biochem239:742–51
22.
MorenoARossBDBlümlS (2001) Direct determination of the N-acetyl-L-aspartate synthesis rate in the human brain by 13C MRS and [1–13C]glucose infusion. J Neurochem77:347–50
23.
PalmieriF (2004) The mitochondrial transporter family (SLC25): physiological and pathological implications. Eur J Physiol447:689–709
24.
PassarellaSBarileMAtlanteAQuagliarielloE (1984) Oxaloacetate uptake into rat brain mitochondria and reconstruction of the malate/oxaloacetate shuttle. Biochem Biophys Res Commun119:1039–46
25.
PatelABde GraafRAMasonGFKanamatsuTRothmanDLShulmanRGBeharKL (2004) Glutamatergic neurotransmission and neuronal glucose oxidation are coupled during intense neuronal activation. J Cereb Blood Flow Metab24:972–85
26.
RodriguesTBCerdanS (2006) The cerebral tricarboxylic acid cycles. In: Handbook of Neurochemistry and Molecular Neurobiology (LajthaAGibsonGEDienelGA, eds), Berlin: Springer-Verlag, 63–91
27.
ShenJ (2005) In vivo carbon-13 magnetization transfer effect. Detection of aspartate aminotransferase reaction. Magn Reson Med54:1321–6. Erratum in: Magn Reson Med 2006, 55:713
28.
ShenJ (2006) 13C magnetic resonance spectroscopy studies of alterations in glutamate neurotransmission. Biol Psychiatry59:883–7
29.
ShenJPetersenKFBeharKLBrownPNixonTWMasonGFPetroffOAShulmanGIShulmanRGRothmanDL (1999) Determination of the rate of the glutamate/glutamine cycle in the human brain by in vivo13C NMR. Proc Natl Acad Sci USA96:8235–40
30.
ShenJXuS (2006) Theoretical analysis of carbon-13 magnetization transfer for in vivo exchange between alpha-ketoglutarate and glutamate. NMR Biomed19:248–54
31.
SherryADSumegiBMillerBCottamGLGavvaSJonesJGMalloyCR (1994) Orientation-conserved transfer of symmetric Krebs cycle intermediates in mammalian tissue. Biochem33:6268–75
32.
SiesjoBK (1978) Brain energy metabolism. Chichester: John Wiley & Sons
33.
SolsAMarcoR (1970) Concentrations of metabolites and binding sites. Implications in metabolic regulation. In: Current Topics in Cellular RegulationVol 2 (HoreckerBLStadtmanER, eds), New York: Academic Press, 227–73
34.
WehrliFW (1976) Organic structure assignments using 13C spin-relaxation data. In: Topics in Carbon-13 NMR SpectroscopyVol. 2 (LevyGC, ed), New York: John Wiley & Sons, 343–89
35.
WuFYangFVinnakotaKCBeardDA (2007) Computer modeling of mitochondrial tricarboxylic acid cycle, oxidative phosphorylation, metabolite transport, and electrophysiology. J Biol Chem282:24525–37
36.
XuSYangJShenJ (2008) Measuring N-acetylaspartate synthesis in vivo using proton magnetic resonance spectroscopy. J Neurosci Methods172:8–12
37.
YangJLiCQShenJ (2005) In vivo detection of cortical GABA turnover from intravenously infused [1-13C]D-glucose. Magn Reson Med53:1258–67
38.
YangJShenJ (2005) In vivo evidence for reduced cortical glutamate-glutamine cycling in rats treated with the antidepressant/antipanic drug phenelzine. Neuroscience135:927–37
39.
YangJShenJ (2007) Relayed 13C magnetization transfer: detection of malate dehydrogenase reaction in vivo. J Magn Reson184:344–9